TransCanada Results Beat Expectations; Company Raises Dividend
February 16 2017 - 8:47AM
Dow Jones News
By Anne Steele
TransCanada Corp. posted a loss Thursday for its latest quarter
on a hefty charge related to the sale of its Northeast U.S.
renewable power generation business.
Results, however, came in better than Wall Street expectations,
and the company also raised its quarterly dividend 11% to 62.5
Canadian cents per share.
For the three months ended Dec. 31, the company recorded a net
loss of 358 million Canadian dollars, or 43 Canadian cents a share,
compared with a loss of C$2.5 billion, or C$3.47 a share, in the
year-earlier period. TransCanada attributed the loss to a C$870
million write-down related to the sale of the U.S. Northeast power
business.
Excluding that charge and other items, adjusted earnings rose to
75 Canadian cents per share from 64 Canadian cents for the same
period in 2015. Revenue surged 27% to C$3.62 billion. Analysts
polled by Thomson Reuters had expected an adjusted 72 Canadian
cents a share on C$3.5 billion in revenue.
Earlier this month, the Trump administration gave a final green
light to the controversial Dakota Access Pipeline -- which
TransCanada owns -- fulfilling a campaign pledge to boost energy
projects but infuriating activists fighting the project.
The U.S. Army Corps of Engineers, an agency of the Department of
the Army, said in court filings that the department was planning to
issue an outstanding easement under a river in North Dakota that
was holding up construction of the oil pipeline. The department
also notified Congress of its intent in a separate letter.
The project, which has faced intense opposition from Native
American tribes and environmental groups, would cross nearly 1,200
miles and carry as many as 570,000 barrels of oil a day from North
Dakota to Illinois.
Write to Anne Steele at Anne.Steele@wsj.com
(END) Dow Jones Newswires
February 16, 2017 09:32 ET (14:32 GMT)
Copyright (c) 2017 Dow Jones & Company, Inc.
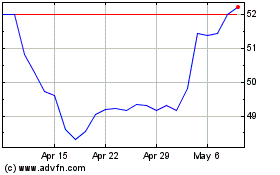
TC Energy (TSX:TRP)
Historical Stock Chart
From Mar 2024 to Apr 2024

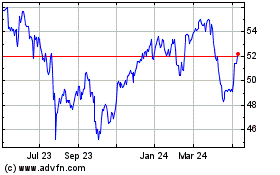
TC Energy (TSX:TRP)
Historical Stock Chart
From Apr 2023 to Apr 2024
