UNITED STATES
SECURITIES AND EXCHANGE COMMISSION
Washington, D.C. 20549
FORM 6-K
Report of Foreign Private Issuer
Pursuant to Rule 13a-16 or 15d-16
under the Securities Exchange Act of 1934
For April 2018
Commission File Number: 1-34513
CENOVUS ENERGY INC.
(Translation of registrant’s name into English)
2600, 500 Centre Street S.E.
Calgary, Alberta, Canada T2G 1A6
(Address of principal executive office)
Indicate by check mark whether the registrant files or will file annual reports under cover of Form 20-F or Form 40-F.
Form 20-F ☐ Form 40-F ☒
Indicate by check mark if the registrant is submitting the Form 6-K in paper as permitted by Regulation S-T Rule 101(b)(1): ☐
Indicate by check mark if the registrant is submitting the Form 6-K in paper as permitted by Regulation S-T Rule 101(b)(7): ☐
Exhibit 99.2, 99.3 and 99.4 to this report, furnished on Form 6-K, shall be incorporated by reference into or as an exhibit to, as applicable, each of the registrant’s Registration Statements under the Securities Act of 1933: Form S-8 (File No. 333-163397), Form F-3D (File No. 333-202165), and Form F-10 (File No. 333-220700).
DOCUMENTS FILED AS PART OF THIS FORM 6-K
See the Exhibit Index to this Form 6-K.
Pursuant to the requirements of the Securities Exchange Act of 1934, the registrant has duly caused this report to be signed on its behalf by the undersigned, thereunto duly authorized.
Date: April 25, 2018
|
|
|
|
CENOVUS ENERGY INC. |
|
|
|
|
|
|
(Registrant) |
|
|
|
|
|
By: |
|
/s/ Elizabeth A. McNamara |
|
|
||
|
|
|
|
|
Name: |
|
Elizabeth A. McNamara |
|
|
|
|
|
|
|
Title: |
|
Assistant Corporate Secretary |
|
|
|
Exhibit No. |
|
|
|
|
|
|
|
99.1 |
|
News Release dated April 25, 2018 |
|
|
|
|
|
99.2 |
|
Management’s Discussion and Analysis dated April 24, 2018 for the period ended March 31, 2018 |
|
|
|
|
|
99.3 |
|
Interim Consolidated Financial Statements (unaudited) for the period ended March 31, 2018 |
|
|
|
|
|
99.4 |
|
Supplemental Financial Information (unaudited) – Consolidated Interest Coverage Ratios Exhibit to March 31, 2018 Interim Consolidated Financial Statements |
|
|
|
|
|
99.5 |
|
Form 52-109F2 Full Certificate, dated April 25, 2018, of Alex J. Pourbaix, President & Chief Executive Officer |
|
|
|
|
|
99.6 |
|
Form 52-109F2 Full Certificate, dated April 25, 2018, of Ivor M. Ruste, Executive Vice-President & Chief Financial Officer |
Cenovus delivers strong first quarter operational performance
Financial results impacted by hedging and price differentials
Calgary, Alberta (April 25, 2018) – Cenovus Energy Inc. (TSX: CVE) (NYSE: CVE) had continued strong operational performance from its oil sands projects and Deep Basin natural gas assets in the first quarter of 2018. The company’s quarterly financial results were impacted by risk management losses, wider light-heavy oil differentials and planned refinery maintenance. As previously announced, Cenovus responded to the wider price differentials and transportation constraints by temporarily slowing oil sands production in February and March and storing excess barrels in its reservoirs. The company ramped oil sands production back up to normal levels after Western Canadian Select (WCS) prices improved. Cenovus also made good progress with its drilling program in the Deep Basin in the quarter.
First quarter highlights
|
|
• |
Oil sands volumes nearly doubled compared with the same period a year earlier as a result of Cenovus’s May 2017 asset acquisition |
|
|
• |
Deep Basin unit operating costs decreased 18% from the third quarter of 2017, Cenovus’s first full quarter of ownership of the assets |
|
|
• |
Oil sands unit operating costs declined slightly from the first quarter of 2017 |
|
|
• |
Major planned turnarounds at the Wood River and Borger refineries were carried out over several weeks during the quarter and were completed in April |
|
|
• |
The company incurred realized risk management losses of $469 million |
|
Financial & production summary |
||
|
(for the period ended March 31)
|
2018 Q1 |
2017 Q1 |
|
Financial ($ millions, except per share amounts) |
|
|
|
Cash from operating activities1 |
-123 |
328 |
|
Adjusted funds flow1,2 |
-41 |
323 |
|
Per share diluted |
-0.03 |
0.39 |
|
Free funds flow1,2 |
-565 |
10 |
|
Operating earnings (loss) from continuing operations2 |
-752 |
-39 |
|
Per share diluted |
-0.61 |
-0.05 |
|
Net earnings (loss) from continuing operations |
-914 |
211 |
|
Per share diluted |
-0.74 |
0.25 |
|
Capital investment1 |
524 |
313 |
|
Production from continuing operations3 (before royalties) |
|
|
|
Oil sands (bbls/d) |
359,666 |
181,501 |
|
Deep Basin liquids4 (bbls/d) |
35,479 |
- |
|
Total liquids from continuing operations (bbls/d) |
395,145 |
181,501 |
|
Total natural gas from continuing operations (MMcf/d) |
553 |
15 |
|
Total production from continuing operations (BOE/d)5 |
487,464 |
184,001 |
1 Includes results from Cenovus’s legacy conventional segment, which has been classified as a discontinued operation.
2 Adjusted funds flow, free funds flow and operating earnings/loss are non-GAAP measures. See Advisory.
3 Does not include production from Cenovus’s legacy conventional oil and natural gas assets, the last of which was sold as of January 5, 2018. The legacy conventional segment has been classified as a discontinued operation.
4 Includes oil and natural gas liquids (NGLs).
5 Totals may not add due to rounding.
|
CENOVUS ENERGY |
Page |
Q1 2018 |
|
First quarter overview
Financial highlights
In the first quarter of 2018, Cenovus had a shortfall in cash from operating activities of $123 million compared with a surplus of $328 million in the same period a year earlier, and a shortfall in adjusted funds flow of $41 million, compared with a surplus of $323 million in 2017. Operating loss from continuing operations was $752 million compared with a $39 million loss the previous year.
Financial results were affected by realized risk management losses, the widest light-heavy oil price differentials experienced since the fourth quarter of 2013, planned turnarounds at the company’s two jointly owned U.S. refineries and an impairment on some assets in the Deep Basin.
“The challenges we experienced in the first quarter had a significant impact on our financial results, but the underlying performance of our assets remains very strong,” said Alex Pourbaix, Cenovus President & Chief Executive Officer. “I want to stress that these financial challenges are temporary and don’t reflect Cenovus’s significant potential for funds flow and earnings growth.”
Cenovus incurred realized risk management losses from continuing operations of $469 million compared with losses of $79 million in the same quarter a year earlier. Following the company’s May 2017 asset acquisition, Cenovus had increased leverage and was in the process of marketing its legacy conventional oil and natural gas assets to streamline its portfolio and reduce debt. The company hedged approximately 80% of its forecast oil production for the first half of 2018 to support financial resilience by establishing downside protection at a time when commodity prices were lower and the timing and amount of proceeds from planned divestitures were uncertain. This was the main contributor to the realized risk management losses in the quarter as benchmark prices exceeded Cenovus’s contract prices.
At the end of the second quarter, a portion of Cenovus’s 2018 risk management contracts will expire, reducing the company’s hedge position to approximately 37% of forecast oil production for the second half of the year. As of March 31, 2018, the company had 19,000 barrels per day (bbls/d) of West Texas Intermediate (WTI) hedged for 2019 using collars that provide downside price protection while allowing Cenovus opportunity to capture some of the benefit in a rising price environment.
During the first quarter of 2018, transportation constraints resulted in light-heavy oil price differentials averaging US$24.28/bbl, 67% wider compared with the same period in 2017. This contributed to reduced netbacks at the company’s oil sands operations. Companywide netbacks from continuing operations, before realized risk management losses, averaged $16.80 per barrel of oil equivalent (BOE) in the first quarter of 2018 compared with $21.25 in the same period a year earlier. Cenovus continues to mitigate its exposure to heavy oil price discounts through its downstream integration, pipeline commitments to the U.S. Gulf Coast and Canadian West Coast and rail optionality including the company’s Bruderheim crude-by-rail terminal as well as through financial contracts on the WCS differential.
|
CENOVUS ENERGY |
Page |
Q1 2018 |
|
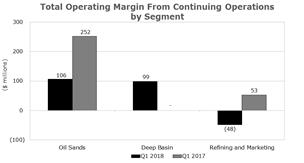
At Cenovus’s jointly owned Wood River and Borger refineries in the U.S., the operator carried out major planned turnarounds over several weeks during the first quarter. As a result, Cenovus recorded a shortfall in refining and marketing operating margin of $48 million for the quarter, compared with operating margin of $53 million in the same period of 2017. Cenovus’s refining operating margin is calculated on a first-in, first-out (FIFO) inventory accounting basis. Using the last-in, first-out (LIFO) accounting method employed by most U.S. refiners, the shortfall in operating margin from refining and marketing would have been $69 million in the first quarter of 2018.
As at the end of the first quarter, Cenovus determined that the carrying value of its Clearwater assets in the Deep Basin exceeded their recoverable amount due to a decline in forward natural gas prices. This resulted in a non-cash impairment charge of $100 million in the quarter.
Cost reductions
Cenovus continues to make progress in reducing the company’s capital investment costs and operating and general and administrative (G&A) expenses. This includes the company’s previously announced plan to reduce its workforce by approximately 15% from 2017 levels, which is now largely complete.
Cenovus continues to achieve greater operational and capital efficiencies by drilling longer horizontal wells in the oil sands and using multi-well pad development in the Deep Basin. Previous improvements to electric submersible pumps at the company’s oil sands operations have resulted in longer pump life and reduced workover costs. Lower decline rates and better performance from new well pads at Cenovus’s oil sands facilities have allowed the company to optimize timing of wells and capital investment, further reducing costs. In the Deep Basin, optimization of maintenance and integrity programs lowered repair and maintenance expenses. Additional per-barrel operating cost reductions are expected to come with further optimization of maintenance scheduling.
Cenovus had first quarter G&A costs of $179 million, compared with $43 million in the same period in 2017. The increase was primarily due to one-time severance costs of $43 million and a $59 million non-cash expense for Calgary office space that exceeds current needs. Cenovus continues to pursue an active subleasing program to offset some of its real estate costs.
Divestitures and deleveraging
In January 2018, Cenovus closed the sale of its Suffield assets for gross cash proceeds of $512 million. With the closing of the Suffield sale, the company completed its plan, announced in 2017, to divest its legacy conventional business.
To further streamline its portfolio, reduce debt and increase shareholder value, the company continues to review potential divestitures of non-core assets in the Deep Basin. Cenovus has one of the largest land positions in the Deep Basin, with approximately three million net acres, providing more opportunities than the company can efficiently develop within a reasonable timeframe. The company continues to make progress with its previously announced plan to sell assets with current production of approximately 15,000 BOE/d of natural gas and liquids in the Clearwater area of the Deep Basin.
|
CENOVUS ENERGY |
Page |
Q1 2018 |
|
Oil sands
Cenovus’s oil sands projects continued to deliver strong operational performance in the first quarter of 2018. However, due to market access challenges, the company decided to temporarily slow production at Christina Lake and Foster Creek in February and March.
“After a strong operational start to the quarter, we took prudent steps to reduce production volumes in response to wider light-heavy differentials, export pipeline capacity constraints and the slow pace of ramp up in oil-by-rail capacity,” said Pourbaix. “When Canadian heavy oil is selling at a wide discount to WTI, we have the ability to slow our oil sands production while maintaining steam injection to mobilize the oil. We can then store that mobilized oil in our reservoirs to be produced and sold at a later date when pipeline capacity improves and differentials narrow.”
To help address these ongoing market access challenges, Cenovus is working with rail providers to resolve a shortage of locomotive hauling capacity so that the company can more fully realize the benefits of its Bruderheim crude-by-rail facility. Cenovus expects overall industry rail access to improve starting in the second half of the year. Should rail capacity improvements take longer than expected, or pipeline capacity tighten again, the company may take further steps to defer production which could result in fluctuating production volumes from month to month.
As a result of the temporary oil sands production decrease in the first quarter, Foster Creek’s steam to oil ratio (SOR) – the amount of steam needed to produce one barrel of oil – rose to 2.8 for the period. As market access improved in late March and April, Cenovus ramped oil sands production back up to take advantage of improved pricing. At Christina Lake, the SOR remained unchanged year over year at an industry leading 1.8. The company expects SORs to remain within full-year guidance of 2.6 to 3.0 at Foster Creek and 1.8 to 2.2 for Christina Lake in 2018.
Combined production at Christina Lake and Foster Creek was 359,666 bbls/d during the quarter, nearly double the volume from the same period a year earlier. The increase was due to the company’s May 2017 acquisition, which resulted in Cenovus taking full ownership of its oil sands assets. Oil sands operating expenses were $8.78/bbl, 2% lower than in the first quarter of 2017. Cenovus continues to expect full-year oil sands volumes for 2018 to be within its guidance range of 364,000 to 382,000 bbls/d.
Construction at the Christina Lake phase G expansion, which resumed in the first quarter of 2017, continues to progress on time and on budget. Cenovus expects the expansion will have go-forward capital costs, from the time the project was restarted last year through to completion, of between $13,000 and $14,000 per flowing barrel compared with the company’s previous estimate of between $16,000 and $18,000. Phase G has approved capacity of 50,000 bbls/d.
Deep Basin
To date, Cenovus is pleased with its Deep Basin program and initial well results have met or exceeded the company’s expectations. First quarter production averaged 127,056 BOE/d, with average operating costs of $7.36/BOE, an 18% reduction from the third quarter of 2017, Cenovus’s first full quarter of ownership of the assets. While the company is
|
CENOVUS ENERGY |
Page |
Q1 2018 |
|
encouraged by the drilling and production results, Cenovus continues to take a disciplined approach to development in the Deep Basin in response to lower natural gas prices. During the quarter, the company substantially completed its 2018 Deep Basin capital investment program, bringing 17 wells on production, completing 16 wells and adding additional pipeline infrastructure, and drilling 14 horizontal wells targeting liquids-rich natural gas.
Downstream
In the first quarter of 2018, the Wood River and Borger refineries, which Cenovus jointly owns with the operator, underwent planned maintenance activity, including the first major turnaround at the Wood River Coker and Refinery Expansion (CORE) project since it was completed in 2011. The maintenance programs were completed in April, and both refineries have since returned to planned operating levels.
New CFO appointed
Earlier this month, Cenovus announced the appointment of Jon McKenzie as the company’s next Chief Financial Officer, who in addition to his financial background brings a broad range of energy industry experience spanning operations, supply, trading and commercial activities related to pipelines, rail and terminal operations. He will succeed Ivor Ruste, who, as previously announced, is retiring on April 30.
Dividend
For the second quarter of 2018, the Board of Directors has declared a dividend of $0.05 per share, payable on June 29, 2018 to common shareholders of record as of June 15, 2018. Based on the April 24, 2018 closing share price on the Toronto Stock Exchange of $12.19, this represents an annualized yield of about 2%. Declaration of dividends is at the sole discretion of the Board and will continue to be evaluated on a quarterly basis.
|
Conference Call Today 9 a.m. Mountain Time (11 a.m. Eastern Time) Cenovus will host a conference call today, April 25, 2018, starting at 9 a.m. MT (11 a.m. ET). To participate, please dial 888-231-8191 (toll-free in North America) or 647-427-7450 approximately 10 minutes prior to the conference call. A live audio webcast of the conference call will also be available via cenovus.com. The webcast will be archived for approximately 90 days. |
ADVISORY
Basis of Presentation – Cenovus reports financial results in Canadian dollars and presents production volumes on a net to Cenovus before royalties basis, unless otherwise stated. Cenovus prepares its financial statements in accordance with International Financial Reporting Standards (IFRS).
Barrels of Oil Equivalent – Natural gas volumes have been converted to barrels of oil equivalent (BOE) on the basis of six thousand cubic feet (Mcf) to one barrel (bbl). BOE may be misleading, particularly if used in isolation. A conversion ratio of one bbl to six Mcf is based on an energy equivalency conversion method primarily applicable at the burner tip and does not represent value equivalency at the wellhead. Given that the value ratio based on the current price of crude oil compared with natural gas is significantly different from the energy equivalency conversion ratio of 6:1, utilizing a conversion on a 6:1 basis is not an accurate reflection of value.
|
CENOVUS ENERGY |
Page |
Q1 2018 |
|
Non-GAAP Measures and Additional Subtotal
This news release contains references to adjusted funds flow, free funds flow, operating earnings (loss), net debt, net debt to adjusted EBITDA, and netback, which are non-GAAP measures, and operating margin, which is an additional subtotal found in Note 1 of Cenovus's Interim Consolidated Financial Statements (unaudited) for the period ended March 31, 2018 (available on SEDAR at sedar.com, on EDGAR at sec.gov and Cenovus's website at cenovus.com). These measures do not have a standardized meaning as prescribed by IFRS. Readers should not consider these measures in isolation or as a substitute for analysis of the company's results as reported under IFRS. These measures are defined differently by different companies and therefore are not comparable to similar measures presented by other issuers. For definitions, as well as reconciliations to GAAP measures, and more information on these and other non-GAAP measures and additional subtotals, refer to “Non-GAAP Measures and Additional Subtotals” and the Advisory section of Cenovus's Management's Discussion & Analysis (MD&A) for the period ended March 31, 2018 (available on SEDAR at sedar.com, on EDGAR at sec.gov and Cenovus's website at cenovus.com).
Forward-looking Information
This news release contains certain forward-looking statements and forward-looking information (collectively referred to as “forward-looking information”) within the meaning of applicable securities legislation, including the United States Private Securities Litigation Reform Act of 1995, about Cenovus's current expectations, estimates and projections about the future, based on certain assumptions made in light of Cenovus's experience and perception of historical trends. Although Cenovus believes that the expectations represented by such forward-looking information are reasonable, there can be no assurance that such expectations will prove to be correct.
Forward-looking information in this document is identified by words such as “budget”, “capacity”, “estimate”, “expect”, “focus”, “forecast”, “forward”, “mitigate”, “on time”, “position”, “potential”, “progress”, “target”, “will”, or similar expressions and includes suggestions of future outcomes, including statements about: the company's strategy and related milestones and schedules; projections for 2018 and future years and our plans and strategies to realize such projections; belief regarding the temporary nature of financial challenges experienced in the period, and that such challenges do not reflect the company's significant potential for funds flow and earnings growth; the expected mitigating impact on light-heavy crude oil price differentials through the company's downstream integration, pipeline commitments, rail optionality and financial contracts; expected outcomes of the company's hedge positions, including relative to forecast oil production and expected impacts with respect to the company's downside and upside commodity price and light-heavy crude oil differential exposure; expected cost reductions; potential asset divestitures and projected outcomes, including with respect to debt reduction and increasing shareholder value; expected impacts of the company's capacity to slow production through storage in its oil sands reservoirs, including potential to time production and sales at later dates when pipeline capacity and crude oil differentials have improved; expected rail capacity improvements; full-year production volume and steam to oil ratio forecasts; and expected capital costs, including relative to previous estimates.
Developing forward-looking information involves reliance on a number of assumptions and consideration of certain risks and uncertainties, some of which are specific to Cenovus and others that apply to the industry generally. The factors or assumptions on which the
|
CENOVUS ENERGY |
Page |
Q1 2018 |
|
forward-looking information is based include: Brent prices of US$55.00/bbl, WTI prices of US$52.00/bbl; WCS of US$37.00/bbl; NYMEX natural gas prices of US$3.00/MMBtu; AECO natural gas prices of $2.20/GJ; Chicago 3-2-1 crack spread of US$15.00/bbl; exchange rate of $0.78 US$/C$ and other assumptions identified in Cenovus’s 2018 guidance (available at cenovus.com); projected capital investment levels, the flexibility of capital spending plans and associated sources of funding; achievement of further cost reductions and sustainability thereof; future improvements in availability of product transportation capacity; increasing share price and market capitalization over the long term; future narrowing of crude oil differentials; realization of expected impacts of the company's capacity to store within its oil sands reservoirs barrels not yet produced, including ability to time production and sales at later dates when pipeline capacity and crude oil differentials have improved; estimates of quantities of oil, bitumen, natural gas and liquids from properties and other sources not currently classified as proved; accounting estimates and judgments; future use and development of technology and associated expected future results; ability to obtain necessary regulatory and partner approvals; the successful and timely implementation of capital projects or stages thereof; ability to complete asset sales, including with desired transaction metrics and expected timelines; ability to access and implement all technology necessary to achieve expected future results; and other risks and uncertainties described from time to time in the filings the company makes with securities regulatory authorities.
Readers are cautioned that the foregoing lists are not exhaustive and are made as at the date hereof. Events or circumstances could cause Cenovus's actual results to differ materially from those estimated or projected and expressed in, or implied by, the forward-looking information. Additional information about the other assumptions and the material risk factors that could cause Cenovus's actual results to differ materially from those expressed or implied by its forward-looking statements is contained under “Risk Management and Risk Factors” and “Forward-looking Information” under “Advisory” in Cenovus’s MD&A for the period ended December 31, 2017 (available on SEDAR at sedar.com, on EDGAR at sec.gov and Cenovus's website at cenovus.com).
Cenovus Energy Inc.
Cenovus Energy Inc. is a Canadian integrated oil and natural gas company. It is committed to maximizing value by responsibly developing its assets in a safe, innovative and efficient way. Operations include oil sands projects in northern Alberta, which use specialized methods to drill and pump the oil to the surface, and established natural gas and oil production in Alberta and British Columbia. The company also has 50% ownership in two U.S. refineries. Cenovus shares trade under the symbol CVE, and are listed on the Toronto and New York stock exchanges. For more information, visit cenovus.com.
Find Cenovus on Facebook, Twitter, LinkedIn, YouTube and Instagram.
|
CENOVUS ENERGY |
Page |
Q1 2018 |
|
|
Investor Relations Kam Sandhar Senior Vice-President, Strategy & Corporate Development 403-766-5883
Steven Murray Manager, Investor Relations 403-766-3382
|
Media Reg Curren Senior Media Advisor 403-766-2004
Media Relations general line 403-766-7751 |
|
CENOVUS ENERGY |
Page |
Q1 2018 |
|
Exhibit 99.2
wi
|
|
|
|
Management’s Discussion and Analysis
For the PERIOD ended MARCH 31, 2018
|
|
2 |
|
|
|
|
|
|
|
3 |
|
|
|
|
|
|
|
4 |
|
|
|
|
|
|
|
6 |
|
|
|
|
|
|
|
8 |
|
|
|
|
|
|
|
13 |
|
|
|
|
|
|
|
14 |
|
|
|
18 |
|
|
|
21 |
|
|
|
23 |
|
|
|
|
|
|
|
25 |
|
|
|
|
|
|
|
25 |
|
|
|
|
|
|
|
28 |
|
|
|
|
|
|
CRITICAL ACCOUNTING JUDGMENTS, ESTIMATION UNCERTAINTIES AND ACCOUNTING POLICIES |
|
29 |
|
|
|
|
|
|
29 |
|
|
|
|
|
|
|
30 |
|
|
|
|
|
|
|
32 |
|
|
|
|
|
|
|
34 |
|
|
|
34 |
This Management’s Discussion and Analysis (“MD&A”) for Cenovus Energy Inc. (which includes references to “we”, “our”, “us”, “its”, the “Company”, or “Cenovus”, and means Cenovus Energy Inc., the subsidiaries of, and partnership interests held by, Cenovus Energy Inc. and its subsidiaries) dated April 24, 2018, should be read in conjunction with our March 31, 2018 unaudited interim Consolidated Financial Statements and accompanying notes (“interim Consolidated Financial Statements”), the December 31, 2017 audited Consolidated Financial Statements and accompanying notes (“Consolidated Financial Statements”) and the December 31, 2017 MD&A (“annual MD&A”). All of the information and statements contained in this MD&A are made as of April 24, 2018, unless otherwise indicated. This MD&A provides an update to our annual MD&A and contains forward-looking information about our current expectations, estimates, projections and assumptions. See the Advisory for information on the risk factors that could cause actual results to differ materially and the assumptions underlying our forward-looking information. Cenovus management (“Management”) prepared the MD&A. The interim MD&As are approved by the Audit Committee of the Cenovus Board of Directors (the “Board”) and the annual MD&A is reviewed by the Audit Committee and recommended for its approval by the Board. Additional information about Cenovus, including our quarterly and annual reports, the Annual Information Form (“AIF”) and Form 40-F, is available on SEDAR at sedar.com, on EDGAR at sec.gov, and on our website at cenovus.com. Information on or connected to our website, even if referred to in this MD&A, does not constitute part of this MD&A.
Basis of Presentation
This MD&A and the interim Consolidated Financial Statements and comparative information have been prepared in Canadian dollars, except where another currency has been indicated, and in accordance with International Financial Reporting Standards (“IFRS” or “GAAP”) as issued by the International Accounting Standards Board (“IASB”). Production volumes are presented on a before royalties basis.
Non-GAAP Measures and Additional Subtotals
Certain financial measures in this document do not have a standardized meaning as prescribed by IFRS, such as Netbacks, Adjusted Funds Flow, Operating Earnings, Free Funds Flow, Debt, Net Debt, Capitalization and Adjusted Earnings Before Interest, Taxes, Depreciation and Amortization (“Adjusted EBITDA”) and therefore are considered non-GAAP measures. In addition, Operating Margin is considered an additional subtotal found in Notes 1 and 8 of our interim Consolidated Financial Statements. These measures may not be comparable to similar measures presented by other issuers. These measures have been described and presented in order to provide shareholders and potential investors with additional measures for analyzing our ability to generate funds to finance our operations and information regarding our liquidity. This additional information should not be considered in isolation or as a substitute for measures prepared in accordance with IFRS.
The definition and reconciliation, if applicable, of each non-GAAP measure or additional subtotal is presented in the Operating Results, Financial Results, Liquidity and Capital Resources, or Advisory sections of this MD&A.
|
Cenovus Energy Inc. |
|
1 |
|
|
|
Q1 2018 Management’s Discussion and Analysis |
We are a Canadian integrated oil company headquartered in Calgary, Alberta, with our shares listed on the Toronto and New York stock exchanges. On March 31, 2018, we had an enterprise value of approximately $23 billion. Operations include oil sands projects in northern Alberta and established crude oil, natural gas liquids (“NGLs”) and natural gas production in Alberta and British Columbia. Our average crude oil and NGLs (collectively, “liquids”) production for the three months ended March 31, 2018 was 395,145 barrels per day, our average natural gas production was 553 MMcf per day, and our total production from continuing operations was 487,464 BOE per day. We also conduct marketing activities and have refining operations in the United States (“U.S.”). The refining operations processed an average of 349,000 gross barrels per day of crude oil feedstock into an average of 369,000 gross barrels per day of refined products.
Our strategy is to increase cash flows through disciplined production growth from our industry-leading portfolio of oil sands and Deep Basin natural gas and liquids assets in western Canada. We are focused on increasing our current share price and maximizing shareholder value through cost leadership and realizing the best margins for our products to help us maintain financial resilience and deliver sustainable dividend growth. We plan to achieve our strategy by drawing on the expertise of our people and leveraging our premium asset quality, executional excellence, value-added integration, focused innovation and trusted reputation.
Our Operations
Oil Sands
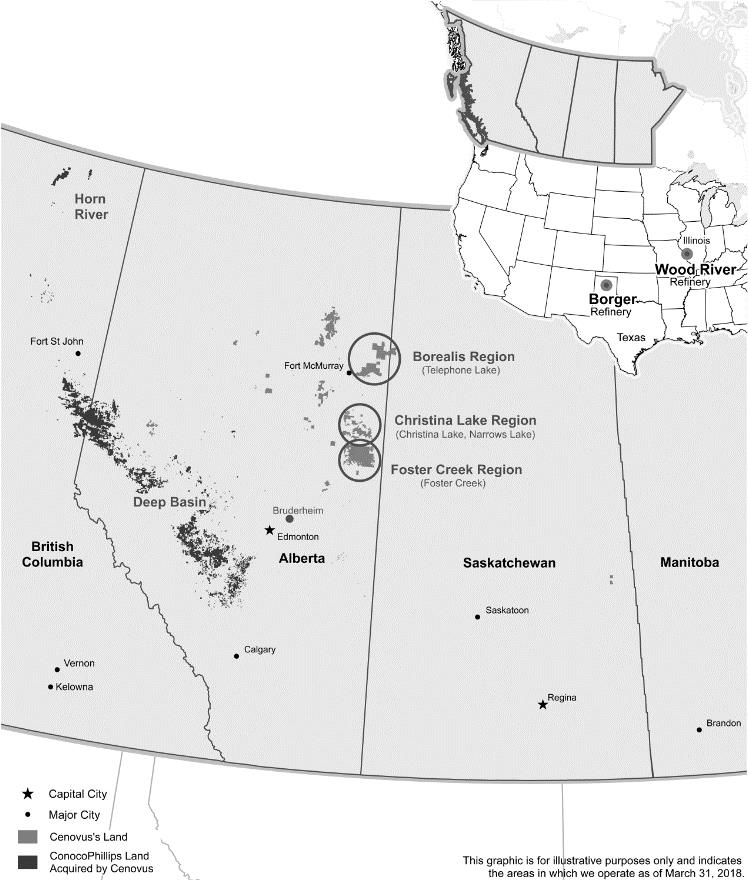
Our oil sands assets include steam-assisted gravity drainage (“SAGD”) oil sands projects in northern Alberta, including Foster Creek, Christina Lake, Narrows Lake and other emerging projects. Foster Creek and Christina Lake are producing, while Narrows Lake is in the initial stages of development. These three projects are located in the Athabasca region of northeastern Alberta and our project at Telephone Lake is located within the Borealis region of northeastern Alberta. The Oil Sands segment also includes the Athabasca natural gas property, from which a portion of the natural gas production is used as fuel at the adjacent Foster Creek operations.
Deep Basin
Our Deep Basin operations include liquids rich natural gas, condensate and other NGLs, and light and medium oil assets located primarily in the Elmworth-Wapiti, Kaybob-Edson, and Clearwater operating areas of British Columbia and Alberta, and include interests in numerous natural gas processing facilities (collectively, the “Deep Basin Assets”). The Deep Basin Assets provide short‑cycle development opportunities with high return potential that complement our long-term oil sands development. A portion of the natural gas produced is used as fuel in our oil sands operations and provides an economic hedge for the natural gas required as a fuel source at our refining operations.
Refining and Marketing
Our operations include two refineries located in Illinois and Texas that are jointly owned with (50 percent interest) and operated by Phillips 66, an unrelated U.S. public company. The gross crude oil capacity at the Wood River and Borger refineries (the “Refineries”) is approximately 314,000 barrels per day and 146,000 barrels per day, respectively. This includes processing capability of up to 255,000 gross barrels per day of blended heavy crude oil. The refining operations allow us to capture the value from crude oil production through to refined products, such as diesel, gasoline and jet fuel, to partially mitigate volatility associated with regional North American light/heavy crude oil price differential fluctuations.
This segment also includes our crude-by-rail terminal operations, located in Bruderheim, Alberta, and the marketing of third-party purchases and sales of product undertaken to provide operational flexibility for transportation commitments, product quality, delivery points and customer diversification.
Operating Margin Net of Related Capital Investment
|
|
Three Months Ended March 31, 2018 |
|
|||||||||
|
($ millions) |
Oil Sands |
|
|
Deep Basin |
|
|
Refining and Marketing |
|
|||
|
Operating Margin |
|
106 |
|
|
|
99 |
|
|
|
(48 |
) |
|
Capital Investment |
|
318 |
|
|
|
145 |
|
|
|
53 |
|
|
Operating Margin Net of Related Capital Investment |
|
(212 |
) |
|
|
(46 |
) |
|
|
(101 |
) |
|
Cenovus Energy Inc. |
|
2 |
|
|
|
Q1 2018 Management’s Discussion and Analysis |
|
Market conditions in the quarter saw light oil and condensate benchmark prices increase compared with the first quarter of 2017, while at the same time, light‑heavy crude oil price differentials increased significantly, leaving heavy crude oil benchmark prices relatively unchanged year over year. The differential between West Texas Intermediate (“WTI”) and Western Canadian Select (“WCS”) prices averaged US$24.28 per barrel (39 percent of WTI) in the quarter, a level not seen since the fourth quarter of 2013, and a 67 percent increase compared with the same period in 2017. The widening of the differential was a result of market access constraints and increasing heavy oil production in Alberta.
In response to limited takeaway capacity and discounted heavy oil pricing, we operated our Christina Lake and Foster Creek facilities at reduced production |
|
|
levels in February and March, using the significant storage capacity in our oil sands reservoirs which provides us flexibility on timing of production and sales of our inventory as pipeline capacity improves and crude oil differentials narrow. |
|
In the first quarter of 2018, we:
|
• |
Produced 487,464 BOE per day from continuing operations, a significant increase from the first quarter of 2017 due to the acquisition from ConocoPhillips Company and certain of its subsidiaries (collectively, “ConocoPhillips”) of the remaining 50 percent interest in the FCCL Partnership (“FCCL”) and the Deep Basin Assets on May 17, 2017 (“the Acquisition”); |
|
• |
Earned an average companywide Netback from continuing operations of $16.80 per BOE, before realized hedging, down 21 percent from the first quarter of 2017 primarily due to the impact of higher condensate costs and materially wider light‑heavy crude oil differentials resulting in weaker realized sales prices for our barrels; |
|
• |
Incurred realized risk management losses of $469 million largely as a result of hedging contracts established to provide downside protection following the Acquisition to support financial resilience; |
|
• |
Substantially completed major planned turnaround activity at the Wood River and Borger refineries; |
|
• |
Recorded a Net Loss from continuing operations of $914 million (2017 – Net Earnings of $211 million); |
|
• |
Recorded Adjusted Funds Flow of negative $41 million compared with Adjusted Funds Flow of $323 million in 2017; |
|
• |
Invested $524 million in capital compared with $313 million in 2017, reflecting our increased ownership in FCCL and the new asset base in the Deep Basin as a result of the Acquisition; |
|
• |
Recorded an impairment of $100 million on our Clearwater assets due to declining forward natural gas prices; |
|
• |
Closed the sale of our Suffield divestiture for gross cash proceeds of $512 million, before closing adjustments, and a before-tax gain of $348 million; and |
|
• |
Substantially completed previously announced workforce reductions of approximately 15 percent from 2017 levels. |
|
Cenovus Energy Inc. |
|
3 |
|
|
|
Q1 2018 Management’s Discussion and Analysis |
Total production of 488,561 BOE per day increased relative to the first quarter of 2017 primarily due to the Acquisition, offset by the disposition of our legacy Conventional assets late in the second half of 2017. In addition, production at our oil sands facilities was impacted by the decision to reduce production and leave barrels not yet produced in our reservoirs in February and March due to pipeline capacity constraints and wider light-heavy oil price differentials.
Production Volumes
|
|
Three Months Ended March 31, |
|
|||||||||
|
|
2018 |
|
|
Percent Change |
|
|
2017 |
|
|||
|
Continuing Operations |
|
|
|
|
|
|
|
|
|
|
|
|
Liquids (barrels per day) |
|
|
|
|
|
|
|
|
|
|
|
|
Oil Sands |
|
|
|
|
|
|
|
|
|
|
|
|
Foster Creek |
|
157,390 |
|
|
|
95 |
|
|
|
80,866 |
|
|
Christina Lake |
|
202,276 |
|
|
|
101 |
|
|
|
100,635 |
|
|
|
|
359,666 |
|
|
|
98 |
|
|
|
181,501 |
|
|
Deep Basin |
|
|
|
|
|
|
|
|
|
|
|
|
Crude Oil |
|
6,517 |
|
|
|
- |
|
|
|
- |
|
|
NGLs |
|
28,962 |
|
|
|
- |
|
|
|
- |
|
|
|
|
35,479 |
|
|
|
- |
|
|
|
- |
|
|
|
|
|
|
|
|
|
|
|
|
|
|
|
Liquids Production (barrels per day) |
|
395,145 |
|
|
|
118 |
|
|
|
181,501 |
|
|
|
|
|
|
|
|
|
|
|
|
|
|
|
Natural Gas (MMcf per day) |
|
|
|
|
|
|
|
|
|
|
|
|
Oil Sands |
|
4 |
|
|
|
(73 |
) |
|
|
15 |
|
|
Deep Basin (1) |
|
549 |
|
|
|
- |
|
|
|
- |
|
|
|
|
553 |
|
|
|
3,587 |
|
|
|
15 |
|
|
|
|
|
|
|
|
|
|
|
|
|
|
|
Production From Continuing Operations (BOE per day) |
|
487,464 |
|
|
|
165 |
|
|
|
184,001 |
|
|
|
|
|
|
|
|
|
|
|
|
|
|
|
Production From Discontinued Operations (Conventional) (BOE per day) |
|
1,097 |
|
|
|
(99 |
) |
|
|
111,413 |
|
|
|
|
|
|
|
|
|
|
|
|
|
|
|
Total Production (BOE per day) |
|
488,561 |
|
|
|
65 |
|
|
|
295,414 |
|
|
(1) |
Includes production used for internal consumption by the Oil Sands segment of 322 MMcf/d. |
Oil Sands production averaged 359,666 barrels per day in the quarter, a significant increase compared with last year, primarily due to the Acquisition.
Total production from the Deep Basin Assets, acquired on May 17, 2017, averaged 127,056 BOE per day in the first quarter of 2018, with 17 horizontal wells being brought on production.
Production in 2018 from our Conventional segment reflects the results of our Suffield operations, which were sold on January 5, 2018. All references to our legacy Conventional segment are accounted for as a discontinued operation.
|
Cenovus Energy Inc. |
|
4 |
|
|
|
Q1 2018 Management’s Discussion and Analysis |
Netbacks From Continuing Operations
Netback is a non-GAAP measure commonly used in the oil and gas industry to assist in measuring operating performance on a per-unit basis, and is defined in the Canadian Oil and Gas Evaluation Handbook. Netbacks reflect our margin on a per-barrel of oil equivalent basis. Netback is defined as gross sales less royalties, transportation and blending, operating expenses and production and mineral taxes divided by sales volumes. Netbacks do not reflect the non-cash writedowns of product inventory until the product is sold. The sales price, transportation and blending costs, and sales volumes exclude the impact of purchased condensate. Condensate is blended with the heavy oil to reduce its thickness in order to transport it to market. Our Netback calculation is aligned with the definition found in the Canadian Oil and Gas Evaluation Handbook. For a reconciliation of our Netbacks see the Advisory section of this MD&A.
|
|
Three Months Ended March.31, |
|
|||||
|
($/BOE) |
2018 |
|
|
2017 |
|
||
|
Sales Price |
|
33.20 |
|
|
|
37.77 |
|
|
Royalties |
|
2.34 |
|
|
|
1.76 |
|
|
Transportation and Blending |
|
6.16 |
|
|
|
5.73 |
|
|
Operating Expenses |
|
7.89 |
|
|
|
9.03 |
|
|
Production and Mineral Taxes |
|
0.01 |
|
|
|
- |
|
|
Netback Excluding Realized Risk Management (1) (2) |
|
16.80 |
|
|
|
21.25 |
|
|
Realized Risk Management Gain (Loss) |
|
(11.69 |
) |
|
|
(5.01 |
) |
|
Netback Including Realized Risk Management (1) (2) |
|
5.11 |
|
|
|
16.24 |
|
|
(1) |
Excludes results from our Conventional segment, which has been classified as a discontinued operation. |
|
(2) |
Excludes intersegment sales. |
Our average Netback decreased relative to the first quarter of 2017 primarily due to the impact of materially wider light-heavy crude oil price differentials, higher condensate costs, lower natural gas prices and realized risk management losses as a result of crude prices exceeding our contract prices. WCS as a percentage of WTI was 61 percent in 2018 compared with 72 percent in the same period of 2017, reflecting a decrease in heavy crude oil sales price realizations relative to WTI benchmark pricing. In addition, as the cost of condensate increases relative to the price of blended crude oil, our bitumen sales price decreases. Our average sales price was also effected by the strengthening of the Canadian dollar relative to the U.S. dollar, which had a negative impact on our sales price of approximately $1.54 per BOE. The impact of higher royalties, and transportation and blending costs were offset by the decline in operating costs.
Refining and Marketing
Crude oil runs and refined product output in the first three months of 2018 decreased compared with 2017. In the first quarter of 2018, major planned turnarounds were substantially completed at both the Wood River and Borger refineries. In the first quarter of 2017, the Refineries were impacted by smaller-scale planned turnarounds.
|
|
Three Months Ended March 31, |
|
|||||||||
|
|
2018 |
|
|
Percent Change |
|
|
2017 |
|
|||
|
Crude Oil Runs (1) (Mbbls/d) |
|
349 |
|
|
|
(14 |
) |
|
|
406 |
|
|
Heavy Crude Oil (1) |
|
162 |
|
|
|
(19 |
) |
|
|
200 |
|
|
Refined Product (1) (Mbbls/d) |
|
369 |
|
|
|
(15 |
) |
|
|
433 |
|
|
Crude Utilization (1) (percent) |
|
76 |
|
|
|
(12 |
) |
|
|
88 |
|
|
(1) |
Represents 100 percent of the Wood River and Borger refinery operations. |
In 2018, Operating Margin from our Refining and Marketing segment decreased relative to the first quarter of 2017 as higher operating costs and lower crude utilization due to the planned turnarounds at both refineries offset higher average market crack spreads and wider light-heavy crude oil differentials, which decreases input costs to the Refineries.
Further information on the changes in our production volumes, items included in our Netbacks and refining results can be found in the Reportable Segments section of this MD&A. Further information on our risk management activities can be found in the Risk Management and Risk Factors section of this MD&A and in the notes to the Consolidated Financial Statements.
|
Cenovus Energy Inc. |
|
5 |
|
|
|
Q1 2018 Management’s Discussion and Analysis |
COMMODITY PRICES UNDERLYING OUR FINANCIAL RESULTS
Key performance drivers for our financial results include commodity prices, price differentials, refining crack spreads as well as the U.S./Canadian dollar exchange rate. The following table shows selected market benchmark prices and the U.S./Canadian dollar average exchange rates to assist in understanding our financial results.
Selected Benchmark Prices and Exchange Rates (1)
|
(US$/bbl, unless otherwise indicated) |
Q1 2018 |
|
|
Percent Change |
|
|
Q1 2017 |
|
|
Q4 2017 |
|
||||
|
Brent |
|
|
|
|
|
|
|
|
|
|
|
|
|
|
|
|
Average |
|
67.18 |
|
|
|
23 |
|
|
|
54.66 |
|
|
|
61.54 |
|
|
End of Period |
|
70.27 |
|
|
|
33 |
|
|
|
52.83 |
|
|
|
66.87 |
|
|
WTI |
|
|
|
|
|
|
|
|
|
|
|
|
|
|
|
|
Average |
|
62.87 |
|
|
|
21 |
|
|
|
51.91 |
|
|
|
55.40 |
|
|
End of Period |
|
64.94 |
|
|
|
28 |
|
|
|
50.60 |
|
|
|
60.42 |
|
|
Average Differential Brent-WTI |
|
4.31 |
|
|
|
57 |
|
|
|
2.75 |
|
|
|
6.14 |
|
|
WCS |
|
|
|
|
|
|
|
|
|
|
|
|
|
|
|
|
Average |
|
38.59 |
|
|
|
3 |
|
|
|
37.33 |
|
|
|
43.14 |
|
|
Average (C$/bbl) |
|
48.79 |
|
|
|
(1 |
) |
|
|
49.38 |
|
|
|
54.84 |
|
|
End of Period |
|
42.88 |
|
|
|
8 |
|
|
|
39.77 |
|
|
|
34.93 |
|
|
Average Differential WTI-WCS |
|
24.28 |
|
|
|
67 |
|
|
|
14.58 |
|
|
|
12.26 |
|
|
Condensate (C5 @ Edmonton) |
|
|
|
|
|
|
|
|
|
|
|
|
|
|
|
|
Average (2) |
|
63.04 |
|
|
|
21 |
|
|
|
52.26 |
|
|
|
57.97 |
|
|
Average Differential WTI-Condensate (Premium)/Discount |
|
(0.17 |
) |
|
|
(51 |
) |
|
|
(0.35 |
) |
|
|
(2.57 |
) |
|
Average Differential WCS-Condensate (Premium)/Discount |
|
(24.45 |
) |
|
|
64 |
|
|
|
(14.93 |
) |
|
|
(14.83 |
) |
|
Mixed Sweet Blend ("MSW" @ Edmonton) |
|
|
|
|
|
|
|
|
|
|
|
|
|
|
|
|
Average (3) |
|
56.98 |
|
|
|
18 |
|
|
|
48.37 |
|
|
|
54.26 |
|
|
End of Period |
|
60.63 |
|
|
|
21 |
|
|
|
50.07 |
|
|
|
53.03 |
|
|
Average Refined Product Prices |
|
|
|
|
|
|
|
|
|
|
|
|
|
|
|
|
Chicago Regular Unleaded Gasoline ("RUL") |
|
73.08 |
|
|
|
16 |
|
|
|
63.13 |
|
|
|
74.36 |
|
|
Chicago Ultra-low Sulphur Diesel ("ULSD") |
|
81.35 |
|
|
|
27 |
|
|
|
63.86 |
|
|
|
80.58 |
|
|
Refining Margin: Average 3-2-1 Crack Spreads (4) |
|
|
|
|
|
|
|
|
|
|
|
|
|
|
|
|
Chicago |
|
12.96 |
|
|
|
12 |
|
|
|
11.54 |
|
|
|
21.09 |
|
|
Average Natural Gas Prices |
|
|
|
|
|
|
|
|
|
|
|
|
|
|
|
|
AECO (C$/Mcf) (5) |
|
1.85 |
|
|
|
(37 |
) |
|
|
2.94 |
|
|
|
1.96 |
|
|
NYMEX (US$/Mcf) |
|
3.00 |
|
|
|
(10 |
) |
|
|
3.32 |
|
|
|
2.93 |
|
|
Basis Differential NYMEX-AECO (US$/Mcf) |
|
1.52 |
|
|
|
38 |
|
|
|
1.10 |
|
|
|
1.40 |
|
|
Foreign Exchange Rate (US$ per C$1) |
|
|
|
|
|
|
|
|
|
|
|
|
|
|
|
|
Average |
|
0.791 |
|
|
|
5 |
|
|
|
0.756 |
|
|
|
0.787 |
|
|
(1) |
These benchmark prices are not our realized sales prices. For our average realized sales prices and realized risk management results, refer to the Netbacks tables in the Operating Results and Reportable Segments sections of this MD&A. |
|
(2) |
The average Canadian dollar condensate benchmark price for the first quarter of 2018 was $79.70 per barrel (2017 – $69.13 per barrel). |
|
(3) |
The average Canadian dollar MSW benchmark price for the first quarter of 2018 was $72.04 per barrel (2017 – $63.98 per barrel). |
|
(4) |
The average 3-2-1 Crack Spread is an indicator of the refining margin and is valued on a last in, first out accounting basis. |
|
(5) |
Alberta Energy Company (“AECO”) natural gas monthly index. |
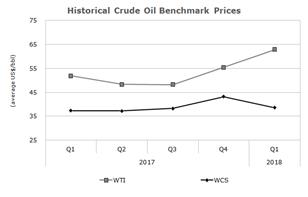
Crude Oil Benchmarks
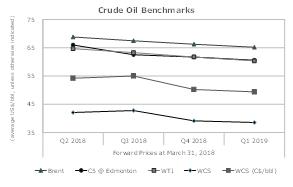
The average Brent, WTI and WCS benchmark prices improved in the first quarter of 2018 compared with the first three months of 2017. Compliance with the production cuts, as outlined in the fourth quarter of 2016 by the Organization of Petroleum Exporting Countries (“OPEC”) and Russia, led to widespread market expectations of an accelerated return to normal inventory levels despite the potential for additional U.S. supply from the Permian basin to offset reduced production.
WTI is an important benchmark for Canadian crude oil since it reflects inland North American crude oil prices and its Canadian dollar equivalent is the basis for determining royalties for a number of our crude oil properties. In the first quarter of 2018, WTI benchmark prices weakened relative to Brent compared with 2017 as refineries in the U.S. midcontinent were unable to clear the crude oil inventory that accumulated subsequent to Hurricane Harvey and a series of planned turnarounds across the refining industry.
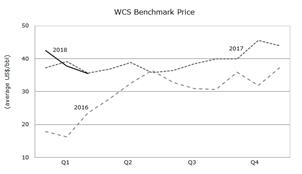
WCS is blended heavy oil which consists of both conventional heavy oil and unconventional diluted bitumen. The average WTI-WCS differential widened significantly in the first three months of 2018 to levels not seen since the fourth quarter of 2013. WCS weakened relative to WTI due to increasing production in Alberta and limited pipeline capacity. Pipeline outages in the fourth quarter of 2017 forced additional volumes into storage and caused differentials to widen further. In addition, the oil and gas industry has been challenged in securing rail capacity to alleviate pipeline apportionment that has increased short-term pressure on differentials.
|
Cenovus Energy Inc. |
|
6 |
|
|
|
Q1 2018 Management’s Discussion and Analysis |
|
|
|
Blending condensate with bitumen enables our production to be transported through pipelines. Our blending ratios, diluent volumes as a percentage of total blended volumes, range from approximately 25 percent to 33 percent. The WCS-Condensate differential is an important benchmark as a narrower differential generally results in an increase in the recovery of condensate costs when selling a barrel of blended crude oil. When the supply of condensate in Alberta does not meet the demand, Edmonton condensate prices may be driven by U.S. Gulf Coast condensate prices plus the cost to transport the condensate to Edmonton.
Average condensate prices were stronger relative to WTI in the first three months of 2018 compared with 2017 due to incremental demand for diluent as a result of increasing Alberta heavy oil production and minimal spare capacity on pipelines that increased the cost of transporting condensate to Edmonton.
MSW is an Alberta based light sweet crude oil benchmark that is representative of Canadian conventional production, comparable to the crude oil produced by our Deep Basin Assets. The average MSW benchmark price improved in the first quarter of 2018 compared with 2017, consistent with the general increase in average crude oil prices.
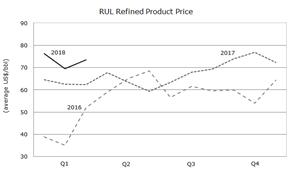
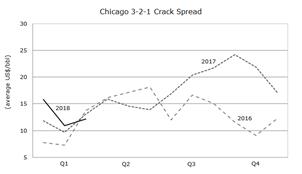
Refining Benchmarks
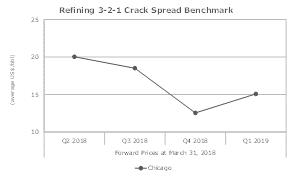
The Chicago Regular Unleaded Gasoline (“RUL”) and Chicago Ultra-low Sulphur Diesel (“ULSD”) benchmark prices are representative of inland refined product prices and are used to derive the Chicago 3-2-1 crack spread. The 3‑2‑1 crack spread is an indicator of the refining margin generated by converting three barrels of crude oil into two barrels of regular unleaded gasoline and one barrel of ultra-low sulphur diesel using current month WTI-based crude oil feedstock prices and valued on a last in, first out accounting basis.
Average Chicago refined product prices increased in the first quarter of 2018 primarily due to higher crude oil prices and wider Chicago 3-2-1 crack spreads. The widening of the Chicago 3-2-1 crack spreads was due to Hurricane Harvey and significant regional refinery maintenance, which caused a wider Brent-WTI differential. Our realized crack spreads are affected by many other factors such as the variety of crude oil feedstock, refinery configuration and product output, the time lag between the purchase and delivery of crude oil feedstock, and the cost of feedstock which is valued on a first in, first out (“FIFO”) accounting basis.
|
|
|
Natural Gas Benchmarks
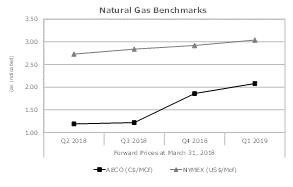
Average AECO prices weakened compared with the first quarter of 2017 due to higher natural gas supply in Alberta, reduced export capabilities, and extensive pipeline and compressor station maintenance that decreased deliverability to storage facilities. Average NYMEX prices also decreased compared with the first quarter of 2017 as the market continues to expect higher supply.
|
Cenovus Energy Inc. |
|
7 |
|
|
|
Q1 2018 Management’s Discussion and Analysis |
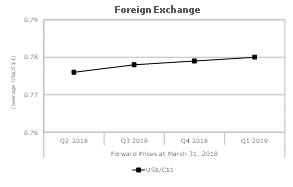
Our revenues are subject to foreign exchange exposure as the sales prices of our crude oil, NGL’s, natural gas and refined products are determined by reference to U.S. benchmark prices. An increase in the value of the Canadian dollar compared with the U.S. dollar has a negative impact on our reported results. Likewise, as the Canadian dollar weakens, there is a positive impact on our reported results. In addition to our revenues being denominated in U.S. dollars, our long‑term debt is also U.S. dollar denominated. In periods of a strengthening Canadian dollar, our U.S. dollar debt gives rise to unrealized foreign exchange gains when translated to Canadian dollars.
In the first quarter of 2018, the Canadian dollar relative to the U.S. dollar strengthened compared with the first three months of 2017, which had a negative impact of approximately $213 million on our revenues, excluding our Conventional segment. The Canadian dollar as at March 31, 2018 compared with December 31, 2017 was weaker relative to the U.S. dollar, resulting in $267 million of unrealized foreign exchange losses on the translation of our U.S. dollar debt.
Selected Consolidated Financial Results
The impact of the Acquisition, condensate prices rising, realized risk management losses and significantly wider light-heavy crude oil price differentials were the primary drivers of our financial results in the three months ended March 31, 2018. The following key performance measures are discussed in more detail within this MD&A.
|
|
2018 |
|
2017 |
|
2016 |
|
|||||||||||||||||||||
|
($ millions, except per share amounts) |
Q1 |
|
Q4 |
|
Q3 |
|
Q2 |
|
Q1 |
|
Q4 |
|
Q3 |
|
Q2 |
|
Q1 |
|
|||||||||
|
Revenues |
|
4,610 |
|
|
5,079 |
|
|
4,386 |
|
|
4,037 |
|
|
3,541 |
|
|
3,324 |
|
|
2,945 |
|
|
2,746 |
|
|
1,991 |
|
|
Operating Margin (1) |
|
|
|
|
|
|
|
|
|
|
|
|
|
|
|
|
|
|
|
|
|
|
|
|
|
|
|
|
From Continuing Operations |
|
157 |
|
|
1,018 |
|
|
1,097 |
|
|
572 |
|
|
305 |
|
|
442 |
|
|
335 |
|
|
424 |
|
|
22 |
|
|
Total Operating Margin |
|
169 |
|
|
1,088 |
|
|
1,214 |
|
|
731 |
|
|
450 |
|
|
595 |
|
|
487 |
|
|
541 |
|
|
144 |
|
|
Cash From Operating Activities |
|
|
|
|
|
|
|
|
|
|
|
|
|
|
|
|
|
|
|
|
|
|
|
|
|
|
|
|
From Continuing Operations |
|
(134 |
) |
|
833 |
|
|
481 |
|
|
1,102 |
|
|
195 |
|
|
22 |
|
|
189 |
|
|
121 |
|
|
94 |
|
|
Total Cash From Operating Activities |
|
(123 |
) |
|
900 |
|
|
592 |
|
|
1,239 |
|
|
328 |
|
|
164 |
|
|
310 |
|
|
205 |
|
|
182 |
|
|
Adjusted Funds Flow (2) |
|
|
|
|
|
|
|
|
|
|
|
|
|
|
|
|
|
|
|
|
|
|
|
|
|
|
|
|
From Continuing Operations |
|
(53 |
) |
|
796 |
|
|
865 |
|
|
603 |
|
|
183 |
|
|
382 |
|
|
296 |
|
|
352 |
|
|
(65 |
) |
|
Total Adjusted Funds Flow |
|
(41 |
) |
|
866 |
|
|
980 |
|
|
745 |
|
|
323 |
|
|
535 |
|
|
422 |
|
|
440 |
|
|
26 |
|
|
Operating Earnings (Loss) (2) |
|
|
|
|
|
|
|
|
|
|
|
|
|
|
|
|
|
|
|
|
|
|
|
|
|
|
|
|
From Continuing Operations |
|
(752 |
) |
|
(533 |
) |
|
240 |
|
|
298 |
|
|
(39 |
) |
|
21 |
|
|
(40 |
) |
|
(3 |
) |
|
(269 |
) |
|
Per Share – Diluted ($) |
|
(0.61 |
) |
|
(0.43 |
) |
|
0.20 |
|
|
0.27 |
|
|
(0.05 |
) |
|
0.03 |
|
|
(0.05 |
) |
|
- |
|
|
(0.32 |
) |
|
Total Operating Earnings (Loss) |
|
(743 |
) |
|
(514 |
) |
|
327 |
|
|
352 |
|
|
(39 |
) |
|
321 |
|
|
(236 |
) |
|
(39 |
) |
|
(423 |
) |
|
Per Share – Diluted ($) |
|
(0.60 |
) |
|
(0.42 |
) |
|
0.27 |
|
|
0.32 |
|
|
(0.05 |
) |
|
0.39 |
|
|
(0.28 |
) |
|
(0.05 |
) |
|
(0.51 |
) |
|
Net Earnings (Loss) |
|
|
|
|
|
|
|
|
|
|
|
|
|
|
|
|
|
|
|
|
|
|
|
|
|
|
|
|
From Continuing Operations |
|
(914 |
) |
|
(776 |
) |
|
275 |
|
|
2,558 |
|
|
211 |
|
|
(209 |
) |
|
(55 |
) |
|
(231 |
) |
|
36 |
|
|
Per Share – Diluted ($) |
|
(0.74 |
) |
|
(0.63 |
) |
|
0.22 |
|
|
2.30 |
|
|
0.25 |
|
|
(0.25 |
) |
|
(0.07 |
) |
|
(0.28 |
) |
|
0.04 |
|
|
Total Net Earnings (Loss) |
|
(654 |
) |
|
620 |
|
|
(82 |
) |
|
2,617 |
|
|
211 |
|
|
91 |
|
|
(251 |
) |
|
(267 |
) |
|
(118 |
) |
|
Per Share – Diluted ($) |
|
(0.53 |
) |
|
0.50 |
|
|
(0.07 |
) |
|
2.35 |
|
|
0.25 |
|
|
0.11 |
|
|
(0.30 |
) |
|
(0.32 |
) |
|
(0.14 |
) |
|
Capital Investment (3) |
|
|
|
|
|
|
|
|
|
|
|
|
|
|
|
|
|
|
|
|
|
|
|
|
|
|
|
|
From Continuing Operations |
|
522 |
|
|
557 |
|
|
396 |
|
|
277 |
|
|
225 |
|
|
202 |
|
|
167 |
|
|
202 |
|
|
284 |
|
|
Total Capital Investment |
|
524 |
|
|
583 |
|
|
438 |
|
|
327 |
|
|
313 |
|
|
259 |
|
|
208 |
|
|
236 |
|
|
323 |
|
|
Dividends |
|
|
|
|
|
|
|
|
|
|
|
|
|
|
|
|
|
|
|
|
|
|
|
|
|
|
|
|
Cash Dividends |
|
60 |
|
|
61 |
|
|
62 |
|
|
61 |
|
|
41 |
|
|
42 |
|
|
41 |
|
|
42 |
|
|
41 |
|
|
Per Share ($) |
|
0.05 |
|
|
0.05 |
|
|
0.05 |
|
|
0.05 |
|
|
0.05 |
|
|
0.05 |
|
|
0.05 |
|
|
0.05 |
|
|
0.05 |
|
|
(1) |
Additional subtotal found in Notes 1 and 8 of the interim Consolidated Financial Statements and defined in this MD&A. |
|
(2) |
Non-GAAP measure defined in this MD&A. |
|
(3) |
Includes expenditures on property, plant and equipment (“PP&E”), exploration and evaluation (“E&E”) assets and assets held for sale. |
|
Cenovus Energy Inc. |
|
8 |
|
|
|
Q1 2018 Management’s Discussion and Analysis |
|
($ millions) |
|
|
|
|
Revenues for the Three Months Ended March 31, 2017 |
|
3,541 |
|
|
Increase (Decrease) due to: |
|
|
|
|
Oil Sands |
|
1,313 |
|
|
Deep Basin |
|
224 |
|
|
Refining and Marketing |
|
(372 |
) |
|
Corporate and Eliminations |
|
(96 |
) |
|
Revenues for the Three Months Ended March 31, 2018 |
|
4,610 |
|
Upstream revenues from continuing operations increased significantly in the first quarter of 2018 compared with 2017. The rise was primarily related to incremental sales volumes as a result of the Acquisition, partially offset by the strengthening of the Canadian dollar relative to the U.S. dollar, lower average realized pricing consistent with the materially wider discount in heavy crude oil pricing, and higher royalties.
Refining and Marketing revenues decreased 14 percent compared with the first quarter of 2017. Refining revenues increased primarily due to higher refined product pricing, consistent with the rise in average Chicago refined product benchmark prices, partially offset by lower crude utilization associated with the major planned turnarounds in 2018. Revenues from third‑party crude oil and natural gas sales undertaken by our marketing group decreased significantly in the first quarter of 2018 compared with 2017 due to a decline in crude oil and natural gas volumes sold, as well as lower natural gas prices, partially offset by higher crude oil prices.
Corporate and Eliminations revenues relate to sales of natural gas or crude oil and operating revenue between segments and are recorded at transfer prices based on current market prices.
Further information regarding our revenues can be found in the Reportable Segments section of this MD&A.
Operating Margin
Operating Margin is an additional subtotal found in Notes 1 and 8 of the interim Consolidated Financial Statements and is used to provide a consistent measure of the cash generating performance of our assets for comparability of our underlying financial performance between periods. Operating Margin is defined as revenues less purchased product, transportation and blending, operating expenses, production and mineral taxes plus realized gains less realized losses on risk management activities. Items within the Corporate and Eliminations segment are excluded from the calculation of Operating Margin.
|
|
Three Months Ended March.31, |
|
|||||
|
($ millions) |
2018 |
|
|
2017 |
|
||
|
Revenues |
|
4,804 |
|
|
|
3,639 |
|
|
(Add) Deduct: |
|
|
|
|
|
|
|
|
Purchased Product |
|
1,957 |
|
|
|
2,330 |
|
|
Transportation and Blending |
|
1,517 |
|
|
|
566 |
|
|
Operating Expenses |
|
705 |
|
|
|
359 |
|
|
Realized (Gain) Loss on Risk Management Activities |
|
468 |
|
|
|
79 |
|
|
Operating Margin From Continuing Operations |
|
157 |
|
|
|
305 |
|
|
Conventional (Discontinued Operations) |
|
12 |
|
|
|
145 |
|
|
Total Operating Margin |
|
169 |
|
|
|
450 |
|
|
Operating Margin from continuing operations decreased in the first three months of 2018 compared with 2017 primarily due to: •A rise in transportation and blending expenses primarily due to higher condensate prices along with an increase in condensate volumes required for blending our increased oil sands production; •Realized risk management losses of $468 million, compared with losses of $79 million in 2017; •An increase in upstream operating expenses primarily due to the Acquisition; •Lower Operating Margin from Refining and Marketing due to higher operating costs and a decline in crude utilization rates; and •Materially wider light-heavy crude oil differentials. |
|
These decreases in Operating Margin from continuing operations were partially offset by increased sales volumes as a result of the Acquisition.
|
Cenovus Energy Inc. |
|
9 |
|
|
|
Q1 2018 Management’s Discussion and Analysis |
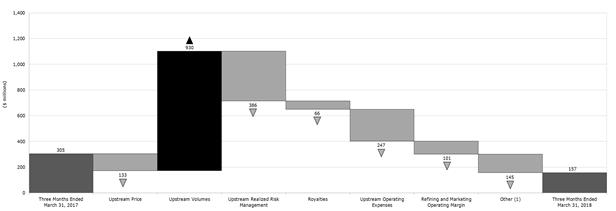
Operating Margin From Continuing Operations Variance
|
|
(1) |
Other includes the value of condensate sold as heavy oil blend recorded in revenues and condensate costs recorded in transportation and blending expense. The crude oil price excludes the impact of condensate purchases. |
Additional details explaining the changes in Operating Margin from continuing operations can be found in the Reportable Segments section of this MD&A.
Cash From Operating Activities and Adjusted Funds Flow
Adjusted Funds Flow is a non-GAAP measure commonly used in the oil and gas industry to assist in measuring a company’s ability to finance its capital programs and meet its financial obligations. Adjusted Funds Flow is defined as cash from operating activities excluding net change in other assets and liabilities and net change in non-cash working capital. Non-cash working capital is composed of current assets and current liabilities, excluding cash and cash equivalents, risk management, the contingent payment, assets held for sale and liabilities related to assets held for sale. Net change in other assets and liabilities is composed of site restoration costs and pension funding.
Total Cash From Operating Activities and Adjusted Funds Flow
|
|
Three Months Ended March.31, |
|
|||||
|
($ millions) |
2018 |
|
|
2017 |
|
||
|
Cash From Operating Activities (1) |
|
(123 |
) |
|
|
328 |
|
|
(Add) Deduct: |
|
|
|
|
|
|
|
|
Net Change in Other Assets and Liabilities |
|
(18 |
) |
|
|
(31 |
) |
|
Net Change in Non-Cash Working Capital |
|
(64 |
) |
|
|
36 |
|
|
Adjusted Funds Flow (1) |
|
(41 |
) |
|
|
323 |
|
|
(1) |
Includes results from our Conventional segment, which has been classified as a discontinued operation. |
Cash From Operating Activities and Adjusted Funds Flow decreased compared with the first quarter of 2017 due to lower Operating Margin, as discussed above, and an increase in general and administrative costs primarily due to a non-cash expense of $59 million incurred in connection with certain Calgary office space in excess of Cenovus’s current and near-term requirements, and $43 million related to severance costs in the quarter.
The change in non-cash working capital in the first quarter of 2018 was primarily due to a decrease in accounts payable and income tax payable, partially offset by a decrease in accounts receivable. For the three months ended March 31, 2017, the change in non-cash working capital was primarily due to a decline in accounts receivable, partially offset by a decrease in accounts payable.
|
Cenovus Energy Inc. |
|
10 |
|
|
|
Q1 2018 Management’s Discussion and Analysis |
Operating Earnings (Loss) is a non-GAAP measure used to provide a consistent measure of the comparability of our underlying financial performance between periods by removing non-operating items. Operating Earnings (Loss) is defined as Earnings (Loss) Before Income Tax excluding gain (loss) on discontinuance, revaluation gain, gain on bargain purchase, unrealized risk management gains (losses) on derivative instruments, unrealized foreign exchange gains (losses) on translation of U.S. dollar denominated notes issued from Canada, foreign exchange gains (losses) on settlement of intercompany transactions, gains (losses) on divestiture of assets, less income taxes on Operating Earnings (Loss) before tax, excluding the effect of changes in statutory income tax rates and the recognition of an increase in U.S. tax basis.
|
|
Three Months Ended March.31, |
|
|||||
|
($ millions) |
2018 |
|
|
2017 |
|
||
|
Earnings (Loss) From Continuing Operations, Before Income Tax |
|
(1,072 |
) |
|
|
260 |
|
|
Add (Deduct): |
|
|
|
|
|
|
|
|
Unrealized Risk Management (Gain) Loss (1) |
|
(139 |
) |
|
|
(279 |
) |
|
Non-Operating Unrealized Foreign Exchange (Gain) Loss (2) |
|
264 |
|
|
|
(56 |
) |
|
(Gain) Loss on Divestiture of Assets |
|
- |
|
|
|
1 |
|
|
Other |
|
(1 |
) |
|
|
- |
|
|
Operating Earnings (Loss) From Continuing Operations, Before Income Tax |
|
(948 |
) |
|
|
(74 |
) |
|
Income Tax Expense (Recovery) |
|
(196 |
) |
|
|
(35 |
) |
|
Operating Earnings (Loss) From Continuing Operations |
|
(752 |
) |
|
|
(39 |
) |
|
Operating Earnings (Loss) From Discontinued Operations |
|
9 |
|
|
|
- |
|
|
Total Operating Earnings (Loss) |
|
(743 |
) |
|
|
(39 |
) |
|
(1) |
Includes the reversal of unrealized (gains) losses recorded in prior periods. |
|
(2) |
Includes unrealized foreign exchange (gains) losses on translation of U.S. dollar denominated notes issued from Canada and foreign exchange (gains) losses on settlement of intercompany transactions. |
Operating Earnings from continuing operations decreased in the first quarter of 2018 compared with 2017 primarily due to lower cash from operating activities and Adjusted Funds Flow, as discussed above, an increase in DD&A which included an impairment of $100 million, a re-measurement loss of $117 million on the contingent payment, a non-cash expense of $59 million incurred in connection with certain Calgary office space in excess of Cenovus’s current and near-term requirements, and unrealized foreign exchange losses on operating items compared with gains in 2017.
Net Earnings (Loss)
|
($ millions) |
|
|
|
|
Net Earnings (Loss) From Continuing Operations, for the Three Months Ended March 31, 2017 |
|
211 |
|
|
Increase (Decrease) due to: |
|
|
|
|
Operating Margin From Continuing Operations |
|
(148 |
) |
|
Corporate and Eliminations: |
|
|
|
|
Unrealized Risk Management Gain (Loss) |
|
(140 |
) |
|
Unrealized Foreign Exchange Gain (Loss) |
|
(354 |
) |
|
Re-measurement of Contingent Payment |
|
(117 |
) |
|
Gain (Loss) on Divestiture of Assets |
|
1 |
|
|
Expenses (1) |
|
(179 |
) |
|
DD&A |
|
(393 |
) |
|
Exploration Expense |
|
(2 |
) |
|
Income Tax Recovery (Expense) |
|
207 |
|
|
Net Earnings (Loss) From Continuing Operations, for the Three Months Ended March 31, 2018 |
|
(914 |
) |
|
(1) |
Includes Corporate and Eliminations realized risk management (gains) losses, general and administrative, finance costs, interest income, realized foreign exchange (gains) losses, transaction costs, research costs, other (income) loss, net and Corporate and Eliminations revenues, purchased product, transportation and blending, and operating expenses. |
In the first quarter of 2018, we incurred a net loss from continuing operations due to:
|
• |
Lower Operating Earnings, as discussed above; |
|
• |
Non-operating unrealized foreign exchange losses of $264 million compared with gains of $56 million in 2017; and |
|
• |
Unrealized risk management gains of $139 million compared with gains of $279 million in 2017. |
Net Earnings from discontinued operations for the three months ended March 31, 2018 was $260 million (2017 – $nil), including a before-tax gain of $348 million on the divestiture of the Suffield asset.
|
Cenovus Energy Inc. |
|
11 |
|
|
|
Q1 2018 Management’s Discussion and Analysis |
|
|
Three Months Ended March.31, |
|
|||||
|
($ millions) |
2018 |
|
|
2017 |
|
||
|
Oil Sands |
|
318 |
|
|
|
172 |
|
|
Deep Basin |
|
145 |
|
|
|
- |
|
|
Refining and Marketing |
|
53 |
|
|
|
46 |
|
|
Corporate and Eliminations |
|
6 |
|
|
|
7 |
|
|
Capital Investment - Continuing Operations |
|
522 |
|
|
|
225 |
|
|
Conventional (Discontinued Operations) |
|
2 |
|
|
|
88 |
|
|
Total Capital Investment |
|
524 |
|
|
|
313 |
|
|
Acquisitions |
|
5 |
|
|
|
- |
|
|
Divestitures |
|
(453 |
) |
|
|
- |
|
|
Net Capital Investment (1) |
|
76 |
|
|
|
313 |
|
|
(1) |
Includes expenditures on PP&E, E&E assets and assets held for sale. |
Capital investment in continuing operations in the first quarter of 2018 increased $297 million compared with the first quarter of 2017, reflecting our increased ownership in FCCL and the new asset base in the Deep Basin as a result of the Acquisition. Oil Sands capital investment focused on sustaining capital related to existing production; stratigraphic test wells to determine pad placement for sustaining wells; and the Christina Lake phase G expansion. Capital investment in the Deep Basin focused on all three operating areas and included the drilling of 14 horizontal production wells targeting liquids rich natural gas, as well as capital invested in facilities and infrastructure to support production growth.
Refining and Marketing capital investment increased $7 million in the first quarter of 2018 due to increased capital maintenance and reliability work compared with the same period in 2017.
Further information regarding our capital investment can be found in the Reportable Segments section of this MD&A.
Capital Investment Decisions
We continue to focus on deleveraging our balance sheet. To achieve this, we are currently marketing for sale certain non-core Deep Basin Assets and are continuing to look for opportunities to further streamline our portfolio. In addition to our commitment to continue reducing our debt, we are actively identifying further cost reduction opportunities.
Once our balance sheet leverage is more in line with our target debt metric, our disciplined approach to capital allocation includes prioritizing our uses of cash in the following manner:
|
• |
First, to sustaining and maintenance capital for our existing business operations; |
|
• |
Second, to paying our current dividend as part of providing strong total shareholder return; and |
|
• |
Third, for incremental returns to shareholders and growth or discretionary capital. |
Our approach to capital allocation includes evaluating all opportunities using specific rigorous criteria with the objective of maintaining a prudent and flexible capital structure and strong balance sheet metrics, which position us to be financially resilient in times of lower cash flows. In addition, we continue to evaluate other corporate and financial opportunities, including generating cash from our existing portfolio. Refer to the Liquidity and Capital Resources section of this MD&A for further information.
|
|
Three Months Ended March.31, |
|
|||||
|
($ millions) |
2018 |
|
|
2017 |
|
||
|
Adjusted Funds Flow (1) |
|
(41 |
) |
|
|
323 |
|
|
Total Capital Investment (1) |
|
524 |
|
|
|
313 |
|
|
Free Funds Flow (1) (2) |
|
(565 |
) |
|
|
10 |
|
|
Cash Dividends |
|
60 |
|
|
|
41 |
|
|
|
|
(625 |
) |
|
|
(31 |
) |
|
(1) |
Includes our Conventional segment, which has been classified as a discontinued operation. |
|
(2) |
Free Funds Flow is a non-GAAP measure defined as Adjusted Funds Flow less capital investment. |
We expect our capital investment and cash dividends for 2018 to be funded from our internally generated cash flows and our cash balance on hand.
|
Cenovus Energy Inc. |
|
12 |
|
|
|
Q1 2018 Management’s Discussion and Analysis |
|
Our reportable segments are as follows:
Oil Sands, which includes the development and production of bitumen and natural gas in northeast Alberta. Cenovus’s bitumen assets include Foster Creek, Christina Lake and Narrows Lake as well as other projects in the early stages of development. Our interest in certain of our operated oil sands properties, notably Foster Creek, Christina Lake and Narrows Lake increased from 50 percent to 100 percent on May 17, 2017.
Deep Basin, which includes approximately three million net acres of land primarily in the Elmworth-Wapiti, Kaybob-Edson, and Clearwater operating areas, rich in natural gas and natural gas liquids. The assets reside in Alberta and British Columbia and include interests in numerous natural gas processing facilities. These assets were acquired on May 17, 2017.
Refining and Marketing, which is responsible for transporting, selling and refining crude oil into petroleum and chemical products. Cenovus jointly owns two refineries in the U.S. with the operator Phillips 66, an unrelated U.S. public company. In addition, Cenovus owns and operates a crude‑by‑rail terminal in Alberta. This segment coordinates Cenovus’s marketing and transportation initiatives to optimize product mix, delivery points, transportation commitments and customer diversification. |
|
Corporate and Eliminations, which primarily includes unrealized gains and losses recorded on derivative financial instruments, gains and losses on divestiture of assets, as well as other Cenovus-wide costs for general and administrative, financing activities and research costs. As financial instruments are settled, the realized gains and losses are recorded in the reportable segment to which the derivative instrument relates. Eliminations include adjustments for internal usage of natural gas production between segments, crude oil production used as feedstock by the Refining and Marketing segment, and unrealized intersegment profits in inventory. Eliminations are recorded at transfer prices based on current market prices.
In the second quarter of 2017, Cenovus announced its intention to divest of its Conventional segment that included its heavy oil assets at Pelican Lake, the CO2 enhanced oil recovery project at Weyburn and conventional crude oil, NGLs and natural gas assets in the Suffield and Palliser areas in southern Alberta. The associated assets and liabilities were reclassified as held for sale and the results of operations reported as a discontinued operation. As at January 5, 2018, all of the Conventional segment assets were sold. Refer to the Discontinued Operations section of this MD&A for more information.
Revenues by Reportable Segment
|
|
Three Months Ended March.31, |
|
|||||
|
($ millions) |
2018 |
|
|
2017 |
|
||
|
Oil Sands |
|
2,348 |
|
|
|
1,035 |
|
|
Deep Basin |
|
224 |
|
|
|
- |
|
|
Refining and Marketing |
|
2,232 |
|
|
|
2,604 |
|
|
Corporate and Eliminations |
|
(194 |
) |
|
|
(98 |
) |
|
|
|
4,610 |
|
|
|
3,541 |
|
|
Cenovus Energy Inc. |
|
13 |
|
|
|
Q1 2018 Management’s Discussion and Analysis |
In northeastern Alberta, we own 100 percent of the Foster Creek, Christina Lake and Narrows Lake oil sands projects following the completion of the Acquisition. In addition, we have several emerging projects in the early stages of development. The Oil Sands segment includes the Athabasca natural gas property, from which a portion of the natural gas production is used as fuel at the adjacent Foster Creek operations.
Significant developments in our Oil Sands segment for the first quarter of 2018 compared with 2017 include:
|
• |
Temporarily reducing production levels in February and March in response to market access constraints and discounted heavy crude oil pricing; |
|
• |
Crude oil netbacks, excluding realized risk management activities, of $17.10 per barrel, a 21 percent decrease compared with the first quarter of 2017 primarily due to the materially wider WCS-Condensate price differential impacting our average realized sales price; and |
|
• |
Operating Margin of $106 million, a decrease of $146 million due primarily to increased transportation and blending costs and realized risk management losses of $454 million. |
Oil Sands – Crude Oil
Financial Results
|
|
Three Months Ended March.31, |
|
|||||
|
($ millions) |
2018 |
|
|
2017 |
|
||
|
Gross Sales |
|
2,403 |
|
|
|
1,055 |
|
|
Less: Royalties |
|
58 |
|
|
|
27 |
|
|
Revenues |
|
2,345 |
|
|
|
1,028 |
|
|
Expenses |
|
|
|
|
|
|
|
|
Transportation and Blending |
|
1,492 |
|
|
|
566 |
|
|
Operating |
|
289 |
|
|
|
136 |
|
|
(Gain) Loss on Risk Management |
|
454 |
|
|
|
77 |
|
|
Operating Margin |
|
110 |
|
|
|
249 |
|
|
Capital Investment |
|
317 |
|
|
|
169 |
|
|
Operating Margin Net of Related Capital Investment |
|
(207 |
) |
|
|
80 |
|
Capital investment in excess of Operating Margin from Oil Sands was funded through cash on our balance sheet.
Operating Margin Variance
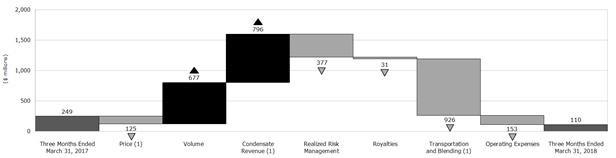
|
(1) |
Revenues include the value of condensate sold as heavy oil blend. Condensate costs are recorded in transportation and blending expense. The crude oil price excludes the impact of condensate purchases. |
Revenues
Price
In the first quarter of 2018, our average crude oil sales price decreased to $34.27 per barrel (2017 – $38.08 per barrel). The decrease in our crude oil price resulted from the widening of the WCS-Condensate and the WCS‑Christina Dilbit Blend (“CDB”) differentials and the strengthening of the Canadian dollar relative to the U.S. dollar. The WCS-CDB differential widened to a discount of US$2.68 per barrel (2017 – discount of US$1.79 per barrel).
Our crude oil sales price is influenced by the cost of condensate used in blending. Our blending ratios range between 25 percent and 33 percent. As the cost of condensate increases relative to the price of blended crude oil, our bitumen sales price decreases. Due to high demand for condensate at Edmonton, we also purchase condensate from U.S. markets. As such, our average cost of condensate is generally higher than the Edmonton benchmark price due to transportation between market hubs and transportation to field locations. In addition, up to three months may elapse from when we purchase condensate to when we blend it with our production. In a rising crude
|
Cenovus Energy Inc. |
|
14 |
|
|
|
Q1 2018 Management’s Discussion and Analysis |
oil price environment, we expect to see some benefit in our bitumen sales price as we are using condensate purchased at a lower price earlier in the year.
Production Volumes
|
|
Three Months Ended March 31, |
|
|||||||||
|
(barrels per day) |
2018 |
|
|
Percent Change |
|
|
2017 |
|
|||
|
Foster Creek |
|
157,390 |
|
|
|
95 |
|
|
|
80,866 |
|
|
Christina Lake |
|
202,276 |
|
|
|
101 |
|
|
|
100,635 |
|
|
|
|
359,666 |
|
|
|
98 |
|
|
|
181,501 |
|
In the first quarter of 2018, production increased primarily due to the Acquisition. Production was also impacted by our decision to temporarily reduce volumes produced in response to takeaway capacity constraints and wider light‑heavy crude oil price differentials. We have significant capacity to store barrels not yet produced within our oil sands reservoirs, allowing flexibility to produce and sell those barrels at a later date when pipeline capacity improves and crude oil differentials narrow.
Condensate
The bitumen currently produced by Cenovus must be blended with condensate to reduce its thickness in order to transport it to market through pipelines. Revenues represent the total value of blended crude oil sold and include the value of condensate. Consistent with a wider WCS-Condensate differential in the first quarter of 2018, the proportion of the cost of condensate recovered decreased. The total amount of condensate used increased as a result of higher production volumes.
Royalties
Royalty calculations for our oil sands projects are based on government prescribed pre- and post-payout royalty rates which are determined on a sliding scale using the Canadian dollar equivalent WTI benchmark price. Royalty calculations differ between properties.
Royalties at Foster Creek, a post-payout project, are based on an annualized calculation which uses the greater of: (1) the gross revenues multiplied by the applicable royalty rate (one to nine percent, based on the Canadian dollar equivalent WTI benchmark price); or (2) the net profits of the project multiplied by the applicable royalty rate
(25 to 40 percent, based on the Canadian dollar equivalent WTI benchmark price). Gross revenues are a function of sales volumes and sales prices. Net profits are a function of sales volumes, sales prices and allowed operating and capital costs.
Royalties at Christina Lake, a pre-payout project, are based on a monthly calculation that applies a royalty rate (ranging from one to nine percent, based on the Canadian dollar equivalent WTI benchmark price) to the gross revenues from the project.
Effective Royalty Rates
|
|
Three Months Ended March.31, |
|
|||||
|
(percent) |
2018 |
|
|
2017 |
|
||
|
Foster Creek |
|
10.4 |
|
|
|
8.5 |
|
|
Christina Lake |
|
2.3 |
|
|
|
2.7 |
|
Royalties increased $31 million in the first quarter of 2018 compared with 2017. Royalties at both Foster Creek and Christina Lake increased primarily due to increased sales volumes and a higher WTI benchmark price (which determines the royalty rate), partially offset by lower crude oil sales prices.
Expenses
Transportation and Blending
In the first quarter of 2018, transportation and blending costs increased $926 million compared to the first quarter of 2017. Blending costs increased due to a rise in condensate volumes required for our increased production and higher condensate prices. Our condensate costs were higher than the average Edmonton benchmark price, primarily due to the transportation expense associated with moving the condensate between market hubs and to our oil sands projects. Transportation costs increased primarily due to incremental sales volumes as a result of the Acquisition.
Per-unit Transportation Expenses
At Foster Creek and Christina Lake, per-barrel transportation costs increased as a result of higher transportation and storage costs, as well as costs associated with transporting additional volumes in the quarter.
|
Cenovus Energy Inc. |
|
15 |
|
|
|
Q1 2018 Management’s Discussion and Analysis |
Primary drivers of our operating expenses in the first quarter of 2018 were workforce costs, fuel, chemical costs, repairs and maintenance and workovers. While per-barrel operating costs decreased two percent, total operating expenses increased $153 million primarily due to the Acquisition, higher chemical costs, and additional repairs and maintenance.
Per-unit Operating Expenses
|
|
Three Months Ended March 31, |
|
|||||||||
|
($/bbl) |
2018 |
|
|
Percent Change |
|
|
2017 |
|
|||
|
Foster Creek |
|
|
|
|
|
|
|
|
|
|
|
|
Fuel |
|
2.77 |
|
|
|
(5 |
) |
|
|
2.93 |
|
|
Non-fuel |
|
7.74 |
|
|
|
10 |
|
|
|
7.06 |
|
|
Total |
|
10.51 |
|
|
|
5 |
|
|
|
9.99 |
|
|
Christina Lake |
|
|
|
|
|
|
|
|
|
|
|
|
Fuel |
|
2.35 |
|
|
|
(9 |
) |
|
|
2.57 |
|
|
Non-fuel |
|
5.03 |
|
|
|
(9 |
) |
|
|
5.51 |
|
|
Total |
|
7.38 |
|
|
|
(9 |
) |
|
|
8.08 |
|
|
Total |
|
8.78 |
|
|
|
(2 |
) |
|
|
8.97 |
|
At Foster Creek, per-barrel fuel costs decreased due to lower natural gas prices, partially offset by increased consumption. Per-barrel non-fuel operating expenses increased in the first quarter of 2018 primarily due to a true‑up of the emissions charges under the Specified Gas Emitters Regulation (“SGER”) being recognized in the first quarter of 2017, higher chemical costs and increased repairs and maintenance, partially offset by higher sales volumes.
At Christina Lake, fuel costs declined on a per-barrel basis due to lower natural gas prices, partially offset by increased consumption. Per-barrel non-fuel operating expenses decreased primarily due to higher sales volumes and a true‑up of the emissions charges under the SGER being recognized in the first quarter of 2017. These decreases were partially offset by increased chemical costs associated with the phase F expansion, as well as higher repairs and maintenance activities.
Netbacks (1)
|
|
Foster Creek |
|
|
Christina Lake |
|
||||||||||
|
|
Three Months Ended March 31, |
|
|||||||||||||
|
($/bbl) |
2018 |
|
|
2017 |
|
|
2018 |
|
|
2017 |
|
||||
|
Sales Price |
|
39.29 |
|
|
|
40.62 |
|
|
|
30.20 |
|
|
|
35.86 |
|
|
Royalties |
|
3.17 |
|
|
|
2.83 |
|
|
|
0.59 |
|
|
|
0.86 |
|
|
Transportation and Blending |
|
8.93 |
|
|
|
7.72 |
|
|
|
4.78 |
|
|
|
4.13 |
|
|
Operating Expenses |
|
10.51 |
|
|
|
9.99 |
|
|
|
7.38 |
|
|
|
8.08 |
|
|
Netback Excluding Realized Risk Management |
|
16.68 |
|
|
|
20.08 |
|
|
|
17.45 |
|
|
|
22.79 |
|
|
Realized Risk Management Gain (Loss) |
|
(13.53 |
) |
|
|
(5.73 |
) |
|
|
(13.99 |
) |
|
|
(4.52 |
) |
|
Netback Including Realized Risk Management |
|
3.15 |
|
|
|
14.35 |
|
|
|
3.46 |
|
|
|
18.27 |
|
|
(1) |
Netbacks reflect our margin on a per-barrel basis of unblended crude oil. |
Risk Management
Risk management activities in the first quarter of 2018 resulted in realized losses of $454 million (2017 – realized losses of $77 million), consistent with average benchmark prices exceeding our contract prices.
Oil Sands – Natural Gas
Oil Sands includes our natural gas operations in northeastern Alberta. A portion of the natural gas produced from our Athabasca property is used as fuel at Foster Creek. Our natural gas production in the first quarter of 2018, net of internal usage, was 4 MMcf per day (2017 – 15 MMcf per day).
|
Cenovus Energy Inc. |
|
16 |
|
|
|
Q1 2018 Management’s Discussion and Analysis |
Oil Sands – Capital Investment
|
|
Three Months Ended March.31, |
|
|||||
|
($ millions) |
2018 |
|
|
2017 |
|
||
|
Foster Creek |
|
139 |
|
|
|
70 |
|
|
Christina Lake |
|
164 |
|
|
|
63 |
|
|
|
|
303 |
|
|
|
133 |
|
|
Narrows Lake |
|
4 |
|
|
|
5 |
|
|
Other (1) |
|
11 |
|
|
|
34 |
|
|
Capital Investment (2) |
|
318 |
|
|
|
172 |
|
|
(1) |
Includes new resource plays, Telephone Lake and Athabasca natural gas. |
|
(2) |
Includes expenditures on PP&E, E&E assets and assets held for sale. |
Capital investment in the first quarter of 2018 increased by $146 million from 2017, reflecting our 100 percent ownership of FCCL as of May 17, 2017. At Foster Creek, capital investment focused on sustaining capital related to existing production and stratigraphic test wells.
In the first quarter of 2018, Christina Lake capital investment focused on sustaining capital related to existing production, stratigraphic test wells and the phase G expansion. Capital investment in the first quarter of 2017 focused on sustaining capital related to existing production and stratigraphic test wells.
Capital investment at Narrows Lake in the first quarter of 2018 primarily related to equipment and site preservation.
Drilling Activity
|
|
Gross Stratigraphic Test Wells |
|
|
Gross Production Wells (1) |
|
||||||||||
|
Three Months Ended March 31, |
2018 |
|
|
2017 |
|
|
2018 |
|
|
2017 |
|
||||
|
Foster Creek |
|
43 |
|
|
|
92 |
|
|
|
8 |
|
|
|
- |
|
|
Christina Lake |
|
63 |
|
|
|
98 |
|
|
|
14 |
|
|
|
- |
|
|
|
|
106 |
|
|
|
190 |
|
|
|
22 |
|
|
|
- |
|
|
Narrows Lake |
|
- |
|
|
|
2 |
|
|
|
- |
|
|
|
- |
|
|
Other |
|
2 |
|
|
|
14 |
|
|
|
- |
|
|
|
- |
|
|
|
|
108 |
|
|
|
206 |
|
|
|
22 |
|
|
|
- |
|
|
(1) |
SAGD well pairs are counted as a single producing well. |
Stratigraphic test wells were drilled to help identify well pad locations for sustaining wells and near-term expansion phases and to further progress the evaluation of emerging assets.
Future Capital Investment
Foster Creek is currently producing from phases A through G. Capital investment for 2018 is forecast to be between $500 million and $550 million. We plan to continue focusing on sustaining capital related to existing production.
Christina Lake is producing from phases A through F. Capital investment for 2018 is forecast to be between $500 million and $550 million, focused on sustaining capital and construction of the phase G expansion. Field construction of phase G, which has an initial design capacity of 50,000 barrels per day, is progressing well and remains on track. Phase G is expected to start producing in the second half of 2019.
Capital investment at Narrows Lake in 2018 is forecast to be between $5 million and $10 million and will focus primarily on equipment and site preservation related to the suspension of construction at Narrows Lake.
In 2018, our Technology and other capital, forecast to be between $35 million and $45 million, relates to technology development initiatives and annual environmental and regulatory commitments.
Our 2018 Oil Sands total capital investment is forecast to be between $1,040 million and $1,155 million. For more information, we direct our readers to review the news release for our 2018 guidance dated December 13, 2017. The news release is available on SEDAR at sedar.com, on EDGAR at sec.gov, and on our website at cenovus.com.
DD&A and Exploration Expense
We deplete crude oil and natural gas properties on a unit-of-production basis over total proved reserves. The unit‑of‑production rate takes into account expenditures incurred to date, together with future development expenditures required to develop those proved reserves. This rate, calculated at an area level, is then applied to our sales volume to determine DD&A in a given period. We believe that this method of calculating DD&A charges each barrel of crude oil equivalent sold with its proportionate share of the cost of capital invested over the total estimated life of the related asset as represented by proved reserves.
|
Cenovus Energy Inc. |
|
17 |
|
|
|
Q1 2018 Management’s Discussion and Analysis |
The following calculation illustrates how the implied depletion rate for our total upstream assets could be determined using the reported consolidated data:
|
($ millions, unless otherwise indicated) |
As at December 31, 2017 |
|
|
|
Upstream Property, Plant and Equipment |
|
26,341 |
|
|
Estimated Future Development Capital |
|
30,195 |
|
|
Total Estimated Upstream Cost Base |
|
56,536 |
|
|
Total Proved Reserves (MMBOE) |
|
5,232 |
|
|
Implied Depletion Rate ($/BOE) |
|
10.81 |
|
While this illustrates the calculation of the implied depletion rate, our depletion rates resulted in a total average rate ranging between $8.75 to $11.30 per BOE. Amounts related to assets under construction and assets held for sale, which would be included in the total upstream cost base and would have proved reserves attributed to them, are not depleted. Property specific rates will exclude upstream assets that are depreciated on a straight-line basis. As such, our actual depletion will differ from depletion calculated by applying the above implied depletion rate. Further information on our accounting policy for DD&A is included in our notes to the December 31, 2017 Consolidated Financial Statements.
Future development costs declined due to an increase in well pair lengths at Christina Lake, resulting in a reduction in the number of pads and well pairs required, as well as cost savings at both Foster Creek and Christina Lake related to a reduction in per well costs and increased well pair spacing. This decline was partially offset by an increase in the future development costs at Foster Creek as a result of a development area expansion.
In the first quarter of 2018, Oil Sands DD&A increased $192 million primarily due to higher sales volumes as a result of the Acquisition. The average DD&A rate in the first quarter of 2018 was approximately $10.65 per barrel, consistent with the first quarter of 2017 (2017 – $10.70 per barrel).
There was $2 million of exploration expense recorded in the first quarter of 2018 (2017 – $ nil).
Our Deep Basin Assets include liquids rich natural gas, condensate and other NGLs, as well as light and medium oil located primarily in the Elmworth-Wapiti, Kaybob-Edson, and Clearwater operating areas of British Columbia and Alberta, and include interests in numerous natural gas processing facilities. The Deep Basin Assets provide short‑cycle development opportunities with high-return potential that complement our long-term oil sands development. In addition, a portion of the natural gas produced is used as fuel in our oil sands operations and provides an economic hedge for the natural gas required as a fuel source at the Refineries.
Significant developments in our Deep Basin segment in the first quarter of 2018 include:
|
• |
Total production of 127,056 BOE per day; |
|
• |
Total capital investment of $145 million related to the drilling of 14 horizontal production wells targeting liquids rich natural gas, and included capital investment in facilities and infrastructure to support production growth; |
|
• |
Netback of $8.99 per BOE, before realized hedging; and |
|
• |
Generating Operating Margin of $99 million. |
Financial Results
|
($ millions) |
Three Months Ended March 31, 2018 |
|
|
|
Gross Sales |
|
259 |
|
|
Less: Royalties |
|
35 |
|
|
Revenues |
|
224 |
|
|
Expenses |
|
|
|
|
Transportation and Blending |
|
25 |
|
|
Operating |
|
91 |
|
|
(Gain) Loss on Risk Management |
|
9 |
|
|
Operating Margin |
|
99 |
|
|
Capital Investment |
|
145 |
|
|
Operating Margin Net of Related Capital Investment |
|
(46 |
) |
Revenues
Price
|
|
Three Months Ended March 31, 2018 |
|
|
|
Light and Medium Oil ($/bbl) |
|
67.30 |
|
|
NGLs ($/bbl) |
|
37.73 |
|
|
Natural Gas ($/mcf) |
|
2.23 |
|
|
Total Oil Equivalent ($/BOE) |
|
21.68 |
|
|
Cenovus Energy Inc. |
|
18 |
|
|
|
Q1 2018 Management’s Discussion and Analysis |
In the first quarter of 2018, revenues included $12 million of processing fee revenue related to our interests in natural gas processing facilities. We do not include processing fee revenue in our per-unit pricing metrics or our netbacks.
Production Volumes
|
|
Three Months Ended March 31, 2018 |
|
|
|
Liquids |
|
|
|
|
Crude Oil (barrels per day) |
|
6,517 |
|
|
NGLs (barrels per day) |
|
28,962 |
|
|
|
|
35,479 |
|
|
Natural Gas (MMcf per day) |
|
549 |
|
|
Total Production (BOE/d) |
|
127,056 |
|
|
|
|
|
|
|
Natural Gas Production (percentage of total) |
|
72 |
|
|
Liquids Production (percentage of total) |
|
28 |
|
Royalties
The Deep Basin Assets are subject to royalty regimes in both Alberta and British Columbia. In Alberta, royalties benefit from a number of different programs that reduce the royalty rate on natural gas production. Natural gas wells in Alberta also benefit from the Gas Cost Allowance (“GCA”), which reduces royalties, to account for capital and operating costs incurred to process and transport the Crown’s portion of natural gas production.
Effective January 1, 2017, the Alberta Government released a new Royalty Regime, Alberta’s Modernized Royalty Framework (“MRF”), which applies to all producing wells after January 1, 2017. Under this new framework, Cenovus will pay a five percent pre-payout royalty on all production until the total revenue from a well equals the drilling and completion cost allowance calculated for each well that meets certain MRF criteria. Subsequently, a higher post-payout royalty rate will apply and will vary based on product-specific market prices. Once a well reaches a maturity threshold, the royalty rate will drop to better match declining production rates. Wells drilled before January 1, 2017 will be managed under the old framework until 2027 and then will convert to the MRF.
In British Columbia, royalties also benefit from programs to reduce the rate on natural gas production. British Columbia applies a GCA, but only on natural gas processed through producer-owned plants. British Columbia also offers a Producer Cost of Service allowance, which reduces the royalty for the processing of the Crown’s portion of natural gas production.
In the first quarter of 2018, our effective royalty rate was 23.1 percent for liquids and 6.0 percent for natural gas.
Expenses
Transportation
Transportation costs averaged $2.21 per BOE in the first quarter of 2018 and reflects charges for the movement of crude oil, NGLs and natural gas from the point of production to where the product is sold. The majority of Deep Basin production is sold into the Alberta market.
Operating
Primary drivers of our operating expenses were related to workforce, repairs and maintenance, processing fee expenses, and property tax and lease costs. We continued to focus on optimization of maintenance processes in the first quarter of 2018, resulting in increased runtimes and lower repairs and maintenance costs, as well as a reduction in workforce costs and higher production levels. Operating costs averaged $7.36 per BOE in the first three months of 2018.
|
Cenovus Energy Inc. |
|
19 |
|
|
|
Q1 2018 Management’s Discussion and Analysis |
|
($/BOE) |
Three Months Ended March 31, 2018 |
|
|
|
Sales Price |
|
21.68 |
|
|
Royalties |
|
3.09 |
|
|
Transportation and Blending |
|
2.21 |
|
|
Operating Expenses |
|
7.36 |
|
|
Production and Mineral Taxes |
|
0.03 |
|
|
Netback Excluding Realized Risk Management |
|
8.99 |
|
|
Realized Risk Management Gain (Loss) |
|
(0.80 |
) |
|
Netback Including Realized Risk Management |
|
8.19 |
|
Deep Basin – Capital Investment
In the first three months of 2018, capital investment was focused on developing all three operating areas. We drilled 12 operated net horizontal wells in addition to participating in the drilling of two non-operated net horizontal wells targeting liquids rich natural gas, completed 16 wells, and brought 17 wells on production. In the first quarter of 2018, Cenovus invested $35 million on facilities and infrastructure to support production growth in our core development areas.
|
($ millions) |
Three Months Ended March 31, 2018 |
|
|
|
Drilling and Completions |
|
94 |
|
|
Facilities |
|
35 |
|
|
Other |
|
16 |
|
|
Capital Investment (1) |
|
145 |
|
|
(1) |
Includes expenditures on PP&E, E&E assets and assets held for sale. |
Drilling Activity
The following table summarizes Cenovus’s well activity:
|
|
Three Months Ended March 31, 2018 |
|
|||||||||||||
|
(net wells, unless otherwise stated) |
Elmworth-Wapiti |
|
|
Kaybob-Edson |
|
|
Clearwater |
|
|
Total Deep Basin |
|
||||
|
Drilled (1) |
|
4 |
|
|
|
7 |
|
|
|
3 |
|
|
|
14 |
|
|
Completed |
|
6 |
|
|
|
8 |
|
|
|
2 |
|
|
|
16 |
|
|
Tied-in |
|
9 |
|
|
|
4 |
|
|
|
4 |
|
|
|
17 |
|
(1)Includes 12 operated net horizontal wells and two non-operated net horizontal wells.
Future Capital Investment
Our 2018 Deep Basin capital investment is forecast to be between $175 million and $195 million.
We continue to take a disciplined approach to the development of our Deep Basin assets. We plan to focus capital investment on drilling, completion and tie-in opportunities that have the potential to generate strong returns and increase throughput at underutilized facilities and evaluating portfolio opportunities. For more information, we direct our readers to review the news release for our 2018 guidance dated December 13, 2017. The news release is available on SEDAR at sedar.com, on EDGAR at sec.gov, and on our website at cenovus.com.
DD&A
We deplete crude oil and natural gas properties on a unit-of-production basis over proved reserves. The unit‑of‑production rate takes into account expenditures incurred to date, together with future development expenditures required to develop those proved reserves. This rate, calculated at an area level, is then applied to our sales volume to determine DD&A in a given period. We believe that this method of calculating DD&A charges each barrel of crude oil equivalent sold with its proportionate share of the cost of capital invested over the total estimated life of the related asset as represented by proved reserves. The average depletion rate was approximately $10.40 per BOE in the first quarter of 2018.
As at March 31, 2018, it was determined that the carrying amount of the Clearwater cash-generating unit (“CGU”) exceeded its recoverable amount, resulting in an impairment loss of $100 million. The impairment was recorded as additional DD&A. Future cash flows for the CGU declined due to forward natural gas prices. Total Deep Basin DD&A was $204 million in the three months ended March 31, 2018.
Assets and Liabilities Held for Sale
In the fourth quarter of 2017, we commenced marketing for sale certain non-core assets located primarily in the East Clearwater area. The properties currently produce approximately 15,000 BOE per day of natural gas and NGLs. These assets were reclassified as assets held for sale and recorded at the lesser of their carrying amount and fair value less costs to sell.
|
Cenovus Energy Inc. |
|
20 |
|
|
|
Q1 2018 Management’s Discussion and Analysis |
Cenovus is a 50 percent partner in the Wood River and Borger refineries, which are located in the U.S. and operated by our partner, Phillips 66. Our Refining and Marketing segment positions us to capture the value from crude oil production through to refined products such as diesel, gasoline and jet fuel. Our integrated approach provides a natural economic hedge against widening crude oil price differentials by providing lower feedstock prices to the Refineries. This segment captures our marketing and transportation initiatives as well as our crude-by-rail terminal operations located in Bruderheim, Alberta.
Significant developments that impacted our Refining and Marketing segment in the first quarter of 2018 compared with 2017 include:
|
• |
Substantially completing major planned turnaround activity at the Wood River refinery, representing the largest scale turnaround to date; and |
|
• |
Completing the majority of planned turnaround activity at the Borger refinery. |
Refinery Operations (1)
|
|
Three Months Ended March.31, |
|
|||||
|
|
2018 |
|
|
2017 |
|
||
|
Crude Oil Capacity (Mbbls/d) |
|
460 |
|
|
|
460 |
|
|
Crude Oil Runs (Mbbls/d) |
|
349 |
|
|
|
406 |
|
|
Heavy Crude Oil |
|
162 |
|
|
|
200 |
|
|
Light/Medium |
|
187 |
|
|
|
206 |
|
|
Refined Products (Mbbls/d) |
|
369 |
|
|
|
433 |
|
|
Gasoline |
|
189 |
|
|
|
227 |
|
|
Distillate |
|
120 |
|
|
|
131 |
|
|
Other |
|
60 |
|
|
|
75 |
|
|
Crude Utilization (percent) |
|
76 |
|
|
|
88 |
|
|
(1) |
Represents 100 percent of the Wood River and Borger refinery operations. |
On a 100 percent basis, the Refineries have a total processing capacity of approximately 460,000 gross barrels per day of crude oil, including processing capability of up to 255,000 gross barrels per day of blended heavy crude oil and 45,000 gross barrels per day of NGLs. The ability to process a wide slate of crude oils allows the Refineries to economically integrate heavy crude oil production. Processing less expensive crude oil relative to WTI creates a feedstock cost advantage, illustrated by the discount of WCS relative to WTI. The amount of heavy crude oil processed, such as WCS and CDB, is dependent on the quality and quantity of available crude oil with the total input slate optimized at each refinery to maximize economic benefit. Crude utilization represents the percentage of total crude oil processed in the Refineries relative to the total capacity.
Crude oil runs and refined product output in the first three months of 2018 decreased relative to the first quarter of 2017 due to the major planned turnarounds and maintenance at both refineries. In addition, lower heavy crude oil volumes were processed due to optimization of the total crude input slate.
Financial Results
|
|
Three Months Ended March.31, |
|
|||||
|
($ millions) |
2018 |
|
|
2017 |
|
||
|
Revenues |
|
2,232 |
|
|
|
2,604 |
|
|
Purchased Product |
|
1,957 |
|
|
|
2,330 |
|
|
Gross Margin |
|
275 |
|
|
|
274 |
|
|
Expenses |
|
|
|
|
|
|
|
|
Operating |
|
318 |
|
|
|
219 |
|
|
(Gain) Loss on Risk Management |
|
5 |
|
|
|
2 |
|
|
Operating Margin |
|
(48 |
) |
|
|
53 |
|
|
Capital Investment |
|
53 |
|
|
|
46 |
|
|
Operating Margin Net of Related Capital Investment |
|
(101 |
) |
|
|
7 |
|
|
Cenovus Energy Inc. |
|
21 |
|
|
|
Q1 2018 Management’s Discussion and Analysis |
The refining realized crack spread, which is the gross margin on a per barrel basis, is affected by many factors, such as the variety of feedstock crude oil processed; refinery configuration and the proportion of gasoline, distillate and secondary product output; the time lag between the purchase of crude oil feedstock and the processing of that crude oil through the Refineries; and the cost of feedstock. Feedstock costs are valued on a FIFO accounting basis.
In the first quarter of 2018, Refining and Marketing gross margin increased primarily due to:
|
• |
Wider heavy crude oil differentials, decreasing feedstock costs; and |
|
• |
Higher average market crack spreads. |
These increases in gross margin were partially offset by:
|
• |
Reduced crude utilization as a result of greater planned maintenance and turnarounds during the quarter; and |
|
• |
The strengthening of the Canadian dollar relative to the U.S. dollar, which had a negative impact of approximately $12 million on our gross margin. |
In the first quarter of 2018, the cost of Renewable Identification Numbers (“RINs”) was $47 million (2017 – $61 million). The cost of RINs declined due to the decrease in RINs benchmark prices and lower volume obligations due to the turnarounds.
Operating Expense
Primary drivers of operating expenses were maintenance, labour, and utilities. In the first quarter of 2018, operating expenses increased primarily due to an increase in maintenance costs associated with the planned maintenance and turnarounds, partially offset by the strengthening of the Canadian dollar relative to the U.S. dollar.
Refining and Marketing – Capital Investment
|
|
Three Months Ended March.31, |
|
|||||
|
($ millions) |
2018 |
|
|
2017 |
|
||
|
Wood River Refinery |
|
35 |
|
|
|
34 |
|
|
Borger Refinery |
|
17 |
|
|
|
12 |
|
|
Marketing |
|
1 |
|
|
|
- |
|
|
|
|
53 |
|
|
|
46 |
|
Capital expenditures increased $7 million relative to the first quarter of 2017 and focused primarily on capital maintenance and reliability work.
In 2018, we expect to invest between $180 million and $210 million mainly related to capital maintenance and reliability work. For more information, we direct our readers to review the news release for our 2018 guidance dated December 13, 2017. The news release is available on SEDAR at sedar.com, on EDGAR at sec.gov, and on our website at cenovus.com.
DD&A
Refining and the crude-by-rail terminal assets are depreciated on a straight-line basis over the estimated service life of each component of the facilities, which range from three to 40 years. The service lives of these assets are reviewed on an annual basis. Refining and Marketing DD&A was $54 million in the first quarter of 2018, consistent with the same period of 2017.
|
Cenovus Energy Inc. |
|
22 |
|
|
|
Q1 2018 Management’s Discussion and Analysis |
The Corporate and Eliminations segment includes intersegment eliminations relating to transactions that have been recorded at transfer prices based on current market prices, as well as unrealized intersegment profits in inventory including natural gas and crude oil sales and purchases. The gains and losses on risk management represent the unrealized mark-to-market gains and losses related to derivative financial instruments used to mitigate fluctuations in commodity prices, power costs, interest rates, and foreign exchange rates, as well as realized risk management gains and losses, if any, on interest rate swaps and foreign exchange contracts. In the first three months of 2018, our risk management activities resulted in $139 million of unrealized gains (2017 – $279 million). As financial instruments are settled, the realized gains and losses are recorded in the reportable segment to which the derivative instrument relates.
The Corporate and Eliminations segment also includes Cenovus-wide costs for general and administrative, finance costs, interest income, foreign exchange (gain) loss, revaluation (gain), transaction costs, re-measurement of the contingent payment, research costs, (gain) loss on divestiture of assets, and other (income) loss.
|
|
Three Months Ended March.31, |
|
|||||
|
($ millions) |
2018 |
|
|
2017 |
|
||
|
General and Administrative |
|
179 |
|
|
|
43 |
|
|
Finance Costs |
|
150 |
|
|
|
99 |
|
|
Interest Income |
|
(3 |
) |
|
|
(17 |
) |
|
Foreign Exchange (Gain) Loss, Net |
|
277 |
|
|
|
(76 |
) |
|
Transaction Costs |
|
- |
|
|
|
29 |
|
|
Re-measurement of Contingent Payment |
|
117 |
|
|
|
- |
|
|
Research Costs |
|
12 |
|
|
|
4 |
|
|
(Gain) Loss on Divestiture of Assets |
|
- |
|
|
|
1 |
|
|
Other (Income) Loss, Net |
|
(2 |
) |
|
|
- |
|
|
|
|
730 |
|
|
|
83 |
|
Expenses
General and Administrative
Primary drivers of our general and administrative expenses were workforce costs and office rent. General and administrative expenses increased by $136 million in the first three months of 2018 compared with 2017 due to a non-cash expense of $59 million recorded in connection with certain Calgary office space in excess of Cenovus’s current and near-term requirements, and $43 million related to severance costs in the quarter.
Non-rent G&A was $0.92 per BOE, excluding severance charges incurred in the quarter.
Finance Costs
Finance costs include interest expense on our long-term debt and short-term borrowings as well as the unwinding of the discount on decommissioning liabilities. Finance costs increased by $51 million in the first quarter of 2018 compared to 2017 primarily due to costs associated with the US$2.9 billion of senior unsecured notes issued to finance the Acquisition in 2017.
The weighted average interest rate on outstanding debt for the first quarter of 2018 was 5.1 percent (2017 – 5.3 percent).
Foreign Exchange
|
|
Three Months Ended March.31, |
|
|||||
|
($ millions) |
2018 |
|
|
2017 |
|
||
|
Unrealized Foreign Exchange (Gain) Loss |
|
282 |
|
|
|
(72 |
) |
|
Realized Foreign Exchange (Gain) Loss |
|
(5 |
) |
|
|
(4 |
) |
|
|
|
277 |
|
|
|
(76 |
) |
In the first quarter of 2018, unrealized foreign exchange losses of $267 million resulted from the translation of our U.S. dollar denominated debt. The Canadian dollar relative to the U.S. dollar as at March 31, 2018 weakened by three percent in comparison to December 31, 2017, resulting in unrealized losses.
Transaction Costs
In the first quarter of 2017, we expensed $29 million of transaction costs related to the Acquisition.
|
Cenovus Energy Inc. |
|
23 |
|
|
|
Q1 2018 Management’s Discussion and Analysis |
Re-measurement of Contingent Payment
Related to oil sands production, Cenovus has agreed to make quarterly payments to ConocoPhillips during the five years subsequent to the closing date of the Acquisition for quarters in which the average WCS crude oil price exceeds $52 per barrel during the quarter. The quarterly payment will be $6 million for each dollar that the WCS price exceeds $52 per barrel. There are no maximum payment terms. The calculation includes an adjustment mechanism related to certain significant production outages at Foster Creek and Christina Lake, which may reduce the amount of a contingent payment.
The contingent payment is accounted for as a financial option. The fair value of $323 million as at March 31, 2018 was estimated by calculating the present value of the future expected cash flows using an option pricing model. The contingent payment is re-measured at fair value at each reporting date with changes in fair value recognized in net earnings. For the three months ended March 31, 2018 a non-cash re-measurement loss of $117 million was recorded. As at March 31, 2018, no amount is payable under this agreement.
Average WCS forward pricing for the remaining term of the contingent payment is US$36.14 or C$46.60 per barrel. Estimated quarterly WCS forward prices for the remaining term of the agreement range between approximately C$39.30 per barrel and C$57.50 per barrel.
DD&A
Corporate and Eliminations DD&A includes provisions in respect of corporate assets, such as computer equipment, leasehold improvements and office furniture. Costs associated with corporate assets are depreciated on a straight‑line basis over the estimated service life of the assets, which range from three to 25 years. The service lives of these assets are reviewed on an annual basis. DD&A for the three months ended March 31, 2018 was $15 million (2017 – $18 million).
Income Tax
|
|
Three Months Ended March.31, |
|
|||||
|
($ millions) |
2018 |
|
|
2017 |
|
||
|
Current Tax |
|
|
|
|
|
|
|
|
Canada |
|
(58 |
) |
|
|
(26 |
) |
|
United States |
|
4 |
|
|
|
(1 |
) |
|
Current Tax Expense (Recovery) |
|
(54 |
) |
|
|
(27 |
) |
|
Deferred Tax Expense (Recovery) |
|
(104 |
) |
|
|
76 |
|
|
Total Tax Expense (Recovery) From Continuing Operations |
|
(158 |
) |
|
|
49 |
|
Tax interpretations, regulations and legislation in the various jurisdictions in which Cenovus and its subsidiaries operate are subject to change. We believe that our provision for income taxes is adequate. There are usually a number of tax matters under review and as a result, income taxes are subject to measurement uncertainty. The timing of the recognition of income and deductions for the purpose of current tax expense is determined by relevant tax legislation.
A current tax recovery from continuing operations was recorded in the first quarter of 2018 and 2017 due to the carryback of current and prior year losses.
Our effective tax rate is a function of the relationship between total tax expense (recovery) and the amount of earnings (loss) before income taxes. The effective tax rate differs from the statutory tax rate as it reflects different tax rates in other jurisdictions, non-taxable foreign exchange (gains) losses, adjustments for changes in tax rates and other tax legislation, adjustments to the tax basis of the refining assets, variations in the estimate of reserves, differences between the provision and the actual amounts subsequently reported on the tax returns, and other permanent differences. Our effective tax rate differs from the statutory tax rate due to non-recognition of the potential tax benefit relating to foreign exchange losses.
|
Cenovus Energy Inc. |
|
24 |
|
|
|
Q1 2018 Management’s Discussion and Analysis |
In 2017, Cenovus divested the majority of its Conventional segment which included its heavy oil assets at Pelican Lake, the CO2 enhanced oil recovery project at Weyburn and conventional crude oil, NGLs and natural gas assets in the Suffield and Palliser areas in southern Alberta. The associated assets and liabilities were reclassified as held for sale and the results of operations reported as a discontinued operation.
The sale of Suffield, the only remaining legacy Conventional asset as at December 31, 2017, closed on January 5, 2018 for gross proceeds of $512 million, before closing adjustments, and a $348 million before-tax gain on discontinuance.
Financial Results
|
|
Three Months Ended March.31, |
|
|||||
|
($ millions) |
2018 |
|
|
2017 |
|
||
|
Gross Sales |
|
16 |
|
|
|
374 |
|
|
Less: Royalties |
|
(1 |
) |
|
|
50 |
|
|
Revenues |
|
17 |
|
|
|
324 |
|
|
Expenses |
|
|
|
|
|
|
|
|
Transportation and Blending |
|
1 |
|
|
|
51 |
|
|
Operating |
|
5 |
|
|
|
110 |
|
|
Production and Mineral Taxes |
|
(1 |
) |
|
|
5 |
|
|
(Gain) Loss on Risk Management |
|
- |
|
|
|
13 |
|
|
Operating Margin |
|
12 |
|
|
|
145 |
|
|
Depreciation, Depletion and Amortization |
|
- |
|
|
|
121 |
|
|
Exploration Expense |
|
- |
|
|
|
3 |
|
|
Finance Costs |
|
- |
|
|
|
21 |
|
|
Earnings (Loss) From Discontinued Operations Before Income Tax |
|
12 |
|
|
|
- |
|
|
Current Tax Expense (Recovery) |
|
- |
|
|
|
5 |
|
|
Deferred Tax Expense (Recovery) |
|
3 |
|
|
|
(5 |
) |
|
After-tax Earnings (Loss) From Discontinued Operations |
|
9 |
|
|
|
- |
|
|
After-tax Gain (Loss) on Discontinuance (1) |
|
251 |
|
|
|
- |
|
|
Net Earnings (Loss) From Discontinued Operations |
|
260 |
|
|
|
- |
|
|
(1) |
Net of deferred tax expense of $93 million in the three months ended March 31, 2018. |
LIQUIDITY AND CAPITAL RESOURCES
|
|
Three Months Ended March.31, |
|
|||||
|
($ millions) |
2018 |
|
|
2017 |
|
||
|
Cash From (Used In) |
|
|
|
|
|
|
|
|
Operating Activities – Continuing Operations |
|
(134 |
) |
|
|
195 |
|
|
Operating Activities – Discontinued Operations |
|
11 |
|
|
|
133 |
|
|
Total Operating Activities |
|
(123 |
) |
|
|
328 |
|
|
Investing Activities – Continuing Operations |
|
(490 |
) |
|
|
(371 |
) |
|
Investing Activities – Discontinued Operations |
|
451 |
|
|
|
(88 |
) |
|
Total Investing Activities |
|
(39 |
) |
|
|
(459 |
) |
|
Net Cash Provided (Used) Before Financing Activities |
|
(162 |
) |
|
|
(131 |
) |
|
Financing Activities |
|
(59 |
) |
|
|
(52 |
) |
|
Foreign Exchange Gain (Loss) on Cash and Cash Equivalents Held in Foreign Currency |
|
16 |
|
|
|
11 |
|
|
Increase (Decrease) in Cash and Cash Equivalents |
|
(205 |
) |
|
|
(172 |
) |
|
|
|
|
|
|
|
|
|
|
|
March 31, 2018 |
|
|
December 31, 2017 |
|
||
|
Cash and Cash Equivalents |
|
405 |
|
|
|
610 |
|
|
Committed and Undrawn Credit Facility |
|
4,500 |
|
|
|
4,500 |
|
|
Cenovus Energy Inc. |
|
25 |
|
|
|
Q1 2018 Management’s Discussion and Analysis |
Cash From (Used In) Operating Activities
In the first three months of 2018, cash was used in operating activities in comparison with cash generated by operating activities in the first quarter of 2017. This occurred as a result of lower Operating Margin, as discussed in the Financial Results section of this MD&A, higher general and administrative expenses and an increase in finance costs, as discussed in the Corporate and Eliminations section of this MD&A. Excluding risk management assets and liabilities, assets and liabilities held for sale, and the current portion of the contingent payment, our working capital was $1,052 million at March 31, 2018 compared with $1,133 million at December 31, 2017.
We anticipate that we will continue to meet our payment obligations as they come due.
Cash From (Used In) Investing Activities
In the first quarter of 2018, the increase in cash used in investing activities from continuing operations was primarily due to an increase in capital investment reflecting our increased ownership in FCCL and the new asset base in the Deep Basin, partially offset by $456 million in net proceeds from the divestiture of our Suffield asset. In 2017, capital investment was limited due to spending reductions in response to the low commodity price environment.
Cash From (Used In) Financing Activities
Cash used in financing activities increased in 2018 primarily due to a higher dividend payment driven by an increased number of shares outstanding. In 2017 we incurred higher financing costs related to the issuance of debt and common shares.
Total debt as at March 31, 2018 was $9,781 million (December 31, 2017 – $9,513 million), with no principal payments due until October 15, 2019 (US$1.3 billion). The principal amount of long-term debt outstanding in U.S. dollars remained unchanged since December 31, 2017, with the increase in total debt due to the weakening of the Canadian dollar relative to the U.S. dollar.
As at March 31, 2018, we were in compliance with all of the terms of our debt agreements.
Dividends
In the first quarter of 2018, we paid dividends of $0.05 per share or $60 million (2017 – $0.05 per share or $41 million). The declaration of dividends is at the sole discretion of the Board and is considered quarterly.
Available Sources of Liquidity
We expect cash flows from our upstream and refining operations to fund all of our cash requirements in 2018. Any potential shortfalls may be funded through prudent use of our balance sheet capacity including draws on our credit facility, management of our asset portfolio and other corporate and financial opportunities that may be available to us. We remain committed to maintaining our investment grade credit ratings at S&P Global Ratings, DBRS Limited and Fitch Ratings.
The following sources of liquidity are available at March 31, 2018:
|
($ millions) |
Term |
|
|
Amount |
|
|
|
Cash and Cash Equivalents |
Not applicable |
|
|
|
405 |
|
|
Committed Credit Facility – Tranche A |
November 2021 |
|
|
|
3,300 |
|
|
Committed Credit Facility – Tranche B |
November 2020 |
|
|
|
1,200 |
|
Committed Credit Facility
We have a committed credit facility in place that consists of a $1.2 billion tranche maturing on November 30, 2020 and $3.3 billion tranche maturing on November 30, 2021. As of March 31, 2018, no amounts were drawn on our committed credit facility.
Under the committed credit facility, Cenovus is required to maintain a debt to capitalization ratio not to exceed 65 percent; we are well below this limit.
Base Shelf Prospectus
Cenovus has in place a base shelf prospectus which expires in November 2019. As at March 31, 2018, US$4.6 billion remains available under the base shelf prospectus. Offerings under the base shelf prospectus are subject to market conditions.
Financial Metrics
We monitor our capital structure and financing requirements using, among other things, non-GAAP financial metrics consisting of Net Debt to Adjusted EBITDA and Net Debt to Capitalization. We define our non-GAAP measure of Net Debt as short-term borrowings, and the current and long-term portions of long-term debt, net of cash and cash equivalents. We define Capitalization as Net Debt plus Shareholders’ Equity. We define Adjusted EBITDA as net earnings before finance costs, interest income, income tax expense, DD&A, goodwill impairments,
|
Cenovus Energy Inc. |
|
26 |
|
|
|
Q1 2018 Management’s Discussion and Analysis |
asset impairments and reversals, unrealized gains (losses) on risk management, foreign exchange gains (losses), revaluation gain, re-measurement of contingent payment, gains (losses) on divestiture of assets, and other income (loss), net, calculated on a trailing 12-month basis. These measures are used to steward our overall debt position and as measures of our overall financial strength.
|
As at |
March 31, 2018 |
|
|
December 31, 2017 |
|
||
|
Net Debt to Capitalization (percent) |
|
33 |
|
|
|
31 |
|
|
Net Debt to Adjusted EBITDA |
3.3x |
|
|
2.8x |
|
||
Over the long term, Cenovus targets a Net Debt to Adjusted EBITDA ratio of less than 2.0 times. Our objective is to maintain a high level of capital discipline and manage our capital structure to help ensure sufficient liquidity through all stages of the economic cycle. To ensure financial resilience, Cenovus may, among other actions, adjust capital and operating spending, draw down on our credit facility or repay existing debt, adjust dividends paid to shareholders, purchase shares for cancellation pursuant to normal course issuer bids, issue new debt, or issue new shares.
Additional information regarding our financial measures and capital structure can be found in the notes to the interim Consolidated Financial Statements.
Share Capital and Stock-Based Compensation Plans
As at March 31, 2018, there were approximately 1,229 million common shares outstanding (December 31, 2017 – 1,229 million common shares). In the second quarter of 2017, Cenovus closed a bought-deal common share financing for 187.5 million common shares, raising gross proceeds of $3.0 billion ($2.9 billion net of $101 million of share issuance costs).
In addition, Cenovus issued 208 million common shares to ConocoPhillips on May 17, 2017 as partial consideration for the Acquisition. In relation to the share consideration, Cenovus and ConocoPhillips entered into an investor agreement, and a registration rights agreement which, among other things, restricted ConocoPhillips from selling or hedging its Cenovus common shares until after November 17, 2017. ConocoPhillips is also restricted from nominating new members to Cenovus’s Board of Directors and must vote its Cenovus common shares in accordance with Management’s recommendations or abstain from voting until such time ConocoPhillips owns 3.5 percent or less of the then outstanding common shares of Cenovus. As at March 31, 2018, ConocoPhillips continued to hold these common shares.
Refer to Note 20 of the interim Consolidated Financial Statements for more details on our Stock Option Plan and our Performance Share Unit, Restricted Share Unit and Deferred Share Unit Plans.
|
As at March 31, 2018 |
Units Outstanding (thousands) |
|
|
Units Exercisable (thousands) |
|
||
|
Common Shares |
|
1,228,790 |
|
|
N/A |
|
|
|
Stock Options |
|
40,385 |
|
|
|
31,631 |
|
|
Other Stock-Based Compensation Plans |
|
15,251 |
|
|
|
1,613 |
|
Contractual Obligations and Commitments
Cenovus has obligations for goods and services that were entered into in the normal course of business. Obligations are primarily related to transportation agreements, operating leases on buildings, our risk management program and an obligation to fund our defined benefit pension and other post-employment benefit plans. Obligations that have original maturities of less than one year are excluded. For further information, see the notes to the December 31, 2017 Consolidated Financial Statements.
As at March 31, 2018, total commitments were $21.5 billion, of which $18.2 billion were for various transportation commitments. Transportation commitments include $9 billion that are subject to regulatory approval or have been approved but are not yet in service (December 31, 2017 – $9 billion). These agreements are for terms up to 20 years subsequent to the date of commencement.
We continue to focus on near and mid-term strategies to broaden market access for our crude oil production. We continue to support proposed new pipeline projects that would connect us to new markets in the U.S. and globally, moving our crude oil production to market by rail, and assessing options to maximize the value of our crude oil.
As at March 31, 2018, there were outstanding letters of credit aggregating $432 million issued as security for performance under certain contracts (December 31, 2017 – $376 million).
|
Cenovus Energy Inc. |
|
27 |
|
|
|
Q1 2018 Management’s Discussion and Analysis |
We are involved in a limited number of legal claims associated with the normal course of operations. We believe that any liabilities that might arise from such matters, to the extent not provided for, are not likely to have a material effect on our Consolidated Financial Statements.
Contingent Payment
In connection with the Acquisition and related to oil sands production, we agreed to make quarterly payments to ConocoPhillips during the five years subsequent to May 17, 2017 for quarters in which the average WCS crude oil price exceeds $52 per barrel during the quarter. As at March 31, 2018, the estimated fair value of the
contingent payment was $323 million. See the Corporate and Eliminations section of this MD&A for more details.
RISK MANAGEMENT AND RISK FACTORS
For a full understanding of the risks that impact Cenovus, the following discussion should be read in conjunction with the Risk Management and Risk Factors section of our 2017 annual MD&A.
Cenovus is exposed to a number of risks through the pursuit of our strategic objectives. Some of these risks impact the oil and gas industry as a whole and others are unique to our operations. The impact of any risk or a combination of risks may adversely affect, among other things, Cenovus’s business, reputation, financial condition, results of operations and cash flows, which may reduce or restrict our ability to pay a dividend to our shareholders and may materially affect the market price of our securities.
The following provides an update on our risks related to commodity prices.
Commodity Prices
Fluctuations in commodity prices and refined product prices impact our financial condition, results of operations, cash flows, growth, access to capital and cost of borrowing.
We partially mitigate our exposure to commodity price risk through the integration of our business, financial instruments, physical contracts and market access commitments. Financial instruments undertaken within our refining business by the operator, Phillips 66, are primarily for purchased product. For details of our financial instruments, including classification, assumptions made in the calculation of fair value and additional discussion on exposure of risks and the management of those risks, see Notes 22 and 23 to the interim Consolidated Financial Statements.
Risks Associated with Derivative Financial Instruments
Financial instruments expose Cenovus to the risk that a counterparty will default on its contractual obligations. This risk is partially mitigated through credit exposure limits, frequent assessment of counterparty credit ratings and netting arrangements, as outlined in our Credit Policy.
Financial instruments also expose Cenovus to the risk of a loss from adverse changes in the market value of financial instruments or if we are unable to fulfill our delivery obligations related to the underlying physical transaction. Financial instruments may limit the benefit to Cenovus if commodity prices increase. These risks are managed through hedging limits that are reviewed annually by the Board, as required by our Market Risk Mitigation Policy.
Impact of Financial Risk Management Activities
|
|
Three Months Ended March 31, |
|
|||||||||||||||||
|
|
2018 |
|
|
2017 |
|
||||||||||||||
|
($ millions) |
Realized |
|
Unrealized |
|
Total |
|
|
Realized |
|
Unrealized |
|
Total |
|
||||||
|
Crude Oil (1) |
|
463 |
|
|
(111 |
) |
|
352 |
|
|
|
77 |
|
|
(251 |
) |
|
(174 |
) |
|
Refining |
|
5 |
|
|
(3 |
) |
|
2 |
|
|
|
2 |
|
|
- |
|
|
2 |
|
|
Interest Rate |
|
- |
|
|
(25 |
) |
|
(25 |
) |
|
|
- |
|
|
(4 |
) |
|
(4 |
) |
|
Foreign Exchange |
|
1 |
|
|
- |
|
|
1 |
|
|
|
- |
|
|
(24 |
) |
|
(24 |
) |
|
(Gain) Loss on Risk Management |
|
469 |
|
|
(139 |
) |
|
330 |
|
|
|
79 |
|
|
(279 |
) |
|
(200 |
) |
|
Income Tax Expense (Recovery) |
|
(126 |
) |
|
37 |
|
|
(89 |
) |
|
|
(21 |
) |
|
75 |
|
|
54 |
|
|
(Gain) Loss on Risk Management, After Tax |
|
343 |
|
|
(102 |
) |
|
241 |
|
|
|
58 |
|
|
(204 |
) |
|
(146 |
) |
|
(1) |
2017 excludes $13 million of realized risk management losses on crude oil contracts from our Conventional segment, which have been classified as a discontinued operation. |
In the first quarter of 2018, we incurred realized losses on crude oil risk management activities as the settlement price, consistent with the average benchmark prices, exceeded our contract prices. Unrealized gains were recorded on our crude oil financial instruments in the first quarter of 2018 primarily due to the realization of settled positions.
|
Cenovus Energy Inc. |
|
28 |
|
|
|
Q1 2018 Management’s Discussion and Analysis |
CRITICAL ACCOUNTING JUDGMENTS, ESTIMATion Uncertainties AND ACCOUNTING POLICIES
Management is required to make estimates and assumptions, and use judgment in the application of accounting policies that could have a significant impact on our financial results. Actual results may differ from estimates and those differences may be material. The estimates and assumptions used are subject to updates based on experience and the application of new information. Our critical accounting policies and estimates are reviewed annually by the Audit Committee of the Board. Further details on the basis of preparation and our significant accounting policies can be found in the notes to the Consolidated Financial Statements.
Critical Judgments in Applying Accounting Policies
Critical judgments are those judgments made by Management in the process of applying accounting policies that have the most significant effect on the amounts recorded in our annual and interim Consolidated Financial Statements. There have been no changes to our critical judgments used in applying accounting policies during the three months ended March 31, 2018. Further information can be found in the notes to the Consolidated Financial Statements and annual MD&A for the year ended December 31, 2017.
Key Sources of Estimation Uncertainty
Critical accounting estimates are those estimates that require Management to make particularly subjective or complex judgments about matters that are inherently uncertain. Estimates and underlying assumptions are reviewed on an ongoing basis and any revisions to accounting estimates are recorded in the period in which the estimates are revised. There have been no changes to our key sources of estimation uncertainty during the three months ended March 31, 2018. Further information can be found in the notes to the Consolidated Financial Statements and annual MD&A for the year ended December 31, 2017.
Changes in Accounting Policies
Effective January 1, 2018, Cenovus adopted IFRS 9, “Financial Instruments” (“IFRS 9”) replacing IAS 39, “Financial Instruments: Recognition and Measurement” (“IAS 39”). The adoption of IFRS 9 did not have a material impact on our Consolidated Financial Statements.
Effective January 1, 2018, Cenovus adopted IFRS 15, “Revenue From Contracts With Customers” (“IFRS 15”) replacing IAS 11, “Construction Contracts”, IAS 18, “Revenue” and several revenue-related interpretations. The adoption of IFRS 15 did not have a material impact on our Consolidated Financial Statements.
Further information about changes to our accounting policies resulting from the adoption of IFRS 9 and IFRS 15 can be found in Note 3 to the interim Consolidated Financial Statements.
Except for changes relating to the continuing integration of the Deep Basin Assets, as discussed below, there have been no changes to internal control over financial reporting (“ICFR”) or disclosure controls and procedures (“DC&P”) during the three months ended March 31, 2018 that have materially affected, or are reasonably likely to materially affect, ICFR or DC&P.
As permitted by and in accordance with, National Instrument 52-109, “Certification of Disclosure in Issuers’ Annual and Interim Filings”, Management has limited the scope and design of ICFR and DC&P to exclude the controls, policies and procedures of the Deep Basin Assets that were acquired on May 17, 2017. Such scope limitation is primarily due to the time required for Management to assess the ICFR and DC&P relating to the Deep Basin Assets in a manner consistent with our other operations. Summary financial information related to the Deep Basin Assets included in the interim Consolidated Financial Statements is as follows:
|
($ millions) |
Three Months Ended March 31, 2018 |
|
|
|
Revenues |
|
224 |
|
|
Operating Margin (1) |
|
99 |
|
|
Net Earnings (Loss) (1) |
|
(83 |
) |
|
|
|
|
|
|
As at |
March 31, 2018 |
|
|
|
Current Assets |
|
653 |
|
|
Non-Current Assets (1) |
|
6,023 |
|
|
Current Liabilities |
|
367 |
|
|
Non-Current Liabilities (1) |
|
501 |
|
|
(1) |
Summary financial information included within net earnings (loss), non-current assets and non-current liabilities includes both information obtained from predecessor accounting systems prior to full conversion to Cenovus systems, as well as financial information such as PP&E, E&E assets, decommissioning liabilities and long-term incentive costs that is included in our accounting systems. |
|
Cenovus Energy Inc. |
|
29 |
|
|
|
Q1 2018 Management’s Discussion and Analysis |
Internal control systems, no matter how well designed, have inherent limitations. Therefore, even those systems determined to be effective can provide only reasonable assurance with respect to financial statement preparation and presentation. Also, projections of any evaluation of effectiveness to future periods are subject to the risk that controls may become inadequate because of changes in conditions, or that the degree of compliance with the policies or procedures may deteriorate.
We expect the remainder of 2018 will see continued commodity price volatility and market access constraints for Cenovus and our industry. We will continue to look for ways to increase our margins through strong operating performance and cost leadership, while focusing on safe and reliable operations. Proactively managing our market access commitments and opportunities should assist with our goal of reaching a broader customer base to secure a higher sales price for our liquids production. We expect that transportation challenges faced by our industry will continue to negatively impact heavy oil prices, demonstrating the need for increased rail export capabilities and approved pipeline projects in Canada to proceed as soon as possible.
Through a continued focus on capital discipline and cost reductions, we have reduced the amount of capital needed to sustain our base business and expand our projects, which we believe will help to ensure our financial resilience.
The following outlook commentary is focused on the next twelve months.
Commodity Prices Underlying our Financial Results
Our crude oil pricing outlook is influenced by the following:
|
• |
We expect the general outlook for crude oil prices will be tied primarily to the supply response to the current price environment, the impact of potential supply disruptions, and the pace of growth in global demand as influenced by macro-economic events; |
|
• |
Overall, crude oil price volatility is expected to increase as inventories return to historical levels and prices remain relatively consistent; |
|
• |
We anticipate the Brent-WTI differential will continue around current levels, after clearing most of the severe weather related impacts, and as additional pipeline capacity becomes available; and |
|
• |
We expect that the WTI-WCS differential will remain under pressure until additional takeaway capabilities alleviates some of the expected production growth. |
|
|
|
Natural gas prices are anticipated to remain challenged with supply continuing to grow as a result of U.S. shale gas drilling and associated natural gas from oil plays. The AECO basis differential is expected to remain wide as supply pushes the limits of existing pipeline capacity.
Refining crack spreads will likely continue to fluctuate from current levels, adjusting for seasonal trends. The wide WTI‑WCS differential will provide an incentive for U.S. Midwest refiners to process additional heavy crude oil volumes from Canada.
We expect the Canadian dollar to continue to be tied to a modest improvement in crude oil prices and the pace at which the U.S. Federal Reserve Board and the Bank of Canada raise benchmark lending rates relative to each other. The Bank of Canada raised its benchmark lending rate twice in 2017 and again in early 2018, marking a notable shift for Canada towards a tighter monetary policy.
|
Cenovus Energy Inc. |
|
30 |
|
|
|
Q1 2018 Management’s Discussion and Analysis |
|
|
|
Our exposure to the light-heavy crude oil price differentials is composed of both a global light-heavy component as well as Canadian transportation constraints. While we expect to see volatility in crude oil prices, we have the ability to partially mitigate the impact of swings in light-heavy crude oil price differentials through the following:
|
• |
Integration – having heavy oil refining capacity capable of processing Canadian heavy oil. From a value perspective, our refining business positions us to capture value from both the WTI-WCS differential for Canadian crude oil and the Brent-WTI differential from the sale of refined products; |
|
• |
Financial hedge transactions – limiting the impact of fluctuations in upstream crude oil prices by entering into financial transactions that fix the WTI-WCS differential; |
|
• |
Marketing agreements – limiting the impact of fluctuations in upstream crude oil prices by entering into physical supply transactions with fixed price components directly with refiners; and |
|
• |
Transportation commitments and arrangements – supporting transportation projects that move crude oil from our production areas to consuming markets, including tidewater markets, as well as utilizing our crude-by-rail terminal to alleviate takeaway capacity constraints. |
Natural gas and NGLs production associated with our Deep Basin Assets provide improved upstream integration for the fuel, solvent and blending requirements at our oil sands operations.
Key Priorities For 2018
Cost Reductions and Deleveraging
Our priorities in 2018 are to further reduce costs and deleverage our balance sheet, while maintaining capital discipline, in an effort to increase returns to shareholders. We remain focused on maintaining our financial resilience and flexibility while continuing to deliver safe and reliable operations, which remains a top priority.
Over the past three years, we have achieved significant improvements in our operating and sustaining capital costs. In 2018, we continue to target additional capital, operating and general and administrative cost reductions across Cenovus. We expect to realize additional savings through continued improvements in areas such as drilling performance, development planning and optimized scheduling of oil sands well start-ups. Our ability to drive structural and sustainable cost and margin improvements will further support our business plan, financial resilience and our ability to generate shareholder value.
We have already made some significant reductions to our non-rent general and administrative costs in 2018. In the first quarter of 2018, we substantially completed previously announced workforce reductions of approximately 15 percent from 2017 levels.
At March 31, 2018, through a combination of cash on hand and available capacity on our committed credit facility, we have approximately $4.9 billion of liquidity. We continue to market for sale a package of non-core Deep Basin assets with production of approximately 15,000 BOE per day, and will look for further opportunities to streamline and high-grade our current portfolio of assets. We believe growth in cash flows, proceeds from additional asset divestitures and further cost reductions will help us reach our Net Debt to Adjusted EBITDA target of less than 2.0 times.
Disciplined Capital Investment
In 2018, we anticipate capital investment to be between $1.5 billion and $1.7 billion. We plan to direct the majority of our 2018 capital budget towards sustaining oil sands production, while supporting ongoing construction at the Christina Lake phase G expansion and a targeted drilling program in the Deep Basin. With integration remaining an important part of our overall strategy, capital investment is also allocated for scheduled maintenance and reliability work at the Refineries.
Advance Focused Technology and Innovation to Achieve Margin Improvement
We have always believed that technology and innovation are differentiating factors in our industry. We focus our innovation efforts on accelerating the adoption of technology solutions and methods of operating to enhance safety, reduce costs, improve margins and lower emissions. We expect innovation at Cenovus to mean significant
|
Cenovus Energy Inc. |
|
31 |
|
|
|
Q1 2018 Management’s Discussion and Analysis |
improvements and game-changing developments that are implemented to generate value. We aim to complement our internal technology development efforts with external collaboration that will leverage our technology spend.
Market Access
Market access constraints for Canadian crude oil production continue to be a challenge. Our strategy is to maintain firm transportation commitments through a combination of pipelines, rail and marine access to support our growth plans, but leave capacity for optimization. We expect to supplement firm capacity with active blending, storage, sourcing and destination optimization to ensure we are maximizing the margin on every barrel we produce.
Oil and Gas Information
The estimates of reserves were prepared effective December 31, 2017 by independent qualified reserves evaluators, based on the Canadian Oil and Gas Evaluation Handbook and in compliance with the requirements of National Instrument 51-101, Standards of Disclosure for Oil and Gas Activities. Estimates are presented using an average of three IQRE’s January 1, 2018 price forecast. For additional information about our reserves and other oil and gas information, see “Reserves Data and Other Oil and Gas Information” in our AIF for the year ended December 31, 2017.
Barrels of Oil Equivalent – natural gas volumes have been converted to barrels of oil equivalent (BOE) on the basis of six Mcf to one barrel (bbl). BOE may be misleading, particularly if used in isolation. A conversion ratio of one bbl to six Mcf is based on an energy equivalency conversion method primarily applicable at the burner tip and does not represent value equivalency at the wellhead. Given that the value ratio based on the current price of crude oil compared with natural gas is significantly different from the energy equivalency conversion ratio of 6:1, utilizing a conversion on a 6:1 basis is not an accurate reflection of value.
Forward-looking Information
This document contains certain forward-looking statements and forward-looking information (collectively referred to as “forward-looking information”) within the meaning of applicable securities legislation, including the U.S. Private Securities Litigation Reform Act of 1995, about our current expectations, estimates and projections about the future, based on certain assumptions made by us in light of our experience and perception of historical trends. Although we believe that the expectations represented by such forward looking information are reasonable, there can be no assurance that such expectations will prove to be correct.
Forward-looking information in this document is identified by words such as “anticipate”, “believe”, “expect”, “estimate”, “plan”, “forecast”, “future”, “target”, “position”, “project”, “committed”, “commitment”, “can be”, “pursue”, “capacity”, “could”, “should”, “will”, “focus”, “outlook”, “potential”, “priority”, “aim”, “on track”, “schedule”, “may”, “strategy”, “forward”, or similar expressions and includes suggestions of future outcomes, including statements about: our strategy and related milestones and schedules, including expected timing for oil sands expansion phases and associated expected production capacities; our strategy to increase cash flows through disciplined production growth from our industry-leading portfolio of oil sands and Deep Basin natural gas and liquids assets in western Canada; our focus on increasing our current share price and maximizing shareholder value through cost leadership and realizing the best margins for our products to help us maintain financial resilience and deliver sustainable dividend growth; our plan to achieve our strategy by drawing on the expertise of our people and leveraging our premium asset quality, executional excellence, value-added integration, focused innovation and trusted reputation; projections for 2018 and future years and our plans and strategies to realize such projections; forecast exchange rates and trends; our future opportunities for oil development; forecast operating and financial results, including forecast sales prices, costs and cash flows; our commitment to continue reducing debt, including our long term target Net Debt to Adjusted EBITDA ratio; our ability to satisfy payment obligations as they become due; priorities for and approach to capital investment decisions or capital allocation; planned capital expenditures, including the amount, timing and funding sources thereof; expected future production, including the timing, stability or growth thereof; expected reserves; capacities, including for projects, transportation and refining; expected impacts of our capacity to store within our oil sands reservoirs barrels not yet produced, including flexibility on timing of production and sales of inventory at later dates when pipeline capacity improves and crude oil differentials narrow; our ability to preserve our financial resilience and various plans and strategies with respect thereto; forecast cost reductions and sustainability thereof; our priorities, including for 2018; future impact of regulatory measures; forecast commodity prices, differentials and trends and expected impact to Cenovus; potential impacts to Cenovus of various risks, including those related to commodity prices; the potential effectiveness of our risk management strategies; new accounting standards, the timing for the adoption thereof by Cenovus, and anticipated impact on the Consolidated Financial Statements; the availability and repayment of our credit facilities; potential asset sales and anticipated use of sales proceeds; expected impacts of the contingent payment related to the Acquisition; future use and development of technology and associated future outcomes; our ability to access and implement all technology necessary to efficiently and effectively operate our assets and achieve expected future cost reductions; and projected growth and projected shareholder return.
|
Cenovus Energy Inc. |
|
32 |
|
|
|
Q1 2018 Management’s Discussion and Analysis |
Readers are cautioned not to place undue reliance on forward-looking information as our actual results may differ materially from those expressed or implied.
Developing forward-looking information involves reliance on a number of assumptions and consideration of certain risks and uncertainties, some of which are specific to Cenovus and others that apply to the industry generally. The factors or assumptions on which the forward-looking information is based include: forecast oil and natural gas, natural gas liquids, condensate and refined products prices, light-heavy crude oil price differentials and other assumptions identified in Cenovus’s 2018 guidance, available at cenovus.com; projected capital investment levels, the flexibility of capital spending plans and associated sources of funding; achievement of further cost reductions and sustainability thereof; expected condensate prices; applicable royalty regimes, including expected royalty rates; future improvements in availability of product transportation capacity; increase to our share price and market capitalization over the long term; future narrowing of crude oil differentials; realization of expected impacts of our capacity to store within our oil sands reservoirs barrels not yet produced, including that we will be able to time production and sales of our inventory at later dates when pipeline capacity has improved and crude oil differentials have narrowed; estimates of quantities of oil, bitumen, natural gas and liquids from properties and other sources not currently classified as proved; accounting estimates and judgements; future use and development of technology and associated expected future results; our ability to obtain necessary regulatory and partner approvals; the successful and timely implementation of capital projects or stages thereof; our ability to generate sufficient cash flow to meet our current and future obligations; estimated abandonment and reclamation costs, including associated levies and regulations applicable thereto; achievement of expected impacts of the Acquisition; successful completion of the integration of the Deep Basin Assets; our ability to obtain and retain qualified staff and equipment in a timely and cost-efficient manner; our ability to access sufficient capital to pursue our development plans; our ability to complete asset sales, including with desired transaction metrics and the timelines we expect; forecast bitumen, crude oil, natural gas liquids, condensate and refined products prices, forecast inflation and other assumptions inherent in our current guidance set out below; expected impacts of the contingent payment to ConocoPhillips; alignment of realized Western Canadian Select (“WCS”) prices and WCS prices used to calculate the contingent payment to ConocoPhillips; our ability to access and implement all technology necessary to achieve expected future results; our ability to implement capital projects or stages thereof in a successful and timely manner; and other risks and uncertainties described from time to time in the filings we make with securities regulatory authorities.
2018 guidance, as updated December 13, 2017, assumes: Brent prices of US$55.00/bbl, WTI prices of US$52.00/bbl; WCS of US$37.00/bbl; NYMEX natural gas prices of US$3.00/MMBtu; AECO natural gas prices of $2.20/GJ; Chicago 3-2-1 crack spread of US$15.00/bbl; and an exchange rate of $0.78 US$/C$.
The risk factors and uncertainties that could cause our actual results to differ materially, include: possible failure by us to realize the anticipated benefits of and synergies from the Acquisition; possible failure to access or implement some or all of the technology necessary to efficiently and effectively operate our assets and achieve expected future results; volatility of and other assumptions regarding commodity prices; possible failure to realize the expected impacts of our capacity to store within our oil sands reservoirs barrels not yet produced, including possible inability to time production and sales at later dates when pipeline capacity and crude oil differentials have improved; the effectiveness of our risk management program, including the impact of derivative financial instruments, the success of our hedging strategies and the sufficiency of our liquidity position; the accuracy of cost estimates; commodity prices, currency and interest rates; possible lack of alignment of realized WCS prices and WCS prices used to calculate the contingent payment to ConocoPhillips; product supply and demand; accuracy of our share price and market capitalization assumptions; market competition, including from alternative energy sources; risks inherent in our marketing operations, including credit risks; exposure to counterparties and partners, including ability and willingness of such parties to satisfy contractual obligations in a timely manner; risks inherent in the operation of our crude-by-rail terminal, including health, safety and environmental risks; maintaining desirable ratios of Net Debt to Adjusted EBITDA as well as Net Debt to Capitalization; our ability to access various sources of debt and equity capital, generally, and on terms acceptable to us; our ability to finance growth and sustaining capital expenditures; changes in credit ratings applicable to us or any of our securities; changes to our dividend plans or strategy, including the dividend reinvestment plan; accuracy of our reserves, future production and future net revenue estimates; accuracy of our accounting estimates and judgements; our ability to replace and expand oil and gas reserves; potential requirements under applicable accounting standards for impairment or reversal of estimated recoverable amounts of some or all of our assets or goodwill from time to time; our ability to maintain our relationship with our partners and to successfully manage and operate our integrated business; reliability of our assets including in order to meet production targets; potential disruption or unexpected technical difficulties in developing new products and manufacturing processes; the occurrence of unexpected events such as fires, severe weather conditions, explosions, blow-outs, equipment failures, transportation incidents and other accidents or similar events; refining and marketing margins; inflationary pressures on operating costs, including labour, materials, natural gas and other energy sources used in oil sands processes; potential failure of products to achieve or maintain acceptance in the market; risks associated with fossil fuel industry reputation; unexpected cost increases or technical difficulties in constructing or modifying manufacturing or refining facilities; unexpected difficulties in producing, transporting or refining of bitumen and/or crude oil into petroleum and chemical products; risks associated with technology and its application to our business; risks associated with climate change; the timing and the costs of well and pipeline construction; our ability to secure adequate and cost‑effective product
|
Cenovus Energy Inc. |
|
33 |
|
|
|
Q1 2018 Management’s Discussion and Analysis |
transportation including sufficient pipeline, crude-by-rail, marine or alternate transportation, including to address any gaps caused by constraints in the pipeline system; availability of, and our ability to attract and retain, critical talent; possible failure to obtain and retain qualified staff and equipment in a timely and cost‑efficient manner; changes in labour relationships; changes in the regulatory framework in any of the locations in which we operate, including changes to the regulatory approval process and land-use designations, royalty, tax, environmental, greenhouse gas, carbon, climate change and other laws or regulations, or changes to the interpretation of such laws and regulations, as adopted or proposed, the impact thereof and the costs associated with compliance; the expected impact and timing of various accounting pronouncements, rule changes and standards on our business, our financial results and our Consolidated Financial Statements; changes in general economic, market and business conditions; the political and economic conditions in the countries in which we operate or supply; the occurrence of unexpected events such as war, terrorist threats and the instability resulting therefrom; and risks associated with existing and potential future lawsuits and regulatory actions against us.
Statements relating to “reserves” are deemed to be forward looking information, as they involve the implied assessment, based on certain estimates and assumptions, that the reserves described exist in the quantities predicted or estimated, and can be profitably produced in the future.
Readers are cautioned that the foregoing lists are not exhaustive and are made as at the date hereof. Events or circumstances could cause our actual results to differ materially from those estimated or projected and expressed in, or implied by, the forward looking information. For a full discussion of our material risk factors, see “Risk Management and Risk Factors” in this MD&A for the period ended December 31, 2017, available on SEDAR at sedar.com, on EDGAR at sec.gov and on our website at cenovus.com.
The following abbreviations have been used in this document:
|
Crude Oil |
Natural Gas |
||
|
|
|
|
|
|
bbl |
Barrel |
Mcf |
thousand cubic feet |
|
Mbbls/d |
thousand barrels per day |
MMcf |
million cubic feet |
|
MMbbls |
million barrels |
Bcf |
billion cubic feet |
|
BOE |
barrel of oil equivalent |
MMBtu |
million British thermal units |
|
MMBOE |
million barrel of oil equivalent |
GJ |
gigajoule |
|
WTI |
West Texas Intermediate |
AECO |
Alberta Energy Company |
|
WCS |
Western Canadian Select |
NYMEX |
New York Mercantile Exchange |
|
CDB |
Christina Dilbit Blend |
|
|
|
MSW |
Mixed Sweet Blend |
|
|
The following tables provide a reconciliation of the items comprising Netbacks to Operating Margin found in our interim Consolidated Financial Statements.
Total Production From Continuing Operations
Continuing Upstream Financial Results
|
|
Per Interim Consolidated Financial Statements |
|
|
Adjustments |
|
|
Basis of Netback Calculation |
|
|||||||||||||||||||||||
|
Three Months Ended March 31, 2018 ($ millions) |
Oil Sands(1) |
|
|
Deep Basin(1) |
|
|
Continuing Operations |
|
|
Condensate |
|
|
Inventory |
|
|
Internal Usage(2) |
|
|
Other |
|
|
Continuing Operations |
|
||||||||
|
Gross Sales |
|
2,406 |
|
|
|
259 |
|
|
|
2,665 |
|
|
|
(1,274 |
) |
|
|
- |
|
|
|
(63 |
) |
|
|
(14 |
) |
|
|
1,314 |
|
|
Royalties |
|
58 |
|
|
|
35 |
|
|
|
93 |
|
|
|
- |
|
|
|
- |
|
|
|
- |
|
|
|
- |
|
|
|
93 |
|
|
Transportation and Blending |
|
1,492 |
|
|
|
25 |
|
|
|
1,517 |
|
|
|
(1,274 |
) |
|
|
- |
|
|
|
- |
|
|
|
- |
|
|
|
243 |
|
|
Operating |
|
296 |
|
|
|
91 |
|
|
|
387 |
|
|
|
- |
|
|
|
- |
|
|
|
(63 |
) |
|
|
(12 |
) |
|
|
312 |
|
|
Netback |
|
560 |
|
|
|
108 |
|
|
|
668 |
|
|
|
- |
|
|
|
- |
|
|
|
- |
|
|
|
(2 |
) |
|
|
666 |
|
|
(Gain) Loss on Risk Management |
|
454 |
|
|
|
9 |
|
|
|
463 |
|
|
|
- |
|
|
|
- |
|
|
|
- |
|
|
|
- |
|
|
|
463 |
|
|
Operating Margin |
|
106 |
|
|
|
99 |
|
|
|
205 |
|
|
|
- |
|
|
|
- |
|
|
|
- |
|
|
|
(2 |
) |
|
|
203 |
|
|
Cenovus Energy Inc. |
|
34 |
|
|
|
Q1 2018 Management’s Discussion and Analysis |
|
Per Interim Consolidated Financial Statements |
|
|
Adjustments |
|
|
Basis of Netback Calculation |
|
||||||||||||||||||||||||
|
Three Months Ended March 31, 2017 ($ millions) |
Oil Sands(1) |
|
|
Deep Basin(1) |
|
|
Continuing Operations |
|
|
Condensate |
|
|
Inventory |
|
|
Internal Usage(2) |
|
|
Other |
|
|
Continuing Operations |
|
||||||||
|
Gross Sales |
|
1,062 |
|
|
|
- |
|
|
|
1,062 |
|
|
|
(478 |
) |
|
|
- |
|
|
|
- |
|
|
|
(5 |
) |
|
|
579 |
|
|
Royalties |
|
27 |
|
|
|
- |
|
|
|
27 |
|
|
|
- |
|
|
|
- |
|
|
|
- |
|
|
|
- |
|
|
|
27 |
|
|
Transportation and Blending |
|
566 |
|
|
|
- |
|
|
|
566 |
|
|
|
(478 |
) |
|
|
- |
|
|
|
- |
|
|
|
- |
|
|
|
88 |
|
|
Operating |
|
140 |
|
|
|
- |
|
|
|
140 |
|
|
|
- |
|
|
|
- |
|
|
|
- |
|
|
|
(1 |
) |
|
|
139 |
|
|
Netback |
|
329 |
|
|
|
- |
|
|
|
329 |
|
|
|
- |
|
|
|
- |
|
|
|
- |
|
|
|
(4 |
) |
|
|
325 |
|
|
(Gain) Loss on Risk Management |
|
77 |
|
|
|
- |
|
|
|
77 |
|
|
|
- |
|
|
|
- |
|
|
|
- |
|
|
|
- |
|
|
|
77 |
|
|
Operating Margin |
|
252 |
|
|
|
- |
|
|
|
252 |
|
|
|
- |
|
|
|
- |
|
|
|
- |
|
|
|
(4 |
) |
|
|
248 |
|
|
(1) |
Found in Note 1 of the interim Consolidated Financial Statements. |
|
(2) |
Represents natural gas volumes produced by the Deep Basin segment used for internal consumption by the Oil Sands segment. |
|
Cenovus Energy Inc. |
|
35 |
|
|
|
Q1 2018 Management’s Discussion and Analysis |
|
|
Basis of Netback Calculation |
|
|
Adjustments |
|
|
Per Interim Consolidated Financial Statements(1) |
|
|||||||||||||||||||||||
|
Three Months Ended March 31, 2018 ($ millions) |
Foster Creek |
|
|
Christina Lake |
|
|
Total Crude Oil |
|
|
Natural Gas |
|
|
Condensate |
|
|
Inventory |
|
|
Other |
|
|
Total Oil Sands |
|
||||||||
|
Gross Sales |
|
579 |
|
|
|
550 |
|
|
|
1,129 |
|
|
|
1 |
|
|
|
1,274 |
|
|
|
- |
|
|
|
2 |
|
|
|
2,406 |
|
|
Royalties |
|
47 |
|
|
|
11 |
|
|
|
58 |
|
|
|
- |
|
|
|
- |
|
|
|
- |
|
|
|
- |
|
|
|
58 |
|
|
Transportation and Blending |
|
131 |
|
|
|
87 |
|
|
|
218 |
|
|
|
- |
|
|
|
1,274 |
|
|
|
- |
|
|
|
- |
|
|
|
1,492 |
|
|
Operating |
|
155 |
|
|
|
134 |
|
|
|
289 |
|
|
|
2 |
|
|
|
- |
|
|
|
- |
|
|
|
5 |
|
|
|
296 |
|
|
Netback |
|
246 |
|
|
|
318 |
|
|
|
564 |
|
|
|
(1 |
) |
|
|
- |
|
|
|
- |
|
|
|
(3 |
) |
|
|
560 |
|
|
(Gain) Loss on Risk Management |
|
200 |
|
|
|
254 |
|
|
|
454 |
|
|
|
- |
|
|
|
- |
|
|
|
- |
|
|
|
- |
|
|
|
454 |
|
|
Operating Margin |
|
46 |
|
|
|
64 |
|
|
|
110 |
|
|
|
(1 |
) |
|
|
- |
|
|
|
- |
|
|
|
(3 |
) |
|
|
106 |
|
|
|
Basis of Netback Calculation |
|
|
Adjustments |
|
|
Per Interim Consolidated Financial Statements(1) |
|
|||||||||||||||||||||||
|
Three Months Ended March 31, 2017 ($ millions) |
Foster Creek |
|
|
Christina Lake |
|
|
Total Crude Oil |
|
|
Natural Gas |
|
|
Condensate |
|
|
Inventory |
|
|
Other |
|
|
Total Oil Sands |
|
||||||||
|
Gross Sales |
|
287 |
|
|
|
290 |
|
|
|
577 |
|
|
|
2 |
|
|
|
478 |
|
|
|
- |
|
|
|
5 |
|
|
|
1,062 |
|
|
Royalties |
|
20 |
|
|
|
7 |
|
|
|
27 |
|
|
|
- |
|
|
|
- |
|
|
|
- |
|
|
|
- |
|
|
|
27 |
|
|
Transportation and Blending |
|
55 |
|
|
|
33 |
|
|
|
88 |
|
|
|
- |
|
|
|
478 |
|
|
|
- |
|
|
|
- |
|
|
|
566 |
|
|
Operating |
|
71 |
|
|
|
65 |
|
|
|
136 |
|
|
|
3 |
|
|
|
- |
|
|
|
- |
|
|
|
1 |
|
|
|
140 |
|
|
Netback |
|
141 |
|
|
|
185 |
|
|
|
326 |
|
|
|
(1 |
) |
|
|
- |
|
|
|
- |
|
|
|
4 |
|
|
|
329 |
|
|
(Gain) Loss on Risk Management |
|
40 |
|
|
|
37 |
|
|
|
77 |
|
|
|
- |
|
|
|
- |
|
|
|
- |
|
|
|
- |
|
|
|
77 |
|
|
Operating Margin |
|
101 |
|
|
|
148 |
|
|
|
249 |
|
|
|
(1 |
) |
|
|
- |
|
|
|
- |
|
|
|
4 |
|
|
|
252 |
|
|
(1) |
Found in Note 1 of the interim Consolidated Financial Statements. |
Deep Basin
|
|
Basis of Netback Calculation |
|
|
Adjustments |
|
|
Per Interim Consolidated Financial Statements(1) |
|
|||
|
Three Months Ended March 31, 2018 ($ millions) |
Total |
|
|
Other(2) |
|
|
Total Deep Basin |
|
|||
|
Gross Sales |
|
247 |
|
|
|
12 |
|
|
|
259 |
|
|
Royalties |
|
35 |
|
|
|
- |
|
|
|
35 |
|
|
Transportation and Blending |
|
25 |
|
|
|
- |
|
|
|
25 |
|
|
Operating |
|
84 |
|
|
|
7 |
|
|
|
91 |
|
|
Netback |
|
103 |
|
|
|
5 |
|
|
|
108 |
|
|
(Gain) Loss on Risk Management |
|
9 |
|
|
|
- |
|
|
|
9 |
|
|
Operating Margin |
|
94 |
|
|
|
5 |
|
|
|
99 |
|
|
(1) |
Found in Note 1 of the interim Consolidated Financial Statements. |
|
(2) |
Reflects operating margin from processing facility. |
|
Cenovus Energy Inc. |
|
36 |
|
|
|
Q1 2018 Management’s Discussion and Analysis |
The following table provides the sales volumes used to calculate Netback.
Sales Volumes
|
|
Three Months Ended March 31, |
|
|||||
|
(barrels per day, unless otherwise stated) |
2018 |
|
|
2017 |
|
||
|
Oil Sands |
|
|
|
|
|
|
|
|
Foster Creek |
|
163,911 |
|
|
|
78,562 |
|
|
Christina Lake |
|
202,212 |
|
|
|
89,919 |
|
|
Total Oil Sands Crude Oil |
|
366,123 |
|
|
|
168,481 |
|
|
|
|
|
|
|
|
|
|
|
Natural Gas (MMcf per day) |
|
4 |
|
|
|
15 |
|
|
|
|
|
|
|
|
|
|
|
Deep Basin |
|
|
|
|
|
|
|
|
Total Liquids |
|
35,479 |
|
|
|
- |
|
|
|
|
|
|
|
|
|
|
|
Natural Gas (MMcf per day) |
|
549 |
|
|
|
- |
|
|
|
|
|
|
|
|
|
|
|
Total Deep Basin (BOE per day) |
|
127,056 |
|
|
|
- |
|
|
|
|
|
|
|
|
|
|
|
Less: Internal Consumption (1) (MMcf per day) |
|
(322 |
) |
|
|
- |
|
|
|
|
|
|
|
|
|
|
|
Sales From Continuing Operations (1) (BOE per day) |
|
440,254 |
|
|
|
170,981 |
|
|
(1) |
Less natural gas volumes used for internal consumption by the Oil Sands segment. |
|
Cenovus Energy Inc. |
|
37 |
|
|
|
Q1 2018 Management’s Discussion and Analysis |
Exhibit 99.3

Cenovus Energy Inc.
Interim Consolidated Financial Statements (unaudited)
For the Period Ended March 31, 2018
(Canadian Dollars)
CONSOLIDATED FINANCIAL STATEMENTS (unaudited)
For the period ended March 31, 2018
TABLE OF CONTENTS
|
|
|
|
|
|
3 |
|
|
CONSOLIDATED STATEMENTS OF COMPREHENSIVE INCOME (LOSS) (UNAUDITED) |
|
4 |
|
|
5 |
|
|
|
6 |
|
|
|
7 |
|
|
|
8 |
|
|
|
8 |
|
|
|
11 |
|
|
|
11 |
|
|
|
15 |
|
|
|
15 |
|
|
|
15 |
|
|
|
17 |
|
|
|
17 |
|
|
|
18 |
|
|
|
19 |
|
|
|
19 |
|
|
|
19 |
|
|
|
20 |
|
|
|
20 |
|
|
|
20 |
|
|
|
21 |
|
|
|
21 |
|
|
|
21 |
|
|
|
22 |
|
|
|
22 |
|
|
|
23 |
|
|
|
24 |
|
|
|
26 |
|
|
|
27 |
|
|
|
27 |
|
|
|
|
|
|
Cenovus Energy Inc. |
2 |
For the period ended March 31, 2018 |
CONSOLIDATED STATEMENTS OF EARNINGS (LOSS) (unaudited)
For the periods ended March 31,
($ millions, except per share amounts)
|
|
|
|
|
|
Three Months Ended |
|
|||||
|
|
Notes |
|
|
|
2018 |
|
|
2017(1) |
|
||
|
|
|
1 |
|
|
|
|
|
|
|
|
|
|
Revenues |
|
|
|
|
|
|
|
|
|
|
|
|
Gross Sales |
|
|
|
|
|
4,703 |
|
|
|
3,568 |
|
|
Less: Royalties |
|
|
|
|
|
93 |
|
|
|
27 |
|
|
|
|
|
|
|
|
4,610 |
|
|
|
3,541 |
|
|
Expenses |
|
1 |
|
|
|
|
|
|
|
|
|
|
Purchased Product |
|
|
|
|
|
1,829 |
|
|
|
2,234 |
|
|
Transportation and Blending |
|
|
|
|
|
1,514 |
|
|
|
564 |
|
|
Operating |
|
|
|
|
|
642 |
|
|
|
358 |
|
|
(Gain) Loss on Risk Management |
|
22 |
|
|
|
330 |
|
|
|
(200 |
) |
|
Depreciation, Depletion and Amortization |
6,13 |
|
|
|
635 |
|
|
|
242 |
|
|
|
Exploration Expense |
6,12 |
|
|
|
2 |
|
|
- |
|
||
|
General and Administrative |
|
|
|
|
|
179 |
|
|
|
43 |
|
|
Finance Costs |
|
4 |
|
|
|
150 |
|
|
|
99 |
|
|
Interest Income |
|
|
|
|
|
(3 |
) |
|
|
(17 |
) |
|
Foreign Exchange (Gain) Loss, Net |
|
5 |
|
|
|
277 |
|
|
|
(76 |
) |
|
Transaction Costs |
|
|
|
|
- |
|
|
|
29 |
|
|
|
Re-measurement of Contingent Payment |
|
14 |
|
|
|
117 |
|
|
- |
|
|
|
Research Costs |
|
|
|
|
|
12 |
|
|
|
4 |
|
|
(Gain) Loss on Divestiture of Assets |
|
|
|
|
- |
|
|
|
1 |
|
|
|
Other (Income) Loss, Net |
|
|
|
|
|
(2 |
) |
|
- |
|
|
|
Earnings (Loss) From Continuing Operations Before Income Tax |
|
|
|
|
|
(1,072 |
) |
|
|
260 |
|
|
Income Tax Expense (Recovery) |
|
9 |
|
|
|
(158 |
) |
|
|
49 |
|
|
Net Earnings (Loss) From Continuing Operations |
|
|
|
|
|
(914 |
) |
|
|
211 |
|
|
Net Earnings (Loss) From Discontinued Operations |
|
8 |
|
|
|
260 |
|
|
- |
|
|
|
Net Earnings (Loss) |
|
|
|
|
|
(654 |
) |
|
|
211 |
|
|
|
|
|
|
|
|
|
|
|
|
|
|
|
Basic and Diluted Earnings (Loss) Per Share ($) |
|
10 |
|
|
|
|
|
|
|
|
|
|
Continuing Operations |
|
|
|
|
|
(0.74 |
) |
|
|
0.25 |
|
|
Discontinued Operations |
|
|
|
|
|
0.21 |
|
|
- |
|
|
|
Net Earnings (Loss) Per Share |
|
|
|
|
|
(0.53 |
) |
|
|
0.25 |
|
|
|
|
|
|
|
|
|
|
|
|
|
|
|
(1) |
The comparative period has been restated to reflect discontinued operations as discussed in Note 8. |
See accompanying Notes to Consolidated Financial Statements (unaudited).
|
Cenovus Energy Inc. |
3 |
For the period ended March 31, 2018 |
CONSOLIDATED STATEMENTS OF COMPREHENSIVE INCOME (LOSS) (unaudited)
For the periods ended March 31,
($ millions)
|
|
|
|
|
|
Three Months Ended |
|
|||||
|
|
Notes |
|
|
|
2018 |
|
|
|
2017 |
|
|
|
|
|
|
|
|
|
|
|
|
|
|
|
|
Net Earnings (Loss) |
|
|
|
|
|
(654 |
) |
|
|
211 |
|
|
Other Comprehensive Income (Loss), Net of Tax |
|
19 |
|
|
|
|
|
|
|
|
|
|
Items That Will Not be Reclassified to Profit or Loss: |
|
|
|
|
|
|
|
|
|
|
|
|
Actuarial Gain (Loss) Relating to Pension and Other Post-Retirement Benefits |
|
|
|
|
|
(7 |
) |
|
|
(3 |
) |
|
Items That May be Reclassified to Profit or Loss: |
|
|
|
|
|
|
|
|
|
|
|
|
Foreign Currency Translation Adjustment |
|
|
|
|
|
120 |
|
|
|
(43 |
) |
|
Total Other Comprehensive Income (Loss), Net of Tax |
|
|
|
|
|
113 |
|
|
|
(46 |
) |
|
Comprehensive Income (Loss) |
|
|
|
|
|
(541 |
) |
|
|
165 |
|
|
|
|
|
|
|
|
|
|
|
|
|
|
See accompanying Notes to Consolidated Financial Statements (unaudited).
|
Cenovus Energy Inc. |
4 |
For the period ended March 31, 2018 |
CONSOLIDATED BALANCE SHEETS (unaudited)
As at
($ millions)
|
|
Notes |
|
March 31, 2018 |
|
|
December 31, 2017 |
|
||
|
|
|
|
|
|
|
|
|
|
|
|
Assets |
|
|
|
|
|
|
|
|
|
|
Current Assets |
|
|
|
|
|
|
|
|
|
|
Cash and Cash Equivalents |
|
|
405 |
|
|
610 |
|
||
|
Accounts Receivable and Accrued Revenues |
|
|
|
1,508 |
|
|
|
1,830 |
|
|
Income Tax Receivable |
|
|
|
100 |
|
|
68 |
|
|
|
Inventories |
11 |
|
|
1,393 |
|
|
|
1,389 |
|
|
Risk Management |
22,23 |
|
43 |
|
|
63 |
|
||
|
Assets Held for Sale |
8 |
|
|
479 |
|
|
|
1,048 |
|
|
Total Current Assets |
|
|
|
3,928 |
|
|
|
5,008 |
|
|
Exploration and Evaluation Assets |
1,12 |
|
|
3,678 |
|
|
|
3,673 |
|
|
Property, Plant and Equipment, Net |
1,13 |
|
|
29,599 |
|
|
|
29,596 |
|
|
Income Tax Receivable |
|
|
266 |
|
|
311 |
|
||
|
Risk Management |
22,23 |
|
8 |
|
|
2 |
|
||
|
Other Assets |
|
|
58 |
|
|
71 |
|
||
|
Goodwill |
|
|
|
2,272 |
|
|
|
2,272 |
|
|
Total Assets |
|
|
|
39,809 |
|
|
|
40,933 |
|
|
|
|
|
|
|
|
|
|
|
|
|
Liabilities and Shareholders’ Equity |
|
|
|
|
|
|
|
|
|
|
Current Liabilities |
|
|
|
|
|
|
|
|
|
|
Accounts Payable and Accrued Liabilities |
|
|
|
2,336 |
|
|
|
2,635 |
|
|
Contingent Payment |
14 |
|
92 |
|
|
38 |
|
||
|
Income Tax Payable |
|
|
18 |
|
|
129 |
|
||
|
Risk Management |
22,23 |
|
|
921 |
|
|
|
1,031 |
|
|
Liabilities Related to Assets Held for Sale |
8 |
|
151 |
|
|
603 |
|
||
|
Total Current Liabilities |
|
|
|
3,518 |
|
|
|
4,436 |
|
|
Long-Term Debt |
15 |
|
|
9,781 |
|
|
|
9,513 |
|
|
Contingent Payment |
14 |
|
231 |
|
|
168 |
|
||
|
Risk Management |
22,23 |
|
12 |
|
|
20 |
|
||
|
Decommissioning Liabilities |
16 |
|
|
1,038 |
|
|
|
1,029 |
|
|
Other Liabilities |
17 |
|
236 |
|
|
173 |
|
||
|
Deferred Income Taxes |
|
|
|
5,612 |
|
|
|
5,613 |
|
|
Total Liabilities |
|
|
|
20,428 |
|
|
|
20,952 |
|
|
Shareholders’ Equity |
|
|
|
19,381 |
|
|
|
19,981 |
|
|
Total Liabilities and Shareholders’ Equity |
|
|
|
39,809 |
|
|
|
40,933 |
|
|
|
|
|
|
|
|
|
|
|
|
See accompanying Notes to Consolidated Financial Statements (unaudited).
|
Cenovus Energy Inc. |
5 |
For the period ended March 31, 2018 |
CONSOLIDATED STATEMENTS OF SHAREHOLDERS’ EQUITY (unaudited)
($ millions)
|
|
Share Capital |
|
|
Paid in Surplus |
|
|
Retained Earnings |
|
|
AOCI (1) |
|
|
Total |
|
|||||
|
|
(Note 18) |
|
|
|
|
|
|
|
|
|
|
(Note 19) |
|
|
|
|
|
||
|
|
|
|
|
|
|
|
|
|
|
|
|
|
|
|
|
|
|
|
|
|
As at December 31, 2016 |
|
5,534 |
|
|
|
4,350 |
|
|
|
796 |
|
|
|
910 |
|
|
|
11,590 |
|
|
Net Earnings (Loss) |
- |
|
|
- |
|
|
|
211 |
|
|
- |
|
|
|
211 |
|
|||
|
Other Comprehensive Income (Loss) |
- |
|
|
- |
|
|
- |
|
|
|
(46 |
) |
|
|
(46 |
) |
|||
|
Total Comprehensive Income (Loss) |
- |
|
|
- |
|
|
|
211 |
|
|
|
(46 |
) |
|
|
165 |
|
||
|
Stock-Based Compensation Expense |
- |
|
|
|
3 |
|
|
- |
|
|
- |
|
|
|
3 |
|
|||
|
Dividends on Common Shares |
- |
|
|
- |
|
|
|
(41 |
) |
|
- |
|
|
|
(41 |
) |
|||
|
As at March 31, 2017 |
|
5,534 |
|
|
|
4,353 |
|
|
|
966 |
|
|
|
864 |
|
|
|
11,717 |
|
|
|
|
|
|
|
|
|
|
|
|
|
|
|
|
|
|
|
|
|
|
|
As at December 31, 2017 |
|
11,040 |
|
|
|
4,361 |
|
|
|
3,937 |
|
|
|
643 |
|
|
|
19,981 |
|
|
Net Earnings (Loss) |
- |
|
|
- |
|
|
|
(654 |
) |
|
- |
|
|
|
(654 |
) |
|||
|
Other Comprehensive Income (Loss) |
- |
|
|
- |
|
|
- |
|
|
|
113 |
|
|
|
113 |
|
|||
|
Total Comprehensive Income (Loss) |
- |
|
|
- |
|
|
|
(654 |
) |
|
|
113 |
|
|
|
(541 |
) |
||
|
Stock-Based Compensation Expense |
- |
|
|
|
1 |
|
|
- |
|
|
- |
|
|
|
1 |
|
|||
|
Dividends on Common Shares |
- |
|
|
- |
|
|
|
(60 |
) |
|
- |
|
|
|
(60 |
) |
|||
|
As at March 31, 2018 |
|
11,040 |
|
|
|
4,362 |
|
|
|
3,223 |
|
|
|
756 |
|
|
|
19,381 |
|
|
|
|
|
|
|
|
|
|
|
|
|
|
|
|
|
|
|
|
|
|
(1)Accumulated Other Comprehensive Income (Loss).
See accompanying Notes to Consolidated Financial Statements (unaudited).
|
Cenovus Energy Inc. |
6 |
For the period ended March 31, 2018 |
CONSOLIDATED STATEMENTS OF CASH FLOWS (unaudited)
For the periods ended March 31,
($ millions)
|
|
|
|
|
|
Three Months Ended |
|
|||||
|
|
Notes |
|
|
|
2018 |
|
|
|
2017 |
|
|
|
|
|
|
|
|
|
|
|
|
|
|
|
|
Operating Activities |
|
|
|
|
|
|
|
|
|
|
|
|
Net Earnings (Loss) |
|
|
|
|
|
(654 |
) |
|
|
211 |
|
|
Depreciation, Depletion and Amortization |
6,13 |
|
|
|
635 |
|
|
|
363 |
|
|
|
Exploration Expense |
6,12 |
|
|
|
2 |
|
|
|
3 |
|
|
|
Deferred Income Taxes |
|
9 |
|
|
|
(8 |
) |
|
|
71 |
|
|
Unrealized (Gain) Loss on Risk Management |
|
22 |
|
|
|
(139 |
) |
|
|
(279 |
) |
|
Unrealized Foreign Exchange (Gain) Loss |
|
5 |
|
|
|
282 |
|
|
|
(72 |
) |
|
Re-measurement of Contingent Payment |
|
14 |
|
|
|
117 |
|
|
- |
|
|
|
(Gain) Loss on Discontinuance |
|
8 |
|
|
|
(344 |
) |
|
- |
|
|
|
(Gain) Loss on Divestiture of Assets |
|
|
|
|
- |
|
|
|
1 |
|
|
|
Unwinding of Discount on Decommissioning Liabilities |
4,16 |
|
|
|
16 |
|
|
|
26 |
|
|
|
Onerous Contract Provisions, Net of Cash Paid |
|
|
|
|
|
56 |
|
|
|
3 |
|
|
Other |
|
|
|
|
|
(4 |
) |
|
|
(4 |
) |
|
Net Change in Other Assets and Liabilities |
|
|
|
|
|
(18 |
) |
|
|
(31 |
) |
|
Net Change in Non-Cash Working Capital |
|
|
|
|
|
(64 |
) |
|
|
36 |
|
|
Cash From (Used in) Operating Activities |
|
|
|
|
|
(123 |
) |
|
|
328 |
|
|
|
|
|
|
|
|
|
|
|
|
|
|
|
Investing Activities |
|
|
|
|
|
|
|
|
|
|
|
|
Capital Expenditures – Exploration and Evaluation Assets |
|
12 |
|
|
|
(8 |
) |
|
|
(43 |
) |
|
Capital Expenditures – Property, Plant and Equipment |
|
13 |
|
|
|
(521 |
) |
|
|
(270 |
) |
|
Acquisition Deposit |
|
|
|
|
- |
|
|
|
(173 |
) |
|
|
Proceeds From Divestiture of Assets |
|
|
|
|
|
453 |
|
|
- |
|
|
|
Net Change in Investments and Other |
|
|
|
|
|
6 |
|
|
- |
|
|
|
Net Change in Non-Cash Working Capital |
|
|
|
|
|
31 |
|
|
|
27 |
|
|
Cash From (Used in) Investing Activities |
|
|
|
|
|
(39 |
) |
|
|
(459 |
) |
|
|
|
|
|
|
|
|
|
|
|
|
|
|
Net Cash Provided (Used) Before Financing Activities |
|
|
|
|
|
(162 |
) |
|
|
(131 |
) |
|
|
|
|
|
|
|
|
|
|
|
|
|
|
Financing Activities |
|
24 |
|
|
|
|
|
|
|
|
|
|
Net Issuance (Repayment) of Revolving Long-Term Debt |
|
15 |
|
|
|
1 |
|
|
- |
|
|
|
Dividends Paid on Common Shares |
|
10 |
|
|
|
(60 |
) |
|
|
(41 |
) |
|
Acquisition Financing Costs |
|
|
|
|
- |
|
|
|
(10 |
) |
|
|
Other |
|
|
|
|
- |
|
|
|
(1 |
) |
|
|
Cash From (Used in) Financing Activities |
|
|
|
|
|
(59 |
) |
|
|
(52 |
) |
|
|
|
|
|
|
|
|
|
|
|
|
|
|
Foreign Exchange Gain (Loss) on Cash and Cash Equivalents Held in Foreign Currency |
|
|
|
|
|
16 |
|
|
|
11 |
|
|
Increase (Decrease) in Cash and Cash Equivalents |
|
|
|
|
|
(205 |
) |
|
|
(172 |
) |
|
Cash and Cash Equivalents, Beginning of Period |
|
|
|
|
|
610 |
|
|
|
3,720 |
|
|
Cash and Cash Equivalents, End of Period |
|
|
|
|
|
405 |
|
|
|
3,548 |
|
|
|
|
|
|
|
|
|
|
|
|
|
|
See accompanying Notes to Consolidated Financial Statements (unaudited).
|
Cenovus Energy Inc. |
7 |
For the period ended March 31, 2018 |
NOTES TO CONSOLIDATED FINANCIAL STATEMENTS (unaudited)
All amounts in $ millions, unless otherwise indicated
For the period ended March 31, 2018
1. DESCRIPTION OF BUSINESS AND SEGMENTED DISCLOSURES
Cenovus Energy Inc. and its subsidiaries, (together “Cenovus” or the “Company”) are in the business of developing, producing and marketing crude oil, natural gas liquids (“NGLs”) and natural gas in Canada with marketing activities and refining operations in the United States (“U.S.”).
Cenovus is incorporated under the Canada Business Corporations Act and its shares are listed on the Toronto (“TSX”) and New York (“NYSE”) stock exchanges. The executive and registered office is located at 2600, 500 Centre Street S.E., Calgary, Alberta, Canada, T2G 1A6. Information on the Company’s basis of preparation for these interim Consolidated Financial Statements is found in Note 2.
Management has determined the operating segments based on information regularly reviewed for the purposes of decision making, allocating resources and assessing operational performance by Cenovus’s chief operating decision makers. The Company evaluates the financial performance of its operating segments primarily based on operating margin. The Company’s reportable segments are:
|
|
• |
Oil Sands, which includes the development and production of bitumen and natural gas in northeast Alberta. Cenovus’s bitumen assets include Foster Creek, Christina Lake and Narrows Lake as well as other projects in the early stages of development. The Company’s interest in certain of its operated oil sands properties, notably Foster Creek, Christina Lake and Narrows Lake, increased from 50 percent to 100 percent on May 17, 2017. |
|
|
• |
Deep Basin, which includes approximately three million net acres of land primarily in the Elmworth‑Wapiti, Kaybob-Edson, and Clearwater operating areas, rich in natural gas and NGLs. The assets reside in Alberta and British Columbia and include interests in numerous natural gas processing facilities. These assets were acquired on May 17, 2017. |
|
|
• |
Refining and Marketing, which is responsible for transporting, selling and refining crude oil into petroleum and chemical products. Cenovus jointly owns two refineries in the U.S. with the operator Phillips 66, an unrelated U.S. public company. In addition, Cenovus owns and operates a crude-by-rail terminal in Alberta. This segment coordinates Cenovus’s marketing and transportation initiatives to optimize product mix, delivery points, transportation commitments and customer diversification. The marketing of crude oil and natural gas sourced from Canada, including physical product sales that settle in the U.S., is considered to be undertaken by a Canadian business. U.S. sourced crude oil and natural gas purchases and sales are attributed to the U.S. |
|
|
• |
Corporate and Eliminations, which primarily includes unrealized gains and losses recorded on derivative financial instruments, gains and losses on divestiture of assets, as well as other Cenovus-wide costs for general and administrative, financing activities and research costs. As financial instruments are settled, the realized gains and losses are recorded in the reportable segment to which the derivative instrument relates. Eliminations include adjustments for internal usage of natural gas production between segments, crude oil production used as feedstock by the Refining and Marketing segment, and unrealized intersegment profits in inventory. Eliminations are recorded at transfer prices based on current market prices. The Corporate and Eliminations segment is attributed to Canada, with the exception of unrealized risk management gains and losses, which have been attributed to the country in which the transacting entity resides. |
In 2017, the Company announced its intention to divest of its Conventional segment that included its heavy oil assets at Pelican Lake, the CO2 enhanced oil recovery project at Weyburn and conventional crude oil, NGLs and natural gas assets in the Suffield and Palliser areas in southern Alberta. As such, the associated results of operations have been reported as a discontinued operation (see Note 8). As at January 5, 2018, all of the Company’s Conventional assets were sold.
The following tabular financial information presents the segmented information first by segment, then by product and geographic location.
|
Cenovus Energy Inc. |
8 |
For the period ended March 31, 2018 |
NOTES TO CONSOLIDATED FINANCIAL STATEMENTS (unaudited)
All amounts in $ millions, unless otherwise indicated
For the period ended March 31, 2018
|
|
Oil Sands |
Deep Basin |
|
|
Refining and Marketing |
|
|||||||||||||||||
|
For the three months ended March 31, |
2018 |
|
|
2017 |
|
|
2018 |
|
|
2017 |
|
|
2018 |
|
|
2017 |
|
||||||
|
Revenues |
|
|
|
|
|
|
|
|
|
|
|
|
|
|
|
|
|
|
|
|
|
|
|
|
Gross Sales |
|
2,406 |
|
|
|
1,062 |
|
|
|
259 |
|
|
- |
|
|
|
2,232 |
|
|
|
2,604 |
|
|
|
Less: Royalties |
|
58 |
|
|
|
27 |
|
|
|
35 |
|
|
- |
|
|
- |
|
|
- |
|
|||
|
|
|
2,348 |
|
|
|
1,035 |
|
|
|
224 |
|
|
- |
|
|
|
2,232 |
|
|
|
2,604 |
|
|
|
Expenses |
|
|
|
|
|
|
|
|
|
|
|
|
|
|
|
|
|
|
|
|
|
|
|
|
Purchased Product |
- |
|
|
- |
|
|
- |
|
|
- |
|
|
|
1,957 |
|
|
|
2,330 |
|
||||
|
Transportation and Blending |
|
1,492 |
|
|
|
566 |
|
|
|
25 |
|
|
- |
|
|
- |
|
|
- |
|
|||
|
Operating |
|
296 |
|
|
|
140 |
|
|
|
91 |
|
|
- |
|
|
|
318 |
|
|
|
219 |
|
|
|
(Gain) Loss on Risk Management |
|
454 |
|
|
|
77 |
|
|
|
9 |
|
|
- |
|
|
|
5 |
|
|
|
2 |
|
|
|
Operating Margin |
|
106 |
|
|
|
252 |
|
|
|
99 |
|
|
- |
|
|
|
(48 |
) |
|
|
53 |
|
|
|
Depreciation, Depletion and Amortization |
|
362 |
|
|
|
170 |
|
|
|
204 |
|
|
- |
|
|
|
54 |
|
|
|
54 |
|
|
|
Exploration Expense |
|
2 |
|
|
- |
|
|
- |
|
|
- |
|
|
- |
|
|
- |
|
|||||
|
Segment Income (Loss) |
|
(258 |
) |
|
|
82 |
|
|
|
(105 |
) |
|
- |
|
|
|
(102 |
) |
|
|
(1 |
) |
|
|
|
|
|
|
|
|
|
|
|
|
|
|
|
|
|
|
|
|
|
|
|
|
|
|
|
|
|
|
|
|
|
|
|
|
Corporate and Eliminations |
|
|
Consolidated |
|
||||||||||
|
For the three months ended March 31, |
|
|
|
|
|
|
|
|
2018 |
|
|
2017 |
|
|
2018 |
|
|
2017 |
|
||||
|
Revenues |
|
|
|
|
|
|
|
|
|
|
|
|
|
|
|
|
|
|
|
|
|
|
|
|
Gross Sales |
|
|
|
|
|
|
|
|
|
(194 |
) |
|
|
(98 |
) |
|
|
4,703 |
|
|
|
3,568 |
|
|
Less: Royalties |
|
|
|
|
|
|
|
|
- |
|
|
- |
|
|
|
93 |
|
|
|
27 |
|
||
|
|
|
|
|
|
|
|
|
|
|
(194 |
) |
|
|
(98 |
) |
|
|
4,610 |
|
|
|
3,541 |
|
|
Expenses |
|
|
|
|
|
|
|
|
|
|
|
|
|
|
|
|
|
|
|
|
|
|
|
|
Purchased Product |
|
|
|
|
|
|
|
|
|
(128 |
) |
|
|
(96 |
) |
|
|
1,829 |
|
|
|
2,234 |
|
|
Transportation and Blending |
|
|
|
|
|
|
|
|
|
(3 |
) |
|
|
(2 |
) |
|
|
1,514 |
|
|
|
564 |
|
|
Operating |
|
|
|
|
|
|
|
|
|
(63 |
) |
|
|
(1 |
) |
|
|
642 |
|
|
|
358 |
|
|
(Gain) Loss on Risk Management |
|
|
|
|
|
|
|
|
|
(138 |
) |
|
|
(279 |
) |
|
|
330 |
|
|
|
(200 |
) |
|
Depreciation, Depletion and Amortization |
|
|
|
|
|
|
|
|
|
15 |
|
|
|
18 |
|
|
|
635 |
|
|
|
242 |
|
|
Exploration Expense |
|
|
|
|
|
|
|
|
- |
|
|
- |
|
|
|
2 |
|
|
- |
|
|||
|
Segment Income (Loss) |
|
|
|
|
|
|
|
|
|
123 |
|
|
|
262 |
|
|
|
(342 |
) |
|
|
343 |
|
|
General and Administrative |
|
|
|
|
|
|
|
|
|
179 |
|
|
|
43 |
|
|
|
179 |
|
|
|
43 |
|
|
Finance Costs |
|
|
|
|
|
|
|
|
|
150 |
|
|
|
99 |
|
|
|
150 |
|
|
|
99 |
|
|
Interest Income |
|
|
|
|
|
|
|
|
|
(3 |
) |
|
|
(17 |
) |
|
|
(3 |
) |
|
|
(17 |
) |
|
Foreign Exchange (Gain) Loss, Net |
|
|
|
|
|
|
|
|
|
277 |
|
|
|
(76 |
) |
|
|
277 |
|
|
|
(76 |
) |
|
Transaction Costs |
|
|
|
|
|
|
|
|
- |
|
|
|
29 |
|
|
- |
|
|
|
29 |
|
||
|
Re-measurement of Contingent Payment |
|
|
|
|
|
|
|
|
|
117 |
|
|
- |
|
|
|
117 |
|
|
- |
|
||
|
Research Costs |
|
|
|
|
|
|
|
|
|
12 |
|
|
|
4 |
|
|
|
12 |
|
|
|
4 |
|
|
(Gain) Loss on Divestiture of Assets |
|
|
|
|
|
|
|
|
- |
|
|
|
1 |
|
|
- |
|
|
|
1 |
|
||
|
Other (Income) Loss, Net |
|
|
|
|
|
|
|
|
|
(2 |
) |
|
- |
|
|
|
(2 |
) |
|
- |
|
||
|
|
|
|
|
|
|
|
|
|
|
730 |
|
|
|
83 |
|
|
|
730 |
|
|
|
83 |
|
|
Earnings (Loss) From Continuing Operations Before Income Tax |
|
|
|
|
|
|
|
|
|
|
|
(1,072 |
) |
|
|
260 |
|
||||||
|
Income Tax Expense (Recovery) |
|
|
|
|
|
|
|
|
|
|
|
|
|
|
|
|
|
(158 |
) |
|
|
49 |
|
|
Net Earnings (Loss) From Continuing Operations |
|
|
|
|
|
|
|
|
|
|
|
|
|
|
|
(914 |
) |
|
|
211 |
|
||
|
Cenovus Energy Inc. |
9 |
For the period ended March 31, 2018 |
NOTES TO CONSOLIDATED FINANCIAL STATEMENTS (unaudited)
All amounts in $ millions, unless otherwise indicated
For the period ended March 31, 2018
|
|
Three Months Ended |
|
|||||
|
For the periods ended March 31, |
|
2018 |
|
|
|
2017 |
|
|
Upstream |
|
|
|
|
|
|
|
|
Crude Oil |
|
2,379 |
|
|
|
1,028 |
|
|
Natural Gas |
|
105 |
|
|
|
4 |
|
|
NGLs |
|
74 |
|
|
- |
|
|
|
Other |
|
14 |
|
|
|
3 |
|
|
Refined Product |
|
1,763 |
|
|
|
1,641 |
|
|
Market Optimization |
|
469 |
|
|
|
963 |
|
|
Corporate and Eliminations |
|
(194 |
) |
|
|
(98 |
) |
|
Revenues From Continuing Operations |
|
4,610 |
|
|
|
3,541 |
|
C) Geographical Information
|
|
Revenues |
|
|||||
|
|
Three Months Ended |
|
|||||
|
For the periods ended March 31, |
|
2018 |
|
|
|
2017 |
|
|
Canada |
|
2,847 |
|
|
|
1,859 |
|
|
United Sates |
|
1,763 |
|
|
|
1,682 |
|
|
Consolidated |
|
4,610 |
|
|
|
3,541 |
|
|
|
Non-Current Assets (1) |
|
|||||
|
As at |
March 31, 2018 |
|
|
December 31, 2017 |
|
||
|
Canada (2) |
|
31,643 |
|
|
|
31,756 |
|
|
United States |
|
3,964 |
|
|
|
3,856 |
|
|
Consolidated |
|
35,607 |
|
|
|
35,612 |
|
|
(1) |
Includes exploration and evaluation (“E&E”) assets, property, plant and equipment (“PP&E”), goodwill and other assets. |
|
(2) |
Certain crude oil and natural gas properties of the Conventional and Deep Basin segments, which reside in Canada, were reclassified as held for sale in current assets. |
D) Exploration and Evaluation Assets, Property, Plant and Equipment, Goodwill and Total Assets
|
|
E&E |
|
|
PP&E |
|
||||||||||
|
As at |
March 31, 2018 |
|
|
December 31, 2017 |
|
|
March 31, 2018 |
|
|
December 31, 2017 |
|
||||
|
Oil Sands |
|
622 |
|
|
|
617 |
|
|
|
22,277 |
|
|
|
22,320 |
|
|
Deep Basin |
|
3,056 |
|
|
|
3,056 |
|
|
|
2,967 |
|
|
|
3,019 |
|
|
Refining and Marketing |
- |
|
|
- |
|
|
|
4,074 |
|
|
|
3,967 |
|
||
|
Corporate and Eliminations |
- |
|
|
- |
|
|
|
281 |
|
|
|
290 |
|
||
|
Consolidated |
|
3,678 |
|
|
|
3,673 |
|
|
|
29,599 |
|
|
|
29,596 |
|
|
|
Goodwill |
|
|
Total Assets |
|
||||||||||
|
As at |
March 31, 2018 |
|
|
December 31, 2017 |
|
|
March 31, 2018 |
|
|
December 31, 2017 |
|
||||
|
Oil Sands |
|
2,272 |
|
|
|
2,272 |
|
|
|
26,592 |
|
|
|
26,799 |
|
|
Deep Basin |
- |
|
|
- |
|
|
|
6,676 |
|
|
|
6,694 |
|
||
|
Conventional |
- |
|
|
- |
|
|
|
54 |
|
|
|
644 |
|
||
|
Refining and Marketing |
- |
|
|
- |
|
|
|
5,343 |
|
|
|
5,432 |
|
||
|
Corporate and Eliminations |
- |
|
|
- |
|
|
|
1,144 |
|
|
|
1,364 |
|
||
|
Consolidated |
|
2,272 |
|
|
|
2,272 |
|
|
|
39,809 |
|
|
|
40,933 |
|
|
Cenovus Energy Inc. |
10 |
For the period ended March 31, 2018 |
NOTES TO CONSOLIDATED FINANCIAL STATEMENTS (unaudited)
All amounts in $ millions, unless otherwise indicated
For the period ended March 31, 2018
|
|
Three Months Ended |
|
|||||
|
For the periods ended March 31, |
|
2018 |
|
|
|
2017 |
|
|
Capital Investment |
|
|
|
|
|
|
|
|
Oil Sands |
|
318 |
|
|
|
172 |
|
|
Deep Basin |
|
145 |
|
|
- |
|
|
|
Conventional |
|
2 |
|
|
|
88 |
|
|
Refining and Marketing |
|
53 |
|
|
|
46 |
|
|
Corporate and Eliminations |
|
6 |
|
|
|
7 |
|
|
|
|
524 |
|
|
|
313 |
|
|
Acquisition Capital |
|
|
|
|
|
|
|
|
Deep Basin |
|
5 |
|
|
- |
|
|
|
Total Capital Expenditures |
|
529 |
|
|
|
313 |
|
|
(1) |
Includes expenditures on PP&E, E&E assets and assets held for sale. |
2. BASIS OF PREPARATION AND STATEMENT OF COMPLIANCE
In these interim Consolidated Financial Statements, unless otherwise indicated, all dollars are expressed in Canadian dollars. All references to C$ or $ are to Canadian dollars and references to US$ are to U.S. dollars.
These interim Consolidated Financial Statements have been prepared in accordance with International Financial Reporting Standards (“IFRS”) as issued by the International Accounting Standards Board (“IASB”) applicable to the preparation of interim financial statements, including International Accounting Standard 34, “Interim Financial Reporting” (“IAS 34”), and have been prepared following the same accounting policies and methods of computation as the annual Consolidated Financial Statements for the year ended December 31, 2017, except as identified in Note 3 and for income taxes. Income taxes on earnings or loss in the interim periods are accrued using the income tax rate that would be applicable to the expected total annual earnings or loss.
Certain information and disclosures normally included in the notes to the annual Consolidated Financial Statements have been condensed or have been disclosed on an annual basis only. Accordingly, these interim Consolidated Financial Statements should be read in conjunction with the annual Consolidated Financial Statements for the year ended December 31, 2017, which have been prepared in accordance with IFRS as issued by the IASB.
These interim Consolidated Financial Statements were approved by the Audit Committee effective April 24, 2018.
3. CHANGES IN ACCOUNTING POLICIES
A) Adoption of IFRS 9, “Financial Instruments”
Effective January 1, 2018, the Company adopted IFRS 9, “Financial Instruments” (“IFRS 9”), which replaced IAS 39, “Financial Instruments: Recognition and Measurement” (“IAS 39”). The Company applied the new standard retrospectively and, in accordance with the transitional provisions, comparative figures have not been restated. The adoption of IFRS 9 did not have a material impact on the Company’s Consolidated Financial Statements.
The nature and effects of the key changes to the Company’s accounting policies resulting from the adoption of IFRS 9 are summarized below.
Classification of Financial Assets and Financial Liabilities
IFRS 9 contains three principal classification categories for financial assets: measured at amortized cost, fair value through other comprehensive income (“FVOCI”) and fair value through profit or loss (“FVTPL”). The previous IAS 39 categories of held to maturity, loans and receivables and available for sale are eliminated. IFRS 9 bases the classification of financial assets on the contractual cash flow characteristics and the company’s business model for managing the financial asset. Additionally, embedded derivatives are not separated if the host contract is a financial asset within the scope of IFRS 9. Instead, the entire hybrid contract is assessed for classification and measurement.
IFRS 9 largely retains the existing requirements in IAS 39 for the classification of financial liabilities. The differences between the two standards did not impact the Company at the time of transition.
|
Cenovus Energy Inc. |
11 |
For the period ended March 31, 2018 |
NOTES TO CONSOLIDATED FINANCIAL STATEMENTS (unaudited)
All amounts in $ millions, unless otherwise indicated
For the period ended March 31, 2018
Impairment of Financial Assets
IFRS 9 replaces the ‘incurred loss’ model in IAS 39 with an ‘expected credit loss’ (“ECL”) model. The new impairment model applies to financial assets measured at amortized cost, contract assets and debt investments measured at FVOCI. Under IFRS 9, credit losses will be recognized earlier than under IAS 39.
The ECL model applies to the Company’s receivables. As at March 31, 2018, over 90 percent of the Company’s trade accounts receivable were investment grade, and 99 percent were outstanding for less than 60 days. The average expected credit loss on the Company’s trade accounts receivable was 0.3 percent as at March 31, 2018.
Transition
On January 1, 2018, the Company:
|
|
• |
Identified the business model used to manage its financial assets and classified its financial instruments into the appropriate IFRS 9 category; |
|
|
• |
Designated certain investments in private equity instruments, that were previously classified as available for sale, as FVOCI; and |
|
|
• |
Applied the ECL model to financial assets classified as measured at amortized cost. |
The classification and measurement of financial instruments under IFRS 9 did not have a material impact on the Company’s opening retained earnings as at January 1, 2018. In addition, the application of the ECL model to financial assets classified as measured at amortized cost did not result in a material adjustment on transition.
The following table shows the original measurement categories under IAS 39 and the new measurement categories under IFRS 9 as at January 1, 2018 for each class of the Company’s financial assets and financial liabilities. The Company has no contract assets or debt investments measured at FVOCI.
|
|
Measurement Category (1) |
||
|
Financial Instrument |
IAS 39 |
|
IFRS 9 |
|
Cash and Cash Equivalents |
Loans and Receivables |
|
Amortized Cost |
|
Accounts Receivable and Accrued Revenues |
Loans and Receivables |
|
Amortized Cost |
|
Risk Management Assets |
FVTPL |
|
FVTPL |
|
Equity Investments |
Available for Sale Financial Assets |
|
FVOCI |
|
Long-term Receivables |
Loans and Receivables |
|
Amortized Cost |
|
Accounts Payable and Accrued Liabilities |
Financial Liabilities Measured at Amortized Cost |
|
Amortized Cost |
|
Risk Management Liabilities |
FVTPL |
|
FVTPL |
|
Contingent Payment |
FVTPL |
|
FVTPL |
|
Short-Term Borrowings |
Financial Liabilities Measured at Amortized Cost |
|
Amortized Cost |
|
Long-Term Debt |
Financial Liabilities Measured at Amortized Cost |
|
Amortized Cost |
|
(1) |
There were no adjustments to the carrying amounts of financial instruments as a result of the change in classification from IAS 39 to IFRS 9. |
B) Adoption of IFRS 15, “Revenues From Contracts With Customers”
Effective January 1, 2018, the Company adopted IFRS 15, “Revenue From Contracts With Customers” (“IFRS 15”) replacing IAS 11, “Construction Contracts”, IAS 18, “Revenue” and several revenue-related interpretations. Cenovus adopted IFRS 15 using the modified retrospective with cumulative effect approach using the following practical expedients:
|
|
• |
Electing to apply the standard retrospectively only to contracts that were not completed contracts on January 1, 2018; and |
|
|
• |
For modified contracts, evaluating the original contract together with any contract modifications at the date of initial application. |
The adoption of IFRS 15 did not materially impact the timing or measurement of revenue. However, IFRS 15 contains new disclosure requirements.
C) Update to Significant Accounting Policies
Financial Instruments
The Company applied IFRS 9 retrospectively, but elected not to restate comparative information. As such, the comparative information provided continues to be accounted for in accordance with the Company’s previous accounting policy found in the annual Consolidated Financial Statements for the year ended December 31, 2017.
The following accounting policy is applicable from January 1, 2018:
Financial instruments are recognized when the Company becomes a party to the contractual provisions of the instrument. Financial assets and liabilities are not offset unless the Company has the current legal right to offset and intends to settle on a net basis or settle the asset and liability simultaneously.
|
Cenovus Energy Inc. |
12 |
For the period ended March 31, 2018 |
NOTES TO CONSOLIDATED FINANCIAL STATEMENTS (unaudited)
All amounts in $ millions, unless otherwise indicated
For the period ended March 31, 2018
The Company characterizes its fair value measurements into a three-level hierarchy depending on the degree to which the inputs are observable, as follows:
|
|
• |
Level 1 inputs are quoted prices in active markets for identical assets and liabilities; |
|
|
• |
Level 2 inputs are inputs, other than quoted prices included within Level 1, that are observable for the asset or liability either directly or indirectly; and |
|
|
• |
Level 3 inputs are unobservable inputs for the asset or liability. |
Classification and Measurement of Financial Assets
The initial classification of a financial asset depends upon the Company’s business model for managing its financial assets and the contractual terms of the cash flows. There are three measurement categories into which the Company classified its financial assets:
|
|
• |
Amortized Cost: Includes assets that are held within a business model whose objective is to hold assets to collect contractual cash flows and its contractual terms give rise on specified dates to cash flows that represent solely payments of principal and interest; |
|
|
• |
FVOCI: Includes assets that are held within a business model whose objective is achieved by both collecting contractual cash flows and selling the financial assets, where its contractual terms give rise on specified dates to cash flows that represent solely payments of principal and interest; or |
|
|
• |
FVTPL: Includes assets that do not meet the criteria for amortized cost or FVOCI and are measured at fair value through profit or loss. This includes all derivative financial assets. |
On initial recognition, the Company may irrevocably designate a financial asset that meets the amortized cost or FVOCI criteria as measured at FVTPL if doing so eliminates or significantly reduces an accounting mismatch. On initial recognition of an equity investment that is not held-for-trading, the Company may irrevocably elect to present subsequent changes in the investment’s fair value in OCI. There is no subsequent reclassification of fair value changes to earnings following the derecognition of the investment. However, dividends that reflect a return on investment continue to be recognized in net earnings. This election is made on an investment-by-investment basis.
At initial recognition, the Company measures a financial asset at its fair value and, in the case of a financial asset not at FVTPL, including transaction costs that are directly attributable to the acquisition of the financial asset. Transaction costs of financial assets carried at FVTPL are recorded as an expense in net earnings.
Financial assets are reclassified subsequent to their initial recognition only if the business model for managing those financial assets changes. The affected financial assets will be reclassified on the first day of the first reporting period following the change in the business model.
A financial asset is derecognized when the rights to receive cash flows from the asset have expired or have been transferred and the Company has transferred substantially all the risks and rewards of ownership.
Impairment of Financial Assets
The Company recognizes loss allowances for ECLs on its financial assets measured at amortized cost. Due to the nature of its financial assets, Cenovus measures loss allowances at an amount equal to expected lifetime ECLs. Lifetime ECLs are the anticipated ECLs that result from all possible default events over the expected life of a financial asset. ECLs are a probability-weighted estimate of credit losses. Credit losses are measured as the present value of all cash shortfalls (i.e. the difference between the cash flows due to the entity in accordance with the contract and the cash flows that the Company expects to receive). ECLs are discounted at the effective interest rate of the related financial asset. The Company does not have any financial assets that contain a financing component.
Classification and Measurement of Financial Liabilities
A financial liability is initially classified as measured at amortized cost or FVTPL. A financial liability is classified as measured at FVTPL if it is held-for-trading, a derivative, or designated as FVTPL on initial recognition. The classification of a financial liability is irrevocable.
Financial liabilities at FVTPL (other than financial liabilities designated at FVTPL) are measured at fair value with changes in fair value, along with any interest expense, recognized in net earnings. Other financial liabilities are initially measured at fair value less directly attributable transaction costs and are subsequently measured at amortized cost using the effective interest method. Interest expense and foreign exchange gains and losses are recognized in net earnings. Any gain or loss on derecognition is also recognized in net earnings.
|
Cenovus Energy Inc. |
13 |
For the period ended March 31, 2018 |
NOTES TO CONSOLIDATED FINANCIAL STATEMENTS (unaudited)
All amounts in $ millions, unless otherwise indicated
For the period ended March 31, 2018
A financial liability is derecognized when the obligation is discharged, cancelled or expired. When an existing financial liability is replaced by another from the same counterparty with substantially different terms, or the terms of an existing liability are substantially modified, it is treated as a derecognition of the original liability and the recognition of a new liability. When the terms of an existing financial liability are altered, but the changes are considered non-substantial, it is accounted for as a modification to the existing financial liability. Where a liability is substantially modified it is considered to be extinguished and a gain or loss is recognized in net earnings based on the difference between the carrying amount of the liability derecognized and the fair value of the revised liability. Where a liability is modified in a non-substantial way, the amortized cost of the liability is remeasured based on the new cash flows and a gain or loss is recorded in net earnings.
Derivatives
Derivative financial instruments are used to manage economic exposure to market risks relating to commodity prices, foreign currency exchange rates and interest rates. Policies and procedures are in place with respect to required documentation and approvals for the use of derivative financial instruments. Where specific financial instruments are executed, the Company assesses, both at the time of purchase and on an ongoing basis, whether the financial instrument used in the particular transaction is effective in offsetting changes in fair values or cash flows of the transaction.
Risk management assets and liabilities are derivative financial instruments classified as measured at FVTPL unless designated for hedge accounting. Derivative instruments that do not qualify as hedges, or are not designated as hedges, are recorded using mark-to-market accounting whereby instruments are recorded in the Consolidated Balance Sheets as either an asset or liability with changes in fair value recognized in net earnings as a gain or loss on risk management. The estimated fair value of all derivative instruments is based on quoted market prices or, in their absence, third-party market indications and forecasts.
Revenue Recognition
Revenue is measured based on the consideration specified in a contract with a customer and excludes amounts collected on behalf of third parties. Cenovus recognizes revenue when it transfers control of the product or service to a customer, which is generally when title passes from the Company to its customer.
Purchases and sales of products that are entered into in contemplation of each other with the same counterparty are recorded on a net basis. Revenues associated with services provided as agent are recorded as the services are provided.
Cenovus recognizes revenue from the following major products and services:
|
|
• |
Sale of crude oil, natural gas and NGLs; |
|
|
• |
Sale of petroleum and refined products; |
|
|
• |
Marketing and transportation services; and |
|
|
• |
Fee-for-service hydrocarbon trans-loading services. |
The Company satisfies its performance obligations in contracts with customers upon the delivery of crude oil, natural gas, NGLs and petroleum and refined products, which is generally at a point in time. Performance obligations for marketing, transportation services and trans-loading services are satisfied over time as the service is provided. Cenovus sells its production of crude oil, natural gas, NGLs and petroleum and refined products pursuant to variable price contracts. The transaction price for variable price contracts is based on the commodity price, adjusted for quality, location and other factors. The amount of revenue recognized is based on the agreed transaction price with any variability in transaction price recognized in the same period. Fees associated with marketing, transportation services and trans-loading services are based on fixed price contracts.
Cenovus’s revenue transactions do not contain significant financing components and payments are typically due within 30 days of revenue recognition. The Company does not adjust transaction prices for the effects of a significant financing component when the period between the transfer of the promised goods or services to the customer and payment by the customer is less than one year. The Company does not disclose information about remaining performance obligations that have an original expected duration of one year or less and it does not have any long-term contracts with unfulfilled performance obligations.
D) New Accounting Standards and Interpretations not yet Adopted
A description of additional accounting standards and interpretations that will be adopted in future periods can be found in the notes to the annual Consolidated Financial Statements for the year ended December 31, 2017.
|
Cenovus Energy Inc. |
14 |
For the period ended March 31, 2018 |
NOTES TO CONSOLIDATED FINANCIAL STATEMENTS (unaudited)
All amounts in $ millions, unless otherwise indicated
For the period ended March 31, 2018
|
|
Three Months Ended |
|
|||||
|
For the periods ended March 31, |
|
2018 |
|
|
|
2017 |
|
|
Interest Expense – Short-Term Borrowings and Long-Term Debt |
|
128 |
|
|
|
85 |
|
|
Unwinding of Discount on Decommissioning Liabilities (Note 16) |
|
16 |
|
|
|
5 |
|
|
Other |
|
6 |
|
|
|
9 |
|
|
|
|
150 |
|
|
|
99 |
|
5. FOREIGN EXCHANGE (GAIN) LOSS, NET
|
|
Three Months Ended |
|
|||||
|
For the periods ended March 31, |
|
2018 |
|
|
|
2017 |
|
|
Unrealized Foreign Exchange (Gain) Loss on Translation of: |
|
|
|
|
|
|
|
|
U.S. Dollar Debt Issued From Canada |
|
267 |
|
|
|
(56 |
) |
|
Other |
|
15 |
|
|
|
(16 |
) |
|
Unrealized Foreign Exchange (Gain) Loss |
|
282 |
|
|
|
(72 |
) |
|
Realized Foreign Exchange (Gain) Loss |
|
(5 |
) |
|
|
(4 |
) |
|
|
|
277 |
|
|
|
(76 |
) |
A) Cash-Generating Unit Impairments
2018 Upstream Impairments
On a quarterly basis, the Company assesses its cash-generating units (“CGUs”) for indicators of impairment or when facts and circumstances suggest the carrying amount may exceed its recoverable amount. As at March 31, 2018, the book value of the Company’s net assets was greater than its market capitalization. This was considered to be a potential indicator of impairment and the Company proceeded to consider other relevant facts and circumstances, including forward commodity prices. Forward natural gas prices have declined approximately seven percent since the Company tested its upstream CGUs for impairment as at December 31, 2017, while forward crude oil prices increased slightly. There have been no material changes to forward cost estimates nor the nature of the Company’s operations compared with those used in the Company’s December 31, 2017 impairment tests. As at March 31, 2018, there was no impairment of goodwill or the Company’s Oil Sands CGUs.
The decline in forward natural gas prices since December 31, 2017 was identified as an indicator of impairment, and, as a result, CGUs with natural gas reserves were tested for impairment. As at March 31, 2018, the Company determined that the carrying amount of the Clearwater CGU exceeded its recoverable amount resulting in an impairment loss of $100 million. The impairment was recorded as additional depreciation, depletion and amortization (“DD&A”) in the Deep Basin segment. Future cash flows for the CGU declined due to lower forward natural gas prices. As at March 31, 2018, the recoverable amount of the Clearwater CGU was estimated to be approximately $322 million.
Key Assumptions
The recoverable amounts of Cenovus’s upstream CGUs were determined based on fair value less costs of disposal or an evaluation of comparable asset transactions. Key assumptions in the determination of future cash flows from reserves include crude oil and natural gas prices, costs to develop and the discount rate. All reserves have been evaluated as at December 31, 2017 by the Company’s independent qualified reserves evaluators.
For the purpose of impairment testing, goodwill is allocated to the CGU to which it relates.
|
Cenovus Energy Inc. |
15 |
For the period ended March 31, 2018 |
NOTES TO CONSOLIDATED FINANCIAL STATEMENTS (unaudited)
All amounts in $ millions, unless otherwise indicated
For the period ended March 31, 2018
Crude Oil, NGLs and Natural Gas Prices
The forward prices as at March 31, 2018, used to determine future cash flows from crude oil, NGLs and natural gas reserves were:
|
|
Remainder of 2018 |
|
|
2019 |
|
|
2020 |
|
|
2021 |
|
|
2022 |
|
|
Average Annual Increase Thereafter |
|
||||||
|
WTI (US$/barrel) (1) |
|
61.67 |
|
|
|
63.67 |
|
|
|
65.83 |
|
|
|
69.50 |
|
|
|
72.19 |
|
|
|
2.2 |
% |
|
WCS (C$/barrel) (2) |
|
53.86 |
|
|
|
59.39 |
|
|
|
62.60 |
|
|
|
66.00 |
|
|
|
67.85 |
|
|
|
2.3 |
% |
|
Edmonton C5+ (C$/barrel) |
|
78.43 |
|
|
|
78.91 |
|
|
|
79.42 |
|
|
|
82.72 |
|
|
|
84.74 |
|
|
|
2.2 |
% |
|
AECO (C$/Mcf) (3) (4) |
|
2.12 |
|
|
|
2.43 |
|
|
|
2.93 |
|
|
|
3.23 |
|
|
|
3.48 |
|
|
|
2.1 |
% |
|
(1) |
West Texas Intermediate (“WTI”). |
|
(2) |
Western Canadian Select (“WCS”). |
|
(3) |
Alberta Energy Company (“AECO”) natural gas. |
|
(4) |
Assumes gas heating value of one million British thermal units (“MMBtu”) per thousand cubic feet. |
Discount and Inflation Rates
Discounted future cash flows are determined by applying a discount rate between 10 percent and 15 percent based on the individual characteristics of the CGU, and other economic and operating factors. Inflation is estimated at two percent.
Sensitivities
The sensitivity analysis below shows the impact that a change in the discount rate or forward commodity prices would have on impairment testing for the following CGU:
|
|
Increase (Decrease) to Impairment |
|
|||||||||||||
|
|
One Percent Increase in the Discount Rate |
|
|
One Percent Decrease in the Discount Rate |
|
|
Five Percent Increase in the Forward Price Estimates |
|
|
Five Percent Decrease in the Forward Price Estimates |
|
||||
|
Clearwater |
|
26 |
|
|
|
(25 |
) |
|
|
(52 |
) |
|
|
64 |
|
|
|
|
|
|
|
|
|
|
|
|
|
|
|
|
|
|
2017 Upstream Impairments
As at March 31, 2017, there were no indicators of impairment. There were no goodwill impairments for the three months ended March 31, 2017.
B) Asset Impairment and Writedowns
Exploration and Evaluation Assets
For the three months ended March 31, 2018, $2 million of previously capitalized E&E costs were written off as the carrying value was not considered to be recoverable and recorded as exploration expense in the Oil Sands segment.
For the three months ended March 31, 2017, $3 million of previously capitalized E&E costs were written off and recorded as exploration expense in the Conventional segment, which has been classified as a discontinued operation.
Property, Plant and Equipment, Net
For the three months ended March 31, 2018, the Company recorded an impairment loss of $7 million in the Oil Sands segment for information technology assets that were written down to their recoverable amounts.
|
Cenovus Energy Inc. |
16 |
For the period ended March 31, 2018 |
NOTES TO CONSOLIDATED FINANCIAL STATEMENTS (unaudited)
All amounts in $ millions, unless otherwise indicated
For the period ended March 31, 2018
On May 17, 2017, Cenovus acquired from ConocoPhillips Company and certain of its subsidiaries (collectively, “ConocoPhillips”) a 50 percent interest in FCCL Partnership and the majority of ConocoPhillips’ western Canadian conventional crude oil and natural gas assets (the “Deep Basin Assets”). The acquisition from ConocoPhillips (the “Acquisition”) provided Cenovus with control over the Company’s oil sands operations, doubled the Company’s oil sands production, and almost doubled the Company’s proved bitumen reserves. The Deep Basin Assets provide a second core operating area with more than three million net acres of land, exploration and production assets, and related infrastructure in Alberta and British Columbia.
Total consideration for the Acquisition consisted of US$10.6 billion in cash and 208 million Cenovus common shares plus closing adjustments. At the same time, Cenovus agreed to make quarterly payments to ConocoPhillips during the five years subsequent to May 17, 2017 for quarters in which the average WCS crude oil price exceeds $52.00 per barrel during the quarter. The quarterly payment will be $6 million for each dollar that the WCS price exceeds $52.00 per barrel. The calculation includes an adjustment mechanism related to certain significant production outages at Foster Creek and Christina Lake, which may reduce the amount of a contingent payment. There are no maximum payment terms.
8. ASSETS HELD FOR SALE AND DISCONTINUED OPERATIONS
In the second quarter of 2017, the Company announced its intention to divest of its Conventional segment that included its heavy oil assets at Pelican Lake, the CO2 enhanced oil recovery project at Weyburn and conventional crude oil, NGLs and natural gas assets in the Suffield and Palliser areas in southern Alberta. The associated assets and liabilities were reclassified as held for sale and the results of operations reported as a discontinued operation.
In the fourth quarter of 2017, the Company announced its intention to market for sale a package of non-core Deep Basin assets primarily in the East Clearwater area. The assets have been classified as held for sale and recorded at the lesser of their carrying amount and their fair value less costs to sell.
A) Results of Discontinued Operations
On January 5, 2018, the Company completed the sale of its Suffield crude oil and natural gas operations in southern Alberta for cash proceeds of $512 million, before closing adjustments. A before-tax gain on discontinuance of $348 million was recorded on the sale. The agreement includes a deferred purchase price adjustment (“DPPA”) that could provide Cenovus with purchase price adjustments of up to $36 million if the average crude oil and natural gas prices meet certain thresholds over the next two years.
The DPPA is a two year agreement that commenced on close. Under the purchase and sale agreement, Cenovus is entitled to receive cash for each month in which the average daily price of WTI is above US$55 per barrel or the price of Henry Hub natural gas is above US$3.50 per MMBtu. Monthly cash payments are capped at $375 thousand and $1.125 million for crude oil and natural gas, respectively. The DPPA will be accounted for as a financial option and fair valued at each reporting date. The fair value of the DPPA on the date of close was $7 million.
|
Cenovus Energy Inc. |
17 |
For the period ended March 31, 2018 |
NOTES TO CONSOLIDATED FINANCIAL STATEMENTS (unaudited)
All amounts in $ millions, unless otherwise indicated
For the period ended March 31, 2018
The following table presents the results of discontinued operations, including asset sales:
|
|
Three Months Ended |
|
|||||
|
For the periods ended March 31, |
|
2018 |
|
|
|
2017 |
|
|
Revenues |
|
|
|
|
|
|
|
|
Gross Sales |
|
16 |
|
|
|
374 |
|
|
Less: Royalties |
|
(1 |
) |
|
|
50 |
|
|
|
|
17 |
|
|
|
324 |
|
|
Expenses |
|
|
|
|
|
|
|
|
Transportation and Blending |
|
1 |
|
|
|
51 |
|
|
Operating |
|
5 |
|
|
|
110 |
|
|
Production and Mineral Taxes |
|
(1 |
) |
|
|
5 |
|
|
(Gain) Loss on Risk Management |
- |
|
|
|
13 |
|
|
|
Operating Margin |
|
12 |
|
|
|
145 |
|
|
Depreciation, Depletion and Amortization |
- |
|
|
|
121 |
|
|
|
Exploration Expense |
- |
|
|
|
3 |
|
|
|
Finance Costs |
- |
|
|
|
21 |
|
|
|
Earnings (Loss) From Discontinued Operations Before Income Tax |
|
12 |
|
|
- |
|
|
|
Current Tax Expense (Recovery) |
- |
|
|
|
5 |
|
|
|
Deferred Tax Expense (Recovery) |
|
3 |
|
|
|
(5 |
) |
|
After-tax Earnings (Loss) From Discontinued Operations |
|
9 |
|
|
- |
|
|
|
After-tax Gain (Loss) on Discontinuance (1) |
|
251 |
|
|
- |
|
|
|
Net Earnings (Loss) From Discontinued Operations |
|
260 |
|
|
- |
|
|
|
(1) |
Net of deferred tax expense of $93 million in the three months ended March 31, 2018. |
B) Cash Flows From Discontinued Operations
Cash flows from discontinued operations reported in the Consolidated Statement of Cash Flows are:
|
|
Three Months Ended |
|
|||||
|
For the periods ended March 31, |
|
2018 |
|
|
|
2017 |
|
|
Cash From Operating Activities |
|
11 |
|
|
|
133 |
|
|
Cash From (Used in) Investing Activities |
|
451 |
|
|
|
(88 |
) |
|
Net Cash Flow |
|
462 |
|
|
|
45 |
|
C) Assets and Liabilities Held for Sale
As at March 31, 2018, the assets and liabilities held for sale related to non-core Deep Basin assets primarily in the East Clearwater area.
|
As at March 31, 2018 |
E&E Assets |
|
|
PP&E |
|
|
Decommissioning Liabilities |
|
|||
|
Deep Basin |
|
47 |
|
|
|
432 |
|
|
|
151 |
|
The provision for income taxes is:
|
|
Three Months Ended |
|
|||||
|
For the periods ended March 31, |
|
2018 |
|
|
|
2017 |
|
|
Current Tax |
|
|
|
|
|
|
|
|
Canada |
|
(58 |
) |
|
|
(26 |
) |
|
United States |
|
4 |
|
|
|
(1 |
) |
|
Total Current Tax Expense (Recovery) |
|
(54 |
) |
|
|
(27 |
) |
|
Deferred Tax Expense (Recovery) |
|
(104 |
) |
|
|
76 |
|
|
Tax Expense (Recovery) From Continuing Operations |
|
(158 |
) |
|
|
49 |
|
|
Cenovus Energy Inc. |
18 |
For the period ended March 31, 2018 |
NOTES TO CONSOLIDATED FINANCIAL STATEMENTS (unaudited)
All amounts in $ millions, unless otherwise indicated
For the period ended March 31, 2018
A) Net Earnings (Loss) Per Share – Basic and Diluted
|
|
Three Months Ended |
|
|||||
|
For the periods ended March 31, |
|
2018 |
|
|
|
2017 |
|
|
Earnings (Loss) From: |
|
|
|
|
|
|
|
|
Continuing Operations |
|
(914 |
) |
|
|
211 |
|
|
Discontinued Operations |
|
260 |
|
|
- |
|
|
|
Net Earnings (Loss) |
|
(654 |
) |
|
211 |
|
|
|
|
|
|
|
|
|
|
|
|
Weighted Average Number of Shares (millions) |
|
1,228.8 |
|
|
|
833.3 |
|
|
|
|
|
|
|
|
|
|
|
Basic and Diluted Earnings (Loss) Per Share From: ($) |
|
|
|
|
|
|
|
|
Continuing Operations |
|
(0.74 |
) |
|
|
0.25 |
|
|
Discontinued Operations |
|
0.21 |
|
|
- |
|
|
|
Net Earnings (Loss) Per Share |
|
(0.53 |
) |
|
|
0.25 |
|
B) Dividends Per Share
For the three months ended March 31, 2018, the Company paid dividends of $60 million or $0.05 per share (three months ended March 31, 2017 – $41 million or $0.05 per share).
11. INVENTORIES
As a result of a decline in refined product prices, Cenovus recorded an $8 million write-down of its product inventory to net realizable value as at March 31, 2018. As at December 31, 2017, Cenovus recorded a $1 million write-down of its product inventory.
12. EXPLORATION AND EVALUATION ASSETS
|
|
Total |
|
|
|
As at December 31, 2017 |
|
3,673 |
|
|
Additions |
|
8 |
|
|
Transfers to Assets Held for Sale (Note 8) |
|
(1 |
) |
|
Exploration Expense (Note 6) |
|
(2 |
) |
|
As at March 31, 2018 |
|
3,678 |
|
|
Cenovus Energy Inc. |
19 |
For the period ended March 31, 2018 |
NOTES TO CONSOLIDATED FINANCIAL STATEMENTS (unaudited)
All amounts in $ millions, unless otherwise indicated
For the period ended March 31, 2018
13. PROPERTY, PLANT AND EQUIPMENT, NET
|
|
Upstream Assets |
|
|
|
|
|
|
|
|
|
|
|
|
|
|||||
|
|
Development & Production |
|
|
Other Upstream |
|
|
Refining Equipment |
|
|
Other (1) |
|
|
Total |
|
|||||
|
COST |
|
|
|
|
|
|
|
|
|
|
|
|
|
|
|
|
|
|
|
|
As at December 31, 2017 |
|
27,441 |
|
|
|
333 |
|
|
|
5,061 |
|
|
|
1,167 |
|
|
|
34,002 |
|
|
Additions |
|
462 |
|
|
- |
|
|
|
53 |
|
|
|
6 |
|
|
|
521 |
|
|
|
Change in Decommissioning Liabilities |
|
4 |
|
|
- |
|
|
|
1 |
|
|
- |
|
|
|
5 |
|
||
|
Exchange Rate Movements and Other |
|
(3 |
) |
|
- |
|
|
|
140 |
|
|
|
1 |
|
|
|
138 |
|
|
|
Divestitures |
|
(2 |
) |
|
- |
|
|
- |
|
|
- |
|
|
|
(2 |
) |
|||
|
As at March 31, 2018 |
|
27,902 |
|
|
|
333 |
|
|
|
5,255 |
|
|
|
1,174 |
|
|
|
34,664 |
|
|
|
|
|
|
|
|
|
|
|
|
|
|
|
|
|
|
|
|
|
|
|
ACCUMULATED DEPRECIATION, DEPLETION AND AMORTIZATION |
|
|
|
|
|
|
|
|
|
|
|
|
|
|
|
|
|
|
|
|
As at December 31, 2017 |
|
2,104 |
|
|
|
331 |
|
|
|
1,193 |
|
|
|
778 |
|
|
|
4,406 |
|
|
DD&A |
|
456 |
|
|
|
3 |
|
|
|
53 |
|
|
|
16 |
|
|
|
528 |
|
|
Impairment Losses (Note 6) |
|
107 |
|
|
- |
|
|
- |
|
|
- |
|
|
|
107 |
|
|||
|
Exchange Rate Movements and Other |
|
(9 |
) |
|
|
(1 |
) |
|
|
34 |
|
|
- |
|
|
|
24 |
|
|
|
As at March 31, 2018 |
|
2,658 |
|
|
|
333 |
|
|
|
1,280 |
|
|
|
794 |
|
|
|
5,065 |
|
|
|
|
|
|
|
|
|
|
|
|
|
|
|
|
|
|
|
|
|
|
|
CARRYING VALUE |
|
|
|
|
|
|
|
|
|
|
|
|
|
|
|
|
|
|
|
|
As at December 31, 2017 |
|
25,337 |
|
|
2 |
|
|
|
3,868 |
|
|
389 |
|
|
|
29,596 |
|
||
|
As at March 31, 2018 |
|
25,244 |
|
|
|
- |
|
|
|
3,975 |
|
|
|
380 |
|
|
|
29,599 |
|
(1)Includes crude-by-rail terminal, office furniture, fixtures, leasehold improvements, information technology and aircraft.
|
|
Total |
|
As at December 31, 2017 |
206 |
|
Re-measurement (1) |
117 |
|
Liabilities Settled or Payable |
- |
|
As at March 31, 2018 |
323 |
|
Less: Current Portion |
92 |
|
Long-Term Portion |
231 |
(1) Contingent payment is carried at fair value. Changes in fair value are recorded in net earnings.
In connection with the Acquisition, Cenovus agreed to make quarterly payments to ConocoPhillips during the five years subsequent to May 17, 2017 for quarters in which the average WCS crude oil price exceeds $52.00 per barrel during the quarter. The quarterly payment will be $6 million for each dollar that the WCS price exceeds $52.00 per barrel. The calculation includes an adjustment mechanism related to certain significant production outages at Foster Creek and Christina Lake, which may reduce the amount of a contingent payment. There are no maximum payment terms. As at March 31, 2018, no amount is payable under this agreement.
|
As at |
|
|
US$ Principal Amount |
|
|
March 31, 2018 |
|
|
December 31, 2017 |
|
|||
|
Revolving Term Debt (1) |
|
|
- |
|
|
- |
|
|
- |
|
|||
|
U.S. Dollar Denominated Unsecured Notes |
|
|
|
7,650 |
|
|
|
9,864 |
|
|
|
9,597 |
|
|
Total Debt Principal |
|
|
|
|
|
|
|
9,864 |
|
|
|
9,597 |
|
|
Debt Discounts and Transaction Costs |
|
|
|
|
|
|
|
(83 |
) |
|
|
(84 |
) |
|
Long-Term Debt |
|
|
|
|
|
|
|
9,781 |
|
|
|
9,513 |
|
(1)Revolving term debt may include Bankers’ Acceptances, London Interbank Offered Rate based loans, prime rate loans and U.S. base rate loans.
As at March 31, 2018, the Company is in compliance with all of the terms of its debt agreements.
|
Cenovus Energy Inc. |
20 |
For the period ended March 31, 2018 |
NOTES TO CONSOLIDATED FINANCIAL STATEMENTS (unaudited)
All amounts in $ millions, unless otherwise indicated
For the period ended March 31, 2018
16. DECOMMISSIONING LIABILITIES
The decommissioning provision represents the present value of the expected future costs associated with the retirement of upstream crude oil and natural gas assets, refining facilities and the crude-by-rail terminal. The aggregate carrying amount of the obligation is:
|
|
Total |
|
|
|
As at December 31, 2017 |
|
1,029 |
|
|
Liabilities Incurred |
|
5 |
|
|
Liabilities Settled |
|
(10 |
) |
|
Transfers to Liabilities Related to Assets Held for Sale (Note 8) |
|
(2 |
) |
|
Unwinding of Discount on Decommissioning Liabilities |
|
16 |
|
|
As at March 31, 2018 |
|
1,038 |
|
The undiscounted amount of estimated future cash flows required to settle the obligation has been discounted using a credit-adjusted risk-free rate of 5.3 percent as at March 31, 2018 (December 31, 2017 – 5.3 percent).
|
As at |
March 31, 2018 |
|
December 31, 2017 |
|
|
|
Employee Long-Term Incentives |
45 |
|
|
43 |
|
|
Pension and Other Post-Employment Benefit Plan |
73 |
|
|
62 |
|
|
Onerous Contract Provisions |
82 |
|
|
37 |
|
|
Other |
36 |
|
|
31 |
|
|
|
236 |
|
|
173 |
|
Cenovus is authorized to issue an unlimited number of common shares, and first and second preferred shares not exceeding, in aggregate, 20 percent of the number of issued and outstanding common shares. The first and second preferred shares may be issued in one or more series with rights and conditions to be determined by the Company’s Board of Directors prior to issuance and subject to the Company’s articles.
B) Issued and Outstanding
|
|
March 31, 2018 |
|
|
December 31, 2017 |
|
||||||||||
|
As at |
Number of Common Shares (thousands) |
|
|
Amount |
|
|
Number of Common Shares (thousands) |
|
|
Amount |
|
||||
|
Outstanding, Beginning of Year |
|
1,228,790 |
|
|
|
11,040 |
|
|
|
833,290 |
|
|
|
5,534 |
|
|
Common Shares Issued, Net of Issuance Costs and Tax |
- |
|
|
- |
|
|
|
187,500 |
|
|
|
2,927 |
|
||
|
Common Shares Issued to ConocoPhillips |
- |
|
|
- |
|
|
|
208,000 |
|
|
|
2,579 |
|
||
|
Outstanding, End of Period |
|
1,228,790 |
|
|
|
11,040 |
|
|
|
1,228,790 |
|
|
|
11,040 |
|
In connection with the Acquisition, Cenovus closed a bought-deal common share financing on April 6, 2017 for 187.5 million common shares, raising gross proceeds of $3.0 billion ($2.9 billion net of $101 million of share issuance costs).
In addition, the Company issued 208 million common shares to ConocoPhillips on May 17, 2017 as partial consideration for the Acquisition. In relation to the share consideration, Cenovus and ConocoPhillips entered into an investor agreement, and a registration rights agreement which, among other things, restricted ConocoPhillips from selling or hedging its Cenovus common shares until after November 17, 2017. ConocoPhillips is also restricted from nominating new members to Cenovus’s Board of Directors and must vote its Cenovus common shares in accordance with Management’s recommendations or abstain from voting until such time ConocoPhillips owns 3.5 percent or less of the then outstanding common shares of Cenovus. As at March 31, 2018, ConocoPhillips continued to hold these common shares.
There were no preferred shares outstanding as at March 31, 2018 (December 31, 2017 – nil).
As at March 31, 2018, there were 17 million (December 31, 2017 – 15 million) common shares available for future issuance under the stock option plan.
|
Cenovus Energy Inc. |
21 |
For the period ended March 31, 2018 |
NOTES TO CONSOLIDATED FINANCIAL STATEMENTS (unaudited)
All amounts in $ millions, unless otherwise indicated
For the period ended March 31, 2018
19. ACCUMULATED OTHER COMPREHENSIVE INCOME (LOSS)
|
|
Defined Benefit Pension Plan |
|
|
Foreign Currency Translation Adjustment |
|
|
Private Equity Instruments |
|
|
Total |
|
||||
|
As at December 31, 2016 |
|
(13 |
) |
|
|
908 |
|
|
|
15 |
|
|
|
910 |
|
|
Other Comprehensive Income (Loss), Before Tax |
|
(4 |
) |
|
|
(43 |
) |
|
- |
|
|
|
(47 |
) |
|
|
Income Tax |
|
1 |
|
|
- |
|
|
- |
|
|
|
1 |
|
||
|
As at March 31, 2017 |
|
(16 |
) |
|
|
865 |
|
|
|
15 |
|
|
|
864 |
|
|
|
|
|
|
|
|
|
|
|
|
|
|
|
|
|
|
|
As at December 31, 2017 |
|
(4 |
) |
|
|
633 |
|
|
|
14 |
|
|
|
643 |
|
|
Other Comprehensive Income (Loss), Before Tax |
|
(10 |
) |
|
|
120 |
|
|
- |
|
|
|
110 |
|
|
|
Income Tax |
|
3 |
|
|
- |
|
|
- |
|
|
|
3 |
|
||
|
As at March 31, 2018 |
|
(11 |
) |
|
|
753 |
|
|
|
14 |
|
|
|
756 |
|
20. STOCK-BASED COMPENSATION PLANS
Cenovus has a number of stock-based compensation plans which include stock options with associated net settlement rights (“NSRs”), performance share units (“PSUs”), restricted share units (“RSUs”) and deferred share units (“DSUs”). The following tables summarize information related to Cenovus’s stock-based compensation plans:
|
|
|
|
|
|
|
|
|
|
|
Units Outstanding |
|
|
Units Exercisable |
|
||
|
As at March 31, 2018 |
(thousands) |
|
|
(thousands) |
|
||
|
NSRs |
|
40,385 |
|
|
|
31,631 |
|
|
PSUs |
|
6,555 |
|
|
- |
|
|
|
RSUs |
|
7,083 |
|
|
- |
|
|
|
DSUs |
|
1,613 |
|
|
|
1,613 |
|
|
|
Units Granted |
|
|
Units Vested and Paid Out |
|
||
|
For the three months ended March 31, 2018 |
(thousands) |
|
|
(thousands) |
|
||
|
NSRs |
|
3,256 |
|
|
|
- |
|
|
PSUs |
|
2,953 |
|
|
|
- |
|
|
RSUs |
|
3,366 |
|
|
|
1,772 |
|
|
DSUs |
166 |
|
|
|
1 |
|
|
The weighted average exercise price of NSRs as at March 31, 2018 was $26.98.
The following table summarizes the stock-based compensation expense (recovery) recorded for all plans:
|
|
Three Months Ended |
|
|||||
|
For the periods ended March 31, |
|
2018 |
|
|
|
2017 |
|
|
NSRs |
2 |
|
|
|
2 |
|
|
|
PSUs |
|
(11 |
) |
|
|
(6 |
) |
|
RSUs |
|
(1 |
) |
|
|
(3 |
) |
|
DSUs |
|
1 |
|
|
|
(7 |
) |
|
Stock-Based Compensation Expense (Recovery) |
|
(9 |
) |
|
|
(14 |
) |
|
Stock-Based Compensation Costs Capitalized |
|
(2 |
) |
|
|
(1 |
) |
|
Total Stock-Based Compensation |
|
(11 |
) |
|
|
(15 |
) |
|
Cenovus Energy Inc. |
22 |
For the period ended March 31, 2018 |
NOTES TO CONSOLIDATED FINANCIAL STATEMENTS (unaudited)
All amounts in $ millions, unless otherwise indicated
For the period ended March 31, 2018
Cenovus’s capital structure objectives remain unchanged from previous periods. Cenovus’s capital structure consists of shareholders’ equity plus Net Debt. Net Debt includes the Company’s short-term borrowings, and the current and long-term portions of long-term debt, net of cash and cash equivalents. Cenovus conducts its business and makes decisions consistent with that of an investment grade company. The Company’s objectives when managing its capital structure are to maintain financial flexibility, preserve access to capital markets, ensure its ability to finance internally generated growth and to fund potential acquisitions while maintaining the ability to meet the Company’s financial obligations as they come due.
Cenovus monitors its capital structure and financing requirements using, among other things, non-GAAP financial metrics consisting of Net Debt to Adjusted Earnings Before Interest, Taxes and DD&A (“Adjusted EBITDA”) and Net Debt to Capitalization. These metrics are used to steward Cenovus’s overall debt position as measures of Cenovus’s overall financial strength.
Over the long term, Cenovus targets a Net Debt to Adjusted EBITDA ratio of less than 2.0 times. At different points within the economic cycle, Cenovus expects this ratio may periodically be above the target. Cenovus also manages its Net Debt to Capitalization ratio to ensure compliance with the associated covenant as defined in its committed credit facility agreement.
A) Net Debt to Adjusted EBITDA
|
As at |
March 31, 2018 |
|
|
December 31, 2017 |
|
||
|
Long-Term Debt |
|
9,781 |
|
|
|
9,513 |
|
|
Less: Cash and Cash Equivalents |
|
(405 |
) |
|
|
(610 |
) |
|
Net Debt |
|
9,376 |
|
|
|
8,903 |
|
|
|
|
|
|
|
|
|
|
|
Net Earnings (Loss) |
|
2,501 |
|
|
|
3,366 |
|
|
Add (Deduct): |
|
|
|
|
|
|
|
|
Finance Costs |
|
755 |
|
|
|
725 |
|
|
Interest Income |
|
(48 |
) |
|
|
(62 |
) |
|
Income Tax Expense (Recovery) |
|
241 |
|
|
|
352 |
|
|
DD&A |
|
2,302 |
|
|
|
2,030 |
|
|
E&E Impairment |
|
889 |
|
|
|
890 |
|
|
Unrealized (Gain) Loss on Risk Management |
|
869 |
|
|
|
729 |
|
|
Foreign Exchange (Gain) Loss, Net |
|
(459 |
) |
|
|
(812 |
) |
|
Revaluation (Gain) |
|
(2,555 |
) |
|
|
(2,555 |
) |
|
Re-measurement of Contingent Payment |
|
(21 |
) |
|
|
(138 |
) |
|
(Gain) Loss on Discontinuance |
|
(1,629 |
) |
|
|
(1,285 |
) |
|
(Gain) Loss on Divestitures of Assets |
|
- |
|
|
|
1 |
|
|
Other (Income) Loss, Net |
|
(7 |
) |
|
|
(5 |
) |
|
Adjusted EBITDA (1) |
|
2,838 |
|
|
|
3,236 |
|
|
|
|
|
|
|
|
|
|
|
Net Debt to Adjusted EBITDA |
3.3x |
|
|
2.8x |
|
||
(1)Calculated on a trailing twelve-month basis. Includes discontinued operations.
B) Net Debt to Capitalization
|
As at |
March 31, 2018 |
|
|
December 31, 2017 |
|
||
|
Net Debt |
|
9,376 |
|
|
|
8,903 |
|
|
Shareholders’ Equity |
|
19,381 |
|
|
|
19,981 |
|
|
|
|
28,757 |
|
|
|
28,884 |
|
|
Net Debt to Capitalization |
|
33 |
% |
|
|
31 |
% |
|
Cenovus Energy Inc. |
23 |
For the period ended March 31, 2018 |
NOTES TO CONSOLIDATED FINANCIAL STATEMENTS (unaudited)
All amounts in $ millions, unless otherwise indicated
For the period ended March 31, 2018
Cenovus’s objective is to maintain a high level of capital discipline and manage its capital structure to help ensure sufficient liquidity through all stages of the economic cycle. To help ensure financial resilience, Cenovus may, among other actions, adjust capital and operating spending, draw down on its credit facility or repay existing debt, adjust dividends paid to shareholders, purchase shares for cancellation pursuant to normal course issuer bids, issue new debt, or issue new shares.
Cenovus has in place a committed credit facility that consists of a $1.2 billion tranche maturing on November 30, 2020 and a $3.3 billion tranche maturing on November 30, 2021. As at March 31, 2018, no amounts were drawn on its committed credit facility. Under the committed credit facility, the Company is required to maintain a debt to capitalization ratio, as defined in the agreement, not to exceed 65 percent. The Company is well below this limit.
In addition, the Company has in place a base shelf prospectus which expires in November 2019. As at March 31, 2018, US$4.6 billion remains available under the base shelf prospectus. Offerings under the base shelf prospectus are subject to market conditions.
As at March 31, 2018, Cenovus is in compliance with all of the terms of its debt agreements.
Cenovus’s financial assets and financial liabilities consist of cash and cash equivalents, accounts receivable and accrued revenues, accounts payable and accrued liabilities, risk management assets and liabilities, private equity investments, long-term receivables, contingent payment, short-term borrowings and long-term debt. Risk management assets and liabilities arise from the use of derivative financial instruments.
A) Fair Value of Non-Derivative Financial Instruments
The fair values of cash and cash equivalents, accounts receivable and accrued revenues, accounts payable and accrued liabilities, and short-term borrowings approximate their carrying amount due to the short-term maturity of these instruments.
The fair values of long-term receivables approximate their carrying amount due to the specific non-tradeable nature of these instruments.
Long-term debt is carried at amortized cost. The estimated fair values of long-term borrowings have been determined based on period-end trading prices of long-term borrowings on the secondary market (Level 2). As at March 31, 2018, the carrying value of Cenovus’s debt was $9,781 million and the fair value was $10,013 million (December 31, 2017 carrying value – $9,513 million, fair value – $10,061 million).
Equity investments classified at FVOCI comprise equity investments in private companies. The Company classifies certain private equity instruments at FVOCI as they are not held for trading and fair value changes are not reflective of the Company’s operations. These assets are carried at fair value on the Consolidated Balance Sheets in other assets. Fair value is determined based on recent private placement transactions (Level 3) when available. There were no changes in the fair value of the Company’s private equity instruments in the three months ended March 31, 2018.
B) Fair Value of Risk Management Assets and Liabilities
The Company’s risk management assets and liabilities consist of crude oil swaps and options, as well as condensate and interest rate swaps. Crude oil, condensate and, if entered, natural gas contracts are recorded at their estimated fair value based on the difference between the contracted price and the period-end forward price for the same commodity, using quoted market prices or the period-end forward price for the same commodity extrapolated to the end of the term of the contract (Level 2). The fair value of interest rate swaps are calculated using external valuation models which incorporate observable market data, including interest rate yield curves (Level 2).
Summary of Unrealized Risk Management Positions
|
|
March 31, 2018 |
|
|
December 31, 2017 |
|
||||||||||||||||||
|
|
Risk Management |
|
|
Risk Management |
|
||||||||||||||||||
|
As at |
Asset |
|
|
Liability |
|
|
Net |
|
|
Asset |
|
|
Liability |
|
|
Net |
|
||||||
|
Crude Oil |
|
43 |
|
|
|
932 |
|
|
|
(889 |
) |
|
|
63 |
|
|
|
1,031 |
|
|
|
(968 |
) |
|
Interest Rate |
|
8 |
|
|
|
1 |
|
|
|
7 |
|
|
|
2 |
|
|
|
20 |
|
|
|
(18 |
) |
|
Total Fair Value |
|
51 |
|
|
|
933 |
|
|
|
(882 |
) |
|
|
65 |
|
|
|
1,051 |
|
|
|
(986 |
) |
|
Cenovus Energy Inc. |
24 |
For the period ended March 31, 2018 |
NOTES TO CONSOLIDATED FINANCIAL STATEMENTS (unaudited)
All amounts in $ millions, unless otherwise indicated
For the period ended March 31, 2018
The following table presents the Company’s fair value hierarchy for risk management assets and liabilities carried at fair value:
|
As at |
March 31, 2018 |
|
|
December 31, 2017 |
|
||
|
Level 2 – Prices Sourced From Observable Data or Market Corroboration |
|
(882 |
) |
|
|
(986 |
) |
Prices sourced from observable data or market corroboration refers to the fair value of contracts valued in part using active quotes and in part using observable, market-corroborated data.
The following table provides a reconciliation of changes in the fair value of Cenovus’s risk management assets and liabilities from January 1 to March 31:
|
|
2018 |
|
|
2017 |
|
||
|
Fair Value of Contracts, Beginning of Year |
|
(986 |
) |
|
|
(291 |
) |
|
Fair Value of Contracts Realized During the Period (1) |
|
469 |
|
|
|
92 |
|
|
Change in Fair Value of Contracts in Place at Beginning of Year and Contracts Entered Into During the Period |
|
(346 |
) |
|
|
187 |
|
|
Unamortized Premium on Put Options |
|
8 |
|
|
- |
|
|
|
Unrealized Foreign Exchange Gain (Loss) on U.S. Dollar Contracts |
|
(27 |
) |
|
|
3 |
|
|
Fair Value of Contracts, End of Period |
|
(882 |
) |
|
|
(9 |
) |
(1)Includes realized loss of $nil (2017 – $13 million) related to the Conventional segment which is included in discontinued operations.
C) Fair Value of Contingent Payment
The contingent payment is carried at fair value on the Consolidated Balance Sheets. Fair value is estimated by calculating the present value of the future expected cash flows using an option pricing model (Level 3), which assumes the probability distribution for WCS is based on the volatility of WTI options, volatility of Canadian-U.S. foreign exchange rate options and WCS futures pricing, and discounted at a credit-adjusted risk-free rate of 3.6 percent. Fair value of the contingent payment has been calculated by Cenovus’s internal valuation team which consists of individuals who are knowledgeable and have experience in fair value techniques. As at March 31, 2018, the fair value of the contingent payment was estimated to be $323 million.
As at March 31, 2018, average WCS forward pricing for the remaining term of the contingent payment is US$36.14 per barrel or C$46.60 per barrel. The average volatility of WTI options and the Canadian-U.S. foreign exchange rates used to value the contingent payment was 23 percent and eight percent, respectively. Changes in the following inputs to the option pricing model, with fluctuations in all other variables held constant, could have resulted in unrealized gains (losses) impacting earnings before income tax as follows:
|
|
Sensitivity Range |
|
Increase |
|
|
Decrease |
|
||
|
WCS Forward Prices |
± $5.00 per bbl |
|
|
(218 |
) |
|
|
158 |
|
|
WTI Option Volatility |
± five percent |
|
|
(100 |
) |
|
|
93 |
|
|
U.S. to Canadian Dollar Foreign Exchange Rate Volatility |
± five percent |
|
|
10 |
|
|
|
(34 |
) |
D) Earnings Impact of (Gains) Losses From Risk Management Positions
|
|
Three Months Ended |
|
|||||
|
For the periods ended March 31, |
|
2018 |
|
|
|
2017 |
|
|
Realized (Gain) Loss (1) |
|
469 |
|
|
|
79 |
|
|
Unrealized (Gain) Loss (2) |
|
(139 |
) |
|
|
(279 |
) |
|
(Gain) Loss on Risk Management |
|
330 |
|
|
|
(200 |
) |
|
(1) |
Realized gains and losses on risk management are recorded in the reportable segment to which the derivative instrument relates. Excludes realized risk management losses of $nil in the three months ended March 31, 2018 (three months ended March 31, 2017 – $13 million) that were classified as discontinued operations. |
|
(2) |
Unrealized gains and losses on risk management are recorded in the Corporate and Eliminations segment. |
|
Cenovus Energy Inc. |
25 |
For the period ended March 31, 2018 |
NOTES TO CONSOLIDATED FINANCIAL STATEMENTS (unaudited)
All amounts in $ millions, unless otherwise indicated
For the period ended March 31, 2018
Cenovus is exposed to financial risks, including market risk related to commodity prices, foreign exchange rates, interest rates as well as credit risk and liquidity risk. A description of the nature and extent of risks arising from the Company’s financial assets and liabilities can be found in the notes to the annual Consolidated Financial Statements as at December 31, 2017. Exposure to these risks has not changed significantly since December 31, 2017.
To manage exposure to interest rate volatility, the Company entered into interest rate swap contracts related to expected future debt issuances. As at March 31, 2018, Cenovus had a notional amount of US$400 million in interest rate swaps. To mitigate the Company’s exposure to foreign exchange rate fluctuations, the Company periodically enters into foreign exchange contracts. No foreign exchange contracts were outstanding at March 31, 2018.
Net Fair Value of Risk Management Positions
|
As at March 31, 2018 |
Notional Volumes |
|
Terms |
|
Average Price |
|
Fair Value Asset (Liability) |
|
|
|
Crude Oil Contracts |
|
|
|
|
|
|
|
|
|
|
Fixed Price Contracts |
|
|
|
|
|
|
|
|
|
|
Brent Fixed Price |
60,000 bbls/d |
|
January – June 2018 |
|
US$53.34/bbl |
|
|
(109 |
) |
|
WTI Fixed Price |
150,000 bbls/d |
|
January – June 2018 |
|
US$48.91/bbl |
|
|
(278 |
) |
|
WTI Fixed Price |
75,000 bbls/d |
|
July – December 2018 |
|
US$49.32/bbl |
|
|
(235 |
) |
|
Brent Put Options |
25,000 bbls/d |
|
January – June 2018 |
|
US$53.00/bbl |
|
- |
|
|
|
Brent Collars |
80,000 bbls/d |
|
January – June 2018 |
|
US$49.54 – US$59.86/bbl |
|
|
(89 |
) |
|
Brent Collars |
75,000 bbls/d |
|
July – December 2018 |
|
US$49.00 – US$59.69/bbl |
|
|
(156 |
) |
|
WTI Collars |
10,000 bbls/d |
|
January – June 2018 |
|
US$45.30 – US$62.77/bbl |
|
|
(4 |
) |
|
WTI Collars |
19,000 bbls/d |
|
January – December 2019 |
|
US$50.00 – US$62.08/bbl |
|
|
(17 |
) |
|
WCS Differential |
14,800 bbls/d |
|
April – June 2018 |
|
US$(14.05)/bbl |
|
|
8 |
|
|
WCS Differential |
10,500 bbls/d |
|
January – December 2018 |
|
US$(14.52)/bbl |
|
|
23 |
|
|
Other Financial Positions (1) |
|
|
|
|
|
|
|
(32 |
) |
|
Crude Oil Fair Value Position |
|
|
|
|
|
|
|
(889 |
) |
|
|
|
|
|
|
|
|
|
|
|
|
Interest Rate Swaps |
|
|
|
|
|
|
|
7 |
|
|
|
|
|
|
|
|
|
|
|
|
|
Total Fair Value |
|
|
|
|
|
|
|
(882 |
) |
(1)Other financial positions are part of ongoing operations to market the Company’s production.
Sensitivities – Risk Management Positions
The following table summarizes the sensitivity of the fair value of Cenovus’s risk management positions to fluctuations in commodity prices and interest rates, with all other variables held constant. Management believes the fluctuations identified in the table below are a reasonable measure of volatility. The impact of fluctuating commodity prices and interest rates on the Company’s open risk management positions could have resulted in unrealized gains (losses) impacting earnings before income tax as follows:
|
|
Sensitivity Range |
Increase |
|
|
Decrease |
|
||
|
Crude Oil Commodity Price |
± US$5.00 per bbl Applied to Brent, WTI and Condensate Hedges |
|
(413 |
) |
|
|
399 |
|
|
Crude Oil Differential Price |
± US$2.50 per bbl Applied to Differential Hedges Tied to Production |
|
7 |
|
|
|
(7 |
) |
|
Interest Rate Swaps |
± 50 Basis Points |
|
42 |
|
|
|
(48 |
) |
|
Cenovus Energy Inc. |
26 |
For the period ended March 31, 2018 |
NOTES TO CONSOLIDATED FINANCIAL STATEMENTS (unaudited)
All amounts in $ millions, unless otherwise indicated
For the period ended March 31, 2018
24. SUPPLEMENTARY CASH FLOW INFORMATION
The following table provides a reconciliation of liabilities to cash flows arising from financing activities:
|
|
Dividends Payable |
|
|
Long-Term Debt |
|
||
|
As at December 31, 2016 |
- |
|
|
|
6,332 |
|
|
|
Changes From Financing Cash Flows: |
|
|
|
|
|
|
|
|
Dividends Paid |
|
(41 |
) |
|
- |
|
|
|
Acquisition Financing Charges |
- |
|
|
- |
|
||
|
Non-Cash Changes: |
|
|
|
|
|
|
|
|
Dividends Declared |
|
41 |
|
|
- |
|
|
|
Unrealized Foreign Exchange (Gain) Loss |
- |
|
|
|
(56 |
) |
|
|
Other |
- |
|
|
|
1 |
|
|
|
As at March 31, 2017 |
- |
|
|
|
6,277 |
|
|
|
|
|
|
|
|
|
|
|
|
As at December 31, 2017 |
- |
|
|
|
9,513 |
|
|
|
Changes From Financing Cash Flows: |
|
|
|
|
|
|
|
|
Dividends Paid |
|
(60 |
) |
|
- |
|
|
|
Net Issuance (Repayment) of Revolving Long-Term Debt |
- |
|
|
|
1 |
|
|
|
Non-Cash Changes: |
|
|
|
|
|
|
|
|
Dividends Declared |
|
60 |
|
|
- |
|
|
|
Unrealized Foreign Exchange (Gain) Loss |
- |
|
|
|
266 |
|
|
|
Finance Costs |
- |
|
|
|
1 |
|
|
|
As at March 31, 2018 |
- |
|
|
|
9,781 |
|
|
25. COMMITMENTS AND CONTINGENCIES
A) Commitments
Cenovus has entered into various commitments in the normal course of operations primarily related to demand charges on firm transportation agreements. In addition, the Company has commitments related to its risk management program and an obligation to fund its defined benefit pension and other post-employment benefit plans. Additional information related to the Company’s commitments can be found in the notes to the annual Consolidated Financial Statements for the year ended December 31, 2017.
As at March 31, 2018, total commitments were $21.5 billion, of which $18.2 billion were for various transportation commitments. Transportation commitments include $9 billion that are subject to regulatory approval or have been approved but are not yet in service (December 31, 2017 – $9 billion). Terms are up to 20 years subsequent to the date of commencement and should help align the Company’s future transportation requirements with anticipated production growth.
As at March 31, 2018, there were outstanding letters of credit aggregating $432 million issued as security for performance under certain contracts (December 31, 2017 – $376 million).
B) Contingencies
Legal Proceedings
Cenovus is involved in a limited number of legal claims associated with the normal course of operations. Cenovus believes that any liabilities that might arise from such matters, to the extent not provided for, are not likely to have a material effect on its Consolidated Financial Statements.
Contingent Payment
In connection with the Acquisition, Cenovus agreed to make quarterly payments to ConocoPhillips during the five years subsequent to May 17, 2017 for quarters in which the average WCS crude oil price exceeds $52.00 per barrel during the quarter. As at March 31, 2018, the estimated fair value of the contingent payment was $323 million (see Note 14).
|
Cenovus Energy Inc. |
27 |
For the period ended March 31, 2018 |
Exhibit 99.4
CENOVUS ENERGY INC.
Supplemental Financial Information (unaudited)
Exhibit to the March 31, 2018 Interim Consolidated Financial Statements
Consolidated Interest Coverage Ratios
The following financial ratios are provided by Cenovus Energy Inc. (the “Company”) in connection with the offering of common shares, debt securities, preferred shares, subscription receipts, warrants, share purchase contracts and/or units of the Company by way of base shelf prospectus dated October 10, 2017. These ratios are based on the Company's consolidated financial statements that are prepared in accordance with International Financial Reporting Standards, which are generally accepted in Canada.
Interest coverage ratios for the twelve month period ended March 31, 2018
|
|
(times) |
|
Net earnings available for all interest bearing financial liabilities (1)
|
5.5x |
|
Net earnings available for short-term borrowings and long-term debt before unrealized (gains) and losses on risk management activities (2) |
6.9x |
|
(1) |
Calculated as net earnings plus income tax and borrowing costs on all interest bearing financial liabilities; divided by borrowing costs for all interest bearing financial liabilities. Net earnings includes a non-cash revaluation loss of $2.6 billion. |
|
(2) |
Calculated as net earnings plus income tax, interest on short-term borrowings and long-term debt, and before unrealized (gains) and losses on risk management activities; divided by interest on short-term borrowings and long-term debt. Net earnings includes a non-cash revaluation loss of $2.6 billion. |
The Company believes the interest coverage ratio based on net earnings available for short-term borrowings and long-term debt before unrealized (gains) and losses on risk management activities is a relevant measure for investors as the realization of unrealized (gains) and losses are yet to be determined and will be realized in future periods.
Exhibit 99.5
CERTIFICATION OF INTERIM FILINGS
I, Alex J. Pourbaix, President & Chief Executive Officer of Cenovus Energy Inc., certify the following:
|
1. |
Review: I have reviewed the interim financial report and interim MD&A (together, the “interim filings”) of Cenovus Energy Inc. (the “issuer”) for the interim period ended March 31, 2018. |
|
2. |
No misrepresentations: Based on my knowledge, having exercised reasonable diligence, the interim filings do not contain any untrue statement of a material fact or omit to state a material fact required to be stated or that is necessary to make a statement not misleading in light of the circumstances under which it was made, with respect to the period covered by the interim filings. |
|
3. |
Fair presentation: Based on my knowledge, having exercised reasonable diligence, the interim financial report together with the other financial information included in the interim filings fairly present in all material respects the financial condition, financial performance and cash flows of the issuer, as of the date of and for the periods presented in the interim filings. |
|
4. |
Responsibility: The issuer’s other certifying officer(s) and I are responsible for establishing and maintaining disclosure controls and procedures (“DC&P”) and internal control over financial reporting (“ICFR”), as those terms are defined in National Instrument 52‑109 Certification of Disclosure in Issuers’ Annual and Interim Filings, for the issuer. |
|
5. |
Design: Subject to the limitations, if any, described in paragraphs 5.2 and 5.3, the issuer’s other certifying officer(s) and I have, as at the end of the period covered by the interim filings |
|
|
(a) |
designed DC&P, or caused it to be designed under our supervision, to provide reasonable assurance that |
|
|
(i) |
material information relating to the issuer is made known to us by others, particularly during the period in which the interim filings are being prepared; and |
|
|
(ii) |
information required to be disclosed by the issuer in its annual filings, interim filings or other reports filed or submitted by it under securities legislation is recorded, processed, summarized and reported within the time periods specified in securities legislation; and |
|
|
(b) |
designed ICFR, or caused it to be designed under our supervision, to provide reasonable assurance regarding the reliability of financial reporting and the preparation of financial statements for external purposes in accordance with the issuer’s GAAP. |
|
5.1 |
Control framework: The control framework the issuer’s other certifying officer(s) and I used to design the issuer’s ICFR is the Committee of Sponsoring Organizations of the Treadway Commission (“COSO”) framework in Internal Control – Integrated Framework. |
|
5.2 |
ICFR - material weakness relating to design: N/A |
|
5.3 |
Limitation on scope of design: The issuer has disclosed in its interim MD&A |
|
|
(a) |
the fact that the issuer's other certifying officer(s) and I have limited the scope of our design of DC&P and ICFR to exclude controls, policies and procedures of a business that the issuer acquired not more than 365 days before the last day of the period covered by the interim filings; and |
|
|
(b) |
summary financial information about the business that the issuer acquired that has been proportionately consolidated or consolidated in the issuer's financial statements. |
|
6. |
Reporting changes in ICFR: The issuer has disclosed in its interim MD&A any change in the issuer’s ICFR that occurred during the period beginning on January 1, 2018 and ended on March 31, 2018 that has materially affected, or is reasonably likely to materially affect, the issuer’s ICFR. |
|
/s/ Alex J. Pourbaix |
|
|
Alex J. Pourbaix |
|
|
President & Chief Executive Officer |
|
Exhibit 99.6
CERTIFICATION OF INTERIM FILINGS
I, Ivor M. Ruste, Executive Vice-President & Chief Financial Officer of Cenovus Energy Inc., certify the following:
|
1. |
Review: I have reviewed the interim financial report and interim MD&A (together, the “interim filings”) of Cenovus Energy Inc. (the “issuer”) for the interim period ended March 31, 2018. |
|
2. |
No misrepresentations: Based on my knowledge, having exercised reasonable diligence, the interim filings do not contain any untrue statement of a material fact or omit to state a material fact required to be stated or that is necessary to make a statement not misleading in light of the circumstances under which it was made, with respect to the period covered by the interim filings. |
|
3. |
Fair presentation: Based on my knowledge, having exercised reasonable diligence, the interim financial report together with the other financial information included in the interim filings fairly present in all material respects the financial condition, financial performance and cash flows of the issuer, as of the date of and for the periods presented in the interim filings. |
|
4. |
Responsibility: The issuer’s other certifying officer(s) and I are responsible for establishing and maintaining disclosure controls and procedures (“DC&P”) and internal control over financial reporting (“ICFR”), as those terms are defined in National Instrument 52‑109 Certification of Disclosure in Issuers’ Annual and Interim Filings, for the issuer. |
|
5. |
Design: Subject to the limitations, if any, described in paragraphs 5.2 and 5.3, the issuer’s other certifying officer(s) and I have, as at the end of the period covered by the interim filings |
|
|
(a) |
designed DC&P, or caused it to be designed under our supervision, to provide reasonable assurance that |
|
|
(i) |
material information relating to the issuer is made known to us by others, particularly during the period in which the interim filings are being prepared; and |
|
|
(ii) |
information required to be disclosed by the issuer in its annual filings, interim filings or other reports filed or submitted by it under securities legislation is recorded, processed, summarized and reported within the time periods specified in securities legislation; and |
|
|
(b) |
designed ICFR, or caused it to be designed under our supervision, to provide reasonable assurance regarding the reliability of financial reporting and the preparation of financial statements for external purposes in accordance with the issuer’s GAAP. |
|
5.1 |
Control framework: The control framework the issuer’s other certifying officer(s) and I used to design the issuer’s ICFR is the Committee of Sponsoring Organizations of the Treadway Commission (“COSO”) framework in Internal Control – Integrated Framework. |
|
5.2 |
ICFR - material weakness relating to design: N/A |
|
5.3 |
Limitation on scope of design: The issuer has disclosed in its interim MD&A |
|
|
(a) |
the fact that the issuer's other certifying officer(s) and I have limited the scope of our design of DC&P and ICFR to exclude controls, policies and procedures of a business that the issuer acquired not more than 365 days before the last day of the period covered by the interim filings; and |
|
|
(b) |
summary financial information about the business that the issuer acquired that has been proportionately consolidated or consolidated in the issuer's financial statements. |
|
6. |
Reporting changes in ICFR: The issuer has disclosed in its interim MD&A any change in the issuer’s ICFR that occurred during the period beginning on January 1, 2018 and ended on March 31, 2018 that has materially affected, or is reasonably likely to materially affect, the issuer’s ICFR. |
|
/s/ Ivor M. Ruste |
|
|
|
Ivor M. Ruste |
|
|
|
Executive Vice-President & Chief Financial Officer |
||