Hot Features
The Canadian Dollar is making headway against the USD, amid a backdrop of higher crude oil prices and the world warming up to the idea that there is an end in sight for the coronavirus crisis.
From a technical point of view, the USDCAD could be ready to drop further as investors price in the better conditions in the world economy.
Factors Supporting the Canadian Dollar
Crude oil prices have risen by 397% from the April 21 low, as the world economy is slowly reopening. From a risk-reward ratio, I see limited gains in crude oil prices, but the higher prices will probably boost the Canadian economy, and keep the Loonie supported.
Covid-19 Crisis Abating
Yesterday, on a global basis, the number of confirmed new coronavirus cases rose by 1.9%. But for key economies such as the USA, the rise was a low 1.3%, while the UK saw a rise of 0.9%, France 0.5%, and Germany 0.32%.
More countries are now reopening, which is slowing the demand for US Dollars. Also, news that a vaccine against the virus is in the making is further boosting the mood of investors. I think these factors will keep on improving in the weeks ahead, and on the USDCAD breaking the support level of 1.3842, we might see more investors start to price in this CAD bullish scenario.
USDCAD: Watch this Level for a Potential Drop in Price
From a technical point of view, the USDCAD pair has been trading sideways since March 27. However, over the last few weeks, the price has carved out a bearish descending triangle pattern.
The pattern is formed as the price on April 13, and 30 bounced from the 1.3842 level. Yesterday the price tried to trade below 1.3842 for the third time. The 1.3842 level seems, therefore, to be an essential level for investors. If we trade below that level, then any buyer from April 14 still being long the USDCAD will be losing money, and keen on reducing risk.
Consequently, on a break to 1.3842, a cascade of stop-loss orders might further suppress the price, i.e. boost the Canadian Dollar.
Take Profit Level
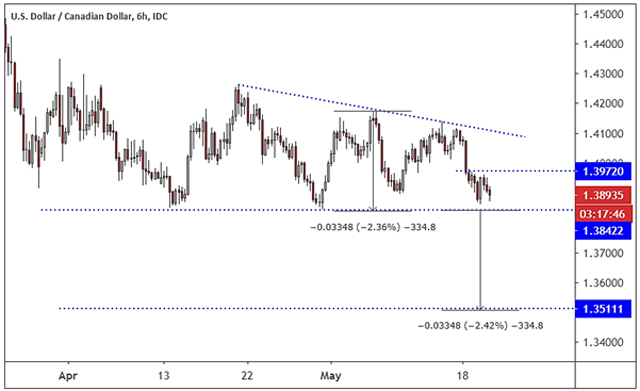
As we can draw a downward sloping trend line via the April 21, May 6 and 14 highs, and there is a clear horizontal support level, the pattern we see in the chart below is a descending triangle pattern. It suggests that on a break to the horizontal support level of 1.3842, the price could decline to 1.3508.
The target is derived by subtracting the difference between the horizontal support and May 6 high, from 1.3842.
Invalidation level
If the price indeed trades below the 1.3842 level, the bearish pattern will remain in play as long as the price trades below the May 19 high of 1.3972.
USDCAD Chart
By Alejandro Zambrano, Chief Market Strategist at ATFX.