Hot Features
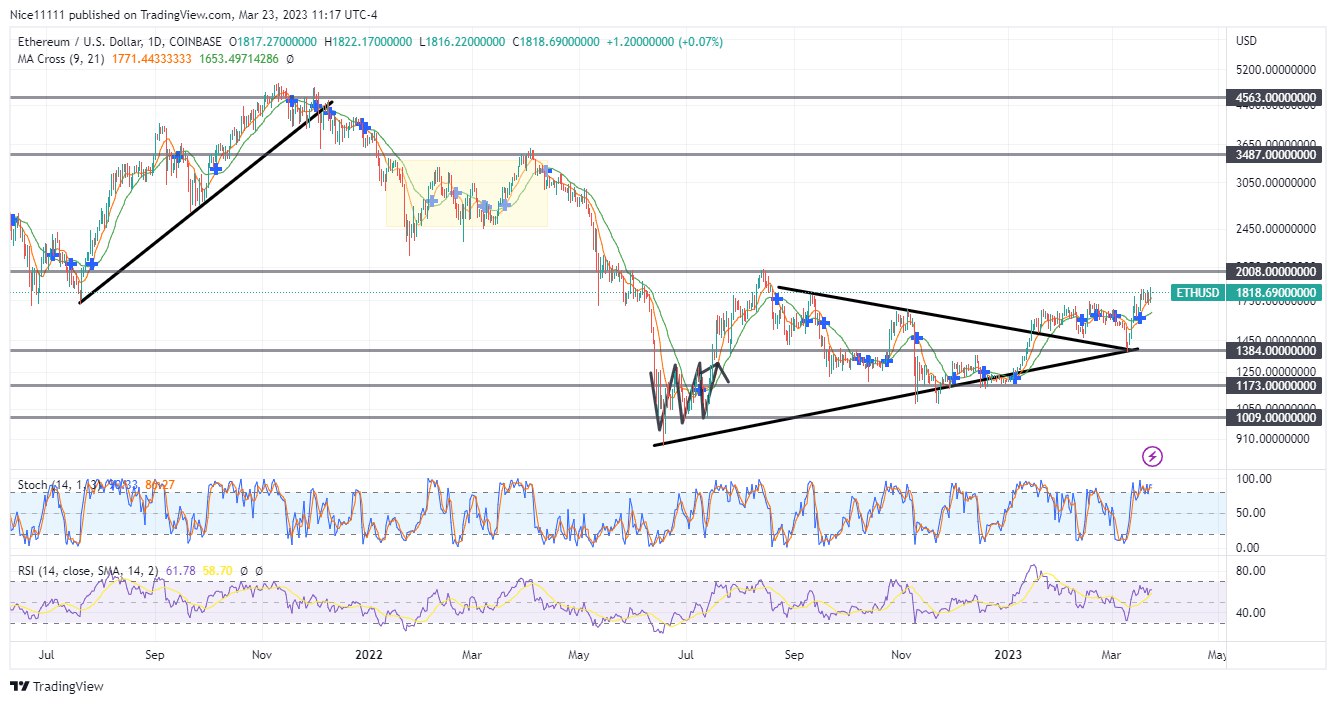
Ethereum has just experienced a bullish breakout from a symmetrical triangle on the daily chart. The previous year was characterized by a bearish order flow. After the test of the supply region at 4563.0 the market direction changed from an uptrend to a downward trend.

More sell orders were filled in March upon the retracement to the 3487.0 resistance level. The market dived to the 1009.0 support level afterward. A triple-bottom bullish reversal pattern formed at the support level which led to an ascent. Lower highs and higher lows formed a symmetry triangle on the daily chart. In January 2023, the ascent broke out of the symmetrical triangle. The market is driving towards $2008.0 due to a retest after the breakout.
ETHUSD Key Levels
Demand Levels: $1384.0, $1173.0, $1009.0
Supply Levels: $2008.0, $3487.0, $4563.0
What Are the Indicators Saying?
In November 2021, the Stochastic and the RSI ( relative strength index) signified the market was overbought. This fostered a decline in price upon the cross of the Movie Averages (periods nine and twenty-one). In June 2022 both the Stochastic and the RSI signaled the market was Oversold at the test of the support level of 1009.0. The retest following the bullish breakout from the symmetrical triangle was in the oversold region as signified by the Stochastic and the RSI. The market is currently driving to $2008.0.
Learn from market wizards: Books to take your trading to the next level