Internet Computer (ICP) Bleeds, What Are The Chances For Reversal?
May 02 2023 - 6:54AM
NEWSBTC
Internet Computer (ICP) is trading red, hovering around the $5.6
price mark today, May 2, 2023. According to its daily chart, the
bearish trend began two days ago, following three-day bullish
moves. The turn in the market sentiment has resulted in the recent
plunge in ICP price. Aside from this, the world’s largest
cryptocurrency, Bitcoin, is also down by 1.89% over the past 24
hours. This could also be a factor affecting ICP’s price at the
moment. While a reversal is not certain, some technical indicators
can show whether or not the chances are high. Internet Computer
(ICP) Price Outlook Judging from the ICP price of $3.9309 at the
start of 2023, the token has made more bullish moves than bearish
ones. ICP currently trades at $5.719, showing a 24-hour price
decline of 5.99%. Related Reading: Terra Classic Recent Efforts
Could Benefit LUNC’s Growth Potential The token’s market cap has
dropped by 6.50% in the last 24 hours to around $2.46 billion. The
trading volume within the same period has also declined by 20.69%,
hovering around $60,208,714. The plummeting value of the trading
volume indicates more selling pressure among investors and traders.
If this trend continues, ICP may likely see its price fall to the
$5 price level before the end of the day. Moreover, data
suggests that the general price prediction sentiment of the
Internet Computer token is bearish. Based on its findings, 17
indicators signal a bearish trend, while 11 technical indicators
display bullish signals. But let’s consider some major
indicators from the daily chart to confirm its potential move
further. ICP Technical Analysis The price of the Internet Computer
token is currently above the 50-day and 200-day Simple Moving
Averages. While that is supposed to indicate a buy tendency, the
Relative Strength Index (RSI) negates it, as it stands at 50.42.
This figure suggests a neutral state in the ICP market but with
higher odds of selling pressure. The token made a Death Cross
several days back which lead to a significant drop in its price.
The market may create a Golden Cross later on, but this might come
after a major decline in its price, considering the interpretation
of the technical indicators. Related Reading: AVAX Smart Contracts
Hit 6-Month High – What This Means For Its Price The chart also
shows that ICP’s price fell from a resistance level of $6.339.
Crypto traders and investors can expect its price to fall further
to hit the closest support level of $4.996. Other resistance and
support levels are $7.449 and $4.525, respectively. Note that even
while the technical indicators can be a helpful tool for analysis,
investment decisions shouldn’t be made solely based on them.
Traders should also consider various factors and risk management
strategies. Featured image from Pixabay and chart from Tradingview
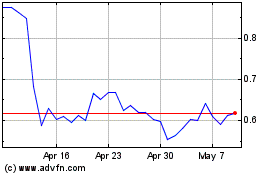
Terra (COIN:LUNAUSD)
Historical Stock Chart
From Mar 2024 to Apr 2024

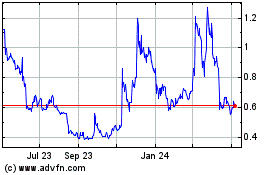
Terra (COIN:LUNAUSD)
Historical Stock Chart
From Apr 2023 to Apr 2024
