AFRM Stock: Affirm Is a BNPL Company With Massive Potential
September 10 2021 - 2:31PM
Finscreener.org
Similar to most IPOs or initial
public offerings Affirm (NASDAQ:
AFRM) stock has been
volatile since it went public in January 2021. AFRM stock fell from
$117/share in January to $46.5 in May before it regained momentum
to currently trade at $120.24.
Despite its wild swings, here’s
why I think Affirm stock remains a solid bet for long-term
investors.
An overview of Affirm
Affirm Holdings operates as a
BNPL (buy-now-pay-later) platform for digital and mobile-first
commerce in Canada and the U.S. Its platform includes POS or
point-of-sales payment solutions for customers, merchant commerce
solutions as well as a consumer-focused application. Affirm’s
payments network and partnership with an originating bank allows
customers to pay for a purchase over time. The payment periods can
range anywhere between one to 48 months.
At the end of June 2021, the BNPL
company had partnered with 29,000 merchants significantly higher
than the 6,500 figure in the prior-year period. Its merchants base
includes small businesses, large enterprises, direct-to-consumer
brands, and traditional retail stores.
In the June quarter, Affirm
increased its
gross merchandise volume
or GMV by 106% year over year to
$2.5 billion. In fiscal 2021 that ended in June, GMV rose by 79% to
$8.3 billion. Affirm also grew its active consumers by 97% to 7.1
million while transactions per active customer were up 8% at 2.3 at
the end of June.
Recent quarterly results drove AFRM stock
higher
In Q4, Affirm reported sales of
$261.8 million, which was an increase of 71% year over year. Sales
growth was attributed to increases in network revenue and interest
income. Its total revenue after accounting for transaction costs
rose to $147.7 million, up from $107.6 million in the prior-year
period. This included a $32.2 million gain in provision for credit
losses on the back of stronger than expected repayments as well as
reduced stress multiples.
Its operating loss stood at
$124.7 million compared to a profit of $39.3 million in the prior
year period. However, this includes a non-recurring charge of
$105.2 million that relates to stock-based compensation. Adjusted
operating income was $14.2 million, lower than an adjusted
operating income of $476.7 million in Q4 of 2020.
The company reported an adjusted
net loss of $0.48 per share. Analysts expected Affirm sales to
touch $226.4 million with an adjusted loss of $0.29 per share in
fiscal Q4.
In June this year, Affirm
advanced its partnership with Canadian tech heavyweight Shopify
(NYSE:
SHOP). Now, Shopify Pay installments are exclusively
powered by Affirm and this solution is available to all eligible
Shopify merchants in the U.S.
Last month, Affirm also announced
a non-exclusive partnership with Amazon (NASDAQ:
AMZN) to offer its
flexible payment solutions to consumers who shop on Amazon.com in
the U.S. Affirm will allow customers to split the cost of purchases
of over $50 into monthly payments without any fees.
What next for Affirm stock?
Affirm stock is currently trading
at a market cap of $32 billion. Analysts tracking the company
expect sales to touch $1.17 billion in fiscal 2022 and $1.54
billion in 2023. This top-line expansion will enable AFRM stock to
reduce its adjusted losses from $2.72 per share in fiscal 2021 to
$0.46 per share in fiscal 2022.
This indicates AFRM stock is
valued at a forward price to sales multiple of 27.4x which is
steep. But the company’s management team remains optimistic about
long-term growth.
Michael Linford, CFO of Affirm
said, “We delivered another set of excellent results to close out
our fiscal year with GMV and revenue growth continuing to
accelerate. During the fourth quarter, we delivered strong unit
economics while driving even greater capital efficiency. The
strategic progress we achieved in fiscal year 2021 sets us up for
long-term growth. We have never been more confident and excited in
AffirmU+02019s future."
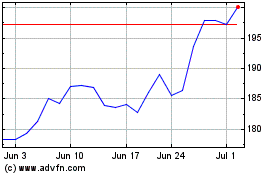
Amazon.com (NASDAQ:AMZN)
Historical Stock Chart
From Mar 2024 to Apr 2024

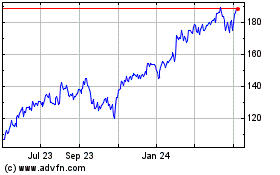
Amazon.com (NASDAQ:AMZN)
Historical Stock Chart
From Apr 2023 to Apr 2024
