0001167419false00011674192025-02-242025-02-24

UNITED STATES

SECURITIES AND EXCHANGE COMMISSION

Washington, D.C. 20549

FORM 8-K

CURRENT REPORT

PURSUANT TO SECTION 13 OR 15(D) OF

THE SECURITIES EXCHANGE ACT OF 1934

Date of Report (Date of earliest event reported): February 24, 2025

Riot Platforms, Inc.

(Exact name of registrant as specified in its charter)

Nevada


001-33675


84-1553387

(State or other jurisdiction of incorporation)

(Commission File Number)

(I.R.S. Employer Identification No.)

3855 Ambrosia Street, Suite 301

Castle Rock, CO 80109

(Address of principal executive offices)

(303) 794-2000

(Registrant’s telephone number, including area code)

(Former name, former address, and former fiscal year, if changed since last report.)

Check the appropriate box below if the Form 8-K filing is intended to simultaneously satisfy the filing obligation of the registrant under any of the following provisions:

  Written communications pursuant to Rule 425 under the Securities Act (17 CFR 230.425)

  Soliciting material pursuant to Rule 14a-12 under the Exchange Act (17 CFR 240.14a-12)

  Pre-commencement communications pursuant to Rule 14d-2(b) under the Exchange Act (17 CFR 240.14d-2(b))

  Pre-commencement communications pursuant to Rule 13e-4(c) under the Exchange Act (17 CFR 240.13e-4(c))

Securities registered pursuant to Section 12(b) of the Exchange Act:

Title of each class


Trading Symbol(s)


Name of each exchange on which
registered

Common Stock, no par value per share

RIOT

Nasdaq Capital Market

Indicate by check mark whether the registrant is an emerging growth company as defined in Rule 405 of the Securities Act of 1933 (§230.405 of this chapter) or Rule 12b-2 of the Securities Exchange Act of 1934 (§240.12b-2 of this chapter).

Emerging growth company 

If an emerging growth company, indicate by check mark if the registrant has elected not to use the extended transition period for complying with any new or revised financial accounting standards provided pursuant to Section 13(a) of the Exchange Act. 

Item 2.02 – Results of Operations and Financial Condition.

On February 24, 2025, Riot Platforms, Inc. (together with its consolidated subsidiaries, the “Company”) issued a press release (the “Press Release”) and an update on the Company’s business and financial results and results of operations for the year ended December 31, 2024 (the “2024 Earnings Deck”) on its website, www.riotplatforms.com, under the “Investor Relations” tab. The full text of the Press Release and the 2024 Earnings Deck are attached to this Current Report on Form 8-K (this “Report”) as Exhibit 99.1 and 99.2, respectively.

The information under this Item 2.02 of this Report, including Exhibits 99.1 and 99.2 attached hereto, is furnished and shall not be deemed “filed” for purposes of Section 18 of the Securities Exchange Act of 1934, as amended, (the “Exchange Act”) nor shall it be deemed incorporated by reference in any filing under the Securities Act of 1933, as amended, or the Exchange Act, except as shall be expressly set forth by specific reference in such a filing.

Item 9.01 – Financial Statements and Exhibits.

(d)Exhibits.

EXHIBIT INDEX

Exhibit No.


Description

99.1

99.2

Press Release of Riot Platforms, Inc. dated February 24, 2025.

Riot Platforms, Inc. 2024 Earnings Deck, dated as of February 24, 2025.

104

Cover Page Interactive Data File (embedded within the Inline XBRL document)

S I G N A T U R E

Pursuant to the requirements of the Securities Exchange Act of 1934, as amended, the registrant has duly caused this report to be signed on its behalf by the undersigned hereunto duly authorized.

RIOT PLATFORMS, INC.

By:

/s/ Colin Yee

Name:

Colin Yee

Title:

Chief Financial Officer

Date: February 24, 2025

Exhibit 99.1

Riot Platforms Reports Full Year 2024 Financial Results, Current Operational and Financial

Highlights

Riot Reports $376.7 million in Total Revenue and Deployed Hash Rate of 31.5 EH/s

CASTLE ROCK, Colo., February 24, 2025 (GLOBE NEWSWIRE) -- Riot Platforms, Inc. (NASDAQ: RIOT) (“Riot” or “the Company”), an industry leader in vertically integrated Bitcoin mining, reported financial results for the full year ended December 31, 2024. The accompanying presentation materials are available on Riot’s website.

“Riot had a remarkable year in 2024, generating record revenue of $376.7 million and net income of $109.4 million,” said Jason Les, CEO of Riot. “These results are particularly noteworthy in the context of the Bitcoin network’s ‘halving’ in April of 2024, and an increase in global hash rate of 67% over the course of the year. Riot also generated record adjusted EBITDA of $463.2 million in 2024, demonstrating the value of our Bitcoin treasury policy of retaining Bitcoin production rather than selling. Due to our efforts over the prior year, we are in an exceptionally strong position and focused on executing on the exciting opportunities ahead of us to maximize shareholder value, particularly on the AI/HPC front.

“The year 2024 was marked by major growth initiatives coming to fruition, including the energization of our Corsicana Facility, and the acquisitions of Block Mining and E4A Solutions, a leading electrical engineering services company which complements our Engineering business and our Bitcoin mining operations. These growth initiatives, combined with our significantly improved operating performance, have resulted in Riot mining 4,828 Bitcoin during the year, at an average direct cost of $32,216 per coin. This low cost to mine was made possible by Riot’s unique power strategy, which again yielded strong results with an all-in cost of power of 3.4 cents per kilowatt hour across all facilities during the year.

“In addition to our mining operations adding Bitcoin to our balance sheet, Riot also took a major step forward in our Bitcoin yield strategy by closing on our inaugural convertible senior notes offering, successfully raising $579 million in net proceeds in December 2024 on highly attractive terms. Riot utilized the proceeds from this offering to acquire an additional 5,784 Bitcoin, bringing total holdings at the end of the year to 17,722 Bitcoin, a 141% increase over the prior year and resulting in a 39% Bitcoin yield for our shareholders in 2024.  Demonstrating continued accretion in Bitcoin yield will continue to be a key focus for Riot going forward.

“Looking ahead to 2025, Riot recently announced we have engaged financial advisors and are pursuing opportunities in the AI/HPC sector for the Company’s power assets at our Corsicana Facility. With one gigawatt of overall capacity, 600 megawatts of which are unutilized, we believe this large amount of readily available power located near a major metropolitan area in Dallas, TX is a rare offering, and we are accelerating conversations with potential counterparties to best maximize the value of the Corsicana Facility and all other assets within Riot.”


Graphic

Fiscal Year 2024 Financial and Operational Highlights

Key financial and operational highlights for the fiscal year ended December 31, 2024 include:

Total revenue of $376.7 million, as compared to $280.7 million for the same period in 2023. The increase was primarily driven by a $132.0 million increase in Bitcoin mining revenue.
Produced 4,828 Bitcoin, as compared to 6,626 during the same twelve-month period in 2023.
The average cost to mine Bitcoin, excluding depreciation, was $32,216 in 2024, as compared to $3,831 per Bitcoin in 2023. The increase was primarily driven by a 53% decrease in power credits received in FY 2024 relative to power credits received in FY 2023, the block subsidy ‘halving’ event, which occurred in April 2024, and a 67% increase in the average global network hash rate as compared to the same period in 2023.
Generated $33.7 million in power credits during the year, as compared to $71.2 million in power credits generated for the same twelve-month period in 2023.
Bitcoin Mining revenue of $321.0 million for the year, as compared to $189.0 million for the same twelve-month period in 2023, primarily driven by higher average Bitcoin prices and an increase in operational hash rate, partially offset by an increase in network difficulty and the block subsidy ‘halving’ event.
Engineering revenue of $38.5 million for the year, as compared to $64.3 million for the same twelve-month period in 2023. This decrease was primarily driven by one large manufacturing contract for a governmental entity which took longer than anticipated to complete due to supply chain constraints during the year, which resulted in decreased receipts of materials and delayed recognition of revenue.
Maintained industry-leading financial position, with $439.1 million in working capital, including $277.9 million in cash on hand and $134.3 million in marketable equity securities.
Held 17,722 unencumbered Bitcoin, equating to approximately $1.65 billion based on a market price for one Bitcoin on December 31, 2024, of $93,354.

About Riot Platforms, Inc.


Riot’s (NASDAQ: RIOT) vision is to be the world’s leading Bitcoin-driven infrastructure platform.

Our mission is to positively impact the sectors, networks and communities that we touch. We believe that the combination of an innovative spirit and strong community partnership allows the Company to achieve best-in-class execution and create successful outcomes.

Riot is a Bitcoin mining and digital infrastructure company focused on a vertically integrated strategy. The Company has Bitcoin mining operations in central Texas and Kentucky, and electrical engineering and fabrication operations in Denver, Colorado, and Houston, Texas.

For more information, visit www.riotplatforms.com.

Safe Harbor

Statements in this press release that are not historical facts are forward-looking statements that reflect management’s current expectations, assumptions, and estimates of future performance and economic conditions. Such statements rely on the safe harbor provisions of Section 27A of the Securities Act of 1933, as amended, and Section 21E of the Securities Exchange Act of 1934, as amended. Because such statements are subject to risks and uncertainties, actual results may differ materially from those expressed or implied by such forward-looking statements. Words such as “anticipates,” “believes,” “plans,” “expects,” “intends,” “will,” “potential,” “hope,” similar expressions and their negatives are intended to identify forward-looking statements. These forward-looking statements may include, but are not limited to, statements relating to the Company’s development at its facilities and the Company’s plans, projections, objectives, expectations, and intentions about future events and trends that it believes may affect the Company’s financial condition, results of operations, business strategy, short-term and long- term business operations and objectives and financial needs. These forward-looking statements are subject to a number of risks and uncertainties, including, without limitation: risks related to the Company’s growth, the anticipated demand for AI/HPC uses, the feasibility of developing the Company’s power capacity for AI/HPC uses, competition in the markets in which the Company operates, market growth, the Company’s ability to innovate and expand into new markets, the Company’s ability to realize benefits from its implementation of new strategies into its business, estimates of Bitcoin production; our future hash rate growth (EH/s); the anticipated benefits, construction schedule, and costs associated with the development of our mining facilities in Texas, Kentucky and elsewhere; our expected schedule of new miner deliveries; our access to electrical power; the impact of weather events on our operations and results; our ability to successfully deploy new miners; the variance in our mining pool rewards may negatively impact our results of Bitcoin production; our megawatt capacity under development; risks related to the Company’s inability to realize the anticipated benefits from immersion cooling; the inability to integrate acquired businesses successfully, or such integration may take longer or be more difficult, time-consuming or costly to accomplish than anticipated; or the failure of the Company to otherwise realize anticipated efficiencies and strategic and financial benefits from our business strategies. Detailed information regarding the factors identified by the Company’s management which they believe may cause actual results to differ materially from those expressed or implied by such forward-looking statements in this press release may be found in the Company’s filings with the U.S. Securities and Exchange Commission (the “SEC”), including the risks, uncertainties and other factors discussed under the sections entitled “Risk Factors” and “Cautionary Note Regarding Forward-Looking Statements” of the Company’s Annual Report on Form 10-K for the fiscal year ended December 31, 2023, as amended, and the other filings the Company makes with the SEC, copies of which may be obtained from the SEC’s website, www.sec.gov. All forward- looking statements included in this press release are made only as of the date of this press release, and the Company disclaims any intention or obligation to update or revise any such forward-looking statements to reflect events or circumstances that subsequently occur, or of which the


Company hereafter becomes aware, except as required by law. Persons reading this press release are cautioned not to place undue reliance on such forward-looking statements.

For further information, please contact:

Investor Contact:
Phil McPherson
IR@Riot.Inc

Media Contact:

Alexis Brock

303-794-2000 ext. 118

PR@Riot.Inc


Exhibit 99.2

GRAPHIC

Riot Platforms (NASDAQ: RIOT) 2024 Update February 24, 2025 NASDAQ: RIOT

GRAPHIC

Statements in this presentation that are not statements of historical fact are forward-looking statements that reflect management’s current expectations, assumptions, and estimates of future performance and economic conditions, and are not guarantees of future performance or actual results. Such statements are made in reliance on the safe harbor provisions of Section 27A of the Securities Act of 1933, as amended, and Section 21E of the Securities Exchange Act of 1934, as amended. These forward-looking statements may include, but are not limited to, statements about the benefits of acquisitions, including potential future financial and operating results, as well as the Company’s plans, objectives, expectations, and intentions. Words such as “anticipates,” “believes,” “plans,” “expects,” “intends,” “will,” “potential,” “hope,” and similar expressions are intended to identify forward-looking statements; however, forward-looking statements may be made without such signifying expressions. Because such forward-looking statements reflect management’s current expectations, assumptions and estimates of future performance and economic conditions, they are subject to risks and uncertainties that may cause actual results to differ materially from those expressed or implied by such forward-looking statements. These risks and uncertainties include, but are not limited to: unaudited estimates of Bitcoin production; our future hash rate growth (EH/s); the anticipated benefits, construction schedule, and costs associated with the Corsicana Facility; our expected schedule of new miner deliveries; our ability to successfully deploy new miners; MW capacity under development; risks related to our realization of the benefits we anticipate from immersion-cooling; risks related to the success, schedule, cost and difficulty of integrating businesses we acquire; our failure to realize anticipated efficiencies and strategic and financial benefits from our acquisitions; and the impact that COVID-19 and other global events may have on us, our customers, our suppliers, and on economic conditions in connection with our estimated timelines, future performance and operations. Detailed information regarding the factors identified by the Company’s management which they believe may cause actual results to differ materially from those expressed or implied by the forward-looking statements contained in this presentation may be found in the Company’s filings with the U.S. Securities and Exchange Commission (the “SEC”), including the risks, uncertainties and other factors discussed under the sections entitled “Risk Factors” and “Cautionary Note Regarding Forward-Looking Statements” of the Company’s Annual Report on Form 10-K for the fiscal year ended December 31, 2024, as amended, and the other filings the Company makes with the SEC, copies of which may be obtained from the SEC’s website, www.sec.gov. In addition to these risks and those identified by the Company’s management and disclosed in the Company’s filings with the SEC, other risks, factors and uncertainties not identified by management, or which management does not presently believe to be material to the Company, its business or prospects, may also materially affect the Company’s actual future results, including in ways adverse to the Company’s business. All forward-looking statements included in this presentation are made only as of the date of this presentation, and the Company disclaims any intention or obligation to update or revise any such forward-looking statements to reflect events or circumstances that subsequently occur, or of which the Company hereafter becomes aware, except as required by law. Persons reading this presentation are cautioned not to place undue reliance on such forward-looking statements. 2 Forward Looking Statements

GRAPHIC

3 Table of Contents I. 2024 Milestones & Key Accomplishments II. 2024 Financial Review III. Growing Engineering Division: E4A Solutions Acquisition IV. Capital Strategy: BTC Treasury V. Maximizing Value of 2.0 GW of Capacity VI. Key Focus Areas for 2025 I II III IV V VI

GRAPHIC

4 2024 Milestones & Key Accomplishments Corsicana Phase 1 Deployment E4A Solutions Acquisition BTC Yield Treasury Strategy ▪ In April 2024, Riot energized 400 MW substation and began self-mining operations at the Corsicana Facility ▪ Successfully ramped up to 14.1 EH/s in deployed hash rate by December 2024 ▪ Riot paused the sale of Bitcoin earned from self-mining operations beginning January 2024 ▪ Led to 4,576 self-mined Bitcoin being added to Riot’s balance sheet over the course of FY 2024 ▪ Achieved a 39% BTC Yield in FY 2024 ▪ In December 2024, Riot acquired E4A Solutions, a leading electronic engineering services company based in Houston, Texas ▪ Improves mining operations and creates synergies with Riot’s manufacturing business I Convertible Senior Notes Offering ▪ In December 2024, Riot announced the closing of a $594 million Convertible Senior Notes Offering ▪ Riot deployed net proceeds of $579 million from the offering to acquire an additional 5,784 Bitcoin Block Mining Acquisition ▪ In July 2024, Riot acquired Block Mining for $92.5 million consideration at closing ▪ Added 60 MW of operational capacity and a pipeline to build to a total of 305 MW in Kentucky

GRAPHIC

FY 2023 Financial Update 5 II 2024 Financial Review 700 MW Rockdale Facility – Rockdale, Texas

GRAPHIC

6 Bitcoin produced 4,828 BTC ▪ Equates to an average annual production of 13.2 BTC per day Bitcoin held 1 17,722 BTC ▪ 141% increase year-over-year; value of $1,654MM Bitcoin held per 1M fully diluted shares 2 44.3 BTC / 1M shares ▪ 39% increase year-over-year Ending hash rate deployed 31.5 EH/s ▪ 154% increase year-over-year Fleet Efficiency 21.9 J/TH ▪ 21% improvement year-over-year from deployment of new MicroBT miners Revenue $376.7 million ▪ 34% increase vs. FY 2023; $321.0MM in self-mining Net income / Net income per share $109.4 million / $0.40 ▪ Includes $212.1MM in D&A, $125.2MM in SBC, $45.3MM gain on derivative asset, $457.4MM unrealized gain on Bitcoin held and $69.5MM loss on marketable equity securities held Cost of power 3 3.4 c/kWh ▪ Realized all-in power price continues to be one of the lowest in the industry Power curtailment credits $33.7 million ▪ Riot's power strategy continues to yield strong results while also supporting power grids Adj. EBITDA3 $463.2 million ▪ Adjustments include $149MM in non-cash expenses (stock-based comp, mark-to-market power derivatives & marketable equity securities) Hash Cost 4 ~$28/PH/s/Day ▪ Compared to FY 2024 average hash price of $64/PH/s/Day 1. Bitcoin value based on a closing price of $93,354 on December 31, 2024, sourced from Coinbase. 2. Fully diluted shares outstanding includes common stock outstanding, all additional shares resulting from the assumed conversion of all outstanding convertible notes, exercise of all outstanding stock option awards, and settlement of all outstanding shares of restricted stock units and performance stock units. 3. See Appendix slides 31-35 for definitions, terms, and reconciliations. 4. Only includes Bitcoin Mining segment cost of revenue net of power curtailment credits. Riot Platforms FY 2024 Snapshot

GRAPHIC

378 630 FY 2023 FY 2024 31.8 44.3 FY 2023 FY 2024 6,626 4,828 FY 2023 FY 2024 Riot Platforms – 154% Increase in Hash Rate Year-over-Year and 141% increase in Bitcoin Held on Balance Sheet 7 Year-over-Year Hash Rate (EH/s) BTC per 1M Fully Diluted Shares (# of BTC) Bitcoin Produced (# of BTC) Bitcoin Held (# of BTC) 12.4 31.5 FY 2023 FY 2024 +154% 7,362 17,722 FY 2023 FY 2024 +67% +141% 1 2 1 2 1 2 1 2 ▪ FY 2024 Self-Mining deployed hash rate up 154% over FY 2023, outpacing network hash rate growth of 67% ▪ Increased Bitcoin Per 1M fully diluted shares by 39% during the year through new treasury strategy ▪ FY 2024 Bitcoin Production down only 27% as compared to FY 2023, despite a 67% increase in average global network hash rate and the block subsidy ‘halving’ event in April 2024 ▪ Bitcoin held increased to 17,722 Bitcoin, a 141% increasing year-over-year -27% 1. As of December 31, 2023. 2. As of December 31, 2024. 3. Sourced from Blockchain.com as of December 31, 2024. Pre-Halving Halving in April 2024 5,784 11,938 Purchased BTC Self-Mined BTC +39% 1 2 Network Hash Rate Riot Deployed Hash Rate 3

GRAPHIC

EPS $0.82 $(0.32) $(0.54) $0.43 $(0.28) $0.40 $245.7 $(75.2) $(3.6) $296.3 $214.0 $463.2 -$150 m -$50 m $50 m $150 m $250 m $350 m $450 m $550 m Q1 2024 Q2 2024 Q3 2024 Q4 2024 FY 2023 FY 2024 $37.3 $30.3 $24.3 $55.7 $97.6 $147.6 47% 43% 29% 39% 35% 39% 0% 10% 20% 30% 40% 50% 60% 70% 80% $0 m $20 m $40 m $60 m $80 m $100 m $120 m $140 m $160 m Q1 2024 Q2 2024 Q3 2024 Q4 2024 FY 2023 FY 2024 Gross Profit ($ million) Gross Margin (%) $71.4 $55.8 $67.5 $126.4 $189.0 $321.0 $4.7 $9.6 $12.6 $11.5 $64.3 $38.5 $3.2 $4.6 $4.7 $4.6 $27.4 $17.2 $79.3 $70.0 $84.8 $142.6 $280.7 $376.7 Q1 2024 Q2 2024 Q3 2024 Q4 2024 FY 2023 FY 2024 Bitcoin Mining Engineering Other Riot Platforms – Increase in Company Wide Revenue, Gross Profit & Margin, EBITDA, and Net Income Year-over-Year 8 1. ‘Data Center Hosting’ segment included in ‘Bitcoin Mining’ for FY 2023 due to reclassification of business segments in FY 2024. 2. See Appendix slides 31-35 for definitions, terms, and reconciliations. Adjusted EBITDA ($ million) Revenue ($ million) / Growth per Quarter (%) -12% Net Income ($ million) Gross Profit2 ($ million) / Gross Margin2 (%) 2 2 +21% EoP BTC Price $71,334 $62,678 $63,330 $93,429 $42,265 $93,354 +68% +34% 1 $211.8 $(84.4) $(154.4) $136.4 $(49.5) $109.4 Q1 2024 Q2 2024 Q3 2024 Q4 2024 FY 2023 FY 2024

GRAPHIC

12.4 EH/s 22.0 EH/s 28.2 EH/s 31.5 EH/s 12.4 EH/s 31.5 EH/s Q1 2024 Q2 2024 Q3 2024 Q4 2024 FY 2023 FY 2024 $71.4 $55.8 $67.5 $126.3 $189.0 $321.0 56% 62% 42% 50% 87% 52% -10% 10% 30% 50% 70% 90% $0 m $50 m $100 m $150 m $200 m $250 m $300 m $350 m Q1 2024 Q2 2024 Q3 2024 Q4 2024 FY 2023 FY 2024 Bitcoin Mining Revenue ($ million) Gross Margin (%) Bitcoin Mining Segment – Increasing Revenue and Gross Margins 9 ▪ 52% Gross Margin for FY 2024, when allocating $33.7MM in power credits to the Bitcoin Mining segment ▪ FY 2024 Cost to Mine of $32,216 per Bitcoin, with the increase in Q4 2024 Cost to Mine primarily driven by higher network difficulty and higher average energy costs ▪ Q4 2024 BTC Production increased 37% over the previous quarter, despite average global network hash rate increasing by 16% over the same period 1. Sourced from Blockchain.com as of December 31, 2024. 2. See Appendix slides 31-35 for definitions, terms, and reconciliations. 3. Year ended December 31, 2024. Q1 2024 Q2 2024 Q3 2024 Q4 2024 FY 2023 FY 2024 Avg. Hash Price ($/PH/s/Day) $92 $67 $45 $54 $75 $65 Avg. Network Hash Rate1 568 EH/s 604 EH/s 625 EH/s 728 EH/s 378 EH/s 630 EH/s Cost to Mine2 $23,034 $25,327 $35,376 $42,016 $3,831 $32,216 # of BTC produced 1,364 844 1,104 1,516 6,626 4,828 Riot Revenue Breakdown – FY 2024 3 Revenue / Gross Margin 2 (%) Ending Hash Rate Capacity 85% 10% 5% 2 Bitcoin Mining Engineering +77% Other +28% +12% +154% -22% +21% +87% +70%

GRAPHIC

$26,673 $33,281 $2,705 $23,889 $8,703 $8,730 $1,126 $8,327 $35,376 $42,011 $3,831 $32,216 Q3 2024 Cost to Mine Q4 2024 Cost to Mine FY 2023 Cost to Mine FY 2024 Cost to Mine FY 2024 Cost to Mine Increase Driven by Network Hash Rate Growth, Bitcoin ‘Halving’, and Higher Average Cost of Power in Winter Months Cost to Mine per BTC 1. Three months ended as of December 31, 2023. See Appendix on slides 31-35 for definitions, terms, and reconciliations. 2. Three months ended as of December 31, 2024. See Appendix on slides 31-35 for definitions, terms, and reconciliations. 3. Year ended as of December 31, 2023. See Appendix on slides 31-35 for definitions, terms, and reconciliations. 4. Year ended as of December 31, 2024. See Appendix on slides 31-35 for definitions, terms, and reconciliations. ▪ Total Self-Mining costs net of power credits for Q4 2024 of $63.7MM compared to Q3 2024 costs of $39.0MM 1,2 ▪ Global network hash rate up 16% in Q4 2024 vs Q3 2024 5 - Global network hash rate averaged 728 EH/s in Q4 2024 versus 625 EH/s in Q3 2024 ▪ ‘Direct Costs, Non-Power’ includes direct labor, miner insurance, miner and miner-related equipment repair, land lease and related property taxes, network costs and other utilities expenses ▪ ‘Direct Costs, Non-Power’ per BTC is flat quarter-over-quarter from $8,703 per BTC to $8,730 per BTC ▪ Non-power costs declined from 25% of total costs in Q3 2024 to 21% of total costs in Q4 2024 1 2 3 4 ‘Direct Costs, Power’ per BTC ‘Direct Costs, Non-Power’ per BTC 10 5. Sourced from Blockchain.com as of December 31, 2024. $10,748 Per BTC in Curtailment Credits $6,977 Per BTC in Curtailment Credits Hash Cost ($/PH/s/Day) $25.8 $27.4 $10.2 $28.3

GRAPHIC

FY 2023 Financial Update 11 III Growing Engineering Division: E4A Solutions Acquisition Manufacturing Engineering Services Division

GRAPHIC

12 E4A Financial Highlights $21.5 million FY 2023 Revenue2 $4.8 million FY 2023 Adjusted EBITDA2 $28.2 million FY 2024 Revenue2 $4.6 million FY 2024 Adjusted EBITDA2 20%+ EBITDA Margins3 E4A Has Ability To Service: Power Plants Transformers Substation Equipment Field Services & Support Protection, Monitoring, & Control Mobile Switchgears & Substations E4A’s Solutions Include: Mobile Energy Solutions Substation Equipment Transformer Inventory Transformer Assembly Monitoring Systems Power Generator Rentals M&A Transaction Adds Engineering Services to Riot’s Vertical Integration Model Riot acquired E4A Solutions (“E4A”), a leading electronic engineering services company, in December 2024 for $52 Million in cash of consideration at closing 1 1. Additional earnout consideration may be included. Earnout is calculated by multiplying the difference between an EBITDA of $5.2 million and the average of E4A’s EBITDA over the next two years by a 10.0x multiple, then applying a 26.5% allocation on the incremental value to E4A, all of which will be paid in cash or stock at Riot’s option. Stock would be subject to Rule 144A restrictions. 2. Unaudited figure as of December 31, 2024. 3. Estimated figure based on internal projections. E4A Select Clients

GRAPHIC

13 ▪ ESS Metron adds ability to package start up service that E4A can provide on equipment delivered by ESS Metron ▪ ESS Metron adds ability to pursue MSAs and complete more service jobs especially in rapidly growing industries (data centers, AI / HPC, etc.) ▪ ESS Metron adds compelling risk mitigation due to the countercyclical nature of E4A’s services relative to ESS Metron’s manufacturing ▪ ESS Metron adds opportunity for satellite locations to expand inventory distribution and talent recruitment ▪ E4A benefits from financial support from Riot allowing the business to scale more rapidly ▪ E4A benefits from Riot’s large operational infrastructure, such as IT, HR, and accounting functions, will help streamline current operations and allow management to focus on the core business ▪ E4A benefits from addition of ESS Metron sales team, increasing opportunities for contracting and cross-selling existing customer base • Riot adds experience maintaining and constructing medium and high voltage substations resulting in meaningful cost savings and de-risks development • Riot adds emergency support services for electrical infrastructure • Riot adds ability to perform preventative, on-site maintenance on switchgears and breakers creating potential uptime improvements • Riot adds proficiency with energization, testing, maintenance, and rebuilds of medium voltage equipment Combining E4A’s unique solutions and expertise with both Riot’s Bitcoin mining business and ESS Metron’s precision engineering & manufacturing should result in new revenue opportunities, a range of cost savings, and improved efficiencies E4A Expected to Create Meaningful Synergies Across Riot’s Businesses

GRAPHIC

-$1.3 $1.4 -$0.9 -$2.4 $3.7 -29% -$3.2 14% -7% -21% 6% -8% -40% -20% 0% 20% 40% 60% 80% 100% -$4 m -$3 m -$2 m -$1 m $0 m $1 m $2 m $3 m $4 m $5 m Q1 2024 Q2 2024 Q3 2024 Q4 2024 FY 2023 FY 2024 FY 2025E $4.7 $9.6 $12.6 $11.6 $64.3 $38.5 ~$100.0 Q1 2024 Q2 2024 Q3 2024 Q4 2024 FY 2023 FY 2024 FY 2025E Engineering Division – The Path to $100MM Run Rate Revenue 14 ▪ Seeing robust demand in data center development and oil & gas divisions ▪ $75MM back log of orders ▪ Expected H2 2025 synergies from E4A acquisition Riot Revenue Breakdown – Q4 20231 1. Year ended December 31, 2024. Revenue Gross Profit (Loss) ($ million) / Gross Margin (%) Riot Revenue Breakdown – FY 2024 1 85% 10% 5% Bitcoin Mining Engineering Other ~5% - 10%

GRAPHIC

15 IV Capital Strategy: BTC Treasury

GRAPHIC

$312.4 $430.9 Selling Production, BTC Valued at $67,686 / BTC Holding Production, BTC Valued at $93,354 / BTC Holding Production Selling Production Delta $ 60,000 / BTC $ 277.0 $ 312.4 $ (35.5) $ 80,000 / BTC $ 369.3 $ 312.4 $ 56.8 $ 100,000 / BTC $ 461.6 $ 312.4 $ 149.2 $ 120,000 / BTC $ 553.9 $ 312.4 $ 241.5 $ 140,000 / BTC $ 646.2 $ 312.4 $ 333.8 $ 160,000 / BTC $ 738.6 $ 312.4 $ 426.1 $ 180,000 / BTC $ 830.9 $ 312.4 $ 518.4 $ 200,000 / BTC $ 923.2 $ 312.4 $ 610.8 16 Significant Value Creation from Riot’s BTC Treasury Strategy Riot completely paused the sale of all BTC earned from self-mining operations beginning in January 2024; This capital management strategy has led to significant value creation over the course of FY 2024 Illustrative Value Creation Since Adopting BTC Treasury Strategy ($ million) 1. Only includes Bitcoin mined since adoption of the treasury strategy. Assumes monthly Bitcoin production is sold at the average closing price of Bitcoin for each respective month, sourced from Coinbase. ‘$67,686 / BTC’ figure represents the average hypothetical realized price in this scenario. 2. Only includes Bitcoin mined since adoption of the treasury strategy. Values monthly Bitcoin production at the closing price of Bitcoin on December 31, 2024, sourced from Coinbase. 1 2 +38% ▪ Increasing BTC holdings transforms Riot from a company that has upside at certain points in Bitcoin’s cycle into an enterprise that has a constantly growing ownership of an increasingly scarce asset ▪ Makes Riot more price agnostic to Bitcoin – effectively dollar cost averaging into Bitcoin daily at a discount to market price ▪ Further enhances Riot’s industry leading balance sheet strength Illustrative Delta in Value at Various BTC Prices ($ million) 1

GRAPHIC

17 Transaction Overview ▪ On December 16, 2024, Riot announced that it completed its offering of its 0.75% convertible senior notes due 2030 ▪ The aggregate principal amount of the 2030 notes sold in the offering was $594.4 million ▪ This includes $69.4 million related to the partial exercise of the initial purchasers’ option ▪ The net proceeds from the issuance were approximately $579.3 million ▪ Issuance proceeds were immediately used to acquire 5,784 Bitcoin % Debt to BTC $1,790 million Bitcoin 1 $594 million 2030 Convertible Notes 33% 1. Bitcoin value based on 18,221 Bitcoin held as of January 31, 2025, and a closing price of $98,218 on February 20, 2025, sourced from Coinbase. ~40% Internal Ceiling on Debt to BTC Utilizing Convertible Notes in a Conservative Manner to Increase BTC Holdings

GRAPHIC

18 2025 Key Capital Expenditures Use of Funds Amount Description Corsicana Phase II Capital Expenditures $65 million ▪ Includes capex for a 600MW substation development and other long-lead items Kentucky Infrastructure Capital Expenditures $23 million ▪ Includes $14MM for 30MW expansion at Commerce and $9mm for 30MW expansion at Blue Steel, growing total Kentucky power capacity from 60MW to 120MW Kentucky Miner Purchases $110 million ▪ Includes $74MM of miner payments for expansion at Commerce and Blue Steel. This will grow total Kentucky deployed hash rate capacity from 2.8 EH/s (January 2025) to 6.5 EH/s (YE 2025), a 131% increase. ▪ Includes $35MM of miner payments (43% of total order) for Coleman Road, which is expected to be energized in H1 2026 Total $198 million ▪ Key capital expenditures fully-funded through year-end 2025 with current cash balance

GRAPHIC

19 Hash Rate Growth Forecast 3.1 EH/s 9.7 EH/s 12.4 EH/s 12.4 EH/s 22.0 EH/s 28.2 EH/s 31.5 EH/s 34.5 EH/s 37.0 EH/s 38.4 EH/s 38.4 EH/s 2021A 2022A 2023A Q1 2024A Q2 2024A Q3 2024A Q4 2024A Q1 2025E Q2 2025E Q3 2025E Q4 2025E Rockdale Rockdale Expansion Corsicana Kentucky Kentucky Future Expansion Historical ▪ Riot's hash rate is forecasted to grow 22% in 2025 ▪ Expected to keep pace with global hash rate ▪ Maintain ~4% share of global hash rate ▪ Pivot to AI/HPC at Corsicana reduced 2025 hash rate growth by 8 EH/s

GRAPHIC

20 Rockdale Facility 700 MW Developed Capacity 700 MW Potential Capacity Corsicana Facility 400 MW Developed Capacity 1,000 MW Potential Capacity Kentucky Facilities 60 MW Developed Capacity 305 MW Potential Capacity V Maximizing Value of 2.0 GW of Power Capacity

GRAPHIC

21 EV / 2025E EBITDA 1 AI & HPC Related Cash Flows are Being Valued at a Premium AI/HPC Focus Peers2 1. Sourced from FactSet as of February 20, 2025. 2. “AI/HPC Focus Peers” defined as companies with existing AI/HPC revenues, signed contract with an AI/HPC customer, or has received a 3rd party investment to develop an AI/HPC business. ▪ Investors perceive cash flows tied to AI/HPC related counterparties to be less volatile than BTC Mining cash flows ▪ While valuation multiples for BTC Mining Focus Peers have gradually increased due to rising BTC prices, they remain depressed compared to previous cycles 11.0x 16.0x 15.3x 13.6x 12.1x 9.6x 8.3x 8.2x 9.0x 6.2x BTC Mining Focus Peers Average: 11.9x Average: 7.6x

GRAPHIC

“We are planning to spend $80 billion on AI data centers in 2025, primarily to support our partnership with OpenAI and expand our cloud computing capabilities.“ Satya Nadella, CEO of Microsoft 01/03/2025 “Meta is committed to advancing AI infrastructure. Our upcoming data center project, nearly the size of Manhattan, is a testament to our $65 billion spending plan in this domain” Mark Zuckerberg, CEO of Meta 01/24/2025 “As we expand our AI efforts, we expect to increase our investments in capital expenditure … and to accelerate our progress, we expect to invest approximately $75 billion in capital expenditures in 2025.” Sundar Pichai, CEO of Alphabet 02/04/2025 “The sector’s greatest challenge lies in timely access to power… it presents a compelling opportunity for owners of existing assets who stand to benefit from severe supply constraints.” Green Street Advisors Global Data Center Outlook 2025 22 There is massive demand growth for AI and Cloud, requiring more HPC infrastructure 1. Source: Altman Solon Research & Analysis 2. Source: IDC, Statista, and Altman Solon Research & Analysis as of February 17, 2025. Forecasted figures are illustrative only. US Cloud & AI Data Center Demand Market Opportunity1 (GW) Historical Forecast Zettabytes of Data Created, Captured, Copied, and Consumed Worldwide2 Historical Forecast >1B MAUs >$30B Revenue Invests $1B In OpenAI >750M MAUs Sets record for fastest time to 100M MAUs Invests $10B In OpenAI Invests $2B In Anthropic AI (e.g., ChatGPT) 5G/6G Deployment Further Cloud Adoption Autonomous Vehicles Releases GPT-5 $500B Stargate initiative announced 11 12 13 15 17 18 20 21 22 1 3 4 6 9 14 18 23 28 12 15 17 21 26 32 38 44 51 2022 2023 2024 2025 2026 2027 2028 2029 2030 IT Workload - Cloud IT Workload - GenAI 33 41 64 79 106 129 158 194 237 291 2018 2019 2020 2021 2022 2023 2024 2025 2026 2027

GRAPHIC

Hyperscalers face land & power shortages and are increasingly deploying outside of core Tier 1 markets; Riot is well positioned for this demand Available power Abundant land High quality connectivity Regulatory & tax incentives US data center market supply constraints… US colocation vacancy rate decreased from 9.9% in H1 2020 to 3.0% in H1 2024 Interconnection delay¹ for 100 MW+ projects increased 40% between 2017 and 2023 and has remained elevated after surge in 2021 due to AI boom Colocation capacity under construction increased from 0.7 GW in 1H 2020 to 5.4 GW in H1 2024 …are driving hyperscalers to deploy in increasingly remote markets… Dallas Tier 2 DC market Tier 1 DC market Emerging DC market Riot sites … which the Corsicana and Rockdale regions are well-positioned to capitalize on 23 1. Interconnection queue refers to when a data center’s power connection request is put on a waiting list to be physically connected to the electrical grid Source: Lawrence Berkeley National Laboratory, Grid Strategies, FERC, Altman Solon Research & Analysis

GRAPHIC

Enabled by large amount of power secured in an otherwise power constrained environment, availability of water and overall readiness of current site pad Attractive time-to-market Riot’s Corsicana site is an ideal location for an HPC data center deployment; Secured available power offers a unique value proposition and time-to-market And site fundamentals appear attractive vs. customer needs 400 MW developed + 600 MW additional available by ‘26 265 acres owned fee simple, with ~25-30 acres remaining that are developable for a new DC Power Land Onsite wells developed with additional municipal water supply in progress for ‘26 2 fiber providers onsite today; major carriers nearby can facilitate incremental redundant dark fiber Water Connectivity Corsicana benefits from proximity to Tier 1 Dallas data center hub Dallas Greater addressable demand from potential integration with Dallas AI & cloud regions1 Increased ease of operations from access to Dallas DC ecosystem Developing hyperscaler infrastructure Current hyperscaler infrastructure 24 1. Part of hyperscaler’s geographically-restrictive deployment architecture for traditional cloud workloads.

GRAPHIC

Between Rockdale and Corsicana, a combined 1.7 GW of power is available to be accessed through 2026 Attractive time-to-market Riot’s Rockdale site is an ideal location for an HPC data center deployment; Secured available power offers a unique value proposition and time-to-market And site fundamentals appear attractive vs. customer needs 700 MW of developed capacity 200 acres of leased land Power Land 2,000 GPM onsite water supply 2 fiber providers onsite today; major carriers nearby can facilitate incremental redundant dark fiber Water Connectivity Rockdale benefits from proximity to Austin data center hub 25 Austin Dallas ~101 miles between Riot’s Rockdale and Corsicana sites for potential hyperscaler pairing Corsicana Rockdale

GRAPHIC

26 Riot is Aggressively Pursuing the AI/HPC Opportunity 01 02 03 04 Engage Consultants Adding Experience to the Board Engage Financial Advisors Continued Infrastructure Development In January 2025, Riot launches formal evaluation of potential AI/HPC uses at Corsicana and engages Altman Solon, a leading consultant to the data center industry In February 2025, Riot announces changes to its Board of Directors, adding three new Directors who possess highly relevant experience in data centers and real estate In February 2025, Riot engages Evercore as Financial Advisor, and Northland as Co-Placement Agent to lead engagement with potential AI/HPC partners Riot continues to develop and expand the substation at Corsicana which is expected to add 600 MW of additional power capacity by early 2026 26

GRAPHIC

27 VI Key Focus Areas for 2025

GRAPHIC

28 AI / HPC Process Low Cost of Power Operational Efficiency BTC Yield 1 ▪ Altman Solon feasibility study is expected to be completed in mid-March 2025 ▪ Riot is closely working with financial advisors to go to market ▪ Targeting an accretive BTC yield in 2025 through prudent capital strategy and low-cost mining operations ▪ Riot continues to execute power management strategies at its Rockdale, Corsicana, and Kentucky assets to optimize power costs ▪ Consistent track record of achieving a low cost of power through hedge optimization, economic curtailment, 4CP transmission savings, and ancillary services ▪ Riot will continue to make improvements to drive increasing operational performance in 2025 ▪ In December 2024, Riot achieved an average operational uptime of 87%, inclusive of planned downtime for economic curtailment and ancillary services 1. ‘BTC Yield’ is calculated as the percentage change in BTC per 1 million fully diluted shares compared between two periods. Fully diluted shares outstanding includes common stock outstanding, all additional shares resulting from the assumed conversion of all outstanding convertible notes, exercise of all outstanding stock option awards, and settlement of all outstanding shares of restricted stock units and performance stock units. Key Focus Areas for 2025

GRAPHIC

29 Appendix

GRAPHIC

30 Management Team and Board of Directors ✓ Unique, Bitcoin-focused strategic vision ✓ Veteran public company expertise Jason Les Chief Executive Officer; Director Benjamin Yi Executive Chairman of the Board William Jackman Executive Vice President, General Counsel Colin Yee Executive Vice President, Chief Financial Officer Lance D’Ambrosio Lead Independent Director Jason Chung Executive Vice President, Head of Corporate Development & Strategy ✓ Supported by industry-leading infrastructure expansion capabilities ✓ Highly experienced independent directors with focus on traditional data center development Stephen Howell Chief Operating Officer, Chief Executive Officer of ESS Metron Jaime Leverton Independent Director Doug Mouton Independent Director Michael Turner Independent Director

GRAPHIC

2024 2023 2022 
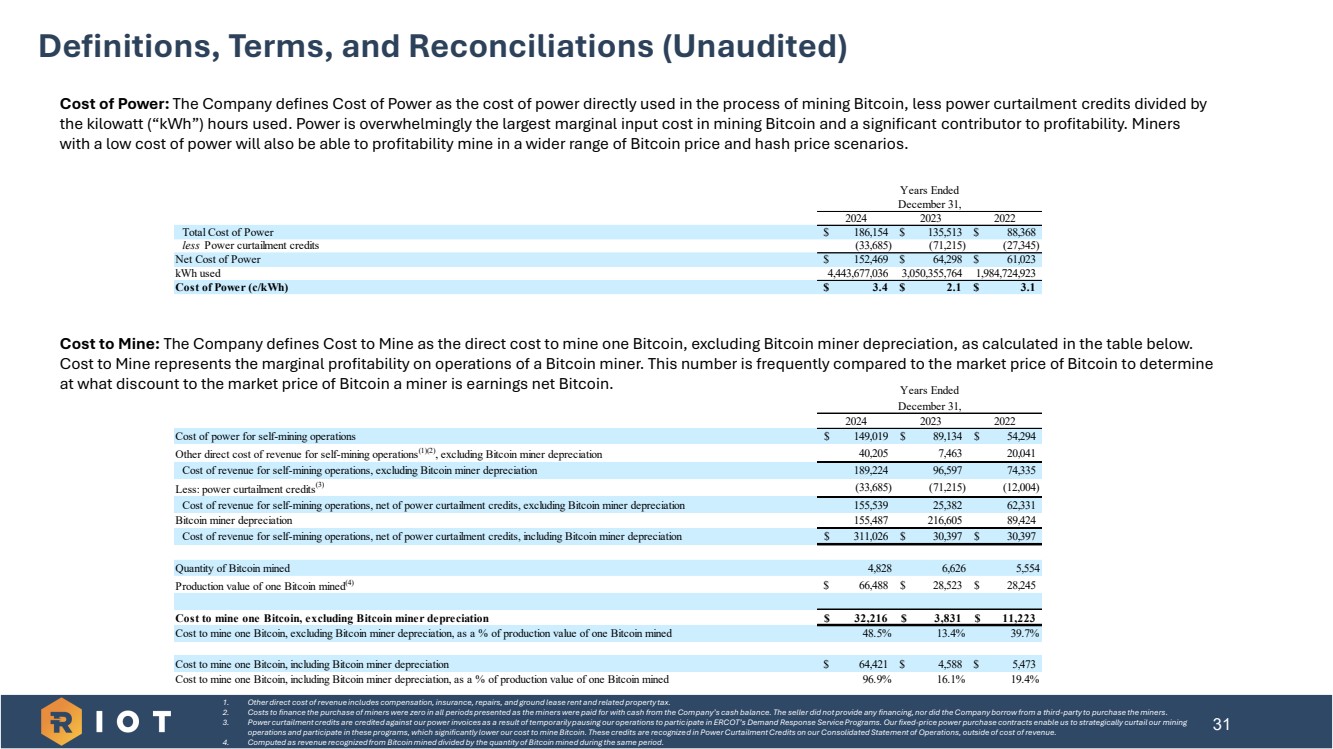
Total Cost of Power $ 186,154 $ 135,513 $ 88,368 less Power curtailment credits (33,685) (71,215) (27,345) Net Cost of Power $ 152,469 $ 64,298 $ 61,023 kWh used 4,443,677,036 3,050,355,764 1,984,724,923 Cost of Power (c/kWh) $ 3.4 $ 2.1 $ 3.1 Years Ended December 31, 31 Definitions, Terms, and Reconciliations (Unaudited) 1. Other direct cost of revenue includes compensation, insurance, repairs, and ground lease rent and related property tax. 2. Costs to finance the purchase of miners were zero in all periods presented as the miners were paid for with cash from the Company’s cash balance. The seller did not provide any financing, nor did the Company borrow from a third-party to purchase the miners. 3. Power curtailment credits are credited against our power invoices as a result of temporarily pausing our operations to participate in ERCOT’s Demand Response Service Programs. Our fixed-price power purchase contracts enable us to strategically curtail our mining operations and participate in these programs, which significantly lower our cost to mine Bitcoin. These credits are recognized in Power Curtailment Credits on our Consolidated Statement of Operations, outside of cost of revenue. 4. Computed as revenue recognized from Bitcoin mined divided by the quantity of Bitcoin mined during the same period. Cost of Power: The Company defines Cost of Power as the cost of power directly used in the process of mining Bitcoin, less power curtailment credits divided by the kilowatt (“kWh”) hours used. Power is overwhelmingly the largest marginal input cost in mining Bitcoin and a significant contributor to profitability. Miners with a low cost of power will also be able to profitability mine in a wider range of Bitcoin price and hash price scenarios. Cost to Mine: The Company defines Cost to Mine as the direct cost to mine one Bitcoin, excluding Bitcoin miner depreciation, as calculated in the table below. Cost to Mine represents the marginal profitability on operations of a Bitcoin miner. This number is frequently compared to the market price of Bitcoin to determine at what discount to the market price of Bitcoin a miner is earnings net Bitcoin. 2024 2023 2022 Cost of power for self-mining operations $ 149,019 $ 89,134 $ 54,294 Other direct cost of revenue for self-mining operations(1)(2), excluding Bitcoin miner depreciation 40,205 7,463 20,041 Cost of revenue for self-mining operations, excluding Bitcoin miner depreciation 189,224 96,597 74,335 Less: power curtailment credits(3) (33,685) (71,215) (12,004) Cost of revenue for self-mining operations, net of power curtailment credits, excluding Bitcoin miner depreciation 155,539 25,382 62,331 Bitcoin miner depreciation 155,487 216,605 89,424 Cost of revenue for self-mining operations, net of power curtailment credits, including Bitcoin miner depreciation $ 311,026 $ 30,397 $ 30,397 Quantity of Bitcoin mined 4,828 6,626 5,554 Production value of one Bitcoin mined(4) $ 66,488 $ 28,523 $ 28,245 Cost to mine one Bitcoin, excluding Bitcoin miner depreciation $ 32,216 $ 3,831 $ 11,223 Cost to mine one Bitcoin, excluding Bitcoin miner depreciation, as a % of production value of one Bitcoin mined 48.5% 13.4% 39.7% Cost to mine one Bitcoin, including Bitcoin miner depreciation $ 64,421 $ 4,588 $ 5,473 Cost to mine one Bitcoin, including Bitcoin miner depreciation, as a % of production value of one Bitcoin mined 96.9% 16.1% 19.4% Years Ended December 31,

GRAPHIC

Fully Costed Gross Margin: The Company defines Fully Costed Gross Margin as Fully Costed Gross Profit (as defined below) divided by Revenue as calculated below. Fully Costed Gross Profit: The Company defines Fully Costed Gross Profit as Revenue less Cost of Revenue less Depreciation and Amortization expense as calculated below. 32 Definitions, Terms, and Reconciliations (Unaudited) Riot Platforms, Inc.: 2024 2023 2022 Revenue $ 376,658 $ 280,678 $ 259,171 less Bitcoin Mining Cost of revenue* (189,224) (96,597) (74,335) less Engineering Cost of revenue* (41,731) (60,614) (57,455) less Other Cost of revenue* (31,800) (97,122) (61,906) less Depreciation and amortization expense (212,053) (252,354) (107,950) Fully Costed Gross Profit $ (98,150) $ (226,009) $ (42,475) Bitcoin Mining: Bitcoin Mining Revenue $ 321,002 $ 188,996 $ 156,870 less Bitcoin Mining Cost of revenue* (189,224) (96,597) (74,335) less Depreciation and amortization expense of Bitcoin miners (155,487) (216,605) (89,424) Fully Costed Gross Profit - Bitcoin Mining $ (23,709) $ (124,206) $ (6,889) Engineering: Engineering Revenue $ 38,491 $ 64,303 $ 65,342 less Engineering Cost of revenue* (41,731) (60,614) (57,455) less Depreciation and amortization expense (2,546) (3,162) (2,433) Fully Costed Gross Profit - Engineering $ (5,786) $ 527 $ 5,454 *excludes depreciation and amortization, which is presented separately Years Ended December 31, Riot Platforms, Inc.: 2024 2023 2022 Fully Costed Gross Profit $ (98,150) $ (226,009) $ (42,475) divided by Total Revenue $ 376,658 $ 280,678 $ 259,171 Fully Costed Gross Margin -26% -81% -16% Bitcoin Mining: Fully Costed Gross Profit $ (23,709) $ (124,206) $ (6,889) divided by Bitcoin Mining Revenue $ 321,002 $ 188,996 $ 156,870 Fully Costed Gross Margin - Bitcoin Mining -7% -66% -4% Engineering: Fully Costed Gross Profit $ (5,786) $ 527 $ 5,454 divided by Engineering Revenue $ 38,491 $ 64,303 $ 65,342 Fully Costed Gross Margin - Engineering -15% 1 % 8 % Years Ended December 31,

GRAPHIC

33 Definitions, Terms, and Reconciliations (Unaudited) Cash SG&A: The Company defines Cash SG&A as Selling, General, and Administrative expenses less Stock-Based Compensation expense. Cash SG&A is used by the Company as we believe it better reflects the operational requirements of the Company by excluding significant non-cash items such as stock-based compensation expense. EPS (Earnings per Share): The Company defines EPS as Diluted Net Income (Loss) per Share. Gross Margin (Non-GAAP): The Company defines Gross Margin as Gross Profit (as defined below) divided by Revenue. Gross Margin represents the percentage of profit achieved by operations and is a measure of the level of profitability for direct costs and the revenue received from them. 2024 2023 2022 Selling, general, and administrative $ 266,915 $ 100,346 $ 67,452 less Stock-based compensation expense (125,204) (32,170) (24,555) Cash SG&A $ 141,711 $ 68,176 $ 42,897 Years Ended December 31, Riot Platforms, Inc.: 2024 2023 2022 Gross Profit $ 147,588 $ 72,991 $ 77,479 divided by Total Revenue $ 376,658 $ 280,678 $ 259,171 Gross Margin 39% 26% 30% Bitcoin Mining: Gross Profit - Bitcoin Mining $ 165,463 $ 139,045 $ 94,539 divided by Bitcoin Mining Revenue $ 321,002 $ 188,996 $ 156,870 Gross Margin - Bitcoin Mining 52% 74% 60% Engineering: Gross Profit - Engineering $ (3,240) $ 3,689 $ 7,887 divided by Engineering Revenue $ 38,491 $ 64,303 $ 65,342 Gross Margin - Engineering -8% 6 % 12% Years Ended December 31,

GRAPHIC

34 Definitions, Terms, and Reconciliations (Unaudited) Gross Profit (Non-GAAP): The Company defines Gross Profit as Fully Costed Gross Profit (as defined below) plus Power curtailment Credits plus Depreciation & Amortization expense. M&A Expenses: The Company defines M&A Expenses as Acquisition-related costs. 2024 2023 2022 Riot Platforms, Inc.: Fully Costed Gross Profit $ (98,150) $ (226,009) $ (42,475) plus Power Curtailment Credits 33,685 46,646 12,004 plus Depreciation and amortization 212,053 252,354 107,950 Gross Profit $ 147,588 $ 72,991 $ 77,479 Bitcoin Mining: Fully Costed Gross Profit $ (23,709) $ (124,206) $ (6,889) plus Power Curtailment Credits 33,685 46,646 12,004 plus Depreciation and amortization expense of Bitcoin miners 155,487 216,605 89,424 Gross Profit - Bitcoin Mining $ 165,463 $ 139,045 $ 94,539 Engineering: Fully Costed Gross Profit $ (5,786) $ 527 $ 5,454 plus Depreciation and amortization 2,546 3,162 2,433 Gross Profit - Engineering $ (3,240) $ 3,689 $ 7,887 Years Ended December 31,

GRAPHIC

35 Definitions, Terms, and Reconciliations (Unaudited) Hash Cost: The Company defines Hash Cost as Cost of Revenue for self-mining operations, net of Power Curtailment Credits, excluding Bitcoin miner depreciation divided by the average Petahash per second per day (“PH/s/Day”) produced by operations over the relevant period. Hash Cost measures the costs expended for each unit of hash rate online. Hash rate is the product Riot’s self-mining business provides to the Bitcoin network and what Riot gets paid for. Hash cost can be compared to hash price as an estimate of profitability of a mining operation. Hash Price: The Company defines Hash Price as the expected value of 1 Petahash of hashing power per day (“PH/s/Day”). This data is sourced from Luxor’s Hash Price Index. Hash Price is the revenue received by the Company for each unit of hash rate operating during the period. This metric can be compared to Hash Cost as an estimate of profitability of the mining operations. 2024 2023 2022 Cost of revenue for self-mining operations, net of power curtailment credits, excluding Bitcoin miner depreciation $ 155,539 $ 25,382 $ 46,990 divided by Average Petahash per second per day over the period 15,022 6,808 3,286 Hash Cost (PH/s/day) $ 28.3 $ 10.2 $ 3 9 Years Ended December 31,

GRAPHIC

36 2024 Statement of Operations (Unaudited)

GRAPHIC

37 2024 Balance Sheet (Unaudited)

GRAPHIC

38 * Indicates Non-GAAP measure. We use Adjusted EBITDA to eliminate the effects of certain non-cash and/or non-recurring items, that do not reflect our ongoing strategic business operations. Adjusted EBITDA includes impairment of Bitcoin charges. Adjusted EBITDA is provided in addition to, and not as a substitute for, or as superior to, the comparable GAAP measure, Net Income. For a full reconciliation of the Non-GAAP measures we use to their comparable GAAP measures, see the discussion under the heading “Non-GAAP Measures” commencing on page 49 in our December 31, 2024, Form 10-K. Non-GAAP Adjusted EBITDA (Unaudited)

v3.25.0.1
Document and Entity Information
Feb. 24, 2025
Document and Entity Information [Abstract]  
Document Type 8-K
Document Period End Date Feb. 24, 2025
Entity Registrant Name Riot Platforms, Inc.
Entity Incorporation, State or Country Code NV
Securities Act File Number 001-33675
Entity Tax Identification Number 84-1553387
Entity Address, Address Line One 3855 Ambrosia Street
Entity Address, Address Line Two Suite 301
Entity Address, City or Town Castle Rock
Entity Address, State or Province CO
Entity Address, Postal Zip Code 80109
City Area Code (303)
Local Phone Number 794-2000
Written Communications false
Soliciting Material false
Pre-commencement Tender Offer false
Pre-commencement Issuer Tender Offer false
Title of 12(b) Security Common Stock, no par value per share
Trading Symbol RIOT
Security Exchange Name NASDAQ
Entity Emerging Growth Company false
Entity Central Index Key 0001167419
Amendment Flag false

Riot Platforms (NASDAQ:RIOT)
Historical Stock Chart
From Jan 2025 to Feb 2025 Click Here for more Riot Platforms Charts.
Riot Platforms (NASDAQ:RIOT)
Historical Stock Chart
From Feb 2024 to Feb 2025 Click Here for more Riot Platforms Charts.