TELUS announces preliminary fourth quarter and full year 2020 results of TELUS International
January 25 2021 - 6:25AM

TELUS Corporation (TSX: T; NYSE: TU) announced today that its
subsidiary, TELUS International (Cda) Inc. (TELUS International),
has disclosed its preliminary and unaudited estimates of selected
results for the three months and full year ended December 31, 2020.
TELUS International has disclosed these preliminary results in
connection with its previously announced initial public offering.
The preliminary results are presented below.
The following information reflects preliminary estimates with
respect to such results based on currently available information,
is not a comprehensive statement of TELUS International’s financial
results and is subject to completion of its financial closing
procedures.
TELUS International’s financial closing procedures are not yet
complete and, as a result, its actual results may change as a
result of such financial closing procedures, final adjustments,
management’s review of results, and other developments that may
arise between now and the time the financial results are finalized,
and results could be outside of the ranges set forth below. These
estimates should not be viewed as a substitute for TELUS
International’s consolidated financial statements prepared in
accordance with IFRS which will be available at a later date.
Selected Financial Information (US $
millions):
|
|
Three Months Ended December 31 |
Full Year Ended December 31 |
| |
2020 Estimated Range |
2019Actual |
2020 Estimated Range |
2019Actual |
|
Revenues arising from contracts with customers |
$430 |
$445 |
$272.5 |
$1,569 |
$1,584 |
$1,019.6 |
| Net Income |
$13 |
$20 |
$27.3 |
$95 |
$102 |
$69.0 |
| TI Adjusted EBITDA1 |
$122 |
$130 |
$63.7 |
$384 |
$392 |
$225.6 |
(1) TELUS International Adjusted EBITDA is a non-GAAP financial
measure. The most comparable GAAP measure is net income and a
reconciliation to net income is presented below.
|
|
Three Months Ended December 31 |
Full Year Ended December 31 |
| |
2020 Estimated Range |
2019Actual |
2020 Estimated Range |
2019Actual |
|
Net Income |
$20 |
$13 |
$27.3 |
$102 |
$95 |
$69.0 |
| Add back (deduct): |
|
|
|
|
|
|
|
Changes in business combination related provisions |
- |
- |
(12.1) |
(73) |
(73) |
(14.6) |
|
Interest expense |
10 |
12 |
8.3 |
44 |
46 |
36.3 |
|
Foreign exchange |
(3) |
(6) |
(0.3) |
(1) |
(4) |
(2.6) |
|
Income taxes |
11 |
18 |
7.7 |
46 |
53 |
26.0 |
|
Depreciation and amortization |
49 |
50 |
24.7 |
181 |
182 |
92.2 |
|
Sharebased compensation expense |
11 |
17 |
6.0 |
28 |
34 |
13.2 |
|
Restructuring and other costs |
24 |
26 |
2.1 |
57 |
59 |
6.1 |
| TI Adjusted
EBITDA |
$122 |
$130 |
$63.7 |
$384 |
$392 |
$225.6 |
About TELUS TELUS (TSX: T, NYSE: TU) is a
dynamic, world-leading communications and information technology
company with $15.3 billion in annual revenue and 15.7 million
customer connections spanning wireless, data, IP, voice,
television, entertainment, video and security. We leverage our
global-leading technology to enable remarkable human outcomes. Our
longstanding commitment to putting our customers first fuels every
aspect of our business, making us a distinct leader in customer
service excellence and loyalty. TELUS Health is Canada's largest
healthcare IT provider. TELUS International is a leading digital
customer experience innovator that designs, builds and delivers
next-generation solutions for global and disruptive brands. Their
services support the full lifecycle of their clients’ digital
transformation journeys and enable clients to more quickly embrace
next-generation digital technologies to deliver better business
outcomes.
Driven by our passionate social purpose to connect all Canadians
for good, our deeply meaningful and enduring philosophy to give
where we live has inspired our team members and retirees to
contribute more than $700 million and 1.3 million days of service
since 2000. This unprecedented generosity and unparalleled
volunteerism have made TELUS the most giving company in the
world.
For more information about TELUS, please visit telus.com, follow
us @TELUSNews on Twitter and @Darren_Entwistle on Instagram.
Investor RelationsIan McMillan(604)
695-4539ir@telus.com
Media RelationsSteve Beisswanger(514)
865-2787Steve.Beisswanger@telus.com
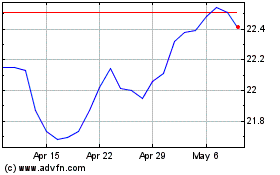
Telus (TSX:T)
Historical Stock Chart
From Mar 2024 to Apr 2024

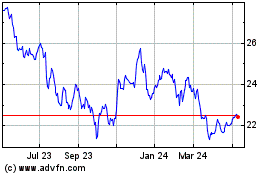
Telus (TSX:T)
Historical Stock Chart
From Apr 2023 to Apr 2024
