TIDMAGT
RNS Number : 1784G
AVI Global Trust PLC
22 July 2021
AVI GLOBAL TRUST PLC
Monthly Update
AVI Global Trust plc (the "Company") presents its Update,
reporting performance figures for the month ended 30 June 2021.
This Monthly Newsletter is available on the Company's website
at:
https://www.aviglobal.co.uk/content/uploads/2021/07/AGT-JUN-2021.pdf
Performance Total Return
This investment management report relates to performance figures
to 30 June 2021.
                       Month   Financial   Calendar
                                  Yr *        Yr
                                to date     to date
 AGTNAV(1)             2.0%      32.1%      12.5%
 MSCI ACWI Ex US(3)    2.2%      19.5%       8.0%
 MSCI ACWI(1)          4.3%      20.5%      11.1%
* AVI Global Trust financial year commences on the 1(st)
October. All figures published before the fiscal results
announcement are AVI estimates and subject to change.
1 Source: Morningstar. All NAV figures are cum-fair values.
2 Source: Morningstar. Share price total return is on a
mid-to-mid basis, with net income re-invested.
3 From 1st October 2013 the lead benchmark was changed to the
MSCI ACWI ex US (GBP) Index. The investment management fee was
changed to 0.7% of net assets and the performance related fee
eliminated.
Manager's Comment
AVI Global Trust (AGT)'s NAV gained +2.0% in May. A widening of
the portfolio discount (26% to 27%) hampered returns, while
sterling weakness provided a tailwind. Contributors included the
Japan Special Situations basket, Oakley Capital Investments, and
KKR. Detractors included Symphony International, doValue, and
EXOR.
KKR
Share Price: +6%
NAV: 0%
Discount: -15%
KKR's shares are now up +46% over 2021. Despite this bringing
the total return on our position- acquired in the first half of
last year - up to +140% (a more muted +113% in GBP), we believe KKR
has an extended runway ahead of mid-teens AUM and earnings growth
and we still see considerable upside in the position. The company's
Investor Day earlier this year and subsequent Q1 results confirmed
the business is firing on all cylinders with assets under
management at the end of the first quarter standing +77% higher
than a year prior. While this figure was boosted by the acquisition
of life insurer Global Atlantic, organic growth of +30% is
indicative of KKR's advantaged position within an industry itself
benefitting from robust secular tailwinds. We expect annuity
provider Global Atlantic, in which KKR now has a 61% stake, to
accelerate KKR's growth even further over the coming years as a
source of low-cost liabilities. Crucially, the acquisition means
permanent capital now accounts for a third of AUM, providing even
greater stability and visibility to fee revenues.
KKR's moves to grow its platform beyond traditional private
equity have paid off, with 57% of AUM growth between 2010 and 2020
derived from businesses that did not exist ten years ago. While
private equity now accounts for 40% of total AUM (down from 75%
upon listing in 2010), even that figure understates the actual
level of diversification with the private equity platform now
spread across Asian, European, longer-dated "Core" funds, as well
as specialist growth equity (healthcare and technology) funds, in
addition to the original US business. These fund-raising efforts
and rapid deployment have led to record levels of embedded gains
both in terms of unrealised carried interest and balance sheet
investments gains, and should translate to elevated levels of
income from these sources over the next few years. We value KKR on
a sum-of-the-parts basis, and believe the company's most valuable
"part" - fee-related earnings (i.e. from base management fees) -
has been made even more valuable by changes made earlier this year
to the compensation structure that will see a heavier compensation
load instead placed on carried interest.
Oakley Capital Investments
Share Price: +10%
NAV: 0%
Discount: -10%
Oakley Capital Investments (OCI)'s share price continued its
strong run in June, up +10% and bringing the headline discount from
18% to 10%. As we noted in May's newsletter, OCI's last NAV is over
six months old, and as such does not capture any NAV growth over
the last six months. The 'real' discount is likely wider than the
official 10% number. AGT first initiated a position in OCI in 2018
at a discount of 35%, since when it has benefitted from a
combination of strong NAV growth and significant discount
tightening.
In portfolio news, Oakley announced two interesting transactions
during June. The first was that Ekon (5% of NAV), the Spanish ERP
business, had acquired Primavera, a Portuguese provider of business
management software. The two companies will combine to become one
of the largest business software providers in the Iberian
Peninsula, serving 55,000 customers. The group will aim to grow
both through organic channels (product development, market
expansion) and M&A.
The second transaction was the sale from Fund III of ACE
Education (f.k.a. AMOS; 3% of NAV), the French provider of tertiary
education in subjects such as sports management and hospitality.
Oakley first invested in ACE in 2017, over which time it earned a
27% IRR and 2.1x multiple on invested capital (gross of fees). As
part of the deal, Oakley's Origins fund will invest in ACE, meaning
that OCI will retain exposure to the tune of 1% of NAV
EXOR
Share Price: -3%
NAV:0%
Discount: -41%
We initiated an investment in EXOR in December 2016, with a key
element of the thesis at the time being the undervaluation of FCA
(now Stellantis, 28% of EXOR's NAV). Now, almost five years later,
Stellantis continues to form a major part of our investment thesis.
There are, in our view, several reasons to be excited about the
company's prospects:
1. Following the merger, Stellantis is targeting EUR5 billion of
annual cost synergies over the medium-term. For context, Stellantis
is expected to earn operating profits of EUR11 billion in 2021. If
the synergies are achieved - and our view is that the CEO, Carlos
Tavares, has a credible track record in this regard - they will
significantly add to profitability.
2. Stellantis held an "Electric Vehicle Strategy Day" in early
July, highlighting that it would invest EUR30 billion over five
years in electric vehicle development. By 2025 Stellantis will have
a 100% electrified portfolio across 4 battery electric vehicle
("BEV") platforms. The merger and scale that it brings means that
management believe they can do this c.30% more efficiently than
peers, with plans for capex and R&D spending to total 8% of
sales. In our view the market continues to under-appreciate
Stellantis' EV strategy, on both an absolute and relative basis,
and we view the EV day as an important initial step in changing the
narrative.
3. During the strategy day, management also indicated that
long-term operating margins are now expected to be in the
double-digits - previous guidance had been for 5.5-7.5% margins.
Achieving this will likely make Stellantis the most profitable
traditional automaker in the world.
Despite the above, Stellantis trades a 25-35% discount to Ford
and GM on a PE and EV/EBIT basis. The common push back for a long
time has been their EV strategy. We believe it is becoming
increasingly hard for the market to ignore the progress here,
although we are aware that it might take until next year's capital
markets day, and more details on the North American EV pickup
launch, to drive a re-rating. We view 4x EBIT as very good value
for the potentially most profitable auto maker, run by an excellent
management team and controlled by two families likely to prioritise
shareholder returns.
CNH Industrial (19% of EXOR's NAV)'s plans to split the company
into separate "on-highway" and "off-highway" businesses continues
to progress, and will hopefully shine a light on the attractive
agriculture business. CNH recently announced the acquisition of
Raven Industries for USD2 billion, which should help it to improve
its precision-farming offering, and thus compete better with key
rival John Deere. A stronger competitive position, combined with a
supportive demand backdrop and higher commodity prices (leading to
higher farm incomes), bodes well for CNH's profitability. We
estimate that CNH trades on a material discount to a
sum-of-the-parts model, suggesting potential upside both from
earnings growth and a multiple revaluation.
EXOR trades on a 41% discount to NAV - unusual at a time when
many of its European holding company peers trade at narrow
discounts or even premia. We believe this is excessively wide given
EXOR's track record of value creation, and the attractive prospects
for NAV growth that we have highlighted. We note, further, the
recent investment in Christian Louboutin, which is indicative of
the type of higher-quality asset in which the company will invest
in the future. As the impression dissipates that EXOR is a sleepy,
industrial, cyclical holding company, we expect the discount will
narrow.
Third Point Investors
Share Price: +4%
NAV: +2%
Discount: -12%
As readers may be aware, we have been engaging with the Board of
Third Point Investors (TPOU) in order to address the wide discount
(five-year average: 20%) at which TPOU trades. Our open letter to
the Board of TPOU as well as the requisition notice calling for an
EGM can be found on AGT's website.
Contributors / Detractors (in GBP)
 Largest Contributors          1 month contribution   Percent of
                                        bps               NAV
 Japan Special Situations**             79               2.9
 Oakely Capital                         69               6.9
 KKR                                    42               4.9
 Third Point Investors                  38               6.0
 Fondul Proprietatea                    29               4.9


 Largest Detractors            1 month contribution   Percent of
                                        bps               NAV
 VNV Global                            -23               1.9
 Kinnevik B                            -23               0.0
 Nintendo                              -17               5.0
 Japan Special Situations**            -14               1.8
 Hipgnosis Songs                       -12               5.1
**A basket of 14 stocks: Daiwa Industries, Fujitec, Kato Sangyo,
Konishi, NS Solutions, Pasona Group, Sekisui Jushi, SK Kaken,
Teikoku Sen-I, Toagosei, Digital Garage, DTS, Bank of Kyoto, Hazama
Ando.
Link Company Matters Limited
Corporate Secretary
22 July 2021
LEI: 213800QUODCLWWRVI968
The content of the Company's web-pages and the content of any
website or pages which may be accessed through hyperlinks on the
Company's web-pages, other than the content of the Newsletter
referred to above, is neither incorporated into nor forms part of
the above announcement.
This information is provided by RNS, the news service of the
London Stock Exchange. RNS is approved by the Financial Conduct
Authority to act as a Primary Information Provider in the United
Kingdom. Terms and conditions relating to the use and distribution
of this information may apply. For further information, please
contact rns@lseg.com or visit www.rns.com.
RNS may use your IP address to confirm compliance with the terms
and conditions, to analyse how you engage with the information
contained in this communication, and to share such analysis on an
anonymised basis with others as part of our commercial services.
For further information about how RNS and the London Stock Exchange
use the personal data you provide us, please see our Privacy
Policy.
END
DOCXLLFLFDLBBBZ
(END) Dow Jones Newswires
July 22, 2021 09:06 ET (13:06 GMT)
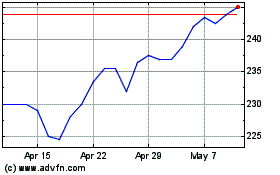
Avi Global (LSE:AGT)
Historical Stock Chart
From Mar 2024 to Apr 2024

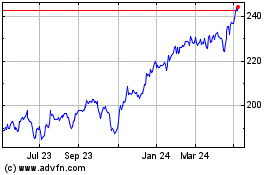
Avi Global (LSE:AGT)
Historical Stock Chart
From Apr 2023 to Apr 2024
