TIDMARS
RNS Number : 6115Z
Asiamet Resources Limited
24 May 2021
24 May 2021
2020 Annual Report & Financial Statements
Asiamet Resources Limited ("Asiamet" or the "Company") is
pleased to present its audited financial statements for the 12
months ended 31 December 2020 ("Financial Statements") as extracted
from the Company's 2020 Annual Report which is now available on the
Company website at www.asiametresources.com and will be provided to
shareholders who have requested a printed or electronic copy.
The Financial Statements are set out below and should be read in
conjunction with the 2020 Annual Report which contains the notes to
the Financial Statements.
All dollars in the report are US$ unless otherwise stated.
2020 Financial and Operational Highlights Include:
   --    Relocation of Head Office and Corporate function from Melbourne to Jakarta.
   --    Capital placing raising gross proceeds of approximately $3.9 million completed in March 2020.
-- Final approval of the Further Exploration Permit for the KSK
CoW received from Badan Koordinasi Penanaman Modal ("BKPM"), the
investment co-ordinating body in Indonesia.
-- The Company signed a conditional binding Share and Purchase
Agreement ("SPA") with PT Wasesa Indo Nusa ("PT WIN") in December
2020. This was subsequently terminated in January 2021 when PT WIN
did not fulfil its obligations under the binding SPA.
-- Continuation of value enhancement activities for the BKM
Project. Metallurgical test work completed during the year and in
early 2021 confirmed the opportunity to revise the ore processing
method which has the potential to increase life-of-mine copper
recoveries by 40% on a relative basis.
Key Subsequent Events Include:
-- Capital placing raising gross proceeds of approximately $14
million completed in February 2020.
-- Appointment of Eva Armila Djauhari as a Non-executive Director.
ON BEHALF OF THE BOARD OF DIRECTORS
Antony (Tony) Manini, Executive Chairman
For further information, please contact:
-Ends-
Tony Manini
Executive Chairman, Asiamet Resources Limited
Email: tony.manini@ asiametresources .com
FlowComms Limited - Investor Relations
Sasha Sethi
Telephone: +44 (0) 7891 677 441
Email: Sasha@flowcomms.com
Asiamet Resources Nominated Adviser
RFC Ambrian Limited
Bhavesh Patel / Stephen Allen
Telephone: +44 (0)20 3440 6800
Email: Bhavesh.Patel@rfcambrian.com / Stephen.Allen@rfcambrian.com
Optiva Securities Limited
Christian Dennis
Telephone: +44 20 3137 1903
Email: Christian.Dennis@optivasecurities.com
Follow us on twitter @AsiametTweets
FORWARD-LOOKING STATEMENT
This news release contains forward-looking statements that are
based on the Company's current expectations and estimates.
Forward-looking statements are frequently characterised by words
such as "plan", "expect", "project", "intend", "believe",
"anticipate", "estimate", "suggest", "indicate" and other similar
words or statements that certain events or conditions "may" or
"will" occur. Such forward-looking statements involve known and
unknown risks, uncertainties and other factors that could cause
actual events or results to differ materially from estimated or
anticipated events or results implied or expressed in such
forward-looking statements. Such factors include, among others: the
actual results of current exploration activities; conclusions of
economic evaluations; changes in project parameters as plans
continue to be refined; possible variations in ore grade or
recovery rates; accidents, labour disputes and other risks of the
mining industry; delays in obtaining governmental approvals or
financing; and fluctuations in metal prices. There may be other
factors that cause actions, events or results not to be as
anticipated, estimated or intended. Any forward-looking statement
speaks only as of the date on which it is made and, except as may
be required by applicable securities laws, the Company disclaims
any intent or obligation to update any forward-looking statement,
whether as a result of new information, future events or results or
otherwise. Forward-looking statements are not guarantees of future
performance and accordingly undue reliance should not be put on
such statements due to the inherent uncertainty therein.
This announcement contains inside information as stipulated
under the Market Abuse Regulations (EU) no. 596/2014 ("MAR").
Consolidated Statement of Financial Position
As at 31 December 20 20
                                                               2020        2019
                                                              $'000       $'000
 ------------------------------------------  ----------------------  ----------
 Assets
 Current assets
  Cash                                                        1,179         418
  Receivables and other assets                                    4          50
                                             ----------------------  ----------
                                                              1,183         468
  Assets classified as held for sale                            125           -
                                                              1,308         468
 Non-current assets
  Plant and equipment                                            39         197
  Right-of-use assets                                             3         236
  Receivables and other assets                                    5          86
                                             ----------------------  ----------
                                                                 47         519
 Total assets                                                 1,355         987
-------------------------------------------  ----------------------  ----------
 Liabilities and Equity
 Current liabilities
  Trade and other payables                                      391         396
  Provisions                                                    253          89
  Lease liabilities                                             278          78
                                             ----------------------  ----------
                                                                922         563
  Liabilities directly associated with the
   assets classified as held for sale                           753           -
                                                              1,675         563
 Non-current liabilities
  Provisions                                                     81         473
  Lease liabilities                                               -         237
                                             ----------------------  ----------
                                                                 81         710
                                             ----------------------  ----------
 Total liabilities                                            1,756       1,273
                                             ----------------------  ----------
 Equity
  Share capital                                              14,752      10,969
  Equity reserves                                            56,661      56,435
  Other comprehensive income                                     83          74
  Accumulated deficit                                      (68,644)    (64,511)
  Other reserves                                            (3,246)     (3,246)
  Parent entity interest                                      (394)       (279)
  Non-controlling interest                                      (7)         (7)
                                                              (401)       (286)
 Total liabilities and equity                                 1,355         987
-------------------------------------------  ----------------------  ----------
Consolidated Statement of Comprehensive Loss
For the year ended 31 December 20 20
                                                            2020         2019
                                                           $'000        $'000
 ==================================================  ===========  ===========
 Continuing Operations
 Expenses
  Exploration and evaluation                               (190)        (640)
  Employee benefits                                        (960)        (890)
  Consultants                                              (453)        (359)
  Legal and Company Secretarial                             (24)         (17)
  Accounting and audit                                      (30)         (83)
  General and administrative                               (268)        (383)
  Depreciation                                              (55)        (110)
  Share-based compensation                                 (175)        (298)
                                                     -----------
                                                         (2,155)      (2,780)
                                                     -----------  -----------
 Other items
  Foreign exchange gain                                      354           98
  Interest income                                              1            2
  Finance costs                                             (27)         (25)
  Impairment expense                                       (305)         (46)
  Other income                                                71            2
                                                              94           31
                                                     -----------  -----------
 Net loss before tax from continuing operations          (2,061)      (2,749)
     Income tax expense                                        -            -
                                                     -----------  -----------
 Net loss for the year from continuing operations        (2,061)      (2,749)
 Discontinued operations
  Loss after tax for the year from discontinued
   operations                                            (2,072)      (4,434)
                                                     -----------  -----------
 Net loss for the year                                   (4,133)      (7,183)
 Item that may not be reclassified subsequently
 to profit or loss:
  Actuarial gain on employee service entitlements              9           64
                                                     -----------  -----------
 Total comprehensive loss for the year                   (4,124)      (7,119)
---------------------------------------------------  -----------  -----------

 Net loss attributable to:
  Equity holders of the parent                           (4,040)      (6,995)
  Non-controlling interests                                 (93)        (188)
 Total comprehensive loss attributable to:
  Equity holders of the parent                           (4,031)      (6,931)
  Non-controlling interests                                 (93)        (188)

 Basic and diluted loss per common share                  (0.00)       (0.01)

 Weighted average number of shares outstanding
  (thousands)                                          1,414,666    1,044,185
---------------------------------------------------  -----------  -----------
Consolidated Statement of Cash Flows
For the year ended 31 December 20 20
                                                                 2020               2019
                                                                $'000              $'000
-----------------------------------------------------   -------------  -----------------
 Operating activities
 Loss before tax from continuing operations                   (2,061)            (2,749)
 Loss before tax from discontinued operations                 (2,072)            (4,434)
                                                        -------------  -----------------
 Loss before tax                                              (4,133)            (7,183)
 Adjustments for:
   Share-based compensation                                       175                298
      Depreciation                                                 81                133
      Settlement of consulting fees via issue
       of ARS shares                                                -                200
      Net foreign exchange gain                                  (18)               (32)
      Impairment expenses                                         335                724
      Finance costs                                                27                 26
      Movements in provisions                                     271                198
 Changes in working capital:
      Receivables and other assets                                 34                 27
      Value Added Tax ("VAT")                                       -              (154)
      Trade and other payables                                    258              (515)
                                                        -------------  -----------------
                                                              (2,970)            (6,278)
 Interest payments                                               (27)               (26)
 Refund of security deposit                                        15                 10
                                                        -------------  -----------------
 Net cash flows used in operating activities                  (2,982)            (6,294)
                                                        -------------  -----------------

 Investing activity
   Purchases of property, plant and equipment                     (4)               (38)
                                                        -------------  -----------------
 Net cash flows used in investing activities                      (4)               (38)
                                                        -------------  -----------------

 Financing activities
   Payment of principal portion of lease liabilities             (80)               (48)
   Proceeds from related party loans                              380                  -
   Repayment of related party loans                             (257)                  -
   Proceeds from warrants and options exercises                     -                237
   Proceeds from equity raising                                 3,775              4,133
   Equity raising costs                                          (64)              (251)
                                                        -------------  -----------------
 Net cash flows from financing activities                       3,754              4,071
                                                        -------------  -----------------
 Increase/(decrease) in cash                                      768            (2,261)
 Cash at beginning of the year                                    418              2,679
                                                        -------------  -----------------
 Cash at end of the year                                        1,186                418
------------------------------------------------------  -------------  -----------------
Consolidated Statement of Changes in Equity
For the year ended 31 December 20 20
                                                                                 Total equity
                                                Other                            attributable          Non-
                     Share     Equity   comprehensive   Accumulated      Other         to the   controlling
                   capital   reserves          income       deficit   reserves         parent     interests      Total
                     $'000      $'000           $'000         $'000      $'000          $'000         $'000      $'000
 ===============  ========  =========  ==============  ============  =========  =============  ============  =========

 Balance at 1
  January 2019       9,983     52,804              10      (57,328)    (3,246)          2,223           (7)      2,216

  Loss for the
   year                  -          -               -       (6,995)          -        (6,995)         (188)    (7,183)
  Other
   comprehensive
   income                -          -              64             -          -             64             -         64
                  --------  ---------  --------------  ------------  ---------  -------------  ------------  ---------
 Total
  comprehensive
  income                 -          -              64       (6,995)          -        (6,931)         (188)    (7,119)

 Transactions
 with owners
 in their
 capacity
 as owners
  Equity raising       873      3,260               -             -          -          4,133             -      4,133
  Warrant
   exercises            19        122               -             -          -            141             -        141
  Option
   exercises            26         70               -             -          -             96             -         96
  Equity raising
   costs                 -      (251)               -             -          -          (251)             -      (251)
  Shares issued
   to consultant        45        155               -             -          -            200             -        200
  Reclassify
   shares issued
   to directors         23       (23)               -             -          -              -             -          -
  Share-based
   compensation          -        298               -             -          -            298             -        298
  Contribution
   by parent
   in NCI                -          -               -         (188)          -          (188)           188          -

 Balance at 31
  December 2019     10,969     56,435              74      (64,511)    (3,246)          (279)           (7)      (286)
----------------  --------  ---------  --------------  ------------  ---------  -------------  ------------  ---------
Consolidated Statement of Changes in Equity
For the year ended 31 December 20 20
                                                                                 Total equity
                                                Other                            attributable          Non-
                     Share     Equity   comprehensive   Accumulated      Other         to the   controlling
                   capital   reserves          income       deficit   reserves         parent     interests      Total
                     $'000      $'000           $'000         $'000      $'000          $'000         $'000      $'000
 ===============  ========  =========  ==============  ============  =========  =============  ============  =========

 Balance at 1
  January 2020      10,969     56,435              74      (64,511)    (3,246)          (279)           (7)      (286)

  Loss for the
   year                  -          -               -       (4,040)          -        (4,040)          (93)    (4,133)
  Other
   comprehensive
   income                -          -               9             -          -              9             -          9
                  --------  ---------  --------------  ------------  ---------  -------------  ------------  ---------
 Total
  comprehensive
  income                 -          -               9       (4,040)          -        (4,031)          (93)    (4,124)

 Transactions
 with owners
 in their
 capacity
 as owners
  Equity raising     3,617        158               -             -          -          3,775             -      3,775
  Related party
   loans
   converted
   to equity           117          6               -             -          -            123             -        123
  Equity raising
   costs                 -       (64)               -             -          -           (64)             -       (64)
  Reclassify
   shares issued
   to directors         49       (49)               -             -          -              -             -          -
  Share-based
   compensation          -        175               -             -          -            175             -        175
  Contribution
   by parent
   in NCI                -          -               -          (93)          -           (93)            93          -

 Balance at 31
  December 2020     14,752     56,661              83      (68,644)    (3,246)          (394)           (7)      (401)
----------------  --------  ---------  --------------  ------------  ---------  -------------  ------------  ---------
This information is provided by RNS, the news service of the
London Stock Exchange. RNS is approved by the Financial Conduct
Authority to act as a Primary Information Provider in the United
Kingdom. Terms and conditions relating to the use and distribution
of this information may apply. For further information, please
contact rns@lseg.com or visit www.rns.com.
RNS may use your IP address to confirm compliance with the terms
and conditions, to analyse how you engage with the information
contained in this communication, and to share such analysis on an
anonymised basis with others as part of our commercial services.
For further information about how RNS and the London Stock Exchange
use the personal data you provide us, please see our Privacy
Policy.
END
FR BBGDULXDDGBS
(END) Dow Jones Newswires
May 24, 2021 07:45 ET (11:45 GMT)
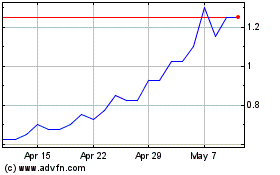
Asiamet Resources (LSE:ARS)
Historical Stock Chart
From Mar 2024 to Apr 2024

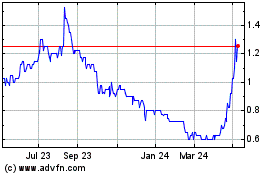
Asiamet Resources (LSE:ARS)
Historical Stock Chart
From Apr 2023 to Apr 2024
