Ashmore Group PLC Trading Statement (7739L)
January 15 2021 - 1:00AM
UK Regulatory
TIDMASHM
RNS Number : 7739L
Ashmore Group PLC
15 January 2021
Ashmore Group plc
15 January 2021
SECOND QUARTER ASSETS UNDER MANAGEMENT STATEMENT
Ashmore Group plc ("Ashmore", "the Group"), the specialist
Emerging Markets asset manager, announces the following update to
its assets under management ("AuM") in respect of the quarter ended
31 December 2020.
Assets under management
                                Actual            Estimated
                          30 September
                                  2020     31 December 2020   Movement
 Theme                   (US$ billion)        (US$ billion)        (%)
 External debt                    17.6                 19.3       +10%
                       ---------------  -------------------  ---------
 Local currency                   18.7                 20.6       +10%
                       ---------------  -------------------  ---------
 Corporate debt                   11.1                 11.6        +5%
                       ---------------  -------------------  ---------
 Blended debt                     23.2                 24.7        +6%
                       ---------------  -------------------  ---------
 Equities                          5.1                  6.5       +27%
                       ---------------  -------------------  ---------
 Alternatives                      1.4                  1.3        -7%
                       ---------------  -------------------  ---------
 Multi-asset                       0.3                  0.3          -
                       ---------------  -------------------  ---------
 Overlay / liquidity               8.1                  8.7        +7%
                       ---------------  -------------------  ---------
 Total                            85.5                 93.0        +9%
                       ---------------  -------------------  ---------
Assets under management increased by US$7.5 billion over the
period, comprising positive investment performance of US$8.1
billion and net outflows of US$0.6 billion.
Client activity was comparable to the previous quarter. There
were net inflows in the overlay / liquidity, external debt and
equities themes, reflecting both new client wins and higher
allocations to existing mandates, particularly in investment grade
credit. The blended debt, corporate debt and local currency themes
saw net outflows, which were concentrated in European and US
intermediary retail channels. Additionally, US$0.2 billion was
returned to investors following successful realisations in the
alternatives theme.
Against a backdrop of positive performance by Emerging Markets
in the quarter, Ashmore's active investment processes delivered
outperformance across its broad range of fixed income and equities
strategies. High absolute performance was delivered in the local
currency, blended debt, equities, external debt and corporate debt
themes. Continuing the trend seen since the market recovery began
in April, Ashmore's one- and three-year performance track records
showed further improvement over the quarter, and the five-year
performance remains very strong.
Mark Coombs, Chief Executive Officer, Ashmore Group plc,
commented:
"Ashmore continued to deliver strong relative investment
performance over the quarter and current equity and fixed income
valuations in Emerging Markets suggest there is much further to go
in terms of recovery investment returns. The strong outperformance
delivered over the past three quarters provides a firm basis for
Ashmore's investment processes to deliver further absolute and
relative performance for clients.
"While COVID will continue to affect individual countries
differently, the deployment of vaccines supports the view that 2021
will see improved growth and importantly the growth in emerging
countries is forecast to be higher than in the developed world.
This therefore provides an opportunity for investors to increase
exposure to higher return Emerging Markets asset classes and to
benefit from economic and market recoveries as they continue to
develop in 2021."
Notes
For the translation of US dollar-denominated balance sheet
items, the GBP:USD exchange rate was 1.3670 at 31 December 2020 (30
June 2020: 1.2356; 31 December 2019: 1.3248). For the translation
of US dollar management fees, the average GBP:USD exchange rate
achieved for the first half of the financial year was 1.3107 (H1
2019/20: 1.2657).
Ashmore will announce its interim results in respect of the six
months ending 31 December 2020 on 10 February 2021.
Ashmore's Legal Entity Identifier (LEI) is
549300U3L59WB4YI2X12.
For further information please contact:
Ashmore Group plc
Paul Measday
Investor Relations +44 (0)20 3077 6278
FTI Consulting
   Neil Doyle                               +44 (0)20 3727 1141
   Laura Ewart                            +44 (0)20 3727 1160
This information is provided by RNS, the news service of the
London Stock Exchange. RNS is approved by the Financial Conduct
Authority to act as a Primary Information Provider in the United
Kingdom. Terms and conditions relating to the use and distribution
of this information may apply. For further information, please
contact rns@lseg.com or visit www.rns.com.
RNS may use your IP address to confirm compliance with the terms
and conditions, to analyse how you engage with the information
contained in this communication, and to share such analysis on an
anonymised basis with others as part of our commercial services.
For further information about how RNS and the London Stock Exchange
use the personal data you provide us, please see our Privacy
Policy.
END
TSTFLFVDLSISLIL
(END) Dow Jones Newswires
January 15, 2021 02:00 ET (07:00 GMT)
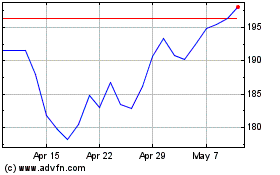
Ashmore (LSE:ASHM)
Historical Stock Chart
From Mar 2024 to Apr 2024

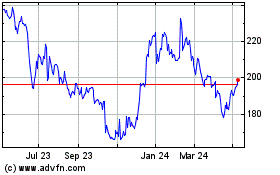
Ashmore (LSE:ASHM)
Historical Stock Chart
From Apr 2023 to Apr 2024
