Ashmore Group PLC Trading Statement (1374F)
July 14 2021 - 1:00AM
UK Regulatory
TIDMASHM
RNS Number : 1374F
Ashmore Group PLC
14 July 2021
Ashmore Group plc
14 July 2021
FOURTH QUARTER ASSETS UNDER MANAGEMENT STATEMENT
Ashmore Group plc ("Ashmore", "the Group"), the specialist
Emerging Markets asset manager, announces the following update to
its assets under management ("AuM") in respect of the quarter ended
30 June 2021.
Assets under management
                                 Actual        Estimated
                          31 March 2021     30 June 2021   Movement
 Theme                    (US$ billion)    (US$ billion)        (%)
 External debt                     17.5             18.2      +4.0%
                       ----------------  ---------------  ---------
 Local currency                    18.6             19.6      +5.4%
                       ----------------  ---------------  ---------
 Corporate debt                    11.4             11.3      -0.9%
                       ----------------  ---------------  ---------
 Blended debt                      23.3             23.4      +0.4%
                       ----------------  ---------------  ---------
 Equities                           6.8              7.4      +8.8%
                       ----------------  ---------------  ---------
 Alternatives                       1.4              1.4          -
                       ----------------  ---------------  ---------
 Multi-asset                        0.3              0.3          -
                       ----------------  ---------------  ---------
 Overlay / liquidity               10.6             12.8     +20.8%
                       ----------------  ---------------  ---------
 Total                             89.9             94.4      +5.0%
                       ----------------  ---------------  ---------
Assets under management increased by US$4.5 billion over the
period, comprising net inflows of US$1.1 billion and positive
investment performance of US$3.4 billion.
The net inflows in the quarter were driven by institutional
clients and included a combination of new mandates, particularly in
the overlay, equities and external debt themes, and additional
allocations to existing funds across the fixed income and equities
investment themes. There was a small net outflow from intermediary
retail clients. By investment theme, overlay / liquidity and
equities delivered net inflows in the period; the local currency,
alternatives and multi-asset themes were flat; and the blended
debt, corporate debt and, to a lesser extent, the external debt
themes experienced net outflows.
Emerging Markets performed well over the three months and
recovered most of the drawdown from the previous quarter. Ashmore's
active investment processes delivered positive absolute performance
across all fixed income and equities themes and significant
outperformance in the period, which underpinned a further
improvement in one and three-year relative performance track
records. The relative performance over five years remains strong
across all strategies. By investment theme, the absolute
performance was highest in blended debt, local currency and
external debt, with corporate debt and equities also contributing
to AuM growth in the period.
Mark Coombs, Chief Executive Officer, Ashmore Group plc,
commented:
"Ashmore's strong relative investment performance and a
consistent recovery in net flows, supported by positive market
performance, have delivered AuM growth of 13% or nearly US$11
billion over the past 12 months and 5% growth in this quarter.
"Overall, developing countries are emerging from the COVID-19
pandemic in a stronger position than Developed Markets: economic
growth is higher, debt levels are manageable even after the recent
fiscal stimulus, inflation is under control and hawkish central
banks should ensure that remains the case. Extremely attractive
valuations should support continued capital flows. The trajectory
of the recovery is unlikely to be linear, and there will inevitably
be further periods of price volatility, but Ashmore's investment
processes will continue to exploit these market opportunities to
underpin its successful long-term investment track record."
Notes
For the translation of US dollar-denominated balance sheet
items, the GPD:USD exchange rate was 1.3815 at 30 June 2021 (30
June 2020: 1.2356; 31 December 2020: 1.3670). For the translation
of US dollar management fees, the average GBP:USD exchange rate for
the financial year was 1.3472 (FY2019/20: 1.2637).
Ashmore will announce its results in respect of the year ended
30 June 2021 on 3 September 2021.
Ashmore's Legal Entity Identifier (LEI) is
549300U3L59WB4YI2X12.
For further information please contact:
Ashmore Group plc
Paul Measday
Investor Relations +44 (0)20 3077 6278
FTI Consulting
   Neil Doyle                               +44 (0)20 3727 1141
   Kit Dunford                             +44 (0)20 3727 1143
APPIX
Ashmore will update the presentation of its investment themes
for client reporting purposes and, to ensure consistency across the
Group, the following changes will be implemented for AuM reporting
from Q1 2021/22 (i.e. the quarter ending 30 September 2021):
   --    Multi-asset funds will be reported in the Equities theme.
   --    Overlay/liquidity funds will be reported in the Local currency theme with the exception of US dollar-denominated money market funds, which will be reported in the External debt theme.
-- The fixed income investment themes will continue to be
reported separately but will also be shown aggregated into a 'Fixed
income' asset class, alongside the Equities and Alternatives asset
classes.
The table below shows the impact of these changes as at 30 June
2021, and the restated comparative information as at 30 June 2020,
31 December 2020 and 31 March 2021.
                        31 March 2021                     30 June 2021
                              Reported       New format         Reported       New format
                         (US$ billion)    (US$ billion)    (US$ billion)    (US$ billion)
                       ---------------  ---------------  ---------------  ---------------
 Fixed income                        -             81.4                -             85.3
                       ---------------  ---------------  ---------------  ---------------
 - External debt                  17.5             17.9             18.2             18.7
                       ---------------  ---------------  ---------------  ---------------
 - Local currency                 18.6             28.8             19.6             31.9
                       ---------------  ---------------  ---------------  ---------------
 - Corporate debt                 11.4             11.4             11.3             11.3
                       ---------------  ---------------  ---------------  ---------------
 - Blended debt                   23.3             23.3             23.4             23.4
                       ---------------  ---------------  ---------------  ---------------
 Equities                          6.8              7.1              7.4              7.7
                       ---------------  ---------------  ---------------  ---------------
 Alternatives                      1.4              1.4              1.4              1.4
                       ---------------  ---------------  ---------------  ---------------
 Multi-asset                       0.3                -              0.3                -
                       ---------------  ---------------  ---------------  ---------------
 Overlay / liquidity              10.6                -             12.8                -
                       ---------------  ---------------  ---------------  ---------------
 Total                            89.9             89.9             94.4             94.4
                       ---------------  ---------------  ---------------  ---------------


                        30 June 2020                      31 December 2020
                              Reported       New format         Reported       New format
                         (US$ billion)    (US$ billion)    (US$ billion)    (US$ billion)
                       ---------------  ---------------  ---------------  ---------------
 Fixed income                        -             77.3                -             84.9
                       ---------------  ---------------  ---------------  ---------------
 - External debt                  17.1             17.6             19.3             19.7
                       ---------------  ---------------  ---------------  ---------------
 - Local currency                 18.7             25.8             20.6             28.9
                       ---------------  ---------------  ---------------  ---------------
 - Corporate debt                 10.6             10.6             11.6             11.6
                       ---------------  ---------------  ---------------  ---------------
 - Blended debt                   23.3             23.3             24.7             24.7
                       ---------------  ---------------  ---------------  ---------------
 Equities                          4.6              4.9              6.5              6.8
                       ---------------  ---------------  ---------------  ---------------
 Alternatives                      1.4              1.4              1.3              1.3
                       ---------------  ---------------  ---------------  ---------------
 Multi-asset                       0.3                -              0.3                -
                       ---------------  ---------------  ---------------  ---------------
 Overlay / liquidity               7.6                -              8.7                -
                       ---------------  ---------------  ---------------  ---------------
 Total                            83.6             83.6             93.0             93.0
--------------- --------------- --------------- ---------------
This information is provided by RNS, the news service of the
London Stock Exchange. RNS is approved by the Financial Conduct
Authority to act as a Primary Information Provider in the United
Kingdom. Terms and conditions relating to the use and distribution
of this information may apply. For further information, please
contact rns@lseg.com or visit www.rns.com.
RNS may use your IP address to confirm compliance with the terms
and conditions, to analyse how you engage with the information
contained in this communication, and to share such analysis on an
anonymised basis with others as part of our commercial services.
For further information about how RNS and the London Stock Exchange
use the personal data you provide us, please see our Privacy
Policy.
END
TSTFLFIDDLIVLIL
(END) Dow Jones Newswires
July 14, 2021 02:00 ET (06:00 GMT)
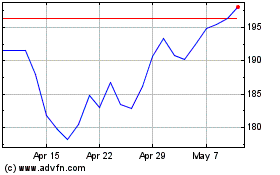
Ashmore (LSE:ASHM)
Historical Stock Chart
From Mar 2024 to Apr 2024

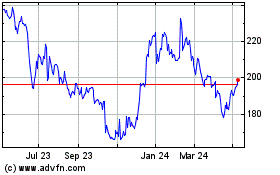
Ashmore (LSE:ASHM)
Historical Stock Chart
From Apr 2023 to Apr 2024
