BlackRock Smll Cos Portfolio Update
June 23 2021 - 6:31AM
UK Regulatory
TIDMBRSC

The information contained in this release was correct as at 31 May 2021.
Information on the Company's up to date net asset values can be found on the
London Stock Exchange Website at

https://www.londonstockexchange.com/exchange/news/market-news/
market-news-home.html.

BLACKROCK SMALLER COMPANIES TRUST PLC (LEI:549300MS535KC2WH4082)


All information is at 31 May 2021 and unaudited.
Performance at month end is calculated on a capital only basis


                                            One     Three     One    Three      Five
                                          month    months    year    years     years
                                              %         %       %        %         %

Net asset value*                            1.5      15.5    50.4     29.4      96.9

Share price*                                2.6      15.7    53.0     33.2     115.8

Numis ex Inv Companies + AIM Index          1.1      11.3    53.2     19.2      52.1

*performance calculations based on a capital only NAV with debt at par, without
income reinvested. Share price performance calculations exclude income
reinvestment.

Sources:  BlackRock and Datastream

At month end

Net asset value Capital only (debt at par value):                             2,052.74p

Net asset value Capital only (debt at fair value):                            2,042.91p

Net asset value incl. Income (debt at par value)1:                            2,062.05p

Net asset value incl. Income (debt at fair value)1:                           2,052.22p

Share price:                                                                  1,964.00p

Discount to Cum Income NAV (debt at par value):                                    4.3%

Discount to Cum Income NAV (debt at fair value):                                   4.8%

Net yield2:                                                                        1.7%

Gross assets3:                                                                £1,101.5m

Gearing range as a % of net assets:                                               0-15%

Net gearing including income (debt at par):                                        9.7%

Ongoing charges ratio (actual)4:                                                   0.8%

Ordinary shares in issue5:                                                   48,829,792


 1. Includes net revenue of 9.31 p

 2. Yield calculations are based on dividends announced in the last 12 months
    as at the date of release of this announcement, and comprise the first
    interim dividend of 12.8 pence per share (announced on 5 November 2020,
    ex-dividend on 12 November 2020, paid on 26 November 2020) and the second
    interim dividend of 20.5 pence per share (announced on 7 May 2021,
    ex-dividend on 20 May 2021 and pay date 18 June 2021).

 3. Includes current year revenue.

 4. As reported in the Annual Financial Report for the year ended 28 February
    2021 the Ongoing Charges Ratio (OCR) was 0.8%. The OCR is calculated as a
    percentage of net assets and using operating expenses, excluding
    performance fees, finance costs and taxation.

 5. Excludes 1,163,731 ordinary shares held in treasury.

Sector Weightings                                          % of portfolio

Industrials                                                          29.2

Consumer Discretionary                                               21.5

Financials                                                           16.1

Consumer Staples                                                     11.5

Technology                                                            7.4

Basic Materials                                                       5.4

Health Care                                                           3.7

Energy                                                                3.3

Telecommunications                                                    1.6

Real Estate                                                           0.3

                                                                    -----

Total                                                               100.0

                                                                    =====


Country Weightings                                         % of portfolio

United Kingdom                                                       98.4

United States                                                         1.2

Guernsey                                                              0.4

                                                                    -----

Total                                                               100.0

                                                                    =====


Ten Largest Equity Investments                             % of portfolio
Company

Watches of Switzerland                                                2.4

Treatt                                                                2.3

Impax Asset Management                                                2.2

CVS Group                                                             1.9

Breedon                                                               1.9

IntegraFin                                                            1.7

Gamma Communications                                                  1.6

Stock Spirits Group                                                   1.6

YouGov                                                                1.6

Pets At Home                                                          1.6


Commenting on the markets, Roland Arnold, representing the Investment Manager
noted:

During May the Company's NAV per share rose by 1.5%1 to 2,052.74p,
outperforming our benchmark index which returned 1.1%1; for comparison the FTSE
100 Index rose by 0.8%1 (all figures are on a capital only basis).

Equity markets delivered another positive month in May as vaccine deployment
continued to make progress across many developed market countries. Following
April's resurgence of the growth factor being the primary driver of returns,
market leadership in May switched firmly back to value outperforming growth
following signs of rising inflation in both the UK and US. April CPI figures
showed that UK inflation "more than doubled" to 1.5% year-on-year, however, the
rise was in-line with consensus, with much of the increase coming from one-off
factors and the lower base effect. Therefore, while the rise appears to be
transitory the market was fast to react. UK lockdown easing continued with the
reopening of indoor dining and hotels on the 17th May, however, the newly
branded "delta" variant of the virus caused some concerns around the planned
return to normality.

Outperformance during May was driven by another month of positive updates from
many of our long-term core holdings. The largest positive contributor was
marketer of promotional products, 4imprint, which provided a solid trading
update. Since the full year results, which were reported in March, the business
has continued to see order intake accelerate; it now stands at 85% of 2019
levels. The result is an encouraging sign for the US economy, given that
4imprint generates almost 100% of its revenue from the US and provides us with
confidence that the company will return to its previous strategy of
consolidating its fragmented end market. Auction Technology Group, which we
purchased at IPO (Initial Public Offering) earlier in the year, reported
interim results showing impressive revenue growth as the traditional auction
house clients continue to see the benefits of moving online. Impax Asset
Management was once again a top contributor during the month as the recent
growth in AUM (Assets Under Management) shows no sign of slowing given the
strength of its franchise, market leading investment performance and the
structural growth/interest in sustainability which underpins the company's
investment philosophy.

Ergomed, the pharmaceutical services business, gave back some of its recent
strong performance having been an outstanding performer over the last year.
Other notable detractors included video game developer Team17 and digital
payments provider Eckoh, both of which have been top performers during the
COVID-19 pandemic. Importantly these are not businesses that we think were
simply COVID-19 lockdown beneficiaries, and we believe that the structural
changes that we are seeing in their markets will result in continued demand for
their products leading long term growth in profits and cashflows.

In the UK the successful vaccine rollout continues, but the pace of reopening
remains a key focus for investors. Like everyone we are monitoring the
situation closely, and whilst there is always a risk a 'variant of concern' may
cause the re-opening plan to falter (as we have just seen in the UK with the 4
week delay) at this time we still believe the vaccine will ultimately see us
return to a more normal way of life. The strength of trading shown in the
recent reporting season provides us with confidence in our current positioning
and the outlook for many businesses across the portfolio continues to improve.
We also continue to see evidence that those companies which went into the
COVID-19 crisis in a strong position (both financially and operationally) are
emerging even stronger. The ability of well financed market leading businesses
to improve their relative positions in times of stress has always been one of
our core beliefs, and this crisis has only reinforced that belief.

We continue to focus on bottom-up company fundamentals, with a bias towards
high quality market leading global businesses, which are operating in
attractive end markets and run by strong management teams. The road ahead
remains uncertain, and there is potential for sharp spikes in volatility.
However, as always, we believe that focusing on the micro will triumph over the
macro headwinds, and historically volatility has always created opportunity for
this strategy. We thank shareholders for their continued support.

     1Source: BlackRock as at 31 May 2021

23 June 2021


ENDS


Latest information is available by typing www.blackrock.com/uk/brsc on the
internet, "BLRKINDEX" on Reuters, "BLRK" on Bloomberg or "8800" on Topic 3 (ICV
terminal).  Neither the contents of the Manager's website nor the contents of
any website accessible from hyperlinks on the Manager's website (or any other
website) is incorporated into, or forms part of, this announcement.


END
(END) Dow Jones Newswires
June 23, 2021 07:31 ET (11:31 GMT)
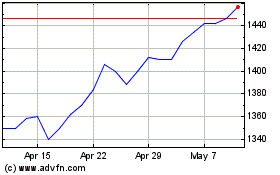
Blackrock Smaller (LSE:BRSC)
Historical Stock Chart
From Mar 2024 to Apr 2024

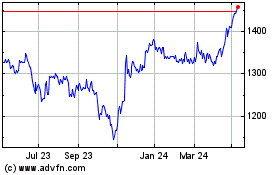
Blackrock Smaller (LSE:BRSC)
Historical Stock Chart
From Apr 2023 to Apr 2024
