TIDMEUZ
Europa Metals Ltd
12 July 2021
12 July 2021
Europa Metals Ltd
("Europa Metals", the "Company" or the "Group") (AIM, AltX:
EUZ)
Investor Webinar - Toral Pb, Zn & Ag Project
Europa Metals, the European focused lead-zinc and silver
developer, is pleased to announce that it will be making an
investor presentation at the Turner Pope-Vox Markets webinar on
Wednesday, 14 July 2021 at 3.30 p.m. (GMT) which investors may
attend via the following link:
https://voxmarkets.brand.live/c/vox-markets-and-turner-pope-webinar-wednesday-july-14th
Developing Potential Future Lead, Zinc & Silver Production
within the EU
The Company is currently conducting a Pre-Feasibility Study
("PFS") on its wholly owned Toral Lead, Zinc and Silver project,
Spain, with Wardell Armstrong International Ltd as PFS manager,
further to, inter alia, the preliminary economic study successfully
completed by Bara Consulting and Addison Mining Services Limited in
November 2020 which determined the following key parameters:
 Resource      Indicated Tonnes           3.8m
  Inferred Tonnes                         13m
 --------------------------------------  ------------------
  Total Tonnes                            17m
 --------------------------------------  ------------------
  Av. ZnEq.%                              7.3
 --------------------------------------  ------------------
 Mining        Rate tpa                   700,000
              -------------------------  ------------------
  Grade ZnEq%                             7.6%
 --------------------------------------  ------------------
  Cost                                    US$36/t
 --------------------------------------  ------------------
  LOM                                     12 years
 --------------------------------------  ------------------
 Metallurgy    Process                    Sorting+Flotation
              -------------------------  ------------------
  Recovery (Average)                      85% Zn, 87% Pb,
                                           86% Ag
 --------------------------------------  ------------------
 Capex         Mine                       US$86m
              -------------------------  ------------------
  Upfront (to production)                 US$79m
 --------------------------------------  ------------------
 Financials    NPV                        US$156m
              -------------------------  ------------------
  IRR                                     31.3%
 --------------------------------------  ------------------
  Payback Year                            4
 --------------------------------------  ------------------
Located within the province of Castilla y León, north-west
Spain, the Toral project is well positioned to become a potential
high grade production source of lead, zinc and silver within the EU
trading block.
For further information on the Company, please visit
www.europametals.com or contact:
Europa Metals Ltd
Dan Smith, Non-Executive Director and Company Secretary
(Australia)
T: +61 417 978 955
Laurence Read, CEO (UK)
T: +44 (0)20 3289 9923
Linkedin: Europa Metals ltd
Twitter: @ltdeuropa
Vox: Europametals
Notes to Editors :
Appendix : Further information on the Toral Project
Mineral Resource Estimate
-- An Indicated resource of approximately 3.8Mt @ 8.3% Zn
Equivalent (including Pb credits), 4.7% Zn, 3.9% Pb and 30g/t Ag,
including:
o 180,000 tonnes of zinc, 150,000 tonnes of lead and 3.7 million
ounces of silver.
-- An Inferred resource of approximately 14Mt @ 6.5% Zn
Equivalent (including Pb credits), 4% Zn, 2.7% Pb and 23 g/t Ag,
including:
o 540,000 tonnes of zinc, 360,000 tonnes of lead and 10 million
ounces of silver.
-- A total resource of approximately 17Mt @ 6.9% Zn Equivalent
(including Pb credits), 4.1% Zn, 2.9% Pb and 24 g/t Ag,
including:
o 720,000 tonnes of zinc, 510,000 tonnes of lead and 14 million
ounces of silver.
Table 1 : Summary of Indicated and Inferred mineral resources
for the Toral property reported at a 4.0% Zn equivalent cut-off
grade (including Pb and Ag credits) and estimated grade and
tonnages at the various cut-off grades. Figures are rounded to
reflect the accuracy of the estimate and, as such, totals may not
cast.
  Cut-Off      Tonnes     Density     Zn_Eq        Zn Eq     Zn %   Pb %   Ag g/t   Contained   Contained   Ag Troy Oz
   Zn Eq     (Millions)               (Pb)%       (PbAg)%                           Zn Tonnes   Pb Tonnes   (Millions)
  (PbAg)%                                                                            (000s)      (000s)
                                                       Indicated
     6          2.8         2.9        9.5         10.0      5.3    4.5      34        150         130         3.1
            -----------  --------  -----------  ----------  -----  -----  -------  ----------  ----------  -----------
     5          3.3         2.9        8.9          9.5      5.0    4.2      32        170         140         3.4
            -----------  --------  -----------  ----------  -----  -----  -------  ----------  ----------  -----------
     4          3.8         2.9        8.3          8.9      4.7    3.9      30        180         150         3.7
            -----------  --------  -----------  ----------  -----  -----  -------  ----------  ----------  -----------
     3          4.1         2.9        7.9          8.5      4.4    3.7      29        180         150         3.8
            -----------  --------  -----------  ----------  -----  -----  -------  ----------  ----------  -----------
                                                       Inferred
     6           8          2.9        7.8          8.3      4.7    3.4      28        370         270         7.2
            -----------  --------  -----------  ----------  -----  -----  -------  ----------  ----------  -----------
     5           10         2.9        7.2          7.7      4.4    3.0      26        450         310         8.6
            -----------  --------  -----------  ----------  -----  -----  -------  ----------  ----------  -----------
     4           14         2.9        6.5          6.9      4.0    2.7      23        540         360          10
            -----------  --------  -----------  ----------  -----  -----  -------  ----------  ----------  -----------
     3           17         2.9        5.9          6.3      3.7    2.4      20        610         400          11
            -----------  --------  -----------  ----------  -----  -----  -------  ----------  ----------  -----------
                                                         Total
     6           11         2.9        8.2          8.8      4.8    3.7      30        520         390          10
            -----------  --------  -----------  ----------  -----  -----  -------  ----------  ----------  -----------
     5           14         2.9        7.6          8.1      4.5    3.3      27        620         450          12
            -----------  --------  -----------  ----------  -----  -----  -------  ----------  ----------  -----------
     4           17         2.9        6.9          7.3      4.1    2.9      24        720         510          14
            -----------  --------  -----------  ----------  -----  -----  -------  ----------  ----------  -----------
     3           21         2.9        6.3          6.7      3.8    2.7      22        790         560          15
            -----------  --------  -----------  ----------  -----  -----  -------  ----------  ----------  -----------
                                              Transitional Oxide Material
     4           3          2.9        5.2          5.7      2.6    2.9      27        75          83          2.5
            -----------  --------  -----------  ----------  -----  -----  -------  ----------  ----------  -----------
                                                Unweathered Fresh Rock
     4           14         2.9        7.2          7.7      4.5    3.0      24        650         430          11
            -----------  --------  -----------  ----------  -----  -----  -------  ----------  ----------  -----------
* - Zn Eq (Pb)% is the calculated Zn equivalent incorporating
lead credits; (Zn Eq (Pb)% = Zn + Pb*0.926). Zn Eq (PbAg)% is the
calculated Zn equivalent incorporating silver credits as well as
lead; (Zn Eq (PbAg)% = Zn + Pb*0.926 + Ag*0.019). Zn equivalent
calculations were based on 3-year trailing average price statistics
obtained from the London Metal Exchange and London Bullion Market
Association giving an average Zn price of US$2,680/t, Pb price of
US$2,100/t and Ag price of US$16.2/oz.
Notes:
1. No mineral reserve calculations have been undertaken. Mineral
resources that are not mineral reserves do not have demonstrated
economic viability.
2. Numbers are rounded to reflect the fact that an Estimate of
Resources is being reported as stipulated by JORC 2012. Rounding of
numbers may result in differences in calculated totals and
averages. All tonnes are metric tonnes.
3. Zn equivalent calculations were based on 3 year trailing
average price statistics obtained from the London Metal Exchange
and London Bullion Market Association giving an average Zn price of
US$2,680/t, Pb price of US$2,100/t and Ag price of US$16.2/Oz.
Recovery and selling factors were incorporated into the calculation
of Zn Eq values. It is the Company's opinion that all the elements
included in the metal equivalents calculation (zinc, lead and
silver) have a reasonable potential to be recovered and sold.
4. Zn Eq (PbAg)% is the calculated Zn equivalent incorporating
silver credits as well as lead and is the parameter used to define
the cut-off grade used for reporting resources (Zn Eq (PbAg)% = Zn
+ Pb*0.926 + Ag*0.019).
5. Zn Eq is the calculated Zn equivalent using lead credits and
does not include silver credits (Zn Eq = Zn + Pb*0.926).
6. The Mineral Resource Estimate set out above for the zinc,
lead and silver mineralisation in the Toral Project area is based
on a 3D geologic model and wireframe restricted block model that
integrated the exploration work on the Toral project up to 21
January 2020. The block model used uniform cell size of 25x10x25m
to best suit the orientation of the mineralisation and sample
spacing. The block model was rotated by 20deg in plan view to best
match the trend of mineralisation. Sub cells were applied to better
fit the wireframe solid models and preserve accurate volume as much
as possible. Cells were interpolated at the parent block scale
using an Ordinary Kriging.
7. Following statistical analysis and assessment of the updated
assay composite database top cuts of 125g/t Ag were applied to the
data. No top cuts were applied for Zn or Pb.
8. The Indicated and Inferred mineral resource category for the
Toral lead-zinc-silver project set out in Table 1 (at cut-off
grades >4% Zn Equivalent) comply with the resource definitions
as described in the Australasian Code for Reporting of Exploration
Results, Mineral Resources and Ore Reserves. The JORC Code, 2012
Edition. Prepared by: The Joint Ore Reserves Committee of The
Australasian Institute of Mining and Metallurgy, Australian
Institute of Geoscientists and Minerals Council of Australia
(JORC).
9. The tonnes and grades reported at a cut-off grade of 3% Zn
equivalent are below the economic cut-off grade of 4% and as such
should not be considered mineral resources, they are shown here for
comparison purposes only.
This information is provided by Reach, the non-regulatory press
release distribution service of RNS, part of the London Stock
Exchange. Terms and conditions relating to the use and distribution
of this information may apply. For further information, please
contact rns@lseg.com or visit www.rns.com.
Reach is a non-regulatory news service. By using this service an
issuer is confirming that the information contained within this
announcement is of a non-regulatory nature. Reach announcements are
identified with an orange label and the word "Reach" in the source
column of the News Explorer pages of London Stock Exchange's
website so that they are distinguished from the RNS UK regulatory
service. Other vendors subscribing for Reach press releases may use
a different method to distinguish Reach announcements from UK
regulatory news.
RNS may use your IP address to confirm compliance with the terms
and conditions, to analyse how you engage with the information
contained in this communication, and to share such analysis on an
anonymised basis with others as part of our commercial services.
For further information about how RNS and the London Stock Exchange
use the personal data you provide us, please see our Privacy
Policy.
END
NRASFEFLEEFSESW
(END) Dow Jones Newswires
July 12, 2021 10:06 ET (14:06 GMT)
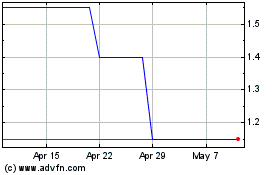
Europa Metals (LSE:EUZ)
Historical Stock Chart
From Mar 2024 to Apr 2024

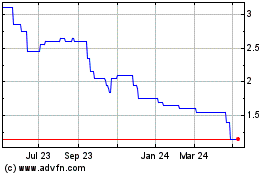
Europa Metals (LSE:EUZ)
Historical Stock Chart
From Apr 2023 to Apr 2024
