Expert Charts 1,400% Course To $7.5 For XRP Price As RSI Falls To All-Time Low
May 31 2024 - 6:00PM
NEWSBTC
Crypto analyst Egrag Crypto has provided another bullish narrative
for the XRP price. This time, he outlined two scenarios that could
occur and cause the crypto token to experience a breakout,
potentially sending it as high as $7.5. This comes with the recent
revelation that XRP’s Relative Strength Index (RSI) has reached its
lowest ever. Time For An XRP Price Breakout Egrag Crypto
shared a chart in an X (formerly Twitter) post that showed that the
crypto token could rise to $7.5 when it accomplishes the breakout,
which the crypto analyst claimed is imminent. Egrag highlighted a
“White Triangle” breakout on the chart, which he stated is
“aligning perfectly” with the previous charts and the Fib 0.702 to
0.786 levels. He added that the measured move is projected to
be between $1.2 and $1.5 before XRP could take off and climb to
$7.5. Egrag further remarked that the “critical breakout point” for
XRP is around $0.70 and $0.7’5 and that the crypto token is
“poised” to achieve this breakout in the “next couple of weeks.
Egrag warned that XRP could still experience significant declines
before then, stating that a retest of the breakout might be on the
cards. However, he is convinced that a “MEGA RUN for XRP is on the
horizon.” Meanwhile, for the second scenario of how XRP could
achieve its impending breakout, Egrag Crypto highlighted an ‘Atlas
Line’ on the XRP chart and claimed that the breakout point for XRP
is at $0.6799. He noted that XRP is still holding strong “like a
boss” on the atlas line, suggesting it shouldn’t be long before it
breaks above $0.6799. In the meantime, $0.5777 and $0.5000
are key price levels that XRP holders should monitor. Egrag labels
them resistance and support levels for XRP’s upward trend along
this atlas line. XRP Hits Its Lowest RSI In History Egrag
revealed in a more recent X post that XRP’s RSI is at its lowest
ever. He noted that this assertion was based on the monthly time
frame and shared a chart to prove his claim. Following his
revelation, Egrag highlighted how bullish this was for XRP,
stating, “If this isn’t a positive signal, I don’t know what is.”
The chart he shared showed that XRP’s Relative Strength Index is at
38, which is indeed bullish for the crypto token. Low RSI levels
are considered a buy signal since they suggest that the coin is
oversold and undervalued. Therefore, crypto investors might be
looking to accumulate XRP, with these buy orders expected to
trigger a move to the upside for the crypto token. At the
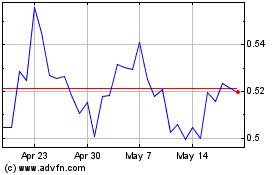
time of writing, XRP is trading at around $0.52, up almost 1% in
the last 24 hours, according to data from CoinMarketCap.
Featured image created with Dall.E, chart from Tradingview.com
Ripple (COIN:XRPUSD)
Historical Stock Chart
From May 2024 to Jun 2024

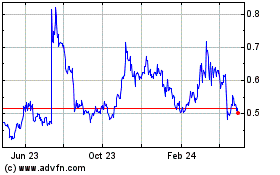
Ripple (COIN:XRPUSD)
Historical Stock Chart
From Jun 2023 to Jun 2024
