| 04. Net Interest Income (NII) |
YoY Analysis
YoY, Net Interest Income rose 12.9%. This positive evolution took place despite drops in average IEA in LC (-1.2%) and FC (-3.2%).
Local Currency Dynamics (LC)
Net interest income in LC increased 7.5% YoY due to the following dynamics:
Average IEA in LC fell 1.2% YoY due to a 5.5% contraction in loan balances, which was driven by amortizations of Government Loans (GP). It is important to note that
average daily balances of structural loans rose 4.1% over the period. Another factor worth mentioning is the uptick reported in investment balances, which reflects strategies to capitalize on surplus liquidity in a context marked by high
rates. In this context, the IEA yield rose from 9.3% in 2Q23 to 10.8% in 3Q23. Consequently, interest income in LC increased 14.8% YoY.
Average funding in LC dropped 4.3% YoY due to reductions in balances for due to banks and BCRP instruments. These movements were driven by expirations of repos for GP loans and securities.
Despite the repos dynamic, the cost of funding rose 125 bps YoY up to 3.7%, due to fund migration from low-cost to time deposits. Consequently, the interest rate expense in LC rose 40.1% YoY in 3Q23.
Foreign Currency Dynamics (FC)
Net interest income in FC rose 35.6% YoY due to the following dynamics:
Average IEA in FC dropped 3.2% YoY due primarily to a contraction in loans and secondarily to a drop in the balance of available funds. Despite the reduction in balances in both accounts,
higher interest rates over the last 12 months have driven the yield on IEAs upward 180 bps. In this context interest income in LC rose 39.1% YoY.
Average funding in FC dropped 4.3% due primarily to a reduction in FC deposits and secondarily to a decrease in the balance for emissions, which reflects the expiration
of a corporate bond in BCP over the period. The cost of funding YoY rose 86 bps, driven primarily by an uptick in rates associated with time deposits and secondarily by higher rates on obligations. In this context, interest expenses rose
43.5% YoY.
YTD Analysis
YTD, Net Interest Income rose 21.3%. This positive evolution took place despite drops in average IEA in LC (-1.9%) and FC (-5.1%).
Local Currency Dynamics (LC)
Net interest income in LC increased 11.0% YTD due to the following dynamics:
The YTD result at the end of Sep 23 was driven by dynamics similar to those seen YoY. Interest income rose 20.8% YTD, driven by a shift in the mix of structural loans
toward a heavier weight in Retail and, to a lesser extent, by an increase in the investment balance. On the funding side, the volume fell, as was the case in the YoY comparison. YTD, the fact that the deposit mix was more heavily weighted
toward time deposits led the interest expense to rise 62.4%.
Foreign Currency Dynamics (FC)
Net interest income in FC rose 64.1% YTD due to the following dynamics:
YTD, interest income in FC rose 64.7% as of Sep 23. This growth, which occurred despite a drop in volumes, was driven by higher rates on both loans and available funds.
Interest expenses rose 58.5% YTD, driven by the same funding dynamics in play YoY.
| |
|
|
|
 |
| |
Earnings Release 3Q / 2023 |
Analysis of 3Q23 Consolidated Results |
| |
|
|
|
| |
Structural provisions remain at historical highs (without considering the pandemic) for Consumer Loans, Credit
Cards and SME- Pyme at BCP and for Mibanco loans due to a recessive environment impacted by high inflation, low internal demand and high interest rates. Growth in provisions at BCP was spurred by i) vulnerable sub-segments in
Individuals, customers who are overindebted at the system level and have less job stability; ii) higher-risk subsegments with lower tickets in SME-Pyme; and iii) Mortgage, after recognizing higher expected losses for certain
clients who have become delinquent in consumer products or at other financial institutions. At Mibanco, the uptick in provisions was driven by a downturn in payment of customers who are overindebted, affected by social
conflicts, or impacted by climatic anomalies.
In the aforementioned context, the Structural Cost of Risk (CofR) rose 23 bps QoQ and 134 bps YoY to stand at 2.6%. YTD, the
Structural CofR rose 130 bps to stand at 2.3%.
The CofR rose 28 bps QoQ and 131 bps YoY to stand at 2.5%. YTD, the CofR rose 130 bps to stand at 2.2%.
|
|
Provisions and Cost of Risk
Provisions and the Cost of Risk (CoR)1 of the Structural Loans
Portfolio
|
Structural Loan Portfolio Provisions
|
Quarter
|
% change
|
Up to
|
% change
|
|
S/ 000
|
3Q22
|
2Q23
|
3Q23
|
QoQ
|
YoY
|
Sep 22
|
Sep 23
|
Sep 23 / Sep 22
|
|
Gross provision for credit losses on loan portfolio
|
(505,657)
|
(882,156)
|
(990,266)
|
12.3%
|
95.8%
|
(1,300,677)
|
(2,671,551)
|
105.4%
|
|
Recoveries of written-off loans
|
85,273
|
81,872
|
91,108
|
11.3%
|
6.8%
|
262,109
|
248,089
|
-5.3%
|
|
Provision for credit losses on loan portfolio, net of recoveries
|
(420,384)
|
(800,284)
|
(899,158)
|
12.4%
|
113.9%
|
(1,038,568)
|
(2,423,462)
|
133.3%
|
|
Structural Cost of risk (1)
|
1.2%
|
2.3%
|
2.6%
|
23 bps
|
134 bps
|
1.0%
|
2.3%
|
130 bps
|
|
(1)
|
Provision for credit losses on loan portfolio, net of annualized recoveries / Total loans.
|
|
(2)
|
The Cost of structural risk excludes Provisions for credit losses for the loan portfolio, net of recoveries and Placements of the government programs (PG) Reactiva Perú and FAE.
|
Structural provisions remain at historically high levels (without considering provisions during the pandemic) in Retail Banking and
at Mibanco given that clients have been hit hard by an adverse macroeconomic context marked by low internal demand, high inflation and interest rates that have hit a peak. At BCP, the most
affected segments were Consumer Loans and Credit Cards, driven by clients in vulnerable sub-segments that are overindebted at the system level and lack job
stability, and SME-Pyme, which reported an uptick in provisions in the subsegment of clients with lower-tickets and higher risk. At Mibanco, clients who
reported the highest level of deterioration were those who are most indebted and those affected by social conflicts or climate anomalies. Additionally, in 3Q23, more provisions were registered at BCP for Mortgage
loans given that: i) higher expected losses were recognized for certain clients that have registered higher delinquency in other products at the bank or with other financial institutions and ii) as a portfolio was reclassified
as refinanced.
The aforementioned was partially offset by a reduction in provisions for Wholesale Banking, which was driven by a reversal of provisions after some
corporate clients reported improvements in their credit ratings and made payments on loans.
As a result of the uptick in provisions and the reduction registered in total loans, the structural CofR rose 23 bps to stand at 2.6%.
YoY and YTD, the uptick in provisions was attributable to:
| |
•
|
Consumer loans, Credit Cards, and SME-Pyme, where deterioration in payment behavior in the most vulnerable sub-segments is more evident
YoY than QoQ.
|
| |
•
|
Mortgage, due to an uptick in expected losses and to the aforementioned reclassification of a portfolio.
|
| |
•
|
Mibanco, where provisions remain high given the payment capacity of those clients that are overindebted and those who were affected by
social conflicts or climate anomalies continued to be poor.
|
Structural Cost of Risk by Subsidiary
| |
|
|
|
|
| |
Earnings Release 3Q / 2023 |
Analysis of 3Q23 Consolidated Results |
| |
|
|
|
The aforementioned was offset by a drop in provisions for Wholesale Banking, which was positively impacted after some clients reported an
improvement in their credit rating and resumed payments on delinquent loans.
As a result of the evolution of provisions, the structural CofR rose YoY and YTD by 134 bps and 130 bps, respectively.
Provisions and CofR in for Government Loans (GP)
|
GP Loan Portfolio Provisions
|
Quarter
|
% change
|
Up to
|
% change
|
|
S/ 000
|
3Q22
|
2Q23
|
3Q23
|
QoQ
|
YoY
|
Sep 22
|
Sep 23
|
Sep 23 / Sep 22
|
|
Gross provision for credit losses on loan portfolio
|
(39,592)
|
(3,967)
|
(18,484)
|
366.0%
|
-53.3%
|
(42,289)
|
(25,429)
|
-39.9%
|
|
Recoveries of written-off loans
|
-
|
-
|
-
|
-
|
-
|
0
|
0
|
-
|
|
Provision for credit losses on loan portfolio, net of recoveries
|
(39,592)
|
(3,967)
|
(18,484)
|
366.0%
|
-53.3%
|
(42,289)
|
(25,429)
|
-39.9%
|
|
GP Cost of risk (1)
|
1.3%
|
0.3%
|
1.8%
|
145 bps
|
47 bps
|
0.5%
|
0.7%
|
23 bps
|
(1). PG Cost of risk includes the Provisions for credit losses for the loan portfolio, net of recoveries and placements of the Reactiva Perú and FAE government
programs.
Provisions for GP loans rose only slightly QoQ, YoY, and YTD given that ongoing honoring processes are underway to execute State guarantees.
The provisions balance for GP loans represents 1.4% of the total provisions balance at Credicorp. This relatively small balance reflects the extensive coverage offered by this type of
loan, which ranges from 80% to 98%. For more information, see 1.2 Portfolio Quality – NPL Portfolio for Government Loans.
Provisions and CofR of Total Portfolio
|
Loan Portfolio Provisions
|
Quarter
|
% change
|
Up to
|
% change
|
|
S/ 000
|
3Q22
|
2Q23
|
3Q23
|
QoQ
|
YoY
|
Sep 22
|
Sep 23
|
Sep 23 / Sep 22
|
|
Gross provision for credit losses on loan portfolio
|
(545,249)
|
(886,123)
|
(1,008,750)
|
13.8%
|
85.0%
|
(1,342,966)
|
(2,696,980)
|
100.8%
|
|
Recoveries of written-off loans
|
85,273
|
81,872
|
91,108
|
11.3%
|
6.8%
|
262,109
|
248,089
|
-5.3%
|
|
Provision for credit losses on loan portfolio, net of recoveries
|
(459,976)
|
(804,251)
|
(917,642)
|
14.1%
|
99.5%
|
(1,080,857)
|
(2,448,891)
|
126.6%
|
|
Cost of risk (1)
|
1.2%
|
2.3%
|
2.5%
|
28 bps
|
131 bps
|
1.0%
|
2.2%
|
130 bps
|
(1). Provision for credit losses on loan portfolio, net of annualized recoveries / Total loans.
The CofR for the total portfolio, which is composed of structural and GP loans, reported growth of 28 bps QoQ, 131 bps YoY, and 171 bps YTD. Growth over these periods
was driven by an uptick in provisions for structural loans.
| QoQ Cost of Risk Evolution |
|
YoY Cost of Risk Evolution |
| |
|
|
 |
|

|
|
(1) Others include BCP Bolivia, Mibanco Colombia, ASB y eliminations.
|
|
(1) Others include BCP Bolivia, Mibanco Colombia, ASB y eliminations
|
YTD Cost of Risk Evolution
(1) Others include BCP Bolivia, Mibanco Colombia, ASB y eliminations
| |
|
|
|
|
| |
Earnings Release 3Q / 2023 |
Analysis of 3Q23 Consolidated Results |
| |
|
|
|
| |
Other Core Income rose 1.1% QoQ and decreased -1.1% YoY. On accumulated basis, Other Core Income decreased
1.3%. If we excluded BCP Bolivia from the QoQ analysis, this line rose 1.7% driven by growth in banking fees via positive dynamics in fee income from credit cards, collection services and billing payments at BCP. These
dynamics were partially offset by a reduction in the Gain on FX transactions, in context of lower client transactions. YoY, if we isolate the impact of BCP Bolivia, Other Core Income fell -1.2%, driven primarily by a decrease
in fee income from Prima AFP, Credicorp Capital and BCP. This was partially offset by a 1.4% increase in the Gain on FX Transactions, which was fueled by Credicorp Capital. For the first nine months, excluding BCP Bolivia,
Other Core Income fell 1.9%, driven by the same dynamics that drove the YoY evolution.
|
|
|
Other Core Income
|
Quarter
|
% Change
|
As of
|
% Change
|
|
(S/ 000)
|
3Q22
|
2Q23
|
3Q23
|
QoQ
|
YoY
|
Sep 22
|
Sep 23
|
Sep 23/ Sep 22
|
|
Fee income
|
934,984
|
960,550
|
975,955
|
1.6%
|
4.4%
|
2,747,562
|
2,818,286
|
2.6%
|
|
Net gain on foreign exchange transactions
|
262,167
|
210,944
|
208,620
|
-1.1%
|
-20.4%
|
790,936
|
668,079
|
-15.5%
|
|
Total other income Core
|
1,197,151
|
1,171,494
|
1,184,575
|
1.1%
|
-1.1%
|
3,538,498
|
3,486,365
|
-1.5%
|
If we analyze the dynamic of Other Core Income, it is important to note that the Fee income and Net gain on FX transactions lines have been affected by our operation in BCP Bolivia, where
we charge fees to FX clients to offset losses on buy-sell FX transactions.
QoQ, Total Other Income Core rose 1.1%, driven by an increase of 1.6% in fees and a drop of 1.1% in Net gain on FX transactions.
Excluding BCP Bolivia, Total Core Income rose 1.7%, which was driven by:
| |
•
|
The increase in Fee income (+2.9%), was driven primarily by BCP Peru. This dynamic will be discussed in the banking fees section.
|
| |
•
|
The aforementioned was partially offset by the Net gain on FX transactions, which decreased -2.6%
|
YoY, Total Other Income fell -1.1% due to a -20.4% reduction in the FX transactions volume, which was offset by an increase of 4.4% in Fee Income.
Excluding BCP Bolivia, Other Core Income fell -1.2%, driven by:
| |
•
|
A drop in Fee Income (-1.9%), associated with the dynamics in: (i) Prima AFP, due to an adjustment in the fee framework applicable to a significant share of affiliates (ii) Credicorp Capital
primarily due to lower AUMs in the third-party fund distribution business. (within Asset Management); and (3) BCP, where the inter-city fee was eliminated in 1Q23.
|
| |
•
|
The above was partially offset by Net Gain on FX Transactions, which increased 1.4%, driven by Credicorp Capital.
|
YTD, excluding BCP Bolivia, Other Core income fell 1.9%, driven by the same dynamics that drove the YoY evolution.
Income for Banking Fees
Composition of fee income in the banking business
|
Banking Business Fees
|
Quarter
|
% Change
|
As of
|
% Change
|
|
S/ 000
|
3Q22
|
2Q23
|
3Q23
|
QoQ
|
YoY
|
Sep 22
|
Sep 23
|
Sep 23/ Sep 23
|
|
Payments and transactionals (1)
|
328,202
|
344,632
|
366,111
|
6.2%
|
11.6%
|
923,349
|
1,085,140
|
17.5%
|
|
Liability accounts (2)
|
237,873
|
182,018
|
178,224
|
-2.1%
|
-25.1%
|
689,866
|
538,214
|
-22.0%
|
|
Loan Disbursement (3)
|
100,721
|
91,599
|
89,916
|
-1.8%
|
-10.7%
|
283,255
|
276,716
|
-2.3%
|
|
Off-balance sheet
|
60,283
|
57,154
|
55,659
|
-2.6%
|
-7.7%
|
179,956
|
174,468
|
-3.0%
|
|
Mibanco (Peru and Colombia)
|
32,258
|
41,708
|
39,220
|
-6.0%
|
21.6%
|
110,534
|
127,767
|
15.6%
|
|
Insurances
|
31,382
|
30,540
|
32,960
|
7.9%
|
5.0%
|
90,508
|
94,602
|
4.5%
|
|
BCP Bolivia
|
26,296
|
95,027
|
84,941
|
-10.6%
|
223.0%
|
79,164
|
230,102
|
190.7%
|
|
Wealth Management and Corporate Finance
|
15,593
|
16,878
|
16,428
|
-2.7%
|
5.4%
|
52,504
|
48,560
|
-7.5%
|
|
ASB
|
10,422
|
10,560
|
10,153
|
-3.9%
|
-2.6%
|
30,248
|
30,500
|
0.8%
|
|
Others (4)
|
13,850
|
15,318
|
16,803
|
n.a
|
n.a
|
31,104
|
45,020
|
44.7%
|
|
Total
|
840,189
|
878,592
|
898,278
|
2.2%
|
6.9%
|
2,434,488
|
2,635,689
|
8.3%
|
|
(1)
|
Corresponds to fees from: credit and debit cards; payments and collections.
|
|
(2)
|
Corresponds to fees from: Account maintenance, interbank transfers, national money orders y international transfers.
|
|
(3)
|
Corresponds to fees from retail and wholesale loan disbursements.
|
|
(4)
|
Use of third-party network, other services to third parties and Commissions in foreign branches.
|
| |
|
|
|
|
| |
Earnings Release 3Q / 2023 |
Analysis of 3Q23 Consolidated Results |
| |
|
|
|
Banking fees rose 2.2% QoQ and 6.9% YoY. YTD at the end of September, total fees rose 8.3%.
Excluding BCP Bolivia from the variation analysis:
Total banking fees increased 3.8% QoQ, driven primarily by growth in Payment and Transactional at BCP, where growth in income from credit cards, collections
services and bill payments stood out.
In the YoY analysis, total banking fees fell -0.1%, driven by the following dynamics:
| |
•
|
The positive evolution of Payments and Transactional at BCP, which experienced an uptick in income through credit cards, collection services and service payments.
|
| |
•
|
The reduction in the Liability Accounts and Transactional after inter-city fees were eliminated.
|
| |
•
|
The contraction in Loan Disbursement fees driven by lower income from foreign trade products.
|
In YTD analysis, banking fees rose 8.6%. This evolution was driven by the same factors as those seen in the YoY analysis.
6.2 Other Non-core income
|
Other Non-Core Income
|
Quarter
|
% change
|
As of
|
% change
|
|
(S/ 000)
|
3Q22
|
2Q23
|
3Q23
|
QoQ
|
YoY
|
Sep 22
|
Sep 23
|
Sep 23 / Sep 22
|
|
Net gain on securities
|
(25,460)
|
68,603
|
53,591
|
-21.9%
|
-310.5%
|
(176,507)
|
192,230
|
-208.9%
|
|
Net gain from associates (1)
|
25,806
|
23,689
|
32,056
|
35.3%
|
24.2%
|
79,039
|
82,957
|
5.0%
|
|
Net gain on derivatives held for trading
|
53,008
|
16,671
|
38,545
|
131.2%
|
-27.3%
|
59,330
|
48,646
|
-18.0%
|
|
Net gain from exchange differences
|
(5,917)
|
2,996
|
4,564
|
52.3%
|
-177.1%
|
(32,721)
|
30,523
|
-193.3%
|
|
Other non-financial income
|
56,664
|
149,671
|
89,272
|
-40.4%
|
57.5%
|
270,594
|
328,281
|
21.3%
|
|
Total other Non-Core Income
|
104,101
|
261,630
|
218,028
|
-16.7%
|
109.4%
|
199,735
|
682,637
|
241.8%
|
(1) Includes gains on other investments, which are mainly attributable to the Banmedica result.
|
QoQ Other Non-Core Income Evolution
(Thousands of soles)
|
|
YoY Other Non-Core Income Evolution
(Thousands of soles)
|
 |
|
 |
(1) Others includes: Grupo Crédito, Credicorp Individual, eliminations and others.
QoQ, Other Non-Core Income dropped. This evolution was driven mainly by the decrease in Other Non-Operating Income given
that last quarter, gains were reported for a portfolio sale.
YoY, Other Non-Core Income rose. This result was primarily fueled by growth in the Net gain on securities in the Insurance and Pension business and was also impacted
by an uptick in Other Non-Operating Income, which was associated with recognition of fees from previous periods.
YTD, the dynamic was similar to the YoY.
| |
|
|
|
|
| |
Earnings Release 3Q / 2023 |
Analysis of 3Q23 Consolidated Results |
| |
|
|
|
| 07 |
Insurance Underwriting Results |
|
The insurance underwriting result increased 11.6% QoQ due to uptick in the underwriting results in Life and Crediseguros. This evolution was driven
primarily by a drop in total expenses for the Credit Life and Individual Life insurance products after IBNR-COVIDE reserves were released.
The insurance underwriting result rose 0.1% QoQ due to an improvement in the results for P&C. This evolution was mitigated by lower results in
Life. P&C’s result rose due to the favorable evolution of P&C Risks and Medical
|
|
|
Insurance Underwriting Result
|
Quarter
|
Change %
|
As of
|
Change %
|
|
S/ millions
|
|
3Q22
|
2Q23
|
3Q23
|
QoQ
|
YoY
|
Sep 22
|
Sep 23
|
Sep23 / Sep22
|
|
Total
|
Income from Insurance Services
|
885.5
|
945.9
|
923.7
|
-2.3%
|
4.3%
|
2,558.7
|
2,823.5
|
10.3%
|
|
Expenses for Insurance Services
|
(496.4)
|
(550.4)
|
(505.4)
|
-8.2%
|
1.8%
|
(1,540.8)
|
(1,601.0)
|
3.9%
|
|
Reinsurance Results
|
(85.3)
|
(98.9)
|
(87.4)
|
-11.7%
|
2.4%
|
(313.2)
|
(298.7)
|
-4.6%
|
|
Insurance Undewrwriting Result
|
303.8
|
296.6
|
330.9
|
11.6%
|
8.9%
|
704.6
|
923.8
|
31.1%
|
|
P&C
|
Income from Insurance Services
|
397.4
|
427.0
|
404.6
|
-5.2%
|
1.8%
|
1,232.1
|
1,244.9
|
1.0%
|
|
Expenses for Insurance Services
|
(241.2)
|
(274.1)
|
(256.2)
|
-6.6%
|
6.2%
|
(698.5)
|
(816.4)
|
16.9%
|
|
Reinsurance Results
|
(76.9)
|
(69.2)
|
(64.3)
|
-7.1%
|
-16.4%
|
(306.2)
|
(214.8)
|
-29.8%
|
|
Insurance Undewrwriting Result
|
79.3
|
83.6
|
84.2
|
0.7%
|
6.1%
|
227.4
|
213.8
|
-6.0%
|
|
Life
|
Income from Insurance Services
|
480.1
|
491.4
|
487.1
|
-0.9%
|
1.5%
|
1,285.0
|
1,498.3
|
16.6%
|
|
Expenses for Insurance Services
|
(254.3)
|
(270.7)
|
(243.3)
|
-10.1%
|
-4.4%
|
(839.8)
|
(771.2)
|
-8.2%
|
|
Reinsurance Results
|
(14.0)
|
(24.0)
|
(17.3)
|
-27.9%
|
23.1%
|
(6.9)
|
(68.4)
|
890.9%
|
|
Insurance Undewrwriting Result
|
211.8
|
196.8
|
226.6
|
15.1%
|
7.0%
|
438.2
|
658.7
|
50.3%
|
|
Crediseguros
|
Income from Insurance Services
|
18.9
|
29.6
|
33.9
|
14.6%
|
79.5%
|
54.7
|
86.5
|
58.2%
|
|
Expenses for Insurance Services
|
(4.6)
|
(10.2)
|
(11.3)
|
10.1%
|
142.5%
|
(14.6)
|
(27.7)
|
90.4%
|
|
Reinsurance Results
|
(5.0)
|
(7.6)
|
(7.6)
|
0.6%
|
52.8%
|
(13.3)
|
(20.9)
|
57.6%
|
|
Insurance Undewrwriting Result
|
9.2
|
11.8
|
15.0
|
27.6%
|
62.3%
|
26.8
|
37.9
|
41.1%
|
In the QoQ analysis, the Insurance Underwriting Result rose 11.6%. This evolution reflected an -8.2% reduction in service expenses, which was driven primarily by Life
and P & C, and a more favorable Reinsurance result (-11.7%). This was partially attenuated by a reduction in income for insurance services, which was reported in both P&C and Life.
In the YoY analysis, the Insurance Underwriting Result increased by 8.9% due to an uptick in income for insurance services in Crediseguros, Life and P & C. This evolution was
partially attenuated by higher expenses for insurance services in P & C.
YTD, the Underwriting Insurance Result rose 31.1%. This improvement is mainly attributable to an increase in income from insurance services (+10.3%) which was primarily driven by Life
and Crediseguros- and was partially offset by an increase in expenses for insurance services (+3.9%), which was fueled mainly by P & C.
P & C
| Income for Insurance Services |
|
Expenses for Insurance Services |

|
|
 |
|
|
|
QoQ, the Insurance Underwriting Result rose 0.7%, driven by the following dynamics:
| |
•
|
Insurance income fell 5.2%, which was primarily attributable to a reduction in the premium level in P & C.
|
| |
•
|
Insurance service expenses fell 6.6% due to a drop in claims in P & C.
|
| |
•
|
The reinsurance result dropped 7.1%, driven by a reduction in ceded premiums.
|
| |
|
|
|
|
| |
Earnings Release 3Q / 2023 |
Analysis of 3Q23 Consolidated Results |
| |
|
|
|
| 07. Insurance Underwriting Results |
YoY, the Insurance Underwriting Result rose 6.1% due to the following dynamics:
| |
•
|
Income from insurance services rose 1.8% YoY, fueled mainly by growth in premiums in P & C, Cars and Medical Assistance.
|
| |
•
|
Expenses for life insurance services increased 6.2% YoY, which was primarily driven by (i) Cars, due to an increase in claims frequency; and (ii) P & C, where the credit card protection
line was impacted by an uptick in unrecognized internet purchases.
|
| |
•
|
The reinsurance result dropped 16.4% in P & C after more reinsurance claims related to Cyclone Yaku were recovered.
|
YTD, the Insurance Underwriting Result fell 6.0%. This evolution was mainly driven by lower results for Personal Accidents and Cars.
Life Insurance
| Income for Insurance Services |
|
Expenses for Insurance Services |
 |
|

|
QoQ, the Insurance Underwriting result rose 15.1%. The following dynamics stood out:
| |
•
|
Income from insurance services dropped 0.9% due to (i) Individual Life, which reported a reduction in sales, (ii) Pensions, due to a decrease in the premium level in SISCO V. This was
partially offset by an uptick in income in Group Life.
|
| |
•
|
Expenses for insurance services fell 10.1%, which was driven primarily by Credit Life and Individual Life via releases of IBNR COVID.
|
| |
•
|
The loss recovered for the insurance result fell 27.9%, which reflects an uptick in recoveries on reinsurance claims and a drop in ceded premiums through Pensions.
|
YoY, the Insurance Underwriting Result rose 7.0%. The following dynamics were noteworthy:
| |
•
|
Income from insurance services rose 1.5%. This growth was driven primarily by Pensions and reflects positive movements in both prices and the size of the tranche awarded under SISCO VI in
comparison to the conditions obtained under SISCO V.
|
| |
•
|
Insurance expenses fell 4.4% YoY and 8.2% YTD, which was fueled mainly by the evolution in Pensions, Credit Life and Group Life, which reported a reduction in claims in comparison to periods
affected by COVID-19.
|
| |
•
|
The loss on reinsurance increased 23.1%.
|
YTD, the Insurance Underwriting Result increased by 50.3%, driven primarily by better results in Pensions and Credit Life.
| |
|
|
|
|
| |
Earnings Release 3Q / 2023 |
Analysis of 3Q23 Consolidated Results |
| |
|
|
|
| |
Operating expenses rose YTD, driven primarily by core businesses at BCP and disruptive initiatives at the Credicorp level. At
BCP, core businesses fueled growth in expenses through an uptick in IT expenses related to: (i) increased use of the Cloud as clients become more digital; (ii) investments to enhance digital capacities and improve
cybersecurity; and (iii) moves to attract more specialized Digital talent. Expenses for disruptive initiatives at the Credicorp level increased 64.3% as some of these initiatives have scaled up. If we exclude expenses for
disruption, YTD growth in Operating Expenses stands at 7.5%.
|
|
|
Operating expenses
|
Quarter
|
% change
|
As of
|
% change
|
|
S/ 000
|
3Q22
|
2Q23
|
3Q23
|
QoQ
|
YoY
|
Sep 22
|
Sep 23
|
Sep 23 / Sep 22
|
|
Salaries and employees benefits
|
984,336
|
1,054,735
|
1,061,402
|
0.6%
|
7.8%
|
2,866,013
|
3,145,695
|
9.8%
|
|
Administrative, general and tax expenses
|
869,873
|
871,046
|
1,007,894
|
15.7%
|
15.9%
|
2,385,038
|
2,714,000
|
13.8%
|
|
Depreciation and amortization
|
162,009
|
160,549
|
159,761
|
-0.5%
|
-1.4%
|
470,795
|
481,389
|
2.3%
|
|
Association in participation
|
9,999
|
16,742
|
14,634
|
-12.6%
|
46.4%
|
28,019
|
43,988
|
57.0%
|
|
Operating expenses
|
2,026,217
|
2,103,072
|
2,243,691
|
6.7%
|
10.7%
|
5,749,865
|
6,385,072
|
11.0%
|
To analyze expenses, we will focus on YTD movements to eliminate the impact of seasonality between quarters.
Operating expenses remain high due to:
|
•
|
Growth in Administrative and general expenses and taxes, which was driven mainly by BCP via an uptick in IT expenses associated with the transformation strategy; disruption expenses; and
advertising and marketing.
|
|
•
|
An increase in Employee salaries and benefits, which was driven primarily by an increase in the head count in core businesses and growth in the number of hires and the salary level of IT
specialists, both at BCP.
|
The uptick in operating expenses YTD stood at 11.0% If we exclude disruptive expenses, operating expenses indicate growth of 7.5% YTD.
Administrative and general expenses
|
Administrative general, and tax expenses
|
Quarter
|
% change
|
As of
|
% change
|
|
S/000
|
3Q22
|
2Q23
|
3Q23
|
QoQ
|
YoY
|
Sep 22
|
Sep 23
|
Sep 23 / Sep 22
|
|
IT expenses and IT third-party services
|
240,603
|
256,348
|
271,304
|
5.8%
|
12.8%
|
645,517
|
768,584
|
19.1%
|
|
Advertising and customer loyalty programs
|
173,517
|
174,021
|
171,902
|
-1.2%
|
-0.9%
|
439,880
|
481,690
|
9.5%
|
|
Taxes and contributions
|
45,461
|
20,557
|
65,606
|
219.1%
|
44.3%
|
186,100
|
171,236
|
-8.0%
|
|
Audit Services, Consulting and professional fees
|
73,297
|
67,017
|
112,480
|
67.8%
|
53.5%
|
194,229
|
231,375
|
19.1%
|
|
Transport and communications
|
73,494
|
57,437
|
57,518
|
0.1%
|
-21.7%
|
161,510
|
165,991
|
2.8%
|
|
Repair and maintenance
|
30,940
|
37,555
|
44,084
|
17.4%
|
42.5%
|
100,026
|
107,429
|
7.4%
|
|
Agents’ Fees
|
25,574
|
27,747
|
29,310
|
5.6%
|
14.6%
|
78,683
|
83,209
|
5.8%
|
|
Services by third-party
|
36,327
|
27,661
|
45,426
|
64.2%
|
25.0%
|
77,873
|
100,598
|
29.2%
|
|
Leases of low value and short-term
|
24,171
|
25,282
|
27,754
|
9.8%
|
14.8%
|
67,712
|
78,152
|
15.4%
|
|
Miscellaneous supplies
|
25,266
|
27,837
|
27,091
|
-2.7%
|
7.2%
|
64,999
|
87,921
|
35.3%
|
|
Security and protection
|
16,841
|
16,004
|
16,064
|
0.4%
|
-4.6%
|
48,115
|
47,857
|
-0.5%
|
|
Subscriptions and quotes
|
13,703
|
16,024
|
14,391
|
-10.2%
|
5.0%
|
41,592
|
43,501
|
4.6%
|
|
Electricity and water
|
11,742
|
14,954
|
13,592
|
-9.1%
|
15.8%
|
35,718
|
40,043
|
12.1%
|
|
Electronic processing
|
7,770
|
9,791
|
9,959
|
1.7%
|
28.2%
|
23,671
|
28,480
|
20.3%
|
|
Insurance
|
39,524
|
5,022
|
38,034
|
657.3%
|
-3.8%
|
54,365
|
51,806
|
-4.7%
|
|
Cleaning
|
5,358
|
5,463
|
5,930
|
8.5%
|
10.7%
|
15,067
|
16,555
|
9.9%
|
|
Others (1)
|
26,285
|
82,326
|
57,449
|
-30.2%
|
118.6%
|
149,981
|
209,573
|
39.7%
|
|
Total
|
869,873
|
871,046
|
1,007,894
|
15.7%
|
15.9%
|
2,385,038
|
2,714,000
|
13.8%
|
Administrative and general expenses reported growth of 13.8% YTD at the end of September 2023. This uptick was driven primarily by core businesses and disruptive initiatives, mainly via expenses in the IT
and marketing lines.
| |
|
|
|
|
| |
Earnings Release 3Q / 2023 |
Analysis of 3Q23 Consolidated Results |
| |
|
|
|
Operating expenses for Core and Disruption (1)
|
Operating Expenses
S/ (000)
|
Quarter
|
% change
|
As of
|
% change
|
|
3Q22
|
2Q23
|
3Q23
|
QoQ
|
YoY
|
Sep 22
|
Sep 23
|
Sep 23 / Sep 22
|
|
Core Business BCP
|
1,172,951
|
1,195,522
|
1,245,767
|
4.2%
|
6.2%
|
3,337,154
|
3,591,792
|
7.6%
|
|
Core Business Mibanco
|
287,215
|
300,220
|
302,729
|
0.8%
|
5.4%
|
854,115
|
900,728
|
5.5%
|
|
Core Business Pacifico
|
59,968
|
72,708
|
79,355
|
9.1%
|
32.3%
|
180,682
|
216,331
|
19.7%
|
|
Disruption (3)
|
142,322
|
186,994
|
222,207
|
18.8%
|
56.1%
|
361,813
|
594,396
|
64.3%
|
|
Others (2)
|
363,760
|
347,627
|
393,633
|
13.2%
|
8.2%
|
1,016,100
|
1,081,825
|
6.5%
|
|
Total
|
2,026,217
|
2,103,072
|
2,243,691
|
6.7%
|
10.7%
|
5,749,864
|
6,385,072
|
11.0%
|
|
(2)
|
Includes disruptive initiatives at the subsidiaries and Krealo.
|
|
(3)
|
Includes Credicorp Capital, ASB, Prima, BCP Bolivia, Mibanco Colombia, and other entities within the Group.
|
The 11.0% increase in operating expenses at Credicorp can be broken down as follows: 40.1% are attributable to BCP core and 34.0% to our disruptive initiatives.
BCP reported a 7.6% increase in expenses YTD, which can be broken down into two categories: technology expenses and Core business expenses excluding technology.
| |
•
|
Technology Expenses (IT)
|
| |
•
|
In line with the upward trend in volumes of monetary and non-monetary transactions among increasingly digitalized clients, expenses for the use of cloud servers have grown.
|
| |
•
|
Additionally, the bank has made significant investments in new capabilities.
|
| |
•
|
More digital experts have been hired and their average salaries have also risen.
|
| |
•
|
Core business expenses excluding IT
|
| |
•
|
Expenses for marketing and advertising rose to attract more deposits and drive sales of digital products.
|
| |
•
|
More specialized personnel were hired for strategic projects.
|
Growth in disruptive expenses stood at 59.8% YTD and represented 9.1% of total expenses as of the end of September 2023. These expenses were associated with
investment in talent to develop functionalities for initiatives such as Yape, IO, Culqui, Tenpo to strengthen our competitive moats in the long-term.
| |
|
|
|
|
| |
Earnings Release 3Q / 2023 |
Analysis of 3Q23 Consolidated Results |
| |
|
|
|
| |
The efficiency ratio improved 160 bps YTD. This evolution was driven by an uptick in core income, which
was fueled by growth in net interest income at BCP, via all of Retail Banking’s segments and loan growth at Mibanco. If we exclude disruptive expenses, the efficiency ratio stands at 40.9%.
|
|
|
Operating efficiency
|
Quarter
|
% change
|
As of
|
% change
|
|
S/000
|
|
|
3Q22
|
2Q23
|
3Q23
|
QoQ
|
YoY
|
Sep 22
|
Sep 23
|
Sep 23 / Sep 22
|
|
Operating expenses (1)
|
2,026,217
|
2,103,072
|
2,243,691
|
6.7%
|
10.7%
|
5,749,865
|
6,385,072
|
11.0%
|
|
Operating income (2)
|
4,456,209
|
4,715,570
|
4,844,683
|
2.7%
|
8.7%
|
12,299,984
|
14,162,584
|
15.1%
|
|
Efficiency ratio (3)
|
45.5%
|
44.6%
|
46.3%
|
170 pbs
|
80 bps
|
46.7%
|
45.1%
|
-160 pbs
|
Operating income has been re-expressed with regard to previous reports to reflect the application of IFRS 17. This standard applies solely to the Insurance Business. For more details,
review annex 12.1.8.
(1) Operating expenses = Salaries and employees benefits + Administrative expenses + Depreciation and amortization + Association in participation + Acquisition cost.
(2) Operating income = Net interest, similar income, and expenses + Fee income + Net gain on
foreign exchange transactions + Net gain from associates + Net gain on derivatives held for trading + Net gain from exchange differences + Net Insurance Underwriting Results.
(3) Operating expenses / Operating income (under IFRS 17).
Efficiency ratio reported by subsidiary
|
Efficiency Ratio
|
Quarter
|
% change
|
As of
|
% change
|
|
3Q22
|
2Q23
|
3Q23
|
QoQ
|
YoY
|
Sep 22
|
Sep 23
|
Sep 23 / Sep 22
|
|
BCP
|
38.8%
|
37.3%
|
39.2%
|
190 pbs
|
40 pbs
|
40.3%
|
37.8%
|
-250 pbs
|
|
BCP Bolivia
|
61.3%
|
60.7%
|
65.3%
|
460 pbs
|
400 pbs
|
59.7%
|
62.1%
|
240 pbs
|
|
Mibanco Perú
|
49.6%
|
52.4%
|
51.4%
|
-100 pbs
|
180 pbs
|
50.9%
|
52.6%
|
170 pbs
|
|
Mibanco Colombia
|
80.3%
|
88.8%
|
86.0%
|
-280 pbs
|
570 pbs
|
78.3%
|
89.1%
|
1080 pbs
|
|
Pacífico
|
24.2%
|
26.3%
|
24.7%
|
-160 pbs
|
50 pbs
|
29.4%
|
24.2%
|
-520 pbs
|
|
Prima AFP
|
50.2%
|
49.8%
|
51.6%
|
180 pbs
|
140 pbs
|
52.4%
|
50.3%
|
-210 pbs
|
|
Credicorp
|
45.5%
|
44.6%
|
46.3%
|
170 pbs
|
80 pbs
|
46.7%
|
45.1%
|
-160 pbs
|
Our analysis will focus on YTD movements to eliminate seasonality between quarters.
The efficiency ratio improved, which was driven primarily by growth in core income at BCP via an increase in the structural loan volume and secondarily by an uptick in the Insurance Underwriting Result at
Pacifico.
If we exclude expenses related to disruptive initiatives at the Credicorp level, the YTD efficiency ratio at the end of September 2023 stands at 40.9%.
| |
|
|
|
|
| |
Earnings Release 3Q / 2023 |
Analysis of 3Q23 Consolidated Results |
| |
|
|
|
|
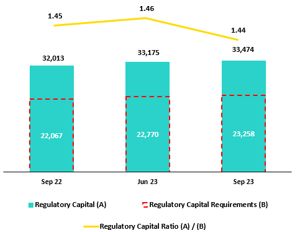
Regulatory Capital at Credicorp was 1.44 times than the minimum requirement for Regulatory Capital.
The IFRS CET1 ratio at BCP Stand-alone increased 121 bps YoY to stand at 13.0%, which reflected the uptick
reported in the YTD and Year-end Results (+21.9%) as well as a reduction in Unrealized Losses (-70.6%).
The IRFS CET1 Ratio at Mibanco rose 157 bps YoY to stand at 17.56%. A drop in RWAs (-1.6%) and
an increase in YTD and Year- end results (+133.8%) drove this dynamic.
|
|
Credicorp’s Regulatory Capital level stood at 1.44 at the end of 3Q23. In the QoQ analysis, the ratio dropped 2 bps. This evolution was
driven by an increase in the regulatory capital requirement, which was partially offset by an uptick the Subordinated Debt balance. Both lines were affected by a higher exchange rate.
In the YoY analysis, the Regulatory Capital Ratio dropped 1bps due to an increase in the regulatory capital volume for portfolios at BCP Stand-alone and
Mibanco. This growth was partially offset by an uptick in Discretinary and Restricted Reserves.
|
|
Figures in millions S/.
|
Analysis of Capital at the Subsidiaries
Under the current local regulation, which has been in effect since January 2023, three regulatory ratios exist: Common Equity Tier 1 (CET 1), Tier 1 Capital and Global Capital. For all
effective purposes, Tier 1 Capital is equal to CET 1 Ratio in Credicorp’s case given that we possess no subordinated Tier 1 debt. Additionally, as has been our practice over the last few years, we use the IFRS CET 1 ratio, which differs
slightly from CET 1 ratio (calculated under local accounting) primarily in the lines of Provisions and Unrealized Loss accounts. Accordingly, our analysis focuses solely on IFRS CET 1.
10.2 Analysis of Capital at BCP Stand-alone
 |
|
At the end of 3Q23, BCP IFRS CET 1 ratio reported growth of 25 bps QoQ to stand at 13.04% at the end of 3Q23. This evolution was driven by an uptick in YTD and
Year-end Results and was partially offset by growth in balance for Unrealized Losses. RWA levels increased 2.7%, fueled by growth in BCP’s loan portfolio. YoY, BCP IFRS CET 1 ratio increased 121 bps, driven by (i) higher YTD and
Year-end results and (ii) a drop in balance for Unrealized Losses.
Finally, under the parameters of current regulation, the Global Capital Ratio at BCP Stand-alone stood at 17.51% (+31 bps QoQ). The uptick in this ratio was due primarily to (i) an uptick in YTD and Year-end Results and (ii) an
increase in the balance for Subordinated Debt, which was fueled by a higher exchange rate. This was partially offset by growth in Credit Risk-Weighted Assets, which was driven by loan growth at BCP and by a higher exchange rate. |
| |
|
|
|
|
| |
Earnings Release 3Q / 2023 |
Analysis of 3Q23 Consolidated Results |
| |
|
|
|
10.3 Analysis of Capital at Mibanco

|
|
At the end of 3Q23, Mibanco IFRS CET 1 ratio rose 96 bps to stand at 17.56%. This rise was primarily driven by a drop in RWAs associated with credit risk and operating risk. Growth in
YTD and Year-end results also contributed to the uptick in IFRS CET 1. This was partially offset by an uptick in balance for Unrealized Losses. YoY, this ratio rose 157 bps to stand at 19.75%, due to a drop in the RWA level;
growth in YTD and Year-end Results; and a reduction in Unrealized Losses.
Under the new regulation, the Global Capital Ratio at Mibanco stood at 19.75% (+97 bps QoQ). This variation was driven by the same dynamics
as those that drove the evolution of the CET 1 Ratio.
|
| |
|
|
|
|
| |
Earnings Release 3Q / 2023 |
Analysis of 3Q23 Consolidated Results |
| |
|
|
|
|
In 3Q23, the Peruvian economy is expected to have
contracted around 0.9% YoY (-0.5% YoY in 2Q23), accumulating its third consecutive quarter of YoY decline. Non-primary sectors fell 1.6%, due to lower domestic demand, where the fall in the construction (-9.0% YoY), non-primary
manufacturing (-8.5% YoY) and services sectors (-0.4% YoY) stands out. While primary sectors grew 3.0% due to the favorable performance of the mining sector (+11.1% YoY). This offset the decline in the agricultural (-3.1% YoY),
fishing (-28.9% YoY) and primary manufacturing (-2.3% YoY) sectors due to the El Niño Costero, which reached a strong intensity this quarter.
The annual inflation rate continued to decelerate, closing the quarter at
5.0% YoY (6.5% YoY in 2Q23). Real GDP, in turn, is expected to register no or slightly negative growth this year.
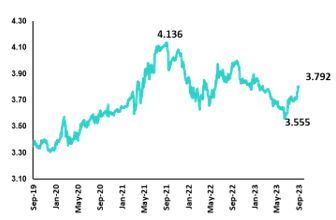
According to BCRP, the exchange rate closed at USDPEN 3.792 in 3Q23, which
represents an appreciation of 4.6% compared to the print at the end of 2Q23 and 4.8% compared to the figure registered one year ago.
|
Peru: Economic Forecast
|
Peru
|
2018
|
2019
|
2020
|
2021
|
2022
|
2023 (3)
|
|
GDP (US$ Millions)
|
226,919
|
232,519
|
205,755
|
225,803
|
244,789
|
267,500
|
|
Real GDP (% change)
|
4.0
|
2.2
|
-11.0
|
13.3
|
2.7
|
0.0
|
|
GDP per capita (US$)
|
7,190
|
7,237
|
6,306
|
6,835
|
7,330
|
7,894
|
|
Domestic demand (% change)
|
4.1
|
2.2
|
-9.8
|
14.5
|
2.3
|
-2.0
|
|
Gross fixed investment (as % GDP)
|
22.2
|
22.5
|
21.0
|
25.1
|
25.3
|
23.9
|
|
Financial system loan without Reactiva (% change) (1)
|
10.3
|
6.4
|
-4.3
|
12.6
|
9.7
|
2.6
|
|
Inflation, end of period(2)
|
2.2
|
1.9
|
2.0
|
6.4
|
8.5
|
4.0
|
|
Reference Rate, end of period
|
2.75
|
2.25
|
0.25
|
2.50
|
7.50
|
6.75
|
|
Exchange rate, end of period
|
3.37
|
3.31
|
3.62
|
3.99
|
3.81
|
3.80
|
|
Exchange rate, (% change)
|
4.0%
|
-1.8%
|
9.3%
|
10.3%
|
-4.5%
|
-0.3%
|
|
Fiscal balance (% GDP)
|
(2.3)
|
(1.6)
|
(8.9)
|
(2.5)
|
(1.7)
|
(3.0)
|
|
Public Debt (as % GDP)
|
25.6
|
26.6
|
34.6
|
35.9
|
33.8
|
34.0
|
|
Trade balance (US$ Millions)
|
7,201
|
6,879
|
8,102
|
14,977
|
10,333
|
15,400
|
|
(As % GDP)
|
3.2%
|
3.0%
|
3.9%
|
6.6%
|
4.2%
|
5.8%
|
|
Exports
|
49,066
|
47,980
|
42,826
|
62,967
|
66,235
|
65,000
|
|
Imports
|
41,866
|
41,101
|
34,724
|
47,990
|
55,902
|
49,600
|
|
Current account balance (As % GDP)
|
-1.2%
|
-0.6%
|
1.1%
|
-2.2%
|
-4.0%
|
-1.0%
|
|
Net international reserves (US$ Millions)
|
60,121
|
68,316
|
74,707
|
78,495
|
71,883
|
74,000
|
|
(As % GDP)
|
26.5%
|
29.4%
|
36.3%
|
34.8%
|
29.4%
|
27.7%
|
|
(As months of imports)
|
17
|
20
|
26
|
20
|
15
|
18
|
Sources: INEI, BCRP y SBS.
(1) Financial System, Current Exchange Rate
(2) Inflation target: 1% - 3%
(3) Grey area indicate estimates by BCP Economic Research as of october 2023
| |
|
|
|
|
| |
Earnings Release 3Q / 2023 |
Analysis of 3Q23 Consolidated Results |
| |
|
|
|
Main Macroeconomic Variables
Gross Domestic Product
(Annual Real Variations, % YoY)
Source: BCRP
Estimate: BCP
In 3Q23, Peruvian economy is expected to have contracted 0.9% YoY, its third consecutive quarterly decline. The economic activity gauge fell 1.3% YoY in July and 0.6%
YoY in August.
In the first eight months of the year, GDP fell 0.6% YoY. The primary sectors grew 3.0% YoY due to the favorable performance of the mining sector (11.1% YoY), which has offset the decline
in the agricultural (-3.1% YoY), fishing (-28.9% YoY) and primary manufacturing (-2.3% YoY) sectors. Regarding the non-primary sectors, the 1.6% YoY contraction is attributable to weak domestic demand, where the negative prints for the
construction sector (-9.0% YoY), non-primary manufacturing (-8.5% YoY) and services (-0.4% YoY) stand out.
According to the multisectoral committee in charge of the study of the El Niño phenomenon in Perú (ENFEN for its acronym in Spanish), the “El Niño Costero”, which has been developing since
March, reached a “Strong” intensity in 3Q23 and considerably affected the fishing, agricultural and primary manufacturing sectors as well as textile production for the domestic market. YTD, these sectors have reported their worst
accumulated performance in more than two decades. The expectation that “El Niño Costero” will continue until 1Q24 more than likely led agents to exercise greater caution with regard to private consumption and investment decisions, which
were already affected by an environment of on-going food inflation; political uncertainty; and a slow normalization process after the post-pandemic rebound.
Annual Inflation and Central Bank Reference Rate
(%)
-
Source: BCRP and INEI
| |
|
|
|
|
| |
Earnings Release 3Q / 2023 |
Analysis of 3Q23 Consolidated Results |
| |
|
|
|
Inflation measured using the Consumer Price index of Metropolitan Lima closed 3Q23 at 5.0% YoY, its lowest level since August 2021, after remaining above or close to
8.0% YoY between April 2022 and May 2023 (peak of 8.8% YoY in June 2022, highest in 26 years). In September 2023, monthly inflation rose 0.02%, the second lowest print of the year (June 2023: -0.15%); this evolution was mainly
attributable to a drop in inflation for food and beverages. In the same period, core inflation (excluding food and energy) slowed to 3.6% YoY, an 18-month low.
After having maintained the rate at an all-time high of 7.75% since January, the Central Reserve Bank of Peru (BCRP) cut its monetary policy rate 25 basis points to 7.50% in September
2023. In October, the rate was cut to 7.25%.
Fiscal Balance and Current Account Balance
(% of GDP, Quarter)

|
|
The annualized fiscal deficit in the last 12 months to September 2023 rose to 2.8% of GDP. In 3Q23 tax revenues fell 10.5% YoY (revenues from income tax and
sales tax fell 7.0% and 10.6%, respectively) while non-financial spending dropped 3.0% over the same period, dragged down by a 12.6% contraction in capital spending, which was driven primarily by local governments (current
spending: +0.4% YoY).
In 3Q23, there were no changes to Peru’s sovereign debt credit rating (Moody’s: Baa1, Fitch and Standard & Poor´s: BBB, all of them
with negative outlook).
Regarding external accounts, the current account deficit fell from 2.9% of GDP in 1Q23 to 1.9% of GDP in 2Q23 (in cumulative terms for the last 4 quarters).
|
The 12-month accumulated trade balance surplus to August 2023 rose to USD 14.6 billion, which although higher than the USD 13.0 billion registered in June, was still
far from the record high of USD 16.1 billion reached in March 2022. In the same period, exports fell 4.1% YoY to USD 65.3 billion, driven by a drop in prices but partially offset by higher volumes. Imports fell 7.2% YoY to USD 50.7
billion due to weak domestic demand.
Terms of trade grew 5.2% YoY in August 2023, which reflected the fact that the reduction registered for import prices (-8.3% YoY) outpaced the drop registered in export
prices, which fell 3.5% YoY (due to lower prices for copper, zinc and hydrocarbons). In August, terms of trade rose 2.6% compared to the end of 2022.
Exchange Rate
(PEN per USD)
 |
|
According to BCRP, the exchange rate closed 3Q23 at USDPEN 3.79,
depreciation of 4.6% compared to the end of 2Q23 and an appreciation of 4.8% compared to a year ago. In July, the exchange rate appreciated to USDPEN 3.56, the lowest level since September 2020. Towards the end of 3Q23, with
the exchange rate around USDPEN 3.80, the BCRP intervened, for the second time in the year, in the spot market selling USD 13 million.
In the same period, Latam main currencies also depreciated compared to the previous quarter due to the strengthening of the global dollar. The Chilean peso weakened 11.3%, the Brazilian real 5.1% and the Mexican peso
1.7%. On the other hand, the Colombian peso, slightly appreciated 2.3%.
Net international reserves closed 3Q23 at USD 71.2 billion, below
|
2Q23’s level (USD 72.9 billion).
| |
|
|
|
|
| |
Earnings Release 3Q / 2023 |
Analysis of 3Q23 Consolidated Results |
| |
|
|
|
|
Safe Harbor for Forward-Looking Statements
|
This material includes “forward-looking statements” within the meaning of Section 27A of the U.S. Securities Act of 1933 and Section 21E of the U.S. Securities Exchange Act
of 1934. All statements other than statements of historical fact are forward-looking and may contain information about financial results, economic conditions, trends and known uncertainties. Forward-looking statements are not assurances
of future performance. Instead, they are based only on our management’s current views, beliefs, expectations and assumptions regarding the future of our business, future plans and strategies, projections, anticipated events and trends,
the economy and other future conditions.
Many forward-looking statements can be identified by words such as: “anticipate”, “intend”, “plan”, “goal”, “seek”, “believe”, “project”, “estimate”, “expect”, “strategy”, “future”,
“likely”, “would”, “may”, “should”, “will”, “see” and similar references to future periods. Examples of forward-looking statements include, among others, statements or estimates we make regarding guidance relating to losses in our credit
portfolio, efficiency ratio, provisions and non-performing loans, current or future market risk and future market conditions, expected macroeconomic events and conditions, our belief that we have sufficient capital and liquidity to fund
our business operations, expectations of the effect on our financial condition of claims, legal actions, environmental costs, contingent liabilities and governmental and regulatory investigations and proceedings, strategy for customer
retention, growth, governmental programs and regulatory initiatives, credit administration, product development, market position, financial results and reserves and strategy for risk management.
We caution readers that forward-looking statements involve known and unknown risks and uncertainties that could cause actual results, performance, or events to differ
materially from those that we expect or that are expressed or implied in the forward-looking statements, depending on the outcome of certain factors, including, without limitation, adverse changes in:
|
•
|
The occurrence of natural disasters or political or social instability in Peru;
|
|
•
|
The adequacy of the dividends that our subsidiaries are able to pay to us, which may affect our ability to pay dividends to shareholders and corporate expenses;
|
|
•
|
Performance of, and volatility in, financial markets, including Latin-American and other markets;
|
|
•
|
The frequency, severity and types of insured loss events;
|
|
•
|
Fluctuations in interest rate levels;
|
|
•
|
Foreign currency exchange rates, including the Sol/US Dollar exchange rate;
|
|
•
|
Deterioration in the quality of our loan portfolio;
|
|
•
|
Increasing levels of competition in Peru and other markets in which we operate;
|
|
•
|
Developments and changes in laws and regulations affecting the financial sector and adoption of new international guidelines;
|
|
•
|
Changes in the policies of central banks and/or foreign governments;
|
|
•
|
Effectiveness of our risk management policies and of our operational and security systems;
|
|
•
|
Losses associated with counterparty exposures;
|
|
•
|
The scope of the coronavirus (“COVID-19”) outbreak, actions taken to contain the COVID-19 and related economic effects from such actions and our ability to maintain adequate staffing; and
|
|
•
|
Changes in Bermuda laws and regulations applicable to so-called non-resident entities.
|
See “Item 3. Key Information—3. D Risk Factors” and “Item 5. Operating and Financial Review and Prospects” in our most recent Annual Report on Form 20-F filed with the
U.S. Securities and Exchange Commission for additional information and other such factors. You are cautioned not to place undue reliance on these forward-looking statements, which speak only as of the date hereof and are based only on
information currently available to us. Therefore, you should not rely on any of these forward-looking statements.
We undertake no obligation to publicly update or revise these or any other forward-looking statements that may be made to reflect events or circumstances after the date hereof, whether as a
result of changes in our business strategy or new information, to reflect the occurrence of unanticipated events or otherwise.
| |
|
|
|
|
| |
Earnings Release 3Q / 2023 |
Analysis of 3Q23 Consolidated Results |
| |
|
|
|
| 12.1. Implementation of IFRS 17 – Restatement of figures and ratios for 2022 |
46
|
| 12.1.1. Introduction to the new standards IFRS 17 |
46
|
| 12.1.2. Conceptual Framework |
46 |
| 12.1.3. Recognition of Profit and Loss |
46
|
| 12.1.4. Valuation Methods |
46
|
| 12.1.5. Impact on Equity Under IFRS 17 |
47
|
| 12.1.6. Reformulation of Profit and Loss Statement at Pacífico Grupo Asegurador for year 2022 |
47
|
| 12.1.7. Reformulation of Credicorp’s Profit and Loss Statement for year 2022 |
48
|
| 12.1.8. Changes in the Methodology to Calculate Financial Indicators and their Reformulation for the year 2022 |
48
|
| 12.1.9. Glossary of Terms Under IFRS 17 |
51
|
| 12.2. Physical Point of contact |
51
|
| 12.3. Loan Portfolio Quality |
51
|
| 12.4 Net Interest Income (NII) |
56
|
| 12.5. Regulatory Capital |
57
|
| 12.6. Financial Statements and Ratios by Business |
61
|
| 12.6.1. Credicorp Consolidated |
61
|
| 12.6.2. Credicorp Stand-alone |
63
|
| 12.6.4. BCP Stand-alone |
64
|
| 12.6.5. BCP Bolivia |
66
|
| 12.6.6. Mibanco |
67
|
| 12.6.7. Prima AFP |
68
|
| 12.6.8. Grupo Pacifico |
69
|
| 12.7. Table of calculations |
72
|
| 12.8. Glossary of terms |
73
|
| |
|
|
|
|
| |
Earnings Release 3Q / 2023 |
Analysis of 3Q23 Consolidated Results |
| |
|
|
|
|
12.1.
|
Implementation of IFRS 17 – Restatement of figures and ratios for 2022
|
|
12.1.1.
|
Introduction to the new standards IFRS 17
|
IFRS 17 was published in May 2017 as a replacement to IFRS 4 “Insurance Contracts.” The aim of this change is to ensure that consistent measurement criteria are applied to improve
transparency and the comparability of Financial Statements. The new standard became effective in January 2023.
The primary objectives of this standard include:
| |
(i)
|
Improving comparability between insurers at the global level. IFRS 4 allowed entities to use a wide variety of accounting practices with regard to insurance contracts.
|
| |
(ii)
|
Adequately reflecting the economic value of insurance contracts. Some previous accounting practices allowed under IFRS failed to adequately reflect real underlying financial situations or the
financial yields on insurance contracts.
|
| |
(iii)
|
Providing more useful information to users of financial statements.
|
|
12.1.2.
|
Conceptual Framework
|
Insurance contracts combine attributes of risk coverage, provision of services and instruments of investments and by nature, generate cash flows (outflows such as claims payments,
redemptios, expirations, pensions, attributable expenses, income such as premiums) during their term.
The difference between expected outflows and inflows (fulfillment cashflows), combined with recognition of cash value over time, constitute the best estimate of the
company’s obligations. Due to potential underwriting deviations relative to expected flows, an additional reserve, known as Risk Adjustment (RA) must be set aside and the underwriting income that
the company expects to obtain from its current product portfolio constitutes the Contractual Service Margin (CSM). These 3 concepts, combined with the claims reserves (including reserves for
pending claims, IBNR reserves and liquidation expenses) constitute the company’s liabilities.
|
12.1.3.
|
Recognition of Profit and Loss
|
The P & L under IFRS shows the difference between a company’s expected cash flows (valued in liabilities) and real flows that occur. Anticipated flows must be based on realistic
parameters that reflect the company’s actual experience and current market interest rates.
The standard also requires that results be separated into 3 blocks: (i) Insurance service (or direct insurance), (ii) Reinsurance and (iii)
Financial Results. This structure allows users to visualize the company’s sources of income.
Unlike IFRS4, which recognized profit and losses on products during their term, IFRS17 stipulates that expected losses must be recognized at a single moment, meaning upon
issuance of policies, while recognition of underwriting income (CSM) must be made gradually over the effective period of products.
The company chose the Other Comprehensive Income (OCI) option, which recognizes movements of reserves generated by underwriting issues within the Profit and Loss
Statement (changes in mortality, expenses, redemptions, etc.) while within Equity, only variations in liabilities generated by changes in interest rates are recognized. This variation produces an offset to that generated by investments
that back reserves and lends stability to the Balance Sheet and the Profit and Loss Statement.
|
12.1.4.
|
Valuation Methods
|
IFRS 17 introduces different approaches to valuate underwriting provisions based on the product’s characteristics (contract duration, cash flow).
| |
•
|
General Method (GM) or Building Block Approach (BBA): general default model valuation of insurance contracts.
|
| |
•
|
Variable Fee Approach (VFA): model for contract valuation in which cash flows depend on the value of the underlying assets that back said contracts
|
| |
•
|
Premium Allocation Approach (PAA): simplification of the general model.
|
| |
|
|
|
|
| |
Earnings Release 3Q / 2023 |
Analysis of 3Q23 Consolidated Results |
| |
|
|
|
|
12.1.5.
|
Impact on Equity Under IFRS 17
|
The impact of the implementation of the IFRS 17 standard on the net equity balance of Pacífico Seguros is not material, registering at the end of December 2022 a net equity under IFRS 17 which is S/ 10 million
greater than the net equity calculated under IFRS 4.
It should be mentioned that as of the end of December 2021 (date of the “first application” of the standard), the net equity of Pacífico Seguros under IFRS 17 was S/ 211 million less than
the net equity registered under IFRS 4. This initial gap narrowed during 2022 as a result of a contraction in the value of liabilities under IFRS 17, associated with the interest rates increases.
|
12.1.6.
|
Reformulation of Profit and Loss Statement at Pacífico Grupo Asegurador for year 2022
|
| I. |
A new sub-account, “Financial Expenses associated with insurance and reinsurance activities, net” is included in the account for Interest Expenses at Pacifico Seguros. This concept corresponds to
interest accredited to reserves. This interest is attributable to an update of the present value of said reserves to the date of the close of the period. This concept was previously presented as part of reserves adjustment
included in the underwriting result under IFRS4. IFRS17 separates the financial component from the underwriting component.
|
| II. |
An impact is registered in the “Gain on exchange rate difference” line because the structure of the assets and liabilities related to insurance activities has been modified. The monetary position of
these assets and liabilities changes due to the way that assets and liabilities are recognized under IFRS17.
|
| III. |
Some concepts of income that were previously registered (under IFRS 4) as “Non-Operating Income” are now (under IFRS 17) reclassified and included in the cash flows associated with insurance contracts.
As such, these concepts are now part of the Insurance Underwriting Result.
|
| IV. |
Recognition of insurance underwriting income is completely different under IFRS 17. IFRS 17 recognizes that insurance contracts combine financial and service characteristics, and in many cases generate
variable cash flows in the long-term. To adequately reflect these characteristics, IFRS combines measurements of future cash flows with recognition of the results of the insurance contract throughout the period in which the
service is provided. IFRS 17 requires present value measurements of insurance obligations where estimates are recalculated in each reporting period. Contracts are measured using the components of: (i) Fulfilment Cash Flows, (ii)
An explicit adjustment for risk or uncertainty of flows, or “Risk Adjustment” and (iii) a Contractual Service Margin, which represents unaccrued underwriting income associated with the contract. This Contractual Service Margin is
recognized as income during the coverage term. Insurance contracts combine
|
| |
|
|
|
|
| |
Earnings Release 3Q / 2023 |
Analysis of 3Q23 Consolidated Results |
| |
|
|
|
financial and service characteristics, whereas IFRS combines future cash flows with registry of the results of the insurance
contract during the service provision period.
| V. |
One of the changes generated by the application of IFRS 17 is that it sets forth a new concept for costs that are directly associated with obtaining and fulfilling insurance contracts. Said costs are
denominated “Attributable Costs” and are included in the expected flows for the disbursements associated with these contracts. Under IFRS 4, some of these expenses were included in Total Expenses.
|
| VI. |
The aggregate impact of implementing IFRS 17 in the Net Earnings of Pacifico Grupo Asegurador is not material and stands at S/15 million for the year 2022.
|
| 12.1.7. |
Reformulation of Credicorp’s Profit and Loss Statement for year 2022
|
Below, we reformulate Credicorp’s Profit and Loss Statement. As is evident in the image below, the impact of implementing IFRS at Pacífico Grupo Asegurador translates to Credicorp account
by account in identical or highly similar amounts. The aggregate impact of implementing IFRS 17 on the Net Earnings of Credicorp is not material and amounts to S/15 million.
| 12.1.8. |
Changes in the Methodology to Calculate Financial Indicators and their Reformulation for the year 2022
|
The Net Interest Margin is reformulated in the following way:
Under IFRS 4, the numerator of the Net Interest Margin was comprised of the difference between Interest Income and Interest Expenses. Under IFRS 17, we need to adjust the formula because
Interest Expenses now include the concept “Financial Expense associated with the insurance and reinsurance activity, net.” We seek to exclude the impact of this concept on the Net Interest Margin given that this particular kind of
interest expense is not associated with a source of funding. As such, we adjust the numerator by reincorporating “Financial Expense associated with insurance and reinsurance activity, net” to “Net Interest Income” calculated under IFRS
17. It is important to note that as a result of this adjustment, the numerator of the Net Interest Margin under IRFS4 is identical to that seen under IFRS 17.
From now on, we will exclude from the denominator (average balance of Interest-earning Assets) the following: the balance associated with the account “Financial Assets at Fair Value through
P&L” given that this account is primarily comprised of investments associated from Investment Link contracts, which do not accrue interests for Credicorp. This change is not related to IFRS 17.
Below, we present the aforementioned change in graphic form.