GOAT Outpaces PEPE Growing To $900M Market Cap In 2 Weeks – Details
October 28 2024 - 5:30AM
NEWSBTC
Goatseus Maximus (GOAT), a new meme coin on the block, has taken
the crypto community by storm with its aggressive surge since
launching earlier this month. In just two weeks, GOAT skyrocketed
from virtually zero to over $900 million in market capitalization,
drawing comparisons with last year’s memecoin sensation,
PEPE. This rapid ascent has captivated both analysts and
investors, who are beginning to see GOAT as a potential contender
for memecoin dominance in the current market cycle. Related
Reading: Bitcoin Short Positions Face Serious Risk Above $68,500 –
Details Much like PEPE’s explosive rise in 2023, GOAT has defied
initial skepticism, proving that meme coins still hold significant
sway among crypto enthusiasts and speculative traders. With its
rapidly growing community and social media buzz, many are asking if
GOAT has what it takes to become this cycle’s meme coin reference
point. As the excitement builds, the market is closely
watching to see if GOAT can maintain its momentum and establish
itself as the next big name in the unpredictable world of meme
coins. Can GOAT Lead Meme Coins This Cycle? Top crypto analyst and
investor Daan recently shared an insightful comparison on X between
the rising meme coin Goatseus Maximus (GOAT) and 2023’s sensation,
PEPE. In his analysis, Daan noted that while GOAT has surged
remarkably since its recent launch, the initial trajectory of PEPE
was even faster. PEPE reached a market cap of approximately
$1.4 billion within 22 days of launching, whereas by day 17, it
held around $600 million—close to GOAT’s current standing. Daan
emphasized that PEPE’s local peak occurred when Binance listed it
for spot and perpetual contracts, sparking a “blow-off top.” This
listing and the subsequent price spike marked a turning point, as
PEPE didn’t return to those price levels for another 10 months.
Daan also highlighted other quick-surge tokens, such as SLERF and
BOME, which ran higher earlier this year during a local market
peak. However, he believes GOAT and PEPE stand apart as probable
long-term players in the meme coin space, given their roles as
sector leaders. By positioning GOAT alongside PEPE, Daan
underscored the potential for GOAT to mirror PEPE’s lasting appeal
among investors. Related Reading: Solana Bullish Pattern Holds –
Crypto Analyst Sets $202 Target As GOAT continues to gain traction,
the market remains speculative, and comparisons like Daan’s shed
light on how meme coins like GOAT could evolve—either stabilizing
as a major player or facing a similar volatility cycle post-peak.
With GOAT’s market cap climbing and interest growing, time will
tell whether it can follow a similar trajectory to PEPE or carve
out a unique legacy within the meme coin sector. Price Action:
Technical View GOAT is currently trading at $0.637 after a retrace
from its all-time high of $0.915. While data on GOAT’s price
movements remain limited due to its recent launch, the 4-hour chart
reveals essential levels that could define near-term demand and
supply zones. The key demand level to watch is around
$0.56—previously a significant resistance since GOAT’s debut, now
flipped to act as strong support. If GOAT can hold above this $0.56
mark, it could signal sustained interest from buyers, positioning
the token for another upward move. On the supply side, $0.72 is the
next critical zone to test. A push through this level would likely
bring new bullish momentum as traders look for higher levels and
potential gains above recent highs. Related Reading: Ethereum
Whale Activity Spikes To 6-Week High – Smart Money Accumulation?
The $0.72 area will act as short-term resistance, and should GOAT
manage to break through it, the price could move toward a fresh
all-time high. As GOAT’s momentum develops, these levels offer a
framework for monitoring its price action and gauging potential
shifts in the market sentiment surrounding this rising meme coin.
Featured image from Dall-E, chart from TradingView
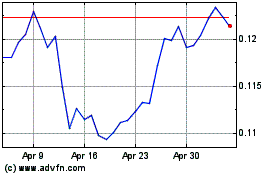
TRON (COIN:TRXUSD)
Historical Stock Chart
From Sep 2024 to Oct 2024

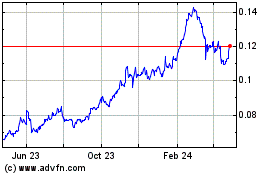
TRON (COIN:TRXUSD)
Historical Stock Chart
From Oct 2023 to Oct 2024
