false
0001903382
0001903382
2024-06-03
2024-06-03
iso4217:USD
xbrli:shares
iso4217:USD
xbrli:shares
UNITED STATES
SECURITIES AND EXCHANGE COMMISSION
Washington, D.C. 20549
FORM 8-K
CURRENT REPORT
Pursuant
to Section 13 or 15(d) of the Securities Exchange Act of 1934
Date
of Report (Date of earliest event reported): June 3, 2024
Bluerock Homes
Trust, Inc.
(Exact Name of Registrant as Specified in Its Charter)
| Maryland |
001-41322 |
87-4211187 |
(State or other jurisdiction of incorporation
or organization) |
(Commission File
Number) |
(I.R.S. Employer
Identification
No.) |
1345 Avenue of the Americas, 32nd Floor
New York, NY 10105
(Address of principal executive offices)
(212) 843-1601
(Registrant’s telephone number, including
area code)
None.
(Former name or former address, if changed since last report)
Securities registered pursuant to Section 12(b) of
the Exchange Act:
| Title
of each class |
Trading
Symbol |
Name
of each exchange on which registered |
| Class
A Common Stock, $0.01 par value per share |
BHM |
NYSE
American |
Check the appropriate box below if the Form 8-K/A filing is intended to simultaneously satisfy the filing obligation of the registrant
under any of the following provisions:
¨
Written communications pursuant to Rule 425 under the Securities Act (17 CFR 230.425)
¨
Soliciting material pursuant to Rule 14a-12 under the Exchange Act (17 CFR 240.14a-12)
¨
Pre-commencement communications pursuant to Rule 14d-2(b) under the Exchange Act (17 CFR 240.14d-2(b))
¨
Pre-commencement communications pursuant to Rule 13e-4(c) under the Exchange Act (17 CFR 240.13e-4(c))
Indicate
by check mark whether the registrant is an emerging growth company as defined in Rule 405 of the Securities Act of 1933 (§ 230.405
of this chapter) or Rule 12b-2 of the Securities Exchange Act of 1934 (§ 240.12b-2
of this chapter).
Emerging growth company x
If an emerging growth company, indicate
by check mark if the registrant has elected not to use the extended transition period for complying with any new or revised financial
accounting standards provided pursuant to Section 13(a) of the Exchange Act.
| ITEM 7.01 |
REGULATION FD DISCLOSURE |
On
June 3, 2024, the slide presentation (the “Presentation”) attached hereto as Exhibit 99.1 will be provided to certain investment
professionals. The Presentation will also be available on the investor relations page of the Registrant's website at https://bhm.bluerock.com/investors/events-and-presentations/presentations/default.aspx.
In
accordance with General Instruction B.2 of Form 8-K, the information set forth herein is deemed to be “furnished” and shall
not be deemed to be “filed” for purposes of the Exchange Act. The information set forth in this Item 7.01 of this Current
Report on Form 8-K shall not be deemed an admission as to the materiality of any information in this Current Report on Form 8-K that is
required to be disclosed solely to satisfy the requirements of Regulation FD.
| ITEM 9.01 |
FINANCIAL STATEMENTS AND EXHIBITS |
(d) Exhibits.
The
following exhibit relating to Item 7.01 of this Current Report on Form 8-K is intended to be furnished to, not filed with, the SEC pursuant
to Regulation FD.
SIGNATURE
Pursuant to the requirements
of the Securities Exchange Act of 1934, the registrant has duly caused this report to be signed on its behalf by the undersigned hereunto
duly authorized.
| |
BLUEROCK HOMES TRUST, INC. |
| |
|
|
| |
|
|
| Date: June 3, 2024 |
By: |
/s/ Christopher J. Vohs |
| |
|
Christopher J. Vohs |
| |
|
Chief Financial Officer and Treasurer |
Exhibit 99.1

1 THE SINGLE - FAMILY RENTAL OPPORTUNITY Sponsored By Listed On NAREIT Conference June 2024
2 The information in this presentation has been prepared solely for informational purposes by Bluerock Homes Trust, Inc . (“BHM”) and does not constitute an offer to sell or the solicitation of an offer to purchase any securities . This presentation is not, and should not be assumed to be, complete . This presentation has been prepared to assist interested parties in making their own evaluation of BHM and does not purport to contain all of the information that may be relevant . In all cases, interested parties should conduct their own investigation and analysis of BHM and the data set forth in this presentation and other information provided by or on behalf of BHM . In addition, certain of the information contained herein may be derived from information provided by industry sources . BHM believes that such information is accurate and that the sources from which it has been obtained are reliable . BHM cannot guarantee the accuracy of such information, however, and has not independently verified such information . The information presented herein remains subject to change . Statements in this presentation are made as of the date of this presentation unless stated otherwise . This presentation also contains statements that, to the extent they are not recitations of historical fact, constitute “forward - looking statements . ” Forward - looking statements are typically identified by the use of terms such as “may,” “should,” “expect,” “could,” “intend,” “plan,” “anticipate,” “estimate,” “believe,” “continue,” “predict,” “potential” or the negative of such terms and other comparable terminology . The forward - looking statements included herein are based upon BHM’s current expectations, plans, estimates, assumptions and beliefs that involve numerous risks and uncertainties . Assumptions relating to the foregoing involve judgments with respect to, among other things, future economic, competitive and market conditions and future business decisions, all of which are difficult or impossible to predict accurately and many of which are beyond BHM’s control . Although BHM believes that the expectations reflected in such forward - looking statements are based on reasonable assumptions, BHM’s actual results and performance and the value of its securities could differ materially from those set forth in the forward - looking statements due to the impact of many factors . Other factors include, but are not limited to, the uncertainties of real estate development, acquisition and disposition activity, the ability of our joint venture partners to satisfy their obligations, the costs and availability of financing, the effects of local economic and market conditions, the effects of acquisitions and dispositions, the impact of newly adopted accounting principles on BHM’s accounting policies and on period - to - period comparisons of financial results, regulatory changes and other risks and uncertainties detailed in the “Risk Factors” in Item 1 . A . Risk Factors section of the Company’s Annual Report on Form 10 - K filed with the U . S . Securities and Exchange Commission on March 12 , 2024 , and other discussions of risk factors contained in BHM’s periodic filings . BHM claims the safe harbor protection for forward looking statements contained in the Private Securities Litigation Reform Act of 1995 . BHM undertakes no obligation to update or revise any such information for any reason after the date of this presentation, unless required by law . Forward - Looking Statements
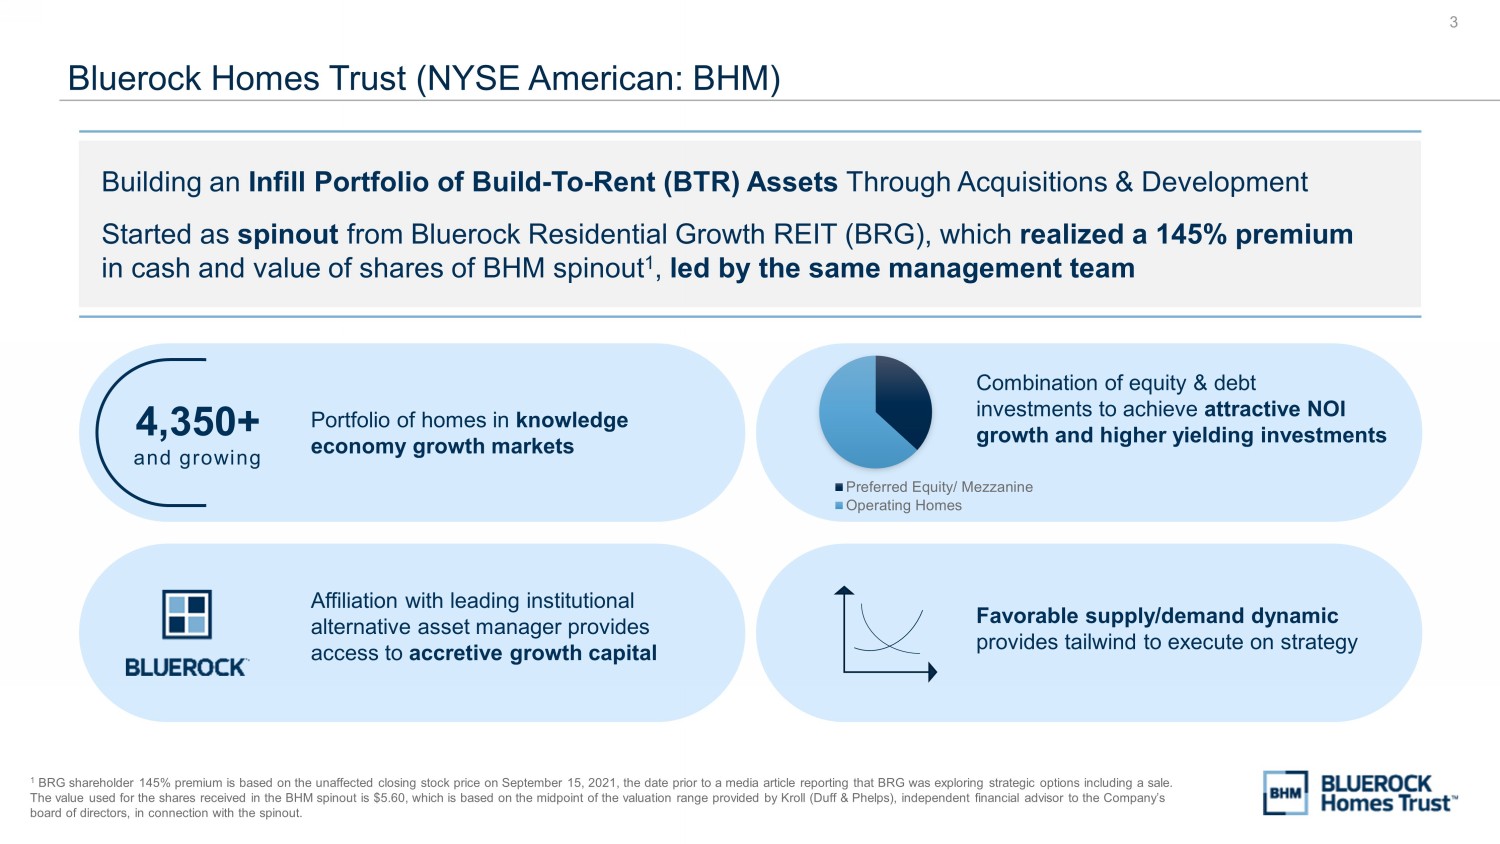
3 Bluerock Homes Trust (NYSE American: BHM) 1 BRG shareholder 145% premium is based on the unaffected closing stock price on September 15, 2021, the date prior to a media ar ticle reporting that BRG was exploring strategic options including a sale. The value used for the shares received in the BHM spinout is $5.60, which is based on the midpoint of the valuation range pro vid ed by Kroll (Duff & Phelps), independent financial advisor to the Company’s board of directors, in connection with the spinout. Building an Infill Portfolio of Build - To - Rent (BTR) Assets Through Acquisitions & Development Started as spinout from Bluerock Residential Growth REIT (BRG), which realized a 145% premium in cash and value of shares of BHM spinout 1 , led by the same management team Preferred Equity/ Mezzanine Operating Homes Combination of equity & debt investments to achieve attractive NOI growth and higher yielding investments Affiliation with leading institutional alternative asset manager provides access to accretive growth capital Favorable supply/demand dynamic provides tailwind to execute on strategy 4,350+ and growing Portfolio of homes in knowledge economy growth markets
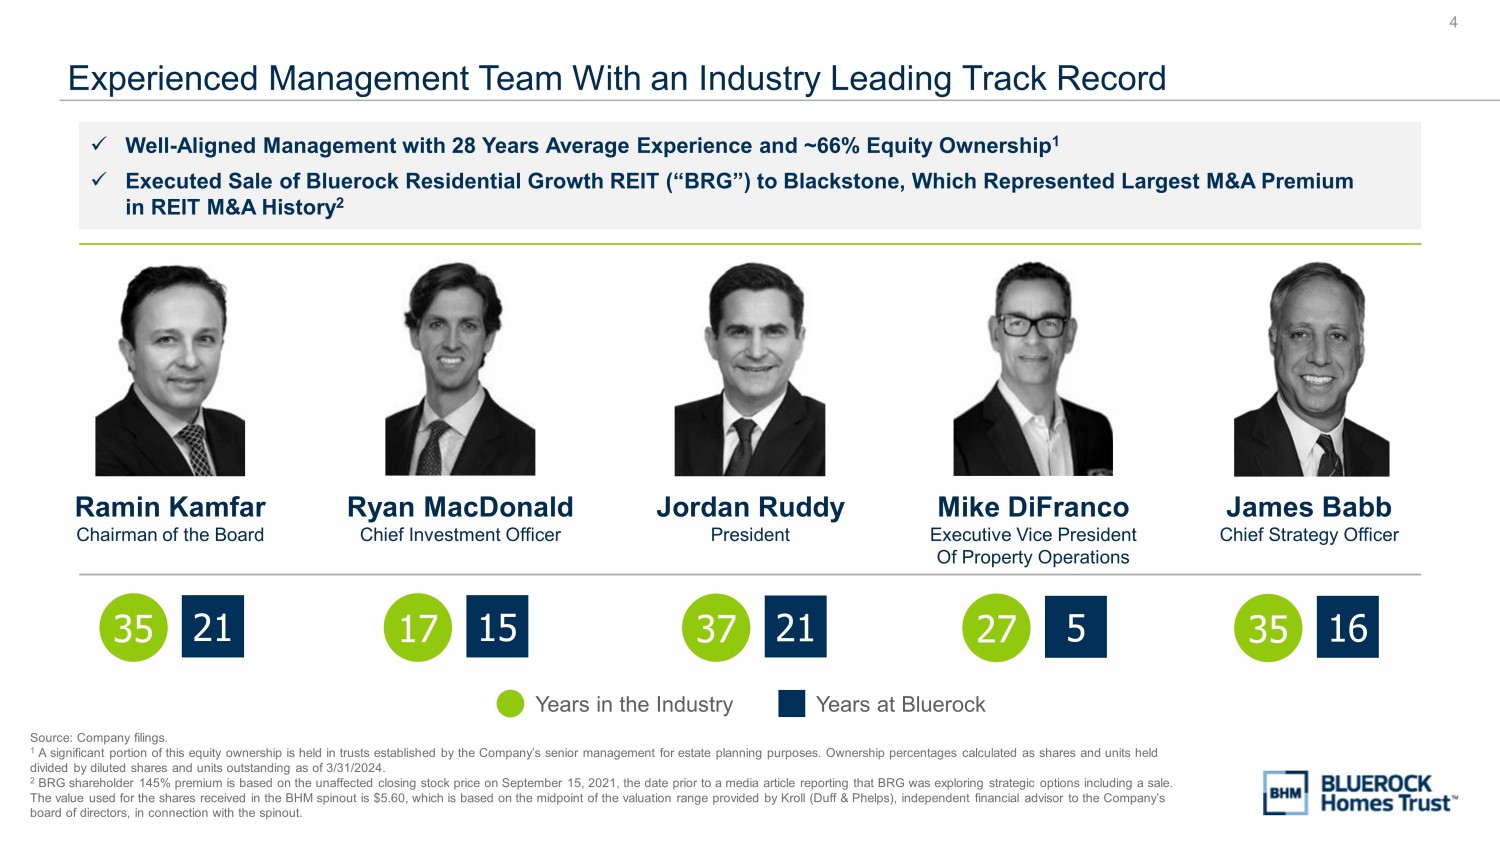
4 21 35 Ramin Kamfar Chairman of the Board Jordan Ruddy President 21 37 Ryan MacDonald Chief Investment Officer 15 17 Mike DiFranco Executive Vice President Of Property Operations 5 27 James Babb Chief Strategy Officer 16 35 Years at Bluerock Years in the Industry Experienced Management Team With an Industry Leading Track Record Source: Company filings. 1 A significant portion of this equity ownership is held in trusts established by the Company’s senior management for estate pl an ning purposes. Ownership percentages calculated as shares and units held divided by diluted shares and units outstanding as of 3/31/2024. 2 BRG shareholder 145% premium is based on the unaffected closing stock price on September 15, 2021, the date prior to a media ar ticle reporting that BRG was exploring strategic options including a sale. The value used for the shares received in the BHM spinout is $5.60, which is based on the midpoint of the valuation range pro vid ed by Kroll (Duff & Phelps), independent financial advisor to the Company’s board of directors, in connection with the spinout. x Well - Aligned Management with 28 Years Average Experience and ~66% Equity Ownership 1 x Executed Sale of Bluerock Residential Growth REIT (“BRG”) to Blackstone, Which Represented Largest M&A Premium in REIT M&A History 2
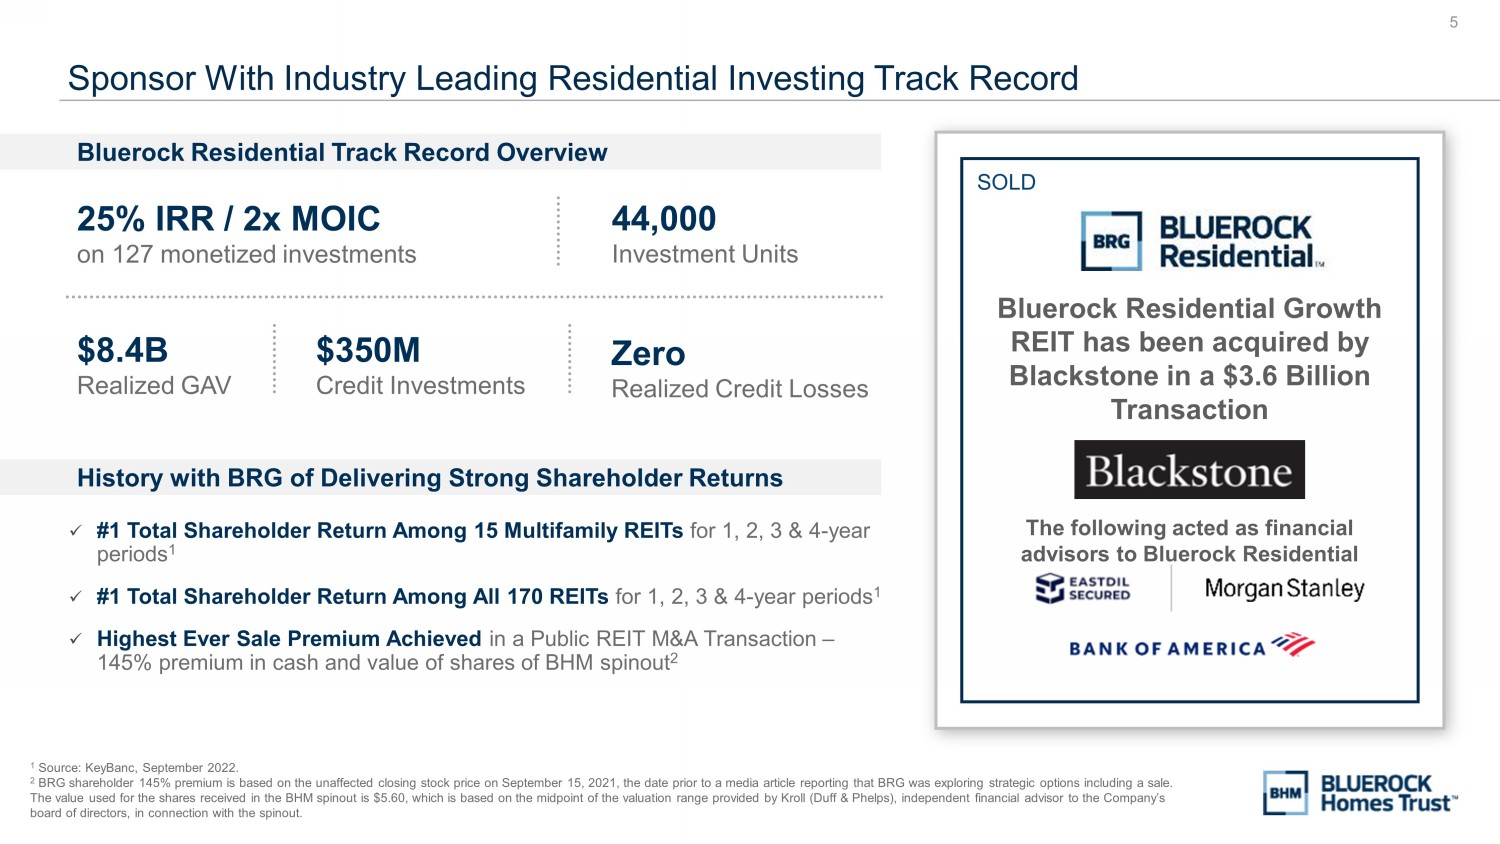
5 Bluerock Residential Growth REIT has been acquired by Blackstone in a $3.6 Billion Transaction The following acted as financial advisors to Bluerock Residential SOLD Sponsor With Industry Leading Residential Investing Track Record 1 Source: KeyBanc, September 2022. 2 BRG shareholder 145% premium is based on the unaffected closing stock price on September 15, 2021, the date prior to a media ar ticle reporting that BRG was exploring strategic options including a sale. The value used for the shares received in the BHM spinout is $5.60, which is based on the midpoint of the valuation range pro vid ed by Kroll (Duff & Phelps), independent financial advisor to the Company’s board of directors, in connection with the spinout. 44,000 Investment Units $8.4B Realized GAV $350M Credit Investments Zero Realized Credit Losses Bluerock Residential Track Record Overview History with BRG of Delivering Strong Shareholder Returns x #1 Total Shareholder Return Among 15 Multifamily REITs for 1, 2, 3 & 4 - year periods 1 x #1 Total Shareholder Return Among All 170 REITs for 1, 2, 3 & 4 - year periods 1 x Highest Ever Sale Premium Achieved in a Public REIT M&A Transaction – 145% premium in cash and value of shares of BHM spinout 2 25% IRR / 2x MOIC on 127 monetized investments
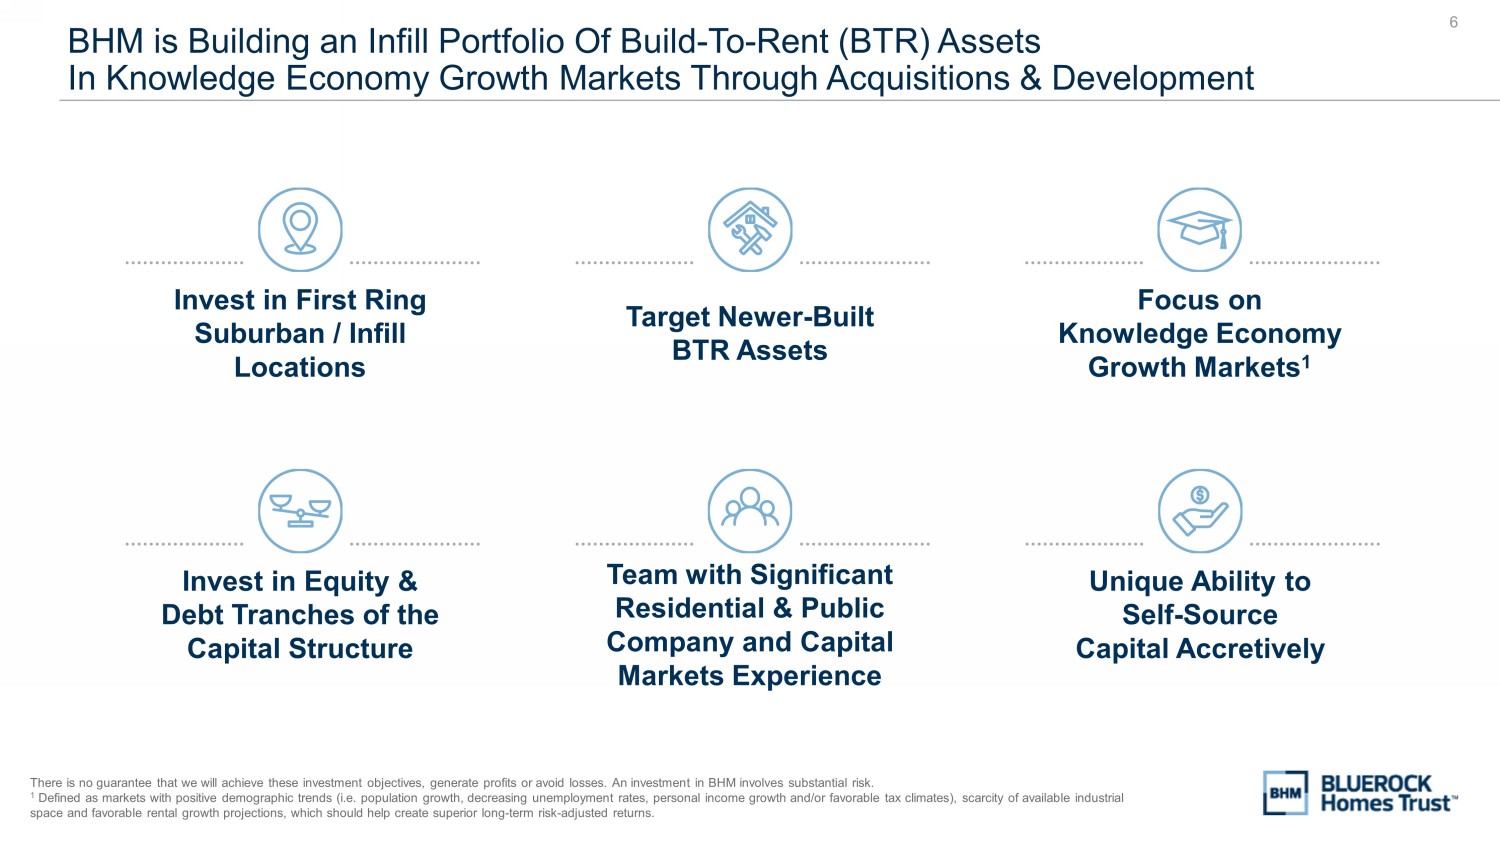
6 BHM is Building an Infill Portfolio Of Build - To - Rent (BTR) Assets In Knowledge Economy Growth Markets Through Acquisitions & Development There is no guarantee that we will achieve these investment objectives, generate profits or avoid losses. An investment in BH M i nvolves substantial risk. 1 Defined as markets with positive demographic trends (i.e. population growth, decreasing unemployment rates, personal income g ro wth and/or favorable tax climates), scarcity of available industrial space and favorable rental growth projections, which should help create superior long - term risk - adjusted returns. Invest in First Ring Suburban / Infill Locations Focus on Knowledge Economy Growth Markets 1 Target Newer - Built BTR Assets Invest in Equity & Debt Tranches of the Capital Structure Team with Significant Residential & Public Company and Capital Markets Experience Unique Ability to Self - Source Capital Accretively

7 MARKET OPPORTUNITY
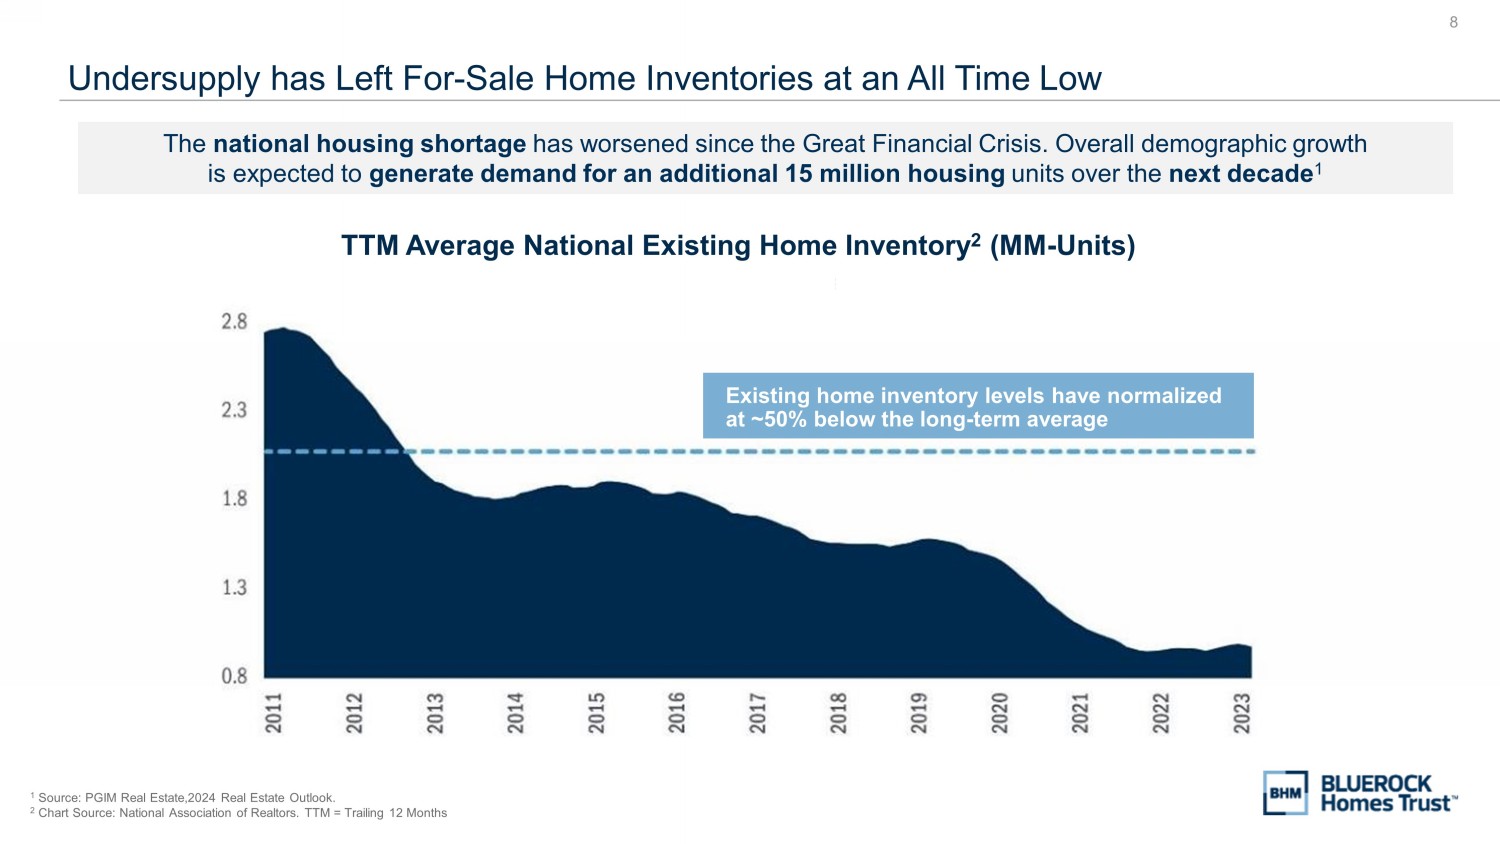
8 Undersupply has Left For - Sale Home Inventories at an All Time Low 1 Source: PGIM Real Estate,2024 Real Estate Outlook. 2 Chart Source: National Association of Realtors. TTM = Trailing 12 Months TTM Average National Existing Home Inventory 2 (MM - Units) The national housing shortage has worsened since the Great Financial Crisis. Overall demographic growth is expected to generate demand for an additional 15 million housing units over the next decade 1 Existing home inventory levels have normalized at ~50% below the long - term average
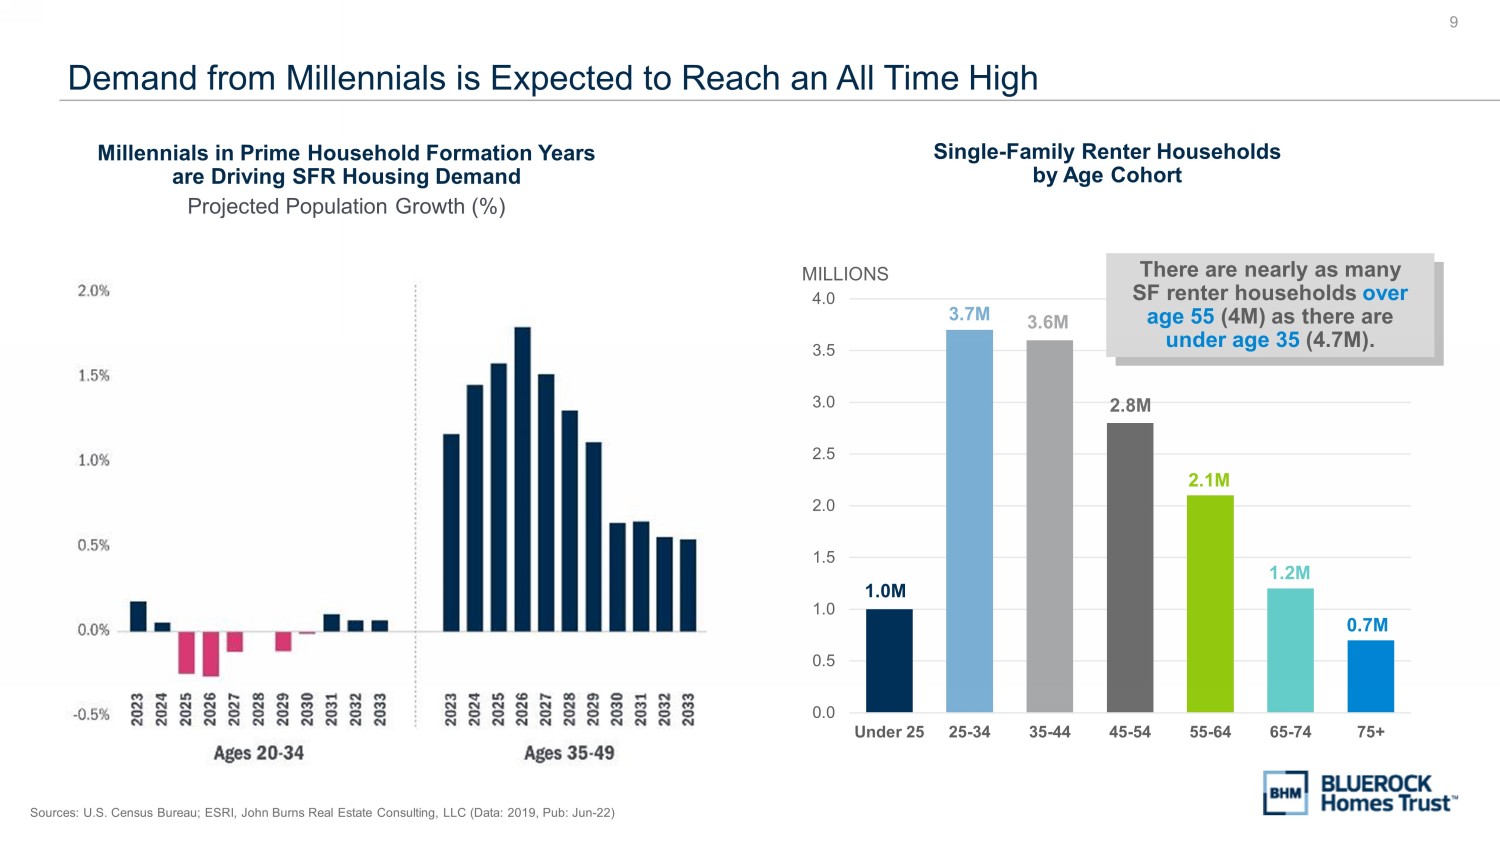
9 Demand from Millennials is Expected to Reach an All Time High Sources: U.S. Census Bureau; ESRI, John Burns Real Estate Consulting, LLC (Data: 2019, Pub: Jun - 22) Millennials in Prime Household Formation Years are Driving SFR Housing Demand Projected Population Growth (%) 0.0 0.5 1.0 1.5 2.0 2.5 3.0 3.5 4.0 Under 25 25-34 35-44 45-54 55-64 65-74 75+ MILLIONS There are nearly as many SF renter households over age 55 (4M) as there are under age 35 (4.7M). Single - Family Renter Households by Age Cohort 1.0M 3.7M 3.6M 2.8M 2.1M 1.2M 0.7M
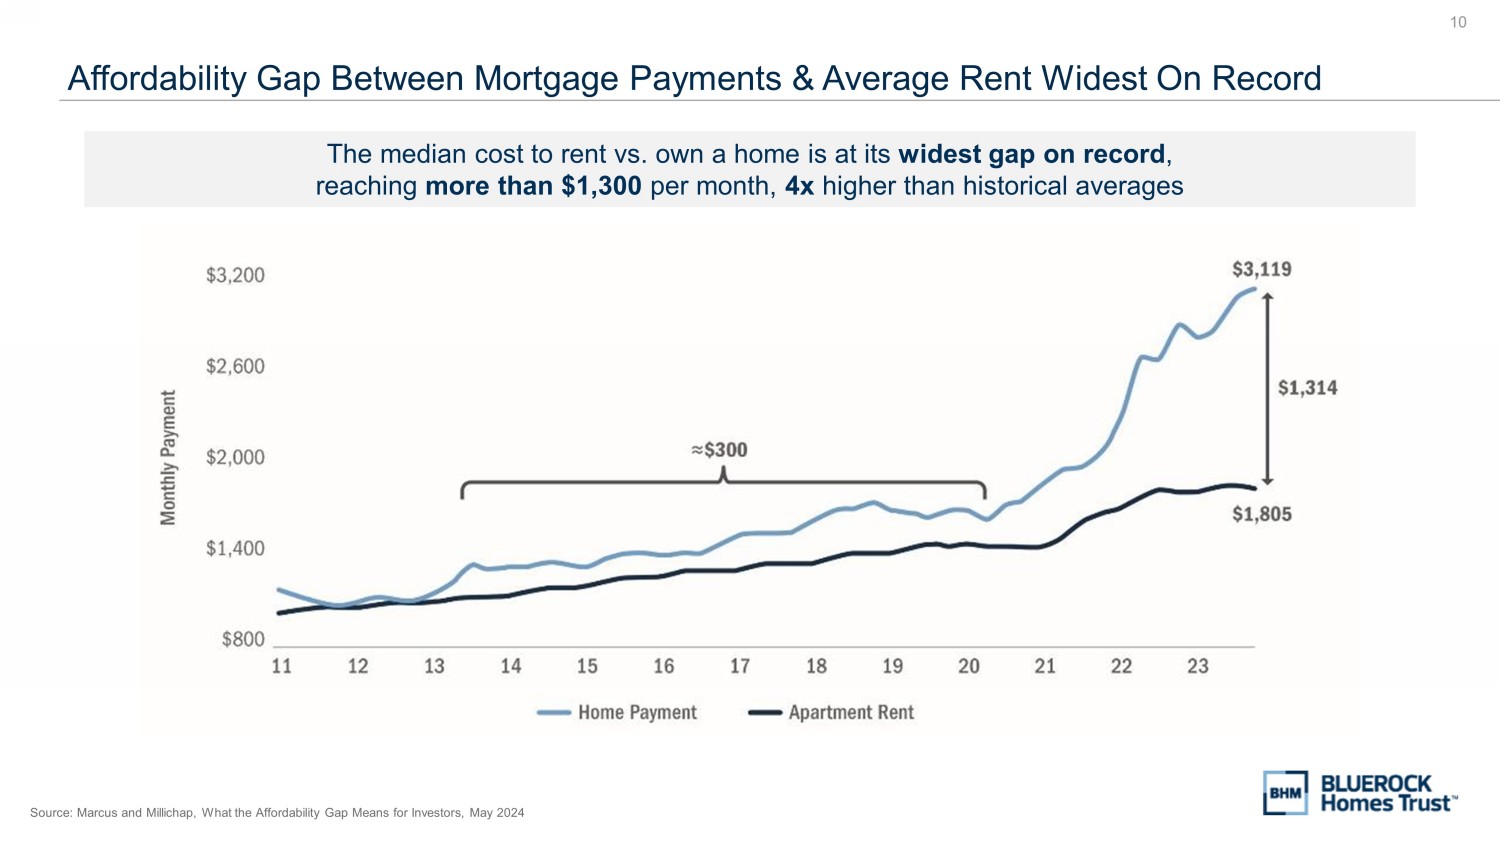
10 Affordability Gap Between Mortgage Payments & Average Rent Widest On Record Source: Marcus and Millichap, What the Affordability Gap Means for Investors, May 2024 The median cost to rent vs. own a home is at its widest gap on record , reaching more than $1,300 per month, 4x higher than historical averages
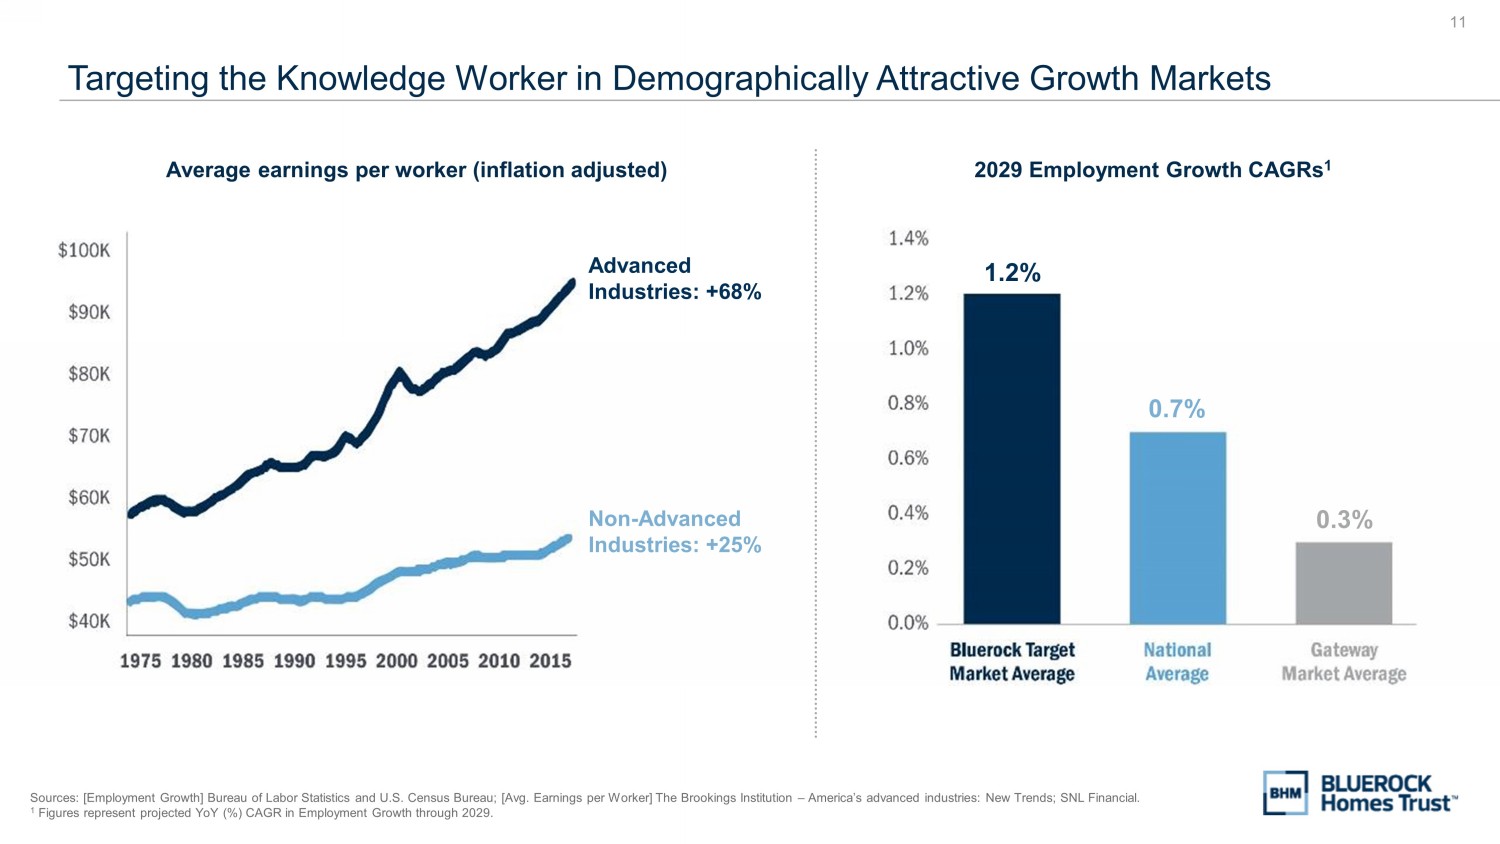
11 Average earnings per worker (inflation adjusted) Targeting the Knowledge Worker in Demographically Attractive Growth Markets Sources: [Employment Growth] Bureau of Labor Statistics and U.S. Census Bureau; [Avg. Earnings per Worker] The Brookings Inst itu tion – America’s advanced industries: New Trends; SNL Financial. 1 Figures represent projected YoY (%) CAGR in Employment Growth through 2029. Advanced Industries: +68% Non - Advanced Industries: +25% 2029 Employment Growth CAGRs 1 1.2% 0.7% 0.3%
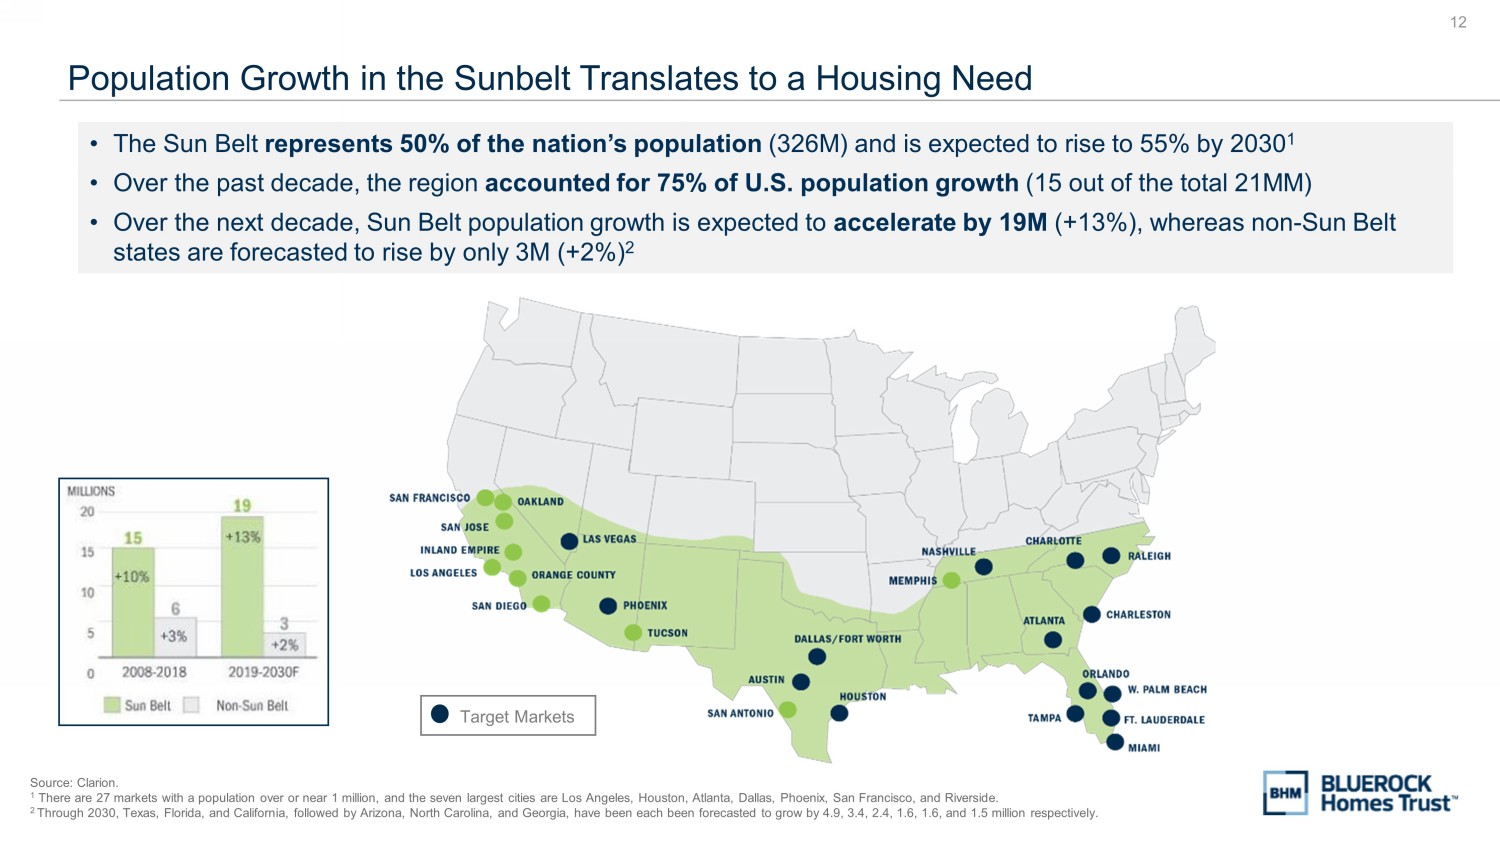
12 Population Growth in the Sunbelt Translates to a Housing Need Source: Clarion. 1 There are 27 markets with a population over or near 1 million, and the seven largest cities are Los Angeles, Houston, Atlanta , Dallas, Phoenix, San Francisco, and Riverside. 2 Through 2030, Texas, Florida, and California, followed by Arizona, North Carolina, and Georgia, have been each been forecaste d t o grow by 4.9, 3.4, 2.4, 1.6, 1.6, and 1.5 million respectively. Target Markets • The Sun Belt represents 50% of the nation’s population (326M) and is expected to rise to 55% by 2030 1 • Over the past decade, the region accounted for 75% of U.S. population growth (15 out of the total 21MM) • Over the next decade, Sun Belt population growth is expected to accelerate by 19M (+13%), whereas non - Sun Belt states are forecasted to rise by only 3M (+2%) 2

13 GROWTH STRATEGY
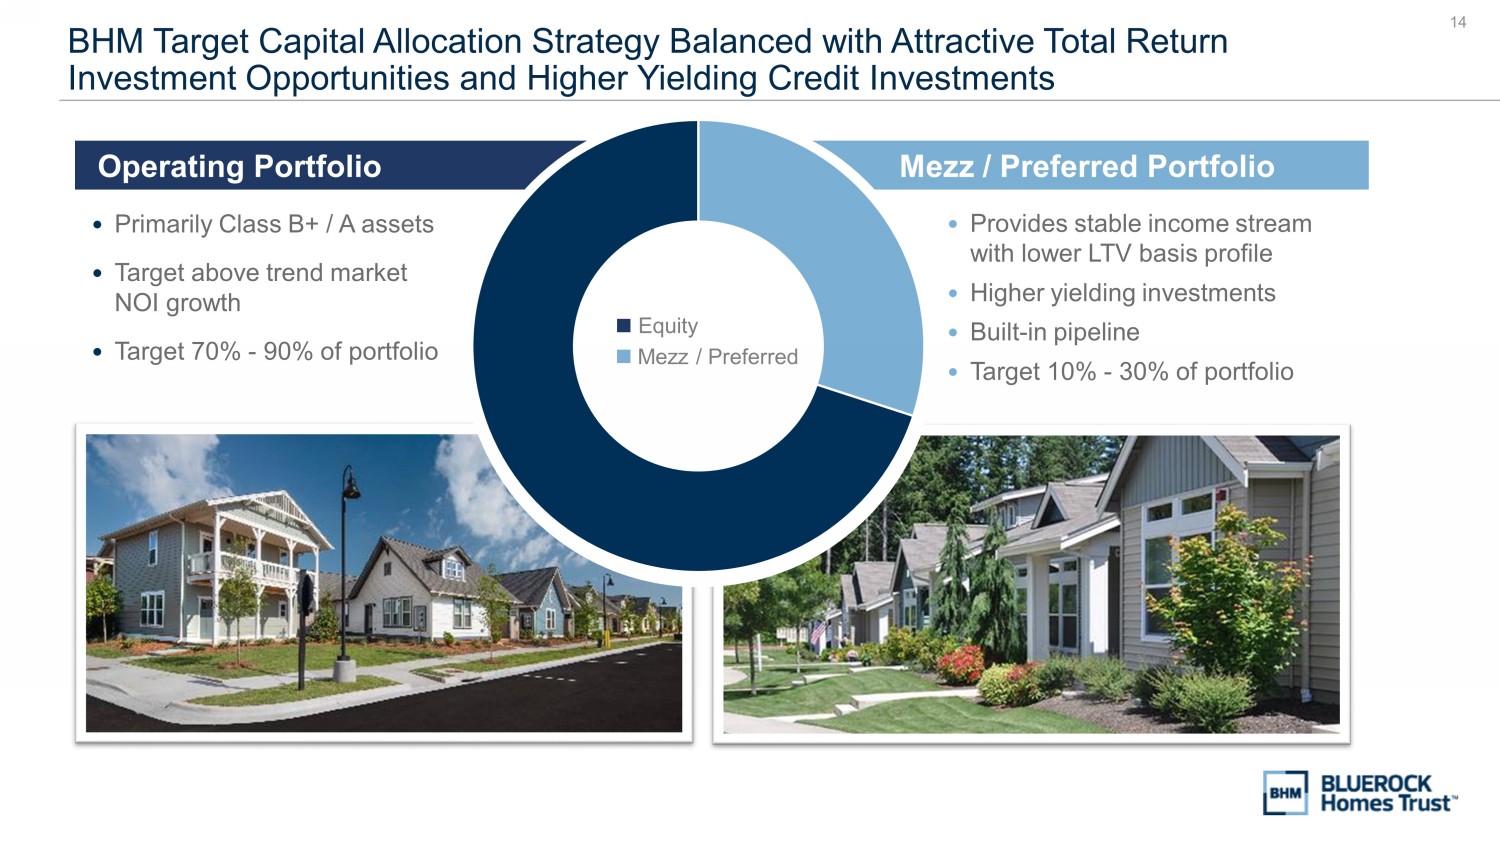
14 Mezz / Preferred Portfolio Operating Portfolio • Primarily Class B+ / A assets • Target above trend market NOI growth • Target 70% - 90% of portfolio • Provides stable income stream with lower LTV basis profile • Higher yielding investments • Built - in pipeline • Target 10% - 30% of portfolio BHM Target Capital Allocation Strategy Balanced with Attractive Total Return Investment Opportunities and Higher Yielding Credit Investments Equity Mezz / Preferred

15 BHM Portfolio Overview Some properties pictured herein are jointly owned by BHM and are representative of the type of properties targeted for future in vestments by BHM. Portfolio holdings are subject to change at any time. Gross assets calculated as total assets and add back depreciation and amortization. 1 As of 3/31/2024. 2 Operating portfolio assets only. 3 Three months ended 3/31/2024. Represents the average of the ending occupancy as of the last day of each month in the period p re sented. ~2,750 Operating Homes 1,600+ Preferred Equity / Mezzanine Loans 400+ Stabilized Homes 1,200+ Under Development / Lease - Up 1,875 Scattered Site / Clustered 870 Build - to - Rent (BTR) LAKE SHORE | SAVANNAH, GA WAYFORD AT CONCORD | CONCORD, NC YAUGER PARK VILLAS | OLYMPIA, WA NAVIGATOR VILLAS | PASCO, WA ~2,750 homes 2 94.5% Occupancy 3 $1,600 Avg. Rent $ Low Leverage – 30% Total Debt as a % of Gross Assets 4,350+ Homes & Growing 1 GRANBURY | GRANBURY, TX TEXARKANA | TEXARKANA, TX
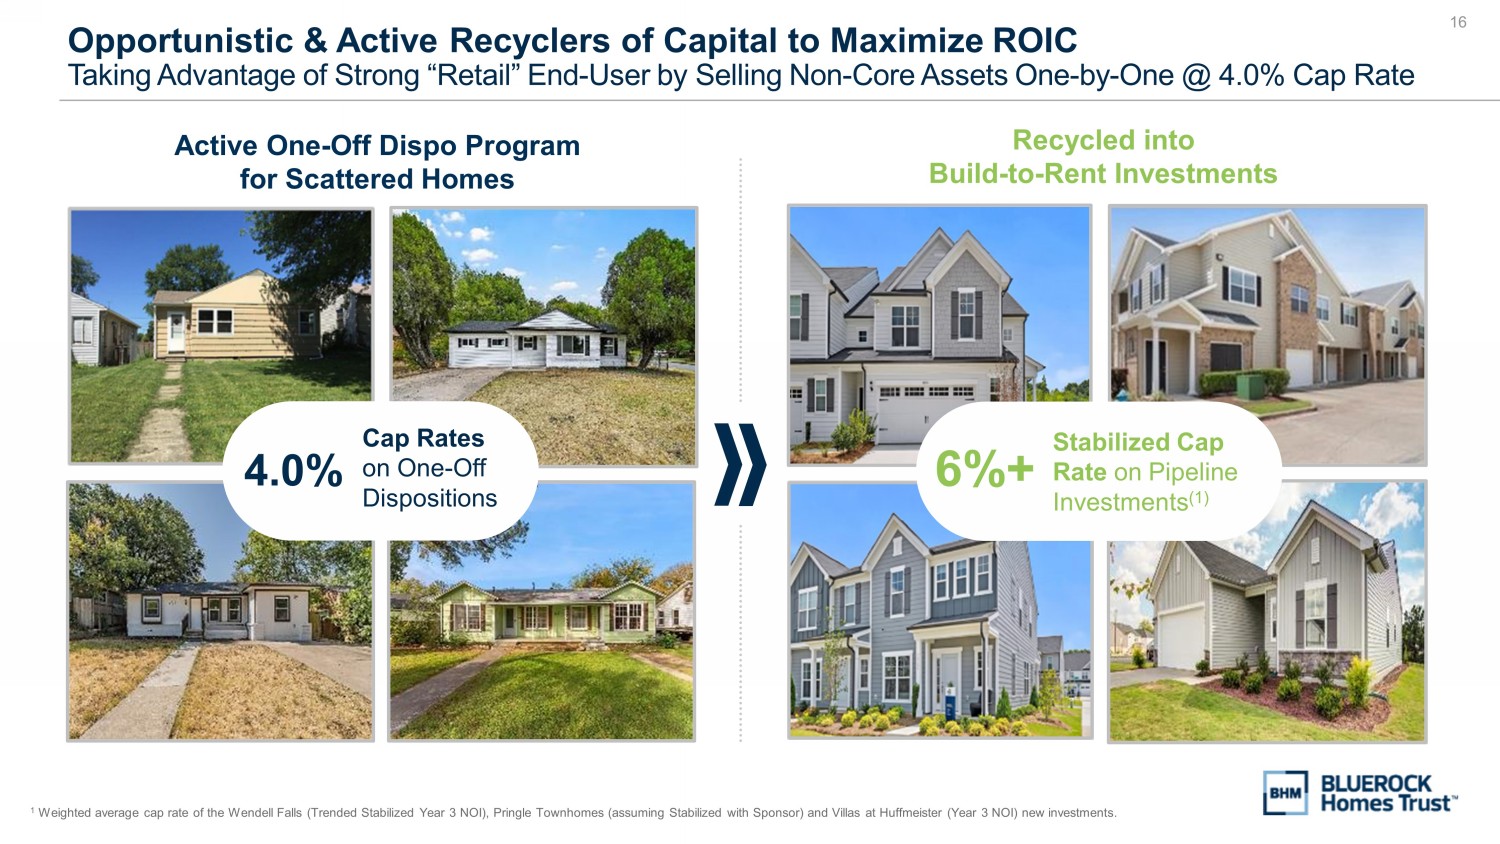
16 Opportunistic & Active Recyclers of Capital to Maximize ROIC Taking Advantage of Strong “Retail” End - User by Selling Non - Core Assets One - by - One @ 4.0% Cap Rate 1 Weighted average cap rate of the Wendell Falls (Trended Stabilized Year 3 NOI), Pringle Townhomes (assuming Stabilized with S po nsor) and Villas at Huffmeister (Year 3 NOI) new investments. Active One - Off Dispo Program for Scattered Homes Cap Rates on One - Off Dispositions 4.0% Recycled into Build - to - Rent Investments Stabilized Cap Rate on Pipeline Investments (1) 6%+
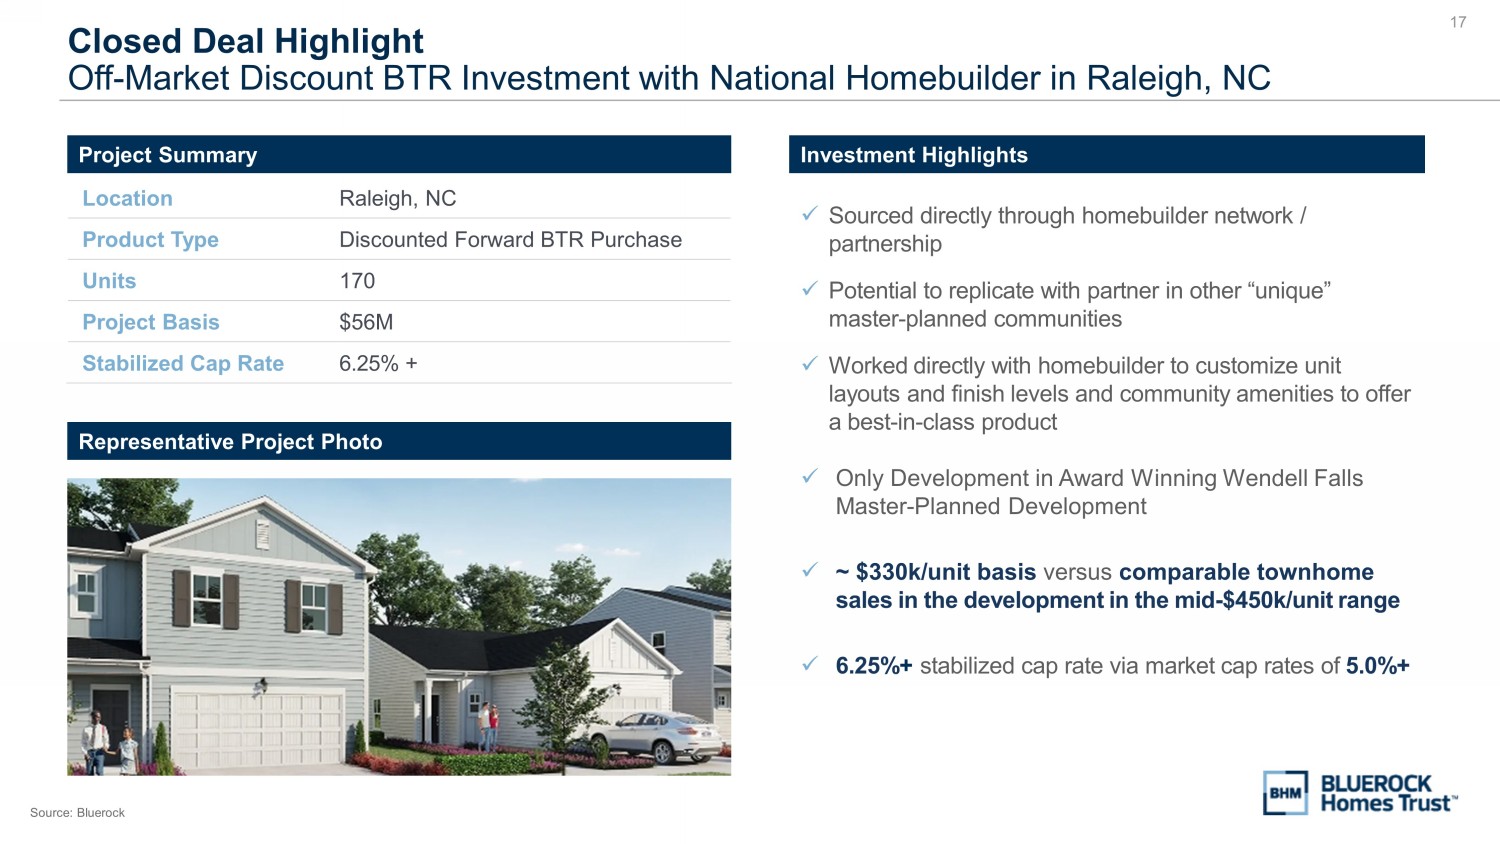
17 Closed Deal Highlight Off - Market Discount BTR Investment with National Homebuilder in Raleigh, NC Source: Bluerock Project Summary Location Raleigh, NC Product Type Discounted Forward BTR Purchase Units 170 Project Basis $56M Stabilized Cap Rate 6.25% + Investment Highlights x Sourced directly through homebuilder network / partnership x Potential to replicate with partner in other “unique” master - planned communities x Worked directly with homebuilder to customize unit layouts and finish levels and community amenities to offer a best - in - class product x Only Development in Award Winning Wendell Falls Master - Planned Development x ~ $330k/unit basis versus comparable townhome sales in the development in the mid - $450k/unit range x 6.25% + stabilized cap rate via market cap rates of 5.0%+ Representative Project Photo
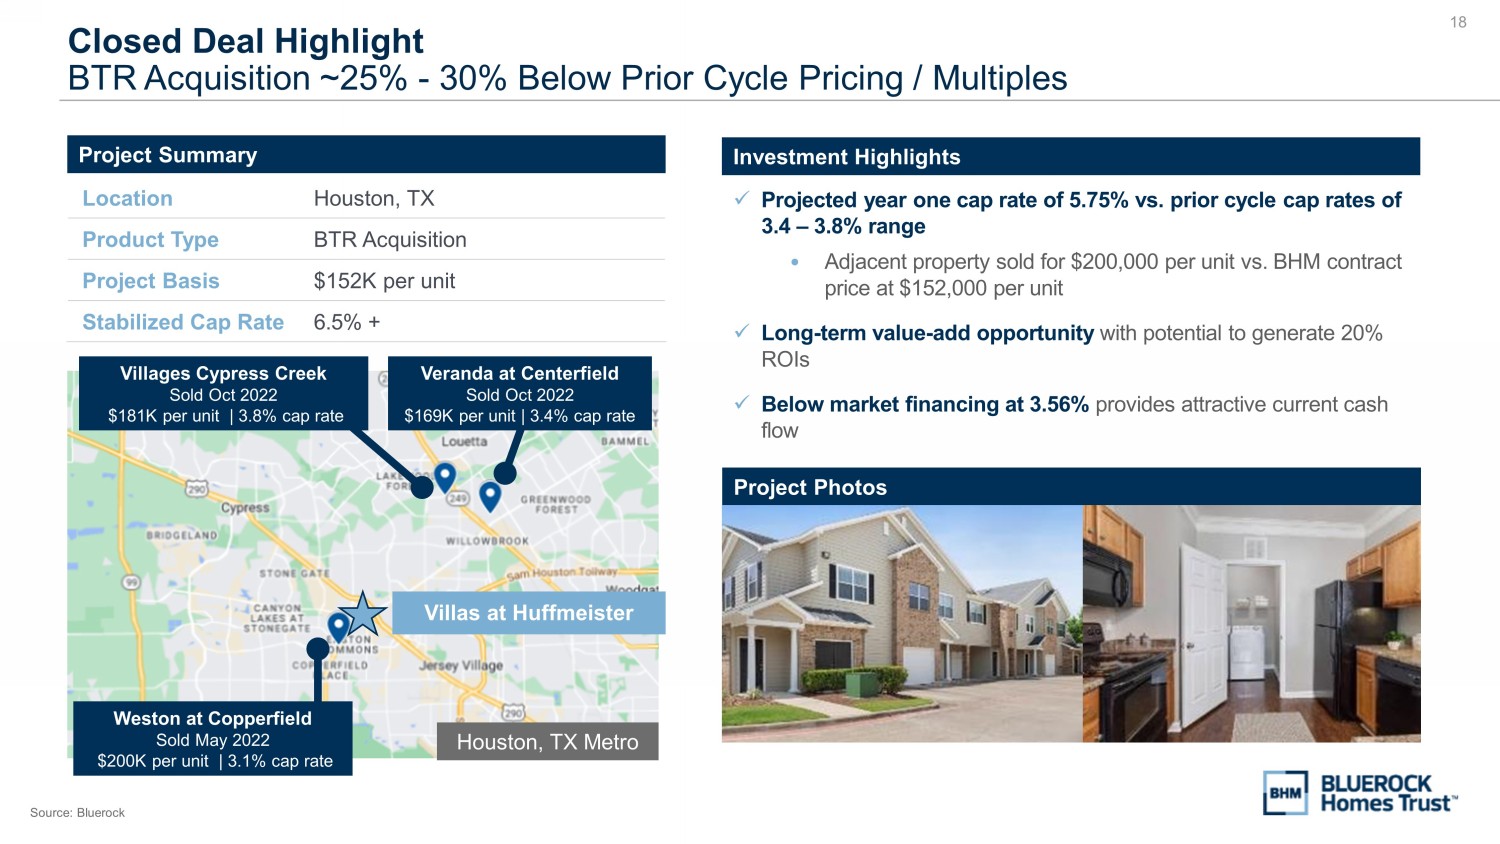
18 Closed Deal Highlight BTR Acquisition ~25% - 30% Below Prior Cycle Pricing / Multiples Source: Bluerock Project Summary Location Houston, TX Product Type BTR Acquisition Project Basis $152K per unit Stabilized Cap Rate 6.5% + Investment Highlights x Projected year one cap rate of 5.75% vs. prior cycle cap rates of 3.4 – 3.8% range • Adjacent property sold for $200,000 per unit vs. BHM contract price at $152,000 per unit x Long - term value - add opportunity with potential to generate 20% ROIs x Below market financing at 3.56% provides attractive current cash flow Project Photos Villas at Huffmeister Houston, TX Metro Weston at Copperfield Sold May 2022 $200K per unit | 3.1% cap rate Villages Cypress Creek Sold Oct 2022 $181K per unit | 3.8% cap rate Veranda at Centerfield Sold Oct 2022 $169K per unit | 3.4% cap rate

19 WELL - POSITIONED BALANCE SHEET AND ACCESS TO CAPITAL
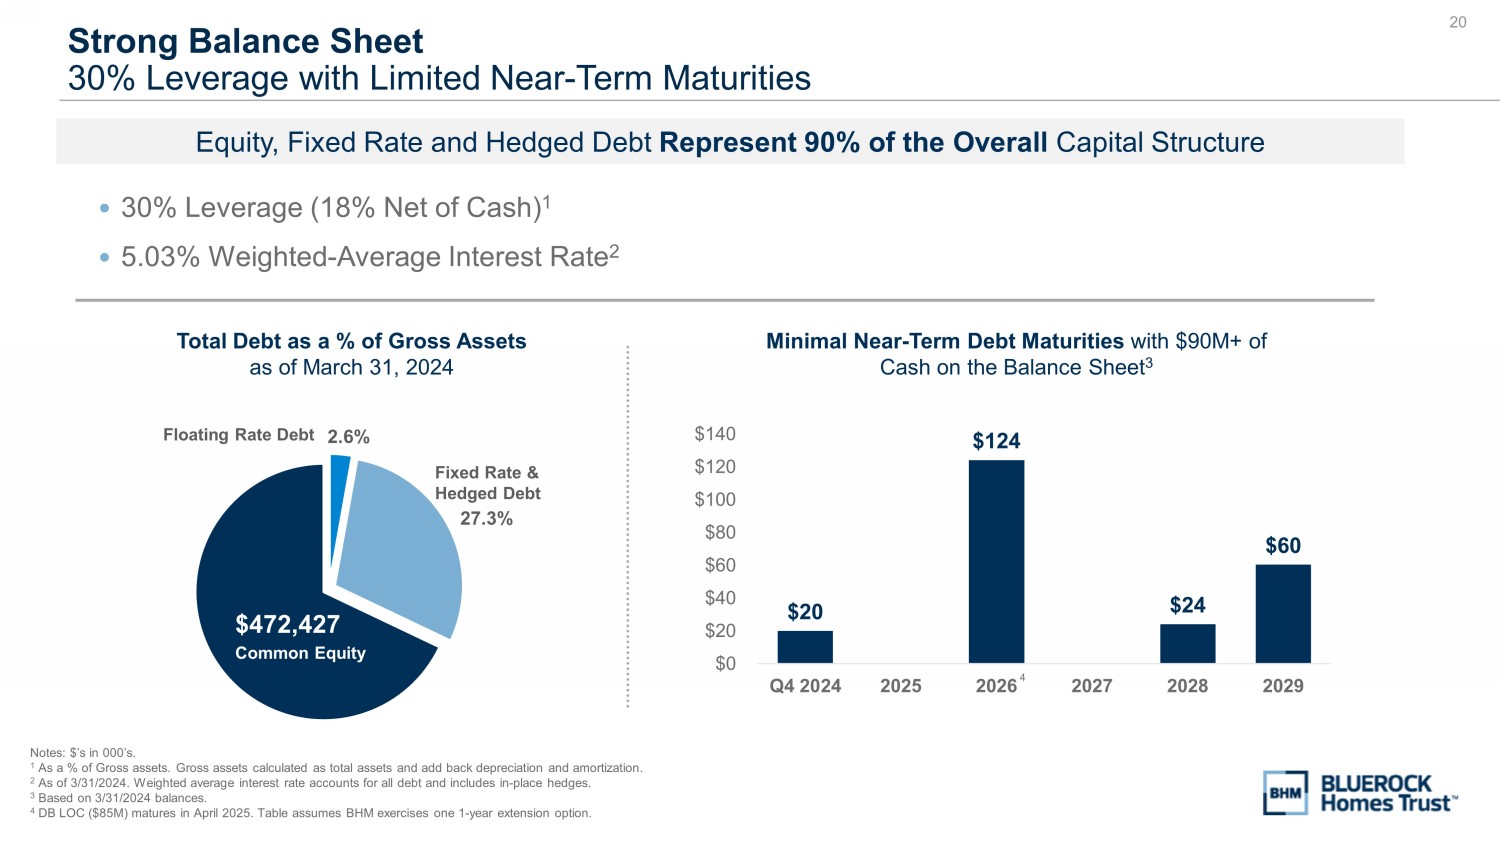
20 2.6% 27.3% $472,427 Fixed Rate & Hedged Debt Floating Rate Debt Common Equity Strong Balance Sheet 30% Leverage with Limited Near - Term Maturities Notes: $’s in 000’s. 1 As a % of Gross assets. Gross assets calculated as total assets and add back depreciation and amortization. 2 As of 3/31/2024. Weighted average interest rate accounts for all debt and includes in - place hedges. 3 Based on 3/31/2024 balances. 4 DB LOC ($85M) matures in April 2025. Table assumes BHM exercises one 1 - year extension option. Equity, Fixed Rate and Hedged Debt Represent 90% of the Overall Capital Structure • 30% Leverage (18% Net of Cash) 1 • 5.03% Weighted - Average Interest Rate 2 $20 $124 $24 $60 $0 $20 $40 $60 $80 $100 $120 $140 Q4 2024 2025 2026 2027 2028 2029 Minimal Near - Term Debt Maturities with $90M+ of Cash on the Balance Sheet 3 4 Total Debt as a % of Gross Assets as of March 31, 2024
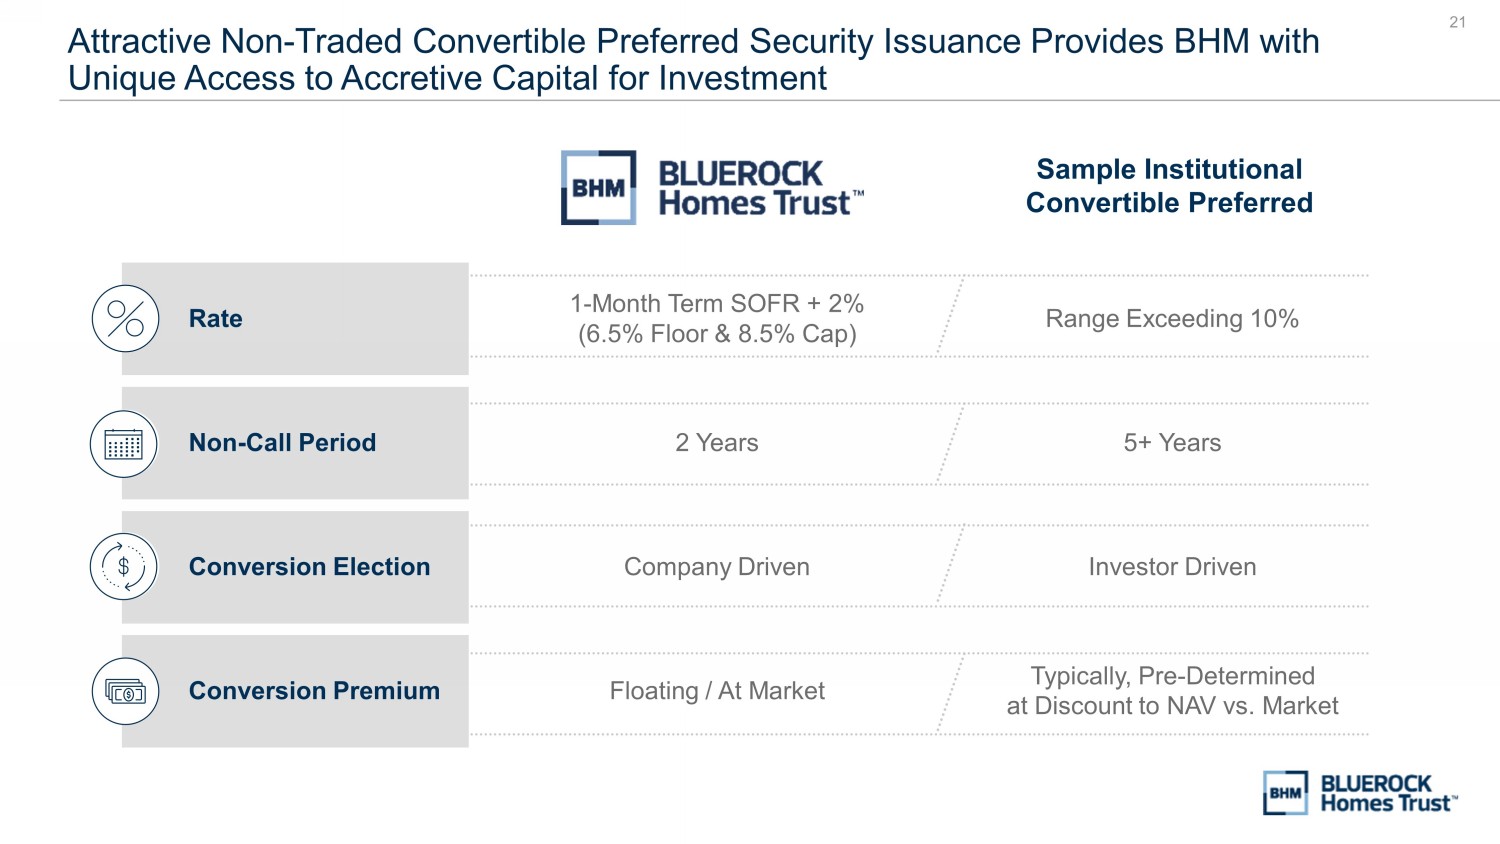
21 Attractive Non - Traded Convertible Preferred Security Issuance Provides BHM with Unique Access to Accretive Capital for Investment Rate 1 - Month Term SOFR + 2% (6.5% Floor & 8.5% Cap) Range Exceeding 10% Non - Call Period 2 Years 5+ Years Conversion Election Company Driven Investor Driven Conversion Premium Floating / At Market Typically, Pre - Determined at Discount to NAV vs. Market Sample Institutional Convertible Preferred
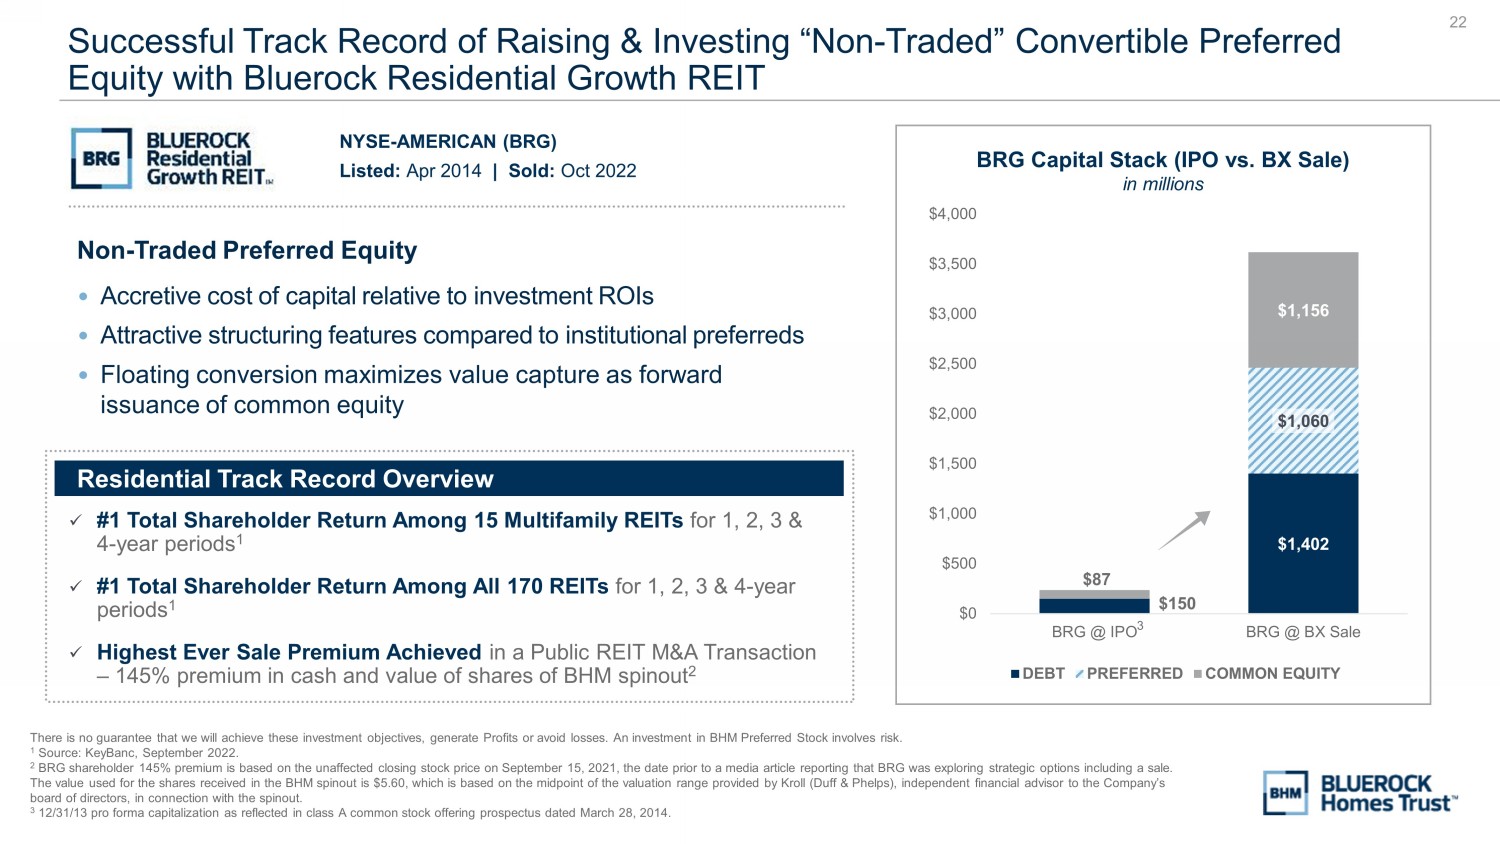
22 Successful Track Record of Raising & Investing “Non - Traded” Convertible Preferred Equity with Bluerock Residential Growth REIT There is no guarantee that we will achieve these investment objectives, generate Profits or avoid losses. An investment in BH M P referred Stock involves risk. 1 Source: KeyBanc, September 2022. 2 BRG shareholder 145% premium is based on the unaffected closing stock price on September 15, 2021, the date prior to a media ar ticle reporting that BRG was exploring strategic options including a sale. The value used for the shares received in the BHM spinout is $5.60, which is based on the midpoint of the valuation range pro vid ed by Kroll (Duff & Phelps), independent financial advisor to the Company’s board of directors, in connection with the spinout. 3 12/31/13 pro forma capitalization as reflected in class A common stock offering prospectus dated March 28, 2014. Listed: Apr 2014 | Sold: Oct 2022 NYSE - AMERICAN (BRG) BRG Capital Stack (IPO vs. BX Sale) in millions Non - Traded Preferred Equity • Accretive cost of capital relative to investment ROIs • Attractive structuring features compared to institutional preferreds • Floating conversion maximizes value capture as forward issuance of common equity Residential Track Record Overview 1 $150 $1,402 $1,060 $1,156 $0 $500 $1,000 $1,500 $2,000 $2,500 $3,000 $3,500 $4,000 BRG @ IPO BRG @ BX Sale DEBT PREFERRED COMMON EQUITY 3 $87 x #1 Total Shareholder Return Among 15 Multifamily REITs for 1, 2, 3 & 4 - year periods 1 x #1 Total Shareholder Return Among All 170 REITs for 1, 2, 3 & 4 - year periods 1 x Highest Ever Sale Premium Achieved in a Public REIT M&A Transaction – 145% premium in cash and value of shares of BHM spinout 2

23 ENVIRONMENTAL, SOCIAL AND GOVERNANCE
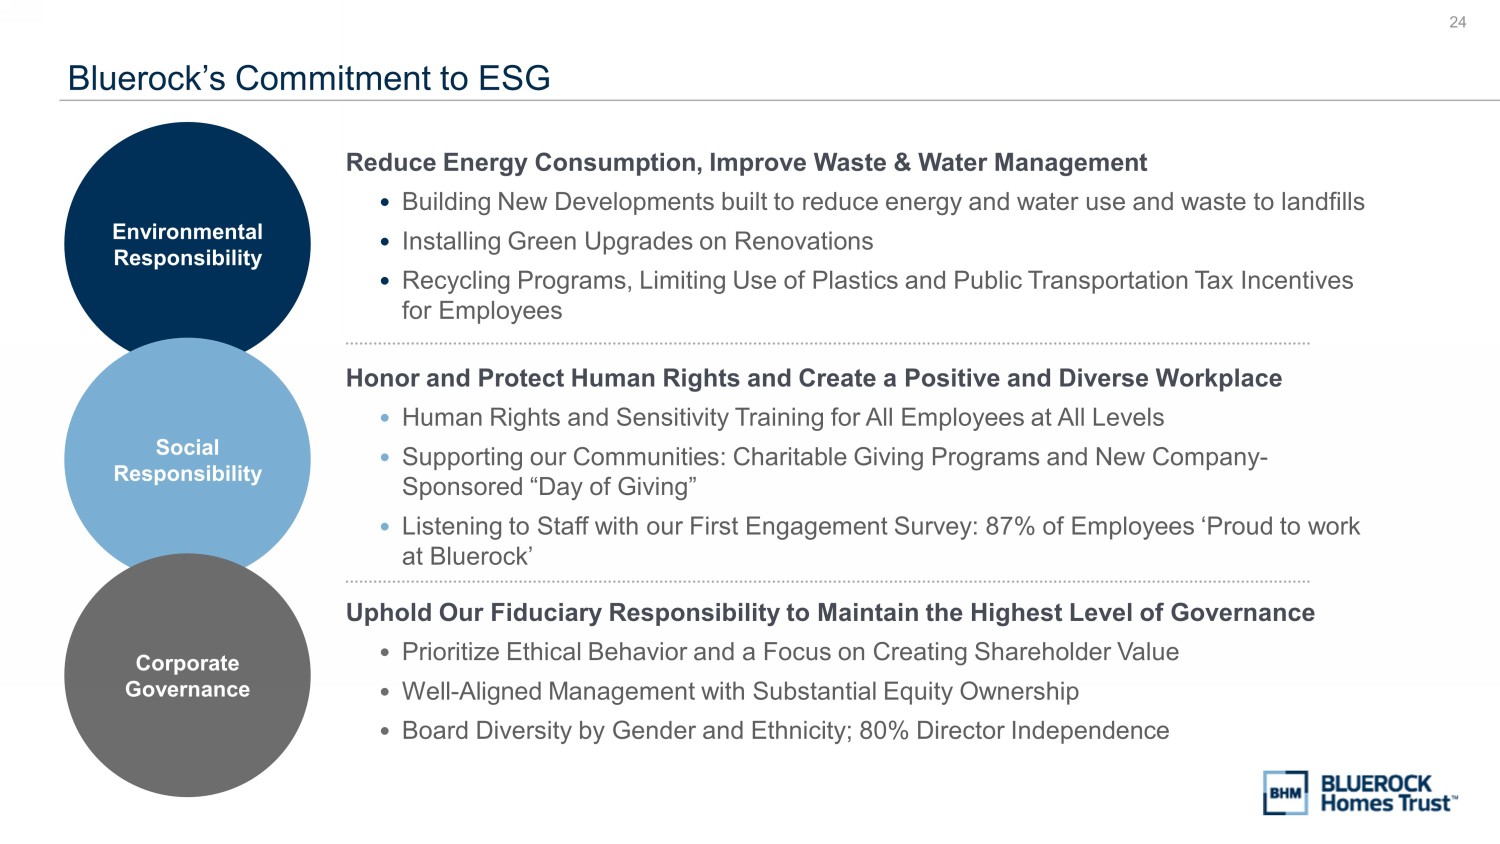
24 Bluerock’s Commitment to ESG Environmental Responsibility Social Responsibility Corporate Governance Reduce Energy Consumption, Improve Waste & Water Management • Building New Developments built to reduce energy and water use and waste to landfills • Installing Green Upgrades on Renovations • Recycling Programs, Limiting Use of Plastics and Public Transportation Tax Incentives for Employees Honor and Protect Human Rights and Create a Positive and Diverse Workplace • Human Rights and Sensitivity Training for All Employees at All Levels • Supporting our Communities: Charitable Giving Programs and New Company - Sponsored “Day of Giving” • Listening to Staff with our First Engagement Survey: 87% of Employees ‘Proud to work at Bluerock’ Uphold Our Fiduciary Responsibility to Maintain the Highest Level of Governance • Prioritize Ethical Behavior and a Focus on Creating Shareholder Value • Well - Aligned Management with Substantial Equity Ownership • Board Diversity by Gender and Ethnicity; 80% Director Independence

25 Sponsored By Listed On
v3.24.1.1.u2
Cover
|
Jun. 03, 2024 |
| Cover [Abstract] |
|
| Document Type |
8-K
|
| Amendment Flag |
false
|
| Document Period End Date |
Jun. 03, 2024
|
| Entity File Number |
001-41322
|
| Entity Registrant Name |
Bluerock Homes
Trust, Inc.
|
| Entity Central Index Key |
0001903382
|
| Entity Tax Identification Number |
87-4211187
|
| Entity Incorporation, State or Country Code |
MD
|
| Entity Address, Address Line One |
1345 Avenue of the Americas
|
| Entity Address, Address Line Two |
32nd Floor
|
| Entity Address, City or Town |
New York
|
| Entity Address, State or Province |
NY
|
| Entity Address, Postal Zip Code |
10105
|
| City Area Code |
212
|
| Local Phone Number |
843-1601
|
| Written Communications |
false
|
| Soliciting Material |
false
|
| Pre-commencement Tender Offer |
false
|
| Pre-commencement Issuer Tender Offer |
false
|
| Title of 12(b) Security |
Class
A Common Stock, $0.01 par value per share
|
| Trading Symbol |
BHM
|
| Security Exchange Name |
NYSE
|
| Entity Emerging Growth Company |
true
|
| Elected Not To Use the Extended Transition Period |
false
|
| X |
- DefinitionBoolean flag that is true when the XBRL content amends previously-filed or accepted submission.
| Name: |
dei_AmendmentFlag |
| Namespace Prefix: |
dei_ |
| Data Type: |
xbrli:booleanItemType |
| Balance Type: |
na |
| Period Type: |
duration |
|
| X |
- DefinitionFor the EDGAR submission types of Form 8-K: the date of the report, the date of the earliest event reported; for the EDGAR submission types of Form N-1A: the filing date; for all other submission types: the end of the reporting or transition period. The format of the date is YYYY-MM-DD.
| Name: |
dei_DocumentPeriodEndDate |
| Namespace Prefix: |
dei_ |
| Data Type: |
xbrli:dateItemType |
| Balance Type: |
na |
| Period Type: |
duration |
|
| X |
- DefinitionThe type of document being provided (such as 10-K, 10-Q, 485BPOS, etc). The document type is limited to the same value as the supporting SEC submission type, or the word 'Other'.
| Name: |
dei_DocumentType |
| Namespace Prefix: |
dei_ |
| Data Type: |
dei:submissionTypeItemType |
| Balance Type: |
na |
| Period Type: |
duration |
|
| X |
- DefinitionAddress Line 1 such as Attn, Building Name, Street Name
| Name: |
dei_EntityAddressAddressLine1 |
| Namespace Prefix: |
dei_ |
| Data Type: |
xbrli:normalizedStringItemType |
| Balance Type: |
na |
| Period Type: |
duration |
|
| X |
- DefinitionAddress Line 2 such as Street or Suite number
| Name: |
dei_EntityAddressAddressLine2 |
| Namespace Prefix: |
dei_ |
| Data Type: |
xbrli:normalizedStringItemType |
| Balance Type: |
na |
| Period Type: |
duration |
|
| X |
- Definition
+ References
+ Details
| Name: |
dei_EntityAddressCityOrTown |
| Namespace Prefix: |
dei_ |
| Data Type: |
xbrli:normalizedStringItemType |
| Balance Type: |
na |
| Period Type: |
duration |
|
| X |
- DefinitionCode for the postal or zip code
| Name: |
dei_EntityAddressPostalZipCode |
| Namespace Prefix: |
dei_ |
| Data Type: |
xbrli:normalizedStringItemType |
| Balance Type: |
na |
| Period Type: |
duration |
|
| X |
- DefinitionName of the state or province.
| Name: |
dei_EntityAddressStateOrProvince |
| Namespace Prefix: |
dei_ |
| Data Type: |
dei:stateOrProvinceItemType |
| Balance Type: |
na |
| Period Type: |
duration |
|
| X |
- DefinitionA unique 10-digit SEC-issued value to identify entities that have filed disclosures with the SEC. It is commonly abbreviated as CIK. Reference 1: http://www.xbrl.org/2003/role/presentationRef
-Publisher SEC
-Name Exchange Act
-Number 240
-Section 12
-Subsection b-2
| Name: |
dei_EntityCentralIndexKey |
| Namespace Prefix: |
dei_ |
| Data Type: |
dei:centralIndexKeyItemType |
| Balance Type: |
na |
| Period Type: |
duration |
|
| X |
- DefinitionIndicate if registrant meets the emerging growth company criteria. Reference 1: http://www.xbrl.org/2003/role/presentationRef
-Publisher SEC
-Name Exchange Act
-Number 240
-Section 12
-Subsection b-2
| Name: |
dei_EntityEmergingGrowthCompany |
| Namespace Prefix: |
dei_ |
| Data Type: |
xbrli:booleanItemType |
| Balance Type: |
na |
| Period Type: |
duration |
|
| X |
- DefinitionCommission file number. The field allows up to 17 characters. The prefix may contain 1-3 digits, the sequence number may contain 1-8 digits, the optional suffix may contain 1-4 characters, and the fields are separated with a hyphen.
| Name: |
dei_EntityFileNumber |
| Namespace Prefix: |
dei_ |
| Data Type: |
dei:fileNumberItemType |
| Balance Type: |
na |
| Period Type: |
duration |
|
| X |
- DefinitionTwo-character EDGAR code representing the state or country of incorporation.
| Name: |
dei_EntityIncorporationStateCountryCode |
| Namespace Prefix: |
dei_ |
| Data Type: |
dei:edgarStateCountryItemType |
| Balance Type: |
na |
| Period Type: |
duration |
|
| X |
- DefinitionThe exact name of the entity filing the report as specified in its charter, which is required by forms filed with the SEC. Reference 1: http://www.xbrl.org/2003/role/presentationRef
-Publisher SEC
-Name Exchange Act
-Number 240
-Section 12
-Subsection b-2
| Name: |
dei_EntityRegistrantName |
| Namespace Prefix: |
dei_ |
| Data Type: |
xbrli:normalizedStringItemType |
| Balance Type: |
na |
| Period Type: |
duration |
|
| X |
- DefinitionThe Tax Identification Number (TIN), also known as an Employer Identification Number (EIN), is a unique 9-digit value assigned by the IRS. Reference 1: http://www.xbrl.org/2003/role/presentationRef
-Publisher SEC
-Name Exchange Act
-Number 240
-Section 12
-Subsection b-2
| Name: |
dei_EntityTaxIdentificationNumber |
| Namespace Prefix: |
dei_ |
| Data Type: |
dei:employerIdItemType |
| Balance Type: |
na |
| Period Type: |
duration |
|
| X |
- DefinitionLocal phone number for entity.
| Name: |
dei_LocalPhoneNumber |
| Namespace Prefix: |
dei_ |
| Data Type: |
xbrli:normalizedStringItemType |
| Balance Type: |
na |
| Period Type: |
duration |
|
| X |
- DefinitionBoolean flag that is true when the Form 8-K filing is intended to satisfy the filing obligation of the registrant as pre-commencement communications pursuant to Rule 13e-4(c) under the Exchange Act. Reference 1: http://www.xbrl.org/2003/role/presentationRef
-Publisher SEC
-Name Exchange Act
-Number 240
-Section 13e
-Subsection 4c
| Name: |
dei_PreCommencementIssuerTenderOffer |
| Namespace Prefix: |
dei_ |
| Data Type: |
xbrli:booleanItemType |
| Balance Type: |
na |
| Period Type: |
duration |
|
| X |
- DefinitionBoolean flag that is true when the Form 8-K filing is intended to satisfy the filing obligation of the registrant as pre-commencement communications pursuant to Rule 14d-2(b) under the Exchange Act. Reference 1: http://www.xbrl.org/2003/role/presentationRef
-Publisher SEC
-Name Exchange Act
-Number 240
-Section 14d
-Subsection 2b
| Name: |
dei_PreCommencementTenderOffer |
| Namespace Prefix: |
dei_ |
| Data Type: |
xbrli:booleanItemType |
| Balance Type: |
na |
| Period Type: |
duration |
|
| X |
- DefinitionTitle of a 12(b) registered security. Reference 1: http://www.xbrl.org/2003/role/presentationRef
-Publisher SEC
-Name Exchange Act
-Number 240
-Section 12
-Subsection b
| Name: |
dei_Security12bTitle |
| Namespace Prefix: |
dei_ |
| Data Type: |
dei:securityTitleItemType |
| Balance Type: |
na |
| Period Type: |
duration |
|
| X |
- DefinitionName of the Exchange on which a security is registered. Reference 1: http://www.xbrl.org/2003/role/presentationRef
-Publisher SEC
-Name Exchange Act
-Number 240
-Section 12
-Subsection d1-1
| Name: |
dei_SecurityExchangeName |
| Namespace Prefix: |
dei_ |
| Data Type: |
dei:edgarExchangeCodeItemType |
| Balance Type: |
na |
| Period Type: |
duration |
|
| X |
- DefinitionBoolean flag that is true when the Form 8-K filing is intended to satisfy the filing obligation of the registrant as soliciting material pursuant to Rule 14a-12 under the Exchange Act. Reference 1: http://www.xbrl.org/2003/role/presentationRef
-Publisher SEC
-Name Exchange Act
-Section 14a
-Number 240
-Subsection 12
| Name: |
dei_SolicitingMaterial |
| Namespace Prefix: |
dei_ |
| Data Type: |
xbrli:booleanItemType |
| Balance Type: |
na |
| Period Type: |
duration |
|
| X |
- DefinitionTrading symbol of an instrument as listed on an exchange.
| Name: |
dei_TradingSymbol |
| Namespace Prefix: |
dei_ |
| Data Type: |
dei:tradingSymbolItemType |
| Balance Type: |
na |
| Period Type: |
duration |
|
| X |
- DefinitionBoolean flag that is true when the Form 8-K filing is intended to satisfy the filing obligation of the registrant as written communications pursuant to Rule 425 under the Securities Act. Reference 1: http://www.xbrl.org/2003/role/presentationRef
-Publisher SEC
-Name Securities Act
-Number 230
-Section 425
| Name: |
dei_WrittenCommunications |
| Namespace Prefix: |
dei_ |
| Data Type: |
xbrli:booleanItemType |
| Balance Type: |
na |
| Period Type: |
duration |
|
Bluerock Homes (AMEX:BHM)
Historical Stock Chart
From Dec 2024 to Jan 2025

Bluerock Homes (AMEX:BHM)
Historical Stock Chart
From Jan 2024 to Jan 2025

