AI Token The Graph (GRT) Sees Correction, But How High Can The Price Go?
February 08 2023 - 6:08AM
NEWSBTC
The price of The Graph’s native token, GRT, has gained a whopping
114% in the last seven days. However, within the last few hours,
the price has experienced a major correction of about 23%. After
trading for $0.2322 at one point, GRT is trading at $0.1871 as of
press time. While the hype around AI tokens continues to dominate
the cryptocurrency market, the correction could be due to a token
unlock from The Graph. According to on-chain analytics service
Lookonchain, The Graph Governor unlocked 36.8 million GRT and sent
18 million of them to Coinbase. As the graph below shows, almost
every time GRT reached a local top since mid-December, a
transaction was sent to Coinbase. The analyst writes: The Graph
unlocked 36.8M $GRT($7.35M) and sent 18M $GRT($3.6M) to #Coinbase 7
hrs ago! And graph.eth has been transferring $GRT to #Coinbase
at price highs almost every time since Dec 15, 2022. The price
of $GRT increases by ~60% today. How High Can The Price Of
The Graph (GRT) Rise? Since the beginning of the year, GRT has
skyrocketed a whopping 240%. However, like most altcoins, GRT is
still 93.4% away from its February 2021 all-time high of $2.84 –
which leaves a lot of potential upside. For the moment, however, a
short break from the fabulous rally seems appropriate on the
occasion of the token unlock. With an RSI of 77, the price is still
in the overbought zone on a daily basis despite the drawdown.
Related Reading: SingularityNET (AGIX) Shows No Signs Of Stopping,
As AI Crypto Blows Up 923% But since Google has also announced in
an official blog post that it intends to present its in-house chat
AI “Bard” as soon as possible, an end to investors’ interest in AI
projects is not to be expected in the near future. And also from a
chart perspective, the GRT price still offers room for a trend
continuation towards the level between $0.30 and $0.35. To confirm
its uptrend, the GRT price should first stabilize above the 23.6%
Fibonacci, which is also matched by a strong support zone at
$0.1691. A retest of this level seems likely before The Graph can
resume its rally. Then, the 38% Fibonacci retracement at $0.24
comes into focus. If the bulls continue to hold the trigger, the
upward movement could extend to the area around $0.30. This is a
crucial resistance level from May 2022, when the price fell sharply
due to the Terra Luna collapse. Related Reading: AI Crypto Fetch.ai
Shoots Up 250%, Catches More Investors’ Attention If the bulls
continue to have the upper hand, the 61% Fibonacci level at $0.36
would be of great importance. At the current price, this would
already mean a renewed doubling of the price. The long-term target
is likely to be the $0.55 level from early April 2022. In a bearish
scenario, the GRT price breaks through the important support at
$0.1691. In this case, the bears could push the price down to the
breakout level at $0.13. This would then be a key trend decision
for the price of The Graph. Featured image from The Graph, Chart
from TradingView.com
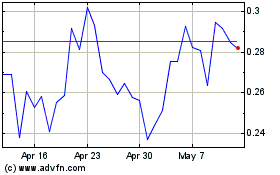
Graph Token (COIN:GRTUSD)
Historical Stock Chart
From Oct 2024 to Nov 2024

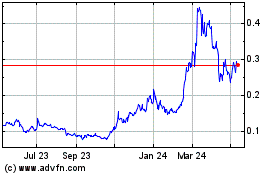
Graph Token (COIN:GRTUSD)
Historical Stock Chart
From Nov 2023 to Nov 2024


