false
0001083446
0001083446
2023-11-07
2023-11-07
iso4217:USD
xbrli:shares
iso4217:USD
xbrli:shares
UNITED STATES
SECURITIES AND
EXCHANGE COMMISSION
Washington,
DC 20549
FORM 8-K
CURRENT REPORT
Pursuant to Section 13 or 15(d)
of the
Securities Exchange Act of 1934
Date of report (Date of earliest event reported):
November 7, 2023
APOLLO MEDICAL HOLDINGS, INC.
(Exact Name of Registrant as Specified in
Charter)
| Delaware |
001-37392 |
95-4472349 |
| (State or Other Jurisdiction |
(Commission |
(I.R.S. Employer |
| of Incorporation) |
File Number) |
Identification No.) |
1668 S. Garfield Avenue, 2nd Floor, Alhambra, California 91801
(Address of Principal Executive Offices) (Zip Code)
(626) 282-0288
Registrant’s Telephone Number, Including
Area Code
(Former Name or Former Address, if Changed Since
Last Report)
Check the appropriate box below if the Form 8-K filing is intended to simultaneously satisfy the filing obligation of the registrant under
any of the following provisions:
| |
¨ |
Written communications pursuant to Rule 425 under the Securities Act (17 CFR 230.425) |
| |
¨ |
Soliciting material pursuant to Rule 14a-12 under the Exchange Act (17 CFR 240.14a-12) |
| |
¨ |
Pre-commencement communications pursuant to Rule 14d-2(b) under the Exchange Act (17 CFR 240.14d-2(b)) |
| |
¨ |
Pre-commencement communications pursuant to Rule 13e-4(c) under the Exchange Act (17 CFR 240.13e-4(c)) |
Securities registered pursuant to Section 12(b) of the Act:
| Title of each class |
Trading Symbol(s) |
Name of each exchange on which registered |
| Common Stock |
AMEH |
Nasdaq
Capital Market |
Indicate by check mark whether the registrant is an emerging growth company as defined in Rule 405 of the Securities Act of 1933 (§230.405
of this chapter) or Rule 12b-2 of the Securities Exchange Act of 1934 (§240.12b-2 of this chapter).
Emerging growth company ¨
If an emerging growth company, indicate by check mark if the registrant has elected not to use the extended transition period for complying with any new or revised financial accounting standards provided pursuant to Section 13(a) of the Exchange Act. ¨
| Item 2.02 | Results of Operations and Financial Condition. |
On November 7, 2023, Apollo
Medical Holdings, Inc. (the “Company”) issued a press release announcing its financial results for the three and nine months
ended September 30, 2023. A copy of the press release and supplemental data is furnished with this Current Report on Form 8-K as Exhibit 99.1 and Exhibit 99.2, respectively, and incorporated herein by this reference.
In accordance with General
Instruction B.2 of Form 8-K, the information furnished pursuant to this Item 2.02, including Exhibit 99.1 and Exhibit 99.2 furnished herewith,
shall not be deemed “filed” for purposes of Section 18 of the Securities Exchange Act of 1934, as amended (the “Exchange
Act”), nor shall it be deemed incorporated by reference in any filing under the Securities Act of 1933, as amended, or the Exchange
Act, except as shall be expressly set forth by specific reference in such filing.
| Item 9.01 | Financial Statements and Exhibits. |
(d) Exhibits.
SIGNATURES
Pursuant to the requirements
of the Securities Exchange Act of 1934, the registrant has duly caused this report to be signed on its behalf by the undersigned hereunto
duly authorized.
| |
APOLLO MEDICAL HOLDINGS, INC. |
| |
|
| Date: November 7, 2023 |
By: |
/s/ Thomas S. Lam |
| |
Name: |
Thomas S. Lam, M.D., M.P.H. |
| |
Title: |
Co-Chief Executive Officer and President |
Exhibit 99.1

Apollo Medical Holdings, Inc. Reports Third
Quarter 2023 Results
Company to Host Conference Call on Tuesday,
November 7, 2023, at 2:30 p.m. PT/5:30 p.m. ET
ALHAMBRA, Calif., November 7, 2023
/PRNewswire/ -- Apollo Medical Holdings, Inc. (“ApolloMed,” and together with its subsidiaries and affiliated entities, the
“Company”) (NASDAQ: AMEH), a leading physician-centric, technology-powered healthcare company focused on enabling providers
in the successful delivery of value-based care, today announced its consolidated financial results for the third quarter ended September 30,
2023.
“I’m pleased to report strong third
quarter performance with total revenue up 10% and capitated revenue up 34% compared to a year ago. We delivered a 15% adjusted EBITDA
margin, we narrowed our guidance range for the full year, and we ended the third quarter well-positioned to generate sustainable and
profitable growth going forward,” said Brandon Sim, Co-Chief Executive Officer of ApolloMed.
“Today, we also announced our intent to
acquire assets relating to Community Family Care Medical Group, which currently manages total cost of care for over 200,000 members,
diversifying our membership mix and providing us a pathway to expand our value-based Care Partners business. Additionally, we announced
two other provider group partnerships this quarter, which bring a combined membership of approximately 30,000, and our total number of
provider group partnerships signed this year so far to five,” continued Mr. Sim.
Mr. Sim concluded, “During the third quarter,
we continued to make strong progress against our key operational goals, successfully managing our value-based care population, and delivering
high-quality care. Our platform’s momentum is accelerating as we work towards our mission of ensuring that everyone across the
country has access to high-quality and high-value healthcare, and I am very excited about our opportunities ahead.”
Financial Highlights for Third Quarter Ended
September 30, 2023:
All comparisons are to the quarter ended September 30,
2022 unless otherwise stated.
| · | Total revenue of $348.2 million,
up 10% from $317.0 million |
| · | Care Partners revenue of $326.5 million,
up 11% from $293.6 million |
| · | Net income attributable to ApolloMed
of $22.1 million, compared to $23.2 million |
| · | Earnings per share - diluted (“EPS
- diluted”) of $0.47, compared to $0.50 per share |
| · | Adjusted EBITDA of $52.0 million,
compared to $57.1 million |
Financial Highlights for Nine Months Ended September 30, 2023:
All comparisons are to the nine months ended
September 30, 2022 unless otherwise stated.
| · | Total revenue of $1,033.6 million, up 22% from $850.0 million |
| · | Care Partners revenue of $966.4 million, up 24% from $782.2 million |
| · | Net income attributable to ApolloMed of $48.4 million, compared
to $48.9 million |
| · | EPS-diluted of $1.03, compared to $1.06 per share |
| · | Adjusted EBITDA of $117.6 million, compared to $116.4 million |
Recent Operating Highlights:
| · | On November 3, 2023, the Company
entered into a Third Amendment to the Amended and Restated Credit Agreement which provides
a new term loan to the Company in an aggregate amount of up to $300.0 million. This increases
the Company’s facility to $700.0 million with our existing $400.0 million revolver.
Pursuant to the Third Amendment, among other changes, ApolloMed (i) increased the maximum
levels of certain forms of permitted indebtedness, (ii) increased the maximum levels of certain
forms of restricted payments, including the ability to pursue certain specified share repurchases
(up to $300 million) subject to certain conditions and (iii) increased the maximum levels
for certain permitted investments. |
| · | On November 6, 2023, the Company
entered into a stock repurchase agreement with Allied Physicians of California, a Professional
Medical Corporation (“APC”), to repurchase approximately $100.0 million of the
Company’s common stock from APC. The Company intends to finance the share repurchase
with borrowings under its Third Amendment to the Amended and Restated Credit Agreement. |
| · | On November 7, 2023, the Company
announced that it and its affiliated professional entity have entered into an agreement to
acquire assets relating to Community Family Care Medical Group IPA, Inc. (“CFC”),
including the CFC independent physician association, the CFC Health Plan and CFC’s
management services organization entities. CFC manages the healthcare of over 200,000 members
in the Los Angeles, California area, serving patients across Medicare, Medicaid, and Commercial
payers and has a Restricted Knox Keene (“RKK”) license for Medicaid members.
The Company intends to finance the acquisition with cash on hand and borrowings under its
Third Amendment to the Amended and Restated Credit Agreement. The CFC acquisition remains
subject to customary closing conditions. |
| · | On November 7, 2023, the Company
announced a partnership with Associated Hispanic Physicians, a group of over 150 primary
care providers and over 450 specialists in Los Angeles with around 25,000 Medicaid, Medicare,
and Commercial members in value-based care arrangements, in order to support their group
with our Care Enablement offering. We expect Associated Hispanic Physicians’ providers
will be onboarded onto our Care Enablement platform by March of 2024. |
| · | On November 7, 2023, the Company
announced its expanded relationship with Advantage Health Network, a group of approximately
15 primary care providers and several hundred specialists in Los Angeles which supports around
4,500 Medicaid, Medicare, and Commercial members in value-based care arrangements. As part
of the partnership, Advantage’s providers are slated to join our Care Partners business.
We also acquired five primary care clinics in the Advantage Health Network, which will be
integrated into our Care Delivery business. |
| · | On November 7, 2023, the Company
announced its strategic partnership with Wider Circle, a peer-based community health organization
working with payers and providers to connect neighbors for better health. Under this partnership,
the two organizations will provide comprehensive patient-centered care and Enhanced Care
Management for Medicaid members with complex needs, an integral component of the California
Advancing and Innovating Medi-Cal, or CalAIM, initiative. |
Segment Results for the Third Quarter Ended
September 30, 2023:
| | |
Three
Months Ended September 30, 2023 | |
| ($
in thousands) | |
Care
Partners | | |
Care
Delivery | | |
Care
Enablement | | |
Other | | |
Intersegment
Elimination | | |
Corporate
Costs | | |
Consolidated
Total | |
| Total revenues | |
$ | 326,499 | | |
$ | 29,261 | | |
$ | 36,910 | | |
$ | 294 | | |
$ | (44,791 | ) | |
$ | — | | |
$ | 348,173 | |
| % change vs. prior year quarter | |
| 11 | % | |
| 18 | % | |
| 22 | % | |
| | | |
| | | |
| | | |
| | |
| | |
| | | |
| | | |
| | | |
| | | |
| | | |
| | | |
| | |
| Cost of services | |
| 279,769 | | |
| 25,647 | | |
| 13,658 | | |
| 76 | | |
| (43,775 | ) | |
| — | | |
| 275,375 | |
| General and administrative(1) | |
| 6,390 | | |
| 4,649 | | |
| 16,804 | | |
| 875 | | |
| (2,086 | ) | |
| 7,083 | | |
| 33,715 | |
| Total expenses | |
| 286,159 | | |
| 30,296 | | |
| 30,462 | | |
| 951 | | |
| (45,861 | ) | |
| 7,083 | | |
| 309,090 | |
| | |
| | | |
| | | |
| | | |
| | | |
| | | |
| | | |
| | |
| Income (loss) from operations | |
$ | 40,340 | | |
$ | (1,035 | ) | |
$ | 6,448 | | |
$ | (657 | ) | |
$ | 1,070 | (2) | |
$ | (7,083 | ) | |
$ | 39,083 | |
| % change vs. prior year quarter | |
| (13 | )% | |
| (133 | )% | |
| 27 | % | |
| | | |
| | | |
| | | |
| | |
(1) Balance includes general and administrative
expenses and depreciation and amortization.
(2) Income from operations for the
intersegment elimination represents rental income from segments renting from other segments. Rental income is presented within other
income which is not presented in the table.
Guidance:
ApolloMed is narrowing its full-year 2023 guidance.
The net income and EBITDA guidance ranges below include the impact of the excluded assets held by APC, which are solely for the benefit
of APC and its shareholders. Any gains or losses associated with these excluded assets do not have an impact on Adjusted EBITDA and earnings
per share — diluted. These guidance ranges are based on the Company’s existing business, current view of existing market
conditions, and assumptions for the year ending December 31, 2023.
| ($ in millions) | |
2023 Guidance Range | | |
2023 Guidance Range | |
| | |
(as of November 7, 2023) | | |
(as of February 23, 2023) | |
| | |
Low | | |
High | | |
Low | | |
High | |
| Total revenue | |
$ | 1,340.0 | | |
$ | 1,390.0 | | |
$ | 1,300.0 | | |
$ | 1,500.0 | |
| Net income | |
$ | 59.5 | | |
$ | 71.5 | | |
$ | 49.5 | | |
$ | 71.5 | |
| EBITDA | |
$ | 114.5 | | |
$ | 129.5 | | |
$ | 89.5 | | |
$ | 129.5 | |
| Adjusted EBITDA | |
$ | 135.0 | | |
$ | 150.0 | | |
$ | 120.0 | | |
$ | 160.0 | |
| EPS – diluted | |
$ | 1.10 | | |
$ | 1.20 | | |
$ | 0.95 | | |
$ | 1.20 | |
See “Guidance Reconciliation of Net Income
to EBITDA and Adjusted EBITDA” and “Use of Non-GAAP Financial Measures” below for additional information. There can
be no assurance that actual amounts will not be materially higher or lower than these expectations. See “Forward-Looking Statements”
below for additional information.
Conference Call and Webcast Information:
ApolloMed will host a conference call at 2:30 p.m. PT/5:30 p.m. ET
today (Tuesday, November 7, 2023), during which management will discuss the results of the third quarter ended September 30,
2023. To participate in the conference call, please use the following dial-in numbers about 5 minutes prior to the scheduled conference
call time:
U.S. & Canada (Toll-Free): +1 (866) 682-6100
International (Toll): +1 (862) 298-0702
The conference call can also be accessed via webcast at: https://event.choruscall.com/mediaframe/webcast.html?webcastid=woZLVfk8.
An accompanying slide presentation will be available
in PDF format on the “IR Calendar” page of the Company’s website (https://www.apollomed.net/investors/news-events/ir-calendar)
after issuance of the earnings release and will be furnished as an exhibit to ApolloMed’s current report on Form 8-K to be filed
with the SEC, accessible at www.sec.gov.
Those who are unable to attend the live conference
call may access the recording at the above webcast link, which will be made available shortly after the conclusion of the call.
Note About Consolidated Entities
The Company consolidates entities in which it
has a controlling financial interest. The Company consolidates subsidiaries in which it holds, directly or indirectly, more than 50%
of the voting rights, and variable interest entities (“VIEs”) in which the Company is the primary beneficiary. Noncontrolling
interests represent third party equity ownership interests in the Company’s consolidated entities (including certain VIEs). The
amount of net income attributable to noncontrolling interests is disclosed in the Company’s consolidated statements of income.
Note About Stockholders’ Equity,
Certain Treasury Stock and Earnings Per Share
As of the date of this press release, 41,048
holdback shares have not been issued to certain former shareholders of the Company’s subsidiary, Network Medical Management, Inc.
(“NMM”), who were NMM shareholders at the time of closing of the merger, as they have yet to submit properly completed letters
of transmittal to ApolloMed in order to receive their pro rata portion of ApolloMed’s common stock and warrants as contemplated
under that certain Agreement and Plan of Merger, dated December 21, 2016, among ApolloMed, NMM, Apollo Acquisition Corp. (“Merger
Subsidiary”) and Kenneth Sim, M.D., as amended, pursuant to which Merger Subsidiary merged with and into NMM, with NMM as the surviving
corporation. Pending such receipt, such former NMM shareholders have the right to receive, without interest, their pro rata share of
dividends or distributions with a record date after the effectiveness of the merger. The Company’s consolidated financial statements
have treated such shares of common stock as outstanding, given the receipt of the letter of transmittal is considered perfunctory and
ApolloMed is legally obligated to issue these shares in connection with the merger.
Shares of ApolloMed’s common stock owned
by Allied Physicians of California, a Professional Medical Corporation d.b.a. Allied Pacific of California (“APC”), a VIE
of the Company, are legally issued and outstanding but excluded from shares of common stock outstanding in the Company’s consolidated
financial statements, as such shares are treated as treasury shares for accounting purposes. Such shares, therefore, are not included
in the number of shares of common stock outstanding used to calculate the Company’s earnings per share.
About Apollo Medical Holdings, Inc.
ApolloMed is a leading physician-centric, technology-powered,
risk-bearing healthcare company. Leveraging its proprietary end-to-end technology solutions, ApolloMed operates an integrated healthcare
delivery platform that enables providers to successfully participate in value-based care arrangements, thus empowering them to deliver
outcomes-based medical care to patients in a cost-effective manner.
Headquartered in Alhambra, California, ApolloMed’s
subsidiaries and affiliates include management services organizations (MSOs), affiliated independent practice associations (IPAs), and
entities participating in the Centers for Medicare & Medicaid Services Innovation Center (CMMI) innovation models. For more information,
please visit www.apollomed.net.
Forward-Looking Statements
This press release contains forward-looking
statements within the meaning of the Private Securities Litigation Reform Act of 1995, such as statements about the Company’s guidance
for the year ending December 31, 2023, ability to meet operational goals, ability to meet expectations in deployment of care coordination
and management capabilities, ability to decrease cost of care while improving quality and outcomes, ability to deliver sustainable revenue
and EBITDA growth as well as long-term value, ability to respond to the changing environment, and successful implementation of strategic
growth plans, acquisition strategy, and merger integration efforts. Forward-looking statements reflect current views with respect to
future events and financial performance and therefore cannot be guaranteed. Such statements are based on the current expectations and
certain assumptions of the Company’s management, and some or all of such expectations and assumptions may not materialize or may
vary significantly from actual results. Actual results may also vary materially from forward-looking statements due to risks, uncertainties
and other factors, known and unknown, including the risk factors described from time to time in the Company’s reports to the SEC,
including, without limitation, the risk factors discussed in the Company’s Annual Report on Form 10-K/A for the year ended December
31, 2022, and any subsequent quarterly reports on Form 10-Q. Any forward-looking statement made by the Company in this release speaks
only as of the date on which it is made. The Company undertakes no obligation to publicly update any forward-looking statement, whether
as a result of new information, future developments or otherwise, except as may be required by any applicable securities laws.
Restatement
In connection with a review of the Company’s
income tax filing structure, the Company identified unintentional errors in its accounting for the income tax effects of certain intercompany
dividends and certain net operating losses, which resulted in an understatement of income tax expense in prior periods and also had an
impact on purchase accounting (goodwill) as a portion of the net operating losses affected by the errors pertained to acquisitions in
prior periods. As a result of the errors, the Company has restated the December 31, 2022 consolidated balance sheet and the consolidated
statement of operations for each of the three and nine months ended September 30, 2022.
FOR MORE INFORMATION, PLEASE CONTACT:
Investor Relations
(626) 943-6491
investors@apollomed.net
Asher Dewhurst, ICR Westwicke
ApolloMedIR@westwicke.com
APOLLO MEDICAL HOLDINGS, INC.
CONSOLIDATED BALANCE SHEETS
(IN
THOUSANDS, EXCEPT SHARE AND PER SHARE DATA)
| | |
September 30,
2023 | | |
December 31,
2022 | |
| | |
| (Unaudited) | | |
| As restated | |
| Assets | |
| | | |
| | |
| | |
| | | |
| | |
| Current assets | |
| | | |
| | |
| Cash and cash equivalents | |
$ | 273,941 | | |
$ | 288,027 | |
| Investments in marketable securities | |
| 3,021 | | |
| 5,567 | |
| Receivables, net | |
| 95,892 | | |
| 49,631 | |
| Receivables, net – related parties | |
| 86,948 | | |
| 65,147 | |
| Other receivables | |
| 1,501 | | |
| 1,834 | |
| Prepaid expenses and other current assets | |
| 13,953 | | |
| 14,798 | |
| Loans receivable | |
| 973 | | |
| 996 | |
| Loan receivable – related party | |
| — | | |
| 2,125 | |
| | |
| | | |
| | |
| Total current assets | |
| 476,229 | | |
| 428,125 | |
| | |
| | | |
| | |
| Non-current assets | |
| | | |
| | |
| Land, property, and equipment, net | |
| 128,575 | | |
| 108,536 | |
| Intangible assets, net | |
| 74,209 | | |
| 76,861 | |
| Goodwill | |
| 275,528 | | |
| 269,053 | |
| Income taxes receivable, non-current | |
| 15,943 | | |
| 15,943 | |
| Loan receivable, non-current | |
| 25,040 | | |
| — | |
| Investments in other entities – equity method | |
| 44,428 | | |
| 40,299 | |
| Investments in privately held entities | |
| 2,896 | | |
| 896 | |
| Restricted cash, non-current | |
| 345 | | |
| — | |
| Operating lease right-of-use assets | |
| 21,482 | | |
| 20,444 | |
| Other assets | |
| 8,586 | | |
| 6,056 | |
| | |
| | | |
| | |
| Total non-current assets | |
| 597,032 | | |
| 538,088 | |
| | |
| | | |
| | |
| Total assets(1) | |
$ | 1,073,261 | | |
$ | 966,213 | |
| | |
| | | |
| | |
| Liabilities, mezzanine equity and equity | |
| | | |
| | |
| | |
| | | |
| | |
| Current liabilities | |
| | | |
| | |
| | |
| | | |
| | |
| Accounts payable and accrued expenses | |
$ | 53,136 | | |
$ | 49,562 | |
| Fiduciary accounts payable | |
| 6,257 | | |
| 8,065 | |
| Medical liabilities | |
| 97,519 | | |
| 81,255 | |
| Income taxes payable | |
| 30,112 | | |
| 4,279 | |
| Dividend payable | |
| 638 | | |
| 664 | |
| Finance lease liabilities | |
| 655 | | |
| 594 | |
| Operating lease liabilities | |
| 3,528 | | |
| 3,572 | |
| | |
September 30,
2023 | | |
December 31,
2022 | |
| Current portion of long-term debt | |
| 2,991 | | |
| 619 | |
| Other liabilities | |
| 8,121 | | |
| — | |
| Total current liabilities | |
| 202,957 | | |
| 148,610 | |
| | |
| | | |
| | |
| Non-current liabilities | |
| | | |
| | |
| Deferred tax liability | |
| 12,145 | | |
| 14,217 | |
| Finance lease liabilities, net of current portion | |
| 1,195 | | |
| 1,275 | |
| Operating lease liabilities, net of current portion | |
| 21,006 | | |
| 19,915 | |
| Long-term debt, net of current portion and deferred financing costs | |
| 206,213 | | |
| 203,389 | |
| Other long-term liabilities | |
| 14,105 | | |
| 20,260 | |
| | |
| | | |
| | |
| Total non-current liabilities | |
| 254,664 | | |
| 259,056 | |
| | |
| | | |
| | |
| Total liabilities(1) | |
| 457,621 | | |
| 407,666 | |
| | |
| | | |
| | |
| Mezzanine equity | |
| | | |
| | |
| Non-controlling interest in Allied Physicians of California, a Professional Medical Corporation | |
| 17,931 | | |
| 14,237 | |
| | |
| | | |
| | |
| Stockholders’ equity | |
| | | |
| | |
| Series A Preferred stock, par value $0.001; 5,000,000 shares authorized (inclusive of Series B Preferred stock); 1,111,111 issued and zero outstanding | |
| — | | |
| — | |
| Series B Preferred stock, par value $0.001; 5,000,000 shares authorized (inclusive of Series A Preferred stock); 555,555 issued and zero outstanding | |
| — | | |
| — | |
| Common stock, $0.001 par value per share; 100,000,000 shares authorized, 46,607,356 and 46,575,699 shares issued and outstanding, excluding 10,569,340 and 10,299,259 treasury shares, at September 30, 2023, and December 31, 2022, respectively | |
| 47 | | |
| 47 | |
| Additional paid-in capital | |
| 362,889 | | |
| 360,097 | |
| Retained earnings | |
| 230,778 | | |
| 182,417 | |
| Total stockholders’ equity | |
| 593,714 | | |
| 542,561 | |
| | |
| | | |
| | |
| Non-controlling interest | |
| 3,995 | | |
| 1,749 | |
| | |
| | | |
| | |
| Total equity | |
| 597,709 | | |
| 544,310 | |
| | |
| | | |
| | |
| Total liabilities, mezzanine equity and equity | |
$ | 1,073,261 | | |
$ | 966,213 | |
(1) The Company’s consolidated
balance sheets include the assets and liabilities of its consolidated variable interest entities (“VIEs”). The consolidated
balance sheets include total assets that can be used only to settle obligations of the Company’s consolidated VIEs totaling $554.0 million
and $523.7 million as of September 30, 2023 and December 31, 2022, respectively, and total liabilities of the Company’s
consolidated VIEs for which creditors do not have recourse to the general credit of the primary beneficiary of $142.4 million and
$131.8 million as of September 30, 2023 and December 31, 2022, respectively. The VIE balances do not include $317.7 million
of investment in affiliates and $16.3 million of amounts due to affiliates as of September 30, 2023 and $304.8 million
of investment in affiliates and $30.3 million of amounts due from affiliates as of December 31, 2022 as these are eliminated
upon consolidation and not presented within the consolidated balance sheets.
APOLLO MEDICAL HOLDINGS, INC.
CONSOLIDATED STATEMENTS OF OPERATIONS
(IN THOUSANDS, EXCEPT SHARE AND PER SHARE AMOUNTS)
(UNAUDITED)
| |
|
Three Months Ended
September 30, |
|
|
Nine Months Ended
September 30, |
|
| |
|
2023 |
|
|
2022 |
|
|
2023 |
|
|
2022 |
|
| |
|
|
|
|
(Restated) |
|
|
|
|
|
(Restated) |
|
| Revenue |
|
|
|
|
|
|
|
|
|
|
|
|
| Capitation, net |
|
$ |
305,678 |
|
|
$ |
227,571 |
|
|
$ |
906,430 |
|
|
$ |
677,253 |
|
| Risk pool settlements and incentives |
|
|
15,022 |
|
|
|
64,849 |
|
|
|
48,605 |
|
|
|
101,717 |
|
| Management fee income |
|
|
9,898 |
|
|
|
10,030 |
|
|
|
32,287 |
|
|
|
30,487 |
|
| Fee-for-service, net |
|
|
15,892 |
|
|
|
12,859 |
|
|
|
41,216 |
|
|
|
35,694 |
|
| Other revenue |
|
|
1,683 |
|
|
|
1,692 |
|
|
|
5,087 |
|
|
|
4,804 |
|
| |
|
|
|
|
|
|
|
|
|
|
|
|
|
|
|
|
| Total revenue |
|
|
348,173 |
|
|
|
317,001 |
|
|
|
1,033,625 |
|
|
|
849,955 |
|
| |
|
|
|
|
|
|
|
|
|
|
|
|
|
|
|
|
| Operating expenses |
|
|
|
|
|
|
|
|
|
|
|
|
|
|
|
|
| Cost of services, excluding depreciation and amortization |
|
|
275,375 |
|
|
|
240,768 |
|
|
|
857,648 |
|
|
|
691,566 |
|
| General and administrative expenses |
|
|
29,410 |
|
|
|
21,388 |
|
|
|
74,648 |
|
|
|
53,224 |
|
| Depreciation and amortization |
|
|
4,305 |
|
|
|
4,754 |
|
|
|
12,846 |
|
|
|
13,480 |
|
| |
|
|
|
|
|
|
|
|
|
|
|
|
|
|
|
|
| Total expenses |
|
|
309,090 |
|
|
|
266,910 |
|
|
|
945,142 |
|
|
|
758,270 |
|
| |
|
|
|
|
|
|
|
|
|
|
|
|
|
|
|
|
| Income from operations |
|
|
39,083 |
|
|
|
50,091 |
|
|
|
88,483 |
|
|
|
91,685 |
|
| |
|
|
|
|
|
|
|
|
|
|
|
|
|
|
|
|
| Other income (expense) |
|
|
|
|
|
|
|
|
|
|
|
|
|
|
|
|
| (Loss) income from equity method investments |
|
|
(2,104 |
) |
|
|
1,452 |
|
|
|
3,104 |
|
|
|
4,397 |
|
| Interest expense |
|
|
(3,779 |
) |
|
|
(2,422 |
) |
|
|
(10,680 |
) |
|
|
(5,348 |
) |
| Interest income |
|
|
3,281 |
|
|
|
223 |
|
|
|
9,617 |
|
|
|
690 |
|
| Unrealized loss on investments |
|
|
(342 |
) |
|
|
(6,763 |
) |
|
|
(5,875 |
) |
|
|
(17,591 |
) |
| Other income (expense) |
|
|
1,876 |
|
|
|
(1,318 |
) |
|
|
4,265 |
|
|
|
2,328 |
|
| |
|
|
|
|
|
|
|
|
|
|
|
|
|
|
|
|
| Total other (expense) income, net |
|
|
(1,068 |
) |
|
|
(8,828 |
) |
|
|
431 |
|
|
|
(15,524 |
) |
| |
|
|
|
|
|
|
|
|
|
|
|
|
|
|
|
|
| Income before provision for income taxes |
|
|
38,015 |
|
|
|
41,263 |
|
|
|
88,914 |
|
|
|
76,161 |
|
| |
|
|
|
|
|
|
|
|
|
|
|
|
|
|
|
|
| Provision for income taxes |
|
|
10,042 |
|
|
|
17,366 |
|
|
|
30,971 |
|
|
|
29,537 |
|
| |
|
|
|
|
|
|
|
|
|
|
|
|
|
|
|
|
| Net income |
|
|
27,973 |
|
|
|
23,897 |
|
|
|
57,943 |
|
|
|
46,624 |
|
| |
|
|
|
|
|
|
|
|
|
|
|
|
|
|
|
|
| Net income (loss) attributable to non-controlling interest |
|
|
5,914 |
|
|
|
712 |
|
|
|
9,582 |
|
|
|
(2,275 |
) |
| |
|
|
|
|
|
|
|
|
|
|
|
|
|
|
|
|
| Net income attributable to Apollo Medical Holdings, Inc. |
|
$ |
22,059 |
|
|
$ |
23,185 |
|
|
$ |
48,361 |
|
|
$ |
48,899 |
|
| |
|
|
|
|
|
|
|
|
|
|
|
|
|
|
|
|
| Earnings per share – basic |
|
$ |
0.47 |
|
|
$ |
0.52 |
|
|
$ |
1.04 |
|
|
$ |
1.09 |
|
| |
|
|
|
|
|
|
|
|
|
|
|
|
|
|
|
|
| Earnings per share – diluted |
|
$ |
0.47 |
|
|
$ |
0.50 |
|
|
$ |
1.03 |
|
|
$ |
1.06 |
|
| |
|
|
|
|
|
|
|
|
|
|
|
|
|
|
|
|
| Weighted average shares used in computing earnings per share: |
|
|
|
|
|
|
|
|
|
|
|
|
|
|
|
|
| Basic |
|
|
46,547,502 |
|
|
|
44,946,725 |
|
|
|
46,527,350 |
|
|
|
44,795,295 |
|
| Diluted |
|
|
46,920,607 |
|
|
|
46,152,536 |
|
|
|
46,881,567 |
|
|
|
45,993,001 |
|
Reconciliation of Net Income to EBITDA and Adjusted EBITDA
| | |
Three Months Ended September 30, | | |
Nine Months Ended September 30, | |
| (in thousands) | |
2023 | | |
2022 | | |
2023 | | |
2022 | |
| | |
| | |
(Restated) | | |
| | |
(Restated) | |
| Net income | |
$ | 27,973 | | |
$ | 23,897 | | |
$ | 57,943 | | |
$ | 46,624 | |
| Interest expense | |
| 3,779 | | |
| 2,422 | | |
| 10,680 | | |
| 5,348 | |
| Interest income | |
| (3,281 | ) | |
| (223 | ) | |
| (9,617 | ) | |
| (690 | ) |
| Provision for income taxes | |
| 10,042 | | |
| 17,366 | | |
| 30,971 | | |
| 29,537 | |
| Depreciation and amortization | |
| 4,305 | | |
| 4,754 | | |
| 12,846 | | |
| 13,480 | |
| EBITDA | |
| 42,818 | | |
| 48,216 | | |
| 102,823 | | |
| 94,299 | |
| | |
| | | |
| | | |
| | | |
| | |
| Income from equity method investments | |
| 2,016 | | |
| (1,469 | ) | |
| (3,160 | ) | |
| (4,358 | ) |
| Other, net | |
| 1,723 | (1) | |
| 1,382 | (2) | |
| 1,507 | (1) | |
| 1,382 | (2) |
| Stock-based compensation | |
| 5,706 | | |
| 3,502 | | |
| 13,364 | | |
| 10,477 | |
| APC excluded assets costs | |
| (289 | )(3) | |
| 5,505 | | |
| 3,039 | (3) | |
| 14,574 | |
| Adjusted EBITDA | |
$ | 51,974 | | |
$ | 57,136 | | |
$ | 117,573 | | |
$ | 116,374 | |
(1) Other, net for the three and nine
months ended September 30, 2023 relates to transaction costs incurred for our investments and tax restructuring fees and non-cash
changes related to change in the fair value of our financing obligation to purchase the remaining equity interests, changes in the fair
value of our contingent liabilities, and changes in the fair value of the Company's Collar Agreement.
(2) Other, net for the three and nine
months ended September 30, 2022 relates to transaction costs incurred, net of the write-off related to APCMG contingent consideration
to reflect the fair value as of September 30, 2022.
(3) Certain APC minority interests
where APC owns the asset but not the right to the dividends is reclassified from APC excluded asset costs to income from equity method
investments
Guidance Reconciliation of Net Income to EBITDA and Adjusted EBITDA
| | |
2023 Guidance Range | | |
2023 Guidance Range | |
| | |
(as of November 7, 2023) | | |
(as of February 23, 2023) | |
| (in thousands) | |
Low | | |
High | | |
Low | | |
High | |
| Net income | |
$ | 59,500 | | |
$ | 71,500 | | |
$ | 49,500 | | |
$ | 71,500 | |
| Interest expense | |
| 1,500 | | |
| 1,500 | | |
| 1,000 | | |
| 1,000 | |
| Provision for income taxes | |
| 36,500 | | |
| 39,500 | | |
| 23,000 | | |
| 38,000 | |
| Depreciation and amortization | |
| 17,000 | | |
| 17,000 | | |
| 16,000 | | |
| 19,000 | |
| EBITDA | |
| 114,500 | | |
| 129,500 | | |
| 89,500 | | |
| 129,500 | |
| | |
| | | |
| | | |
| | | |
| | |
| Loss (income) from equity method investments | |
| (4,500 | ) | |
| (4,500 | ) | |
| (750 | ) | |
| (750 | ) |
| Other, net | |
| 1,000 | | |
| 1,000 | | |
| 3,250 | | |
| 3,250 | |
| Stock-based compensation | |
| 20,000 | | |
| 20,000 | | |
| 16,000 | | |
| 16,000 | |
| APC excluded assets costs | |
| 4,000 | | |
| 4,000 | | |
| 12,000 | | |
| 12,000 | |
| Adjusted EBITDA | |
$ | 135,000 | | |
$ | 150,000 | | |
$ | 120,000 | | |
$ | 160,000 | |
Use of Non-GAAP Financial Measures
This Quarterly Report on Form 10-Q contains the
non-GAAP financial measures EBITDA and Adjusted EBITDA, of which the most directly comparable financial measure presented in accordance
with U.S. generally accepted accounting principles (“GAAP”) is net income. These measures are not in accordance with, or
alternatives to GAAP, and may be different from other non-GAAP financial measures used by other companies. The Company uses Adjusted
EBITDA as a supplemental performance measure of our operations, for financial and operational decision-making, and as a supplemental
means of evaluating period-to-period comparisons on a consistent basis. Adjusted EBITDA is calculated as earnings before interest, taxes,
depreciation, and amortization, excluding income or loss from equity method investments, non-recurring and non-cash transactions, stock-based
compensation, and APC excluded assets costs. Beginning in the third quarter ended September 30, 2022, the Company has revised the calculation
for Adjusted EBITDA to exclude provider bonus payments and losses from recently acquired IPAs, which it believes to be more reflective
of its business.
The Company believes the presentation of these
non-GAAP financial measures provides investors with relevant and useful information, as it allows investors to evaluate the operating
performance of the business activities without having to account for differences recognized because of non-core or non-recurring financial
information. When GAAP financial measures are viewed in conjunction with non-GAAP financial measures, investors are provided with a more
meaningful understanding of the Company’s ongoing operating performance. In addition, these non-GAAP financial measures are among
those indicators the Company uses as a basis for evaluating operational performance, allocating resources, and planning and forecasting
future periods. Non-GAAP financial measures are not intended to be considered in isolation, or as a substitute for, GAAP financial measures.
Other companies may calculate both EBITDA and Adjusted EBITDA differently, limiting the usefulness of these measures for comparative
purposes. To the extent this release contains historical or future non-GAAP financial measures, the Company has provided corresponding
GAAP financial measures for comparative purposes. The reconciliation between certain GAAP and non-GAAP measures is provided above.
Exhibit 99.2

Powered by Technology. Built by Doctors. For Patients. Apollo Medical Holdings (NASDAQ: AMEH) Third Quarter 2023 Earnings Call Supplement November 7, 2023

Forward - Looking Statements This presentation contains forward - looking statements within the meaning of the Private Securities Litigation Reform Act of 1995 , Section 27A of the Securities Act and Section 21E of the Exchange Act. Forward - looking statements include any statements about t he Company's business, financial condition, operating results, plans, objectives, expectations and intentions, expansion plans, int egration of acquired companies and any projections of earnings, revenue, EBITDA, Adjusted EBITDA or other financial items, such as the Company's projected capitation and future liquidity, and may be identified by the use of forward - looking terms such as “anticipa te,” “could,” “can,” “may,” “might,” “potential,” “predict,” “should,” “estimate,” “expect,” “project,” “believe,” “plan,” “envisi on, ” “intend,” “continue,” “target,” “seek,” “will,” “would,” and the negative of such terms, other variations on such terms or other simila r o r comparable words, phrases or terminology. Forward - looking statements reflect current views with respect to future events and financial performance and therefore cannot be guaranteed. Such statements are based on the current expectations and certain assumptions of the Company’s management, and some or all of such expectations and assumptions may not materialize or may vary significantly from actual results. Actual results may also vary materially from forward - looking statements due to risks, uncerta inties and other factors, known and unknown, including the risk factors described from time to time in the Company’s reports to the U.S. Securities and Exchange Commission (the “SEC”), including without limitation the risk factors discussed in the Company's Annu al Report on Form 10 - K for the year ended December 31, 2022, and subsequent Quarterly Reports on Form 10 - Q. Because the factors referred to above could cause actual results or outcomes to differ materially from those expressed or imp lie d in any forward - looking statements, you should not place undue reliance on any such forward - looking statements. Any forward - looking statements speak only as of the date of this presentation and, unless legally required, the Company does not undertake any ob lig ation to update any forward - looking statement, as a result of new information, future events or otherwise. 2

ApolloMed At - A - Glance 3 ApolloMed is a technology powered, risk - bearing healthcare platform and healthcare provider supporting physicians and patients in delivering value - based care. The three pillars of our business are: 25% Revenue growth CAGR from 2019 - 2023E 30+ Markets $141M TTM Adj. EBITDA Care Delivery: Owned and operated facilities delivering primary care, specialty care, and ancillary services Care Partners: Network of employed and partnered providers, organized into multi - payer risk - bearing entities 0.9M Total value - based lives 20+ Payer partners $1.3B TTM revenue Note: 1. ApolloMed Medicare Advantage and ACO clinical outcomes as of 06/30/2023 vs. CMS benchmark; CMS. Office of Enterprise Data and Analytic s Care Enablement: Technology platform to support independent and partnered physicians and medical groups in delivering patient care 61% Lower vs. benchmark for ER visits / k (1) 54% Lower inpatient bed days / k (1)

ApolloMed can flexibly support patients and providers across segment offerings depending on their needs 4 Qtr ended 09/30/2023 $ in millions Total revenues, $M Income (loss) from operations, $M % Margin Total members in VBC 1 , K Primary Revenue Model Degree of Risk Care Partners High - performing network of aligned provider partners $326M $40M 12 % ~600K Partial & full - risk Care Delivery High - quality system of employed partner providers $29M ( $1M) (3.5 %) ~ 7 00K Partial & full - risk PMPM payments Partial & full - risk Care Enablement End - to - end integrated clinical, operational, financial, and administrative platform $37M $6M 16 % ~900K Partial & full - risk PMPM payments FFS N/A Percentage of premium opp. 80 - 90% 80 - 90% 10 - 15% LT profitability target 10 - 20% 10 - 20% 20 - 30% Percent of collections/revenue (1) Members in value - based care arrangements for Care Partners or Care Enablement; unique visits over LTM for Care Delivery

Our comprehensive and flexible platform allows us to deliver care via our owned and partnered entities 5 Specialists Ancillary ACO Network Independent Physician Associations and Networks ApolloMed Ecosystem • Patients receive care through our high - quality employed providers • Providers include primary care and specialty clinics, ASCs, SNFs, UCs, labs, and diagnostics centers • Platform supports capitation, shared savings, FFS and other flexible VBC arrangements • Leveraged across Care Partners, Care Delivery and 3 rd party providers • 20+ payer partners • ~15 years avg partnership • 10,000+ contracted providers across all specialties • P ayer agnostic, serving all patients (Medicare FFS, MA, Medicaid, Commercial, and Exchange) Primary Care Providers Care Partners Care Delivery Care Enablement

Historical Financial Profile 6 2021 Adjusted EBITDA benefitted from tailwinds of lower utilization during the COVID - 19 pandemic; Return to pre - pandemic utilization in 2022 and 2023 $561 $687 $774 $1,144 $1,340 - $1,390 Historical Revenue Growth ($ in millions) 2019 2020 2021 2022 2023E 25% CAGR from 2019 - 2023E $54.2 $102.8 $133.5 $140.0 ($ in millions) Historical Adjusted EBITDA (1) 27% CAGR from 2019 - 2023E 2019 2020 2021 2022 2023E $135.0 - $150.0 (1) See “Use of Non - GAAP Financial Measures” slide for more information

Revenue Breakdown 7 Note: For the nine months ended September 30, 2023 Revenue by Line of Business Business Mix By Payer Type 87% 5% 3% 4% 1% Capitation, net Risk Pool Settlements & Incentives Management Fee Income Fee-for-service, net Other Income 63% 20% 12% 5% Medicare Medicaid Commerical Other Third Parties

Grow Within Existing Markets • Continue to build a strong core in the Southern California market with an emphasis on access to care and delivering culturally - aligned care to our communities ApolloMed’s multi - pronged growth strategy 8 Expand Into New Markets • Transform healthcare for local communities across the country by partnering with new provider groups, building care delivery capabilities, and extending payer relationships nationally Deepen Integration Across ApolloMed’s Segments • Increase growth of existing Care Enablement providers as they integrate more deeply into ApolloMed ’s ecosystem as Care Partners Advance Contracts Across Risk Spectrum • Migrate member lives under partial risk contracts into full risk and total cost of care arrangements Identify Opportunities For M&A • Continue to execute on M&A strategy across all segments and lines of business

Community Family Care Acquisition

Our M&A playbook enables us to effectively scale and enter into new markets 10 • 2023E Revenue: $190M • 2023E EBITDA: $25M • FV / 2023E EBITDA: 8.1x Financial Highlights Total Consideration • $20 2 M total consideration o $152M cash, $20M equity, $30M performance - based milestone payments • Two - part close to occur, anticipated in Q1 2024 Expected Closing Transaction Highlights • CFC’s unique network of providers focused on Medicaid strengthens ApolloMed’s ability to reach underserved populations • ApolloMed deepens relationship with CFC providers as they join capitated, full - risk Care Partners segment • CFC’s 18% revenue CAGR and 35% EBITDA CAGR since ApolloMed began managing in 2020, showing success in CE 1 positioning for even more success in CP 2 • Highly attractive synergy opportunities: o Transition CFC Medicare members to full risk o Transition ApolloMed CA Medicaid members to full risk Strategic Rationale • CFC is a scaled Medicaid focused provider group with over 200k patients across Medicare, Medicaid and Commercial payers in LA County • CFC already bears f ull - risk on Medicaid members via RKK health plan license Community Family Care (“CFC”) Overview (1) Care Enablement (2) Care Partners Breadth of CFC Provider Network and Membership Concentration

Q3 2023 Update

Q3 2023 performance highlights; Updated 2023E Guidance 12 Total Revenue $1,144.2 $1,340.0 - $1,390.0 Net Income 1 $45.7 $59.5 - $71.5 EBITDA 1,2 $110.1 $114.5 - $129.5 Adjusted EBITDA 2 $140.0 $135.0 - $150.0 EPS - Diluted $0.99 $1.10 - $1.20 Q3 2023 financial results ($ in millions, except for per share information) Actual YE 2022 Results 2023 Guidance Range Revenue $348.2M Net income attr. to AMEH $22.1M EPS – diluted $0.47 Adj. EBITDA* $52.0M (1)Net income and EBITDA forecast includes the impact of APC excluded assets, which assume no change in value. (2)See “Reconciliation of Net Income to EBITDA and Adjusted EBITDA,” “Guidance Reconciliation of Net Income to EBITDA and Adj ust ed EBITDA” and “Use of Non - GAAP Financial Measures” slides for more information. There can be no assurance that actual amounts will not be materially higher or lower than these exp ectations. See “Forward - Looking Statements” on slide 2.

Q3 2023 operational highlights 13 • Acquisition of Community Family Care and integration into Care Partner segment by end of 2023 while continuing to leverage our Care Enablement platform • Advantage Health Network acquisition into Care Partners while continuing to be on our Care Enablement platform • Acquisition of Ardmore Medical Clinic into our Care Delivery segment • Associated Hispanic Partners will be onboarded onto Care Enablement platform by Q1 2024 • Wider Circle – Enhanced Care Management joint venture provides comprehensive patient - centered care for Medicaid members with complex needs Care Enablement Care Delivery Care Partners

10% - 17% adj. EBITDA margins over the last 4 years 2 Bed days 54% below benchmark; ER visits 61% below benchmark 3 0.9M members in VBC arrangements across Medicare, Medicaid, and Commercial 4 27% 4 - year EBITDA CAGR with 15% EBITDA margins at scale Key takeaways Strongly positioned to create a future where all can get access to high quality healthcare Proven track record of consistent profitability Tech - powered, integrated care delivery model results in industry - leading clinical outcomes Flexible, capital efficient model with predictable unit economics Clear levers and a repeatable growth playbook to drive further nationwide expansion (1) Growth figures are based on historical revenue and estimates through FY 2023 (2) See the “TTM and Year - end Reconciliation of Net Income to EBITDA and Adjusted EBITDA” slide for additional information. (3) Across all consolidated ApolloMed IPAs for Medicare Advantage as of 6/30/2023, benchmarks derived from CMS data (4) As of 9/30/2023 25% 4 - year revenue CAGR with clear visibility into continued 25%+ growth 1 14

Summary of Selected Financial Results 15 Three Months Ended September 30, Nine Months Ended September 30, $ in 000s except per share data 2023 2022 (restated) 2023 2022 (restated) Revenue Capitation, net $ 305,678 $ 227,571 $ 906,430 $ 677,253 Risk pool settlements and incentives 15,022 64,849 48,605 101,717 Management fee income 9,898 10,030 32,287 30,487 Fee - for - service, net 15,892 12,859 41,216 35,694 Other income 1,683 1,692 5,087 4,804 Total revenue 348,173 317,001 1,033,625 849,955 Total expenses 309,090 266,910 945,142 758,270 Income from operations 39,083 50,091 88,483 91,685 Net income 27,973 23,897 57,943 46,624 Net income (loss) attributable to noncontrolling interests 5,914 712 9,582 (2,275) Net income attributable to ApolloMed $ 22,059 $ 23,185 $ 48,361 $ 48,899 Earnings per share – diluted $ 0.47 $ 0.50 $ 1.03 $ 1.06 EBITDA $ 42,818 $ 48,216 $ 102,823 $ 94,299 Adjusted EBITDA $ 51,974 $ 57,136 $ 117,573 $ 116,374

Segment Results 16 $ in 000s Care Partners Care Delivery Care Enablement Other Intersegment Elimination Corporate Costs Consolidated Total Total revenues $ 326,499 29,261 36,910 294 (44,791) - 348,173 % change vs prior year quarter 11% 18% 22% 10% Cost of services 279,769 25,647 13,658 76 (43,775) - 275,375 General and administrative expenses (1) 6,390 4,649 16,804 875 (2,086 ) 7,083 33,715 Total expenses 286,159 30,296 30,462 951 (45,861) 7,083 309,090 Income (loss) from operations $ 40,340 (1,035) 6,448 (657) 1,070 (2) (7,083) 39,083 % change vs prior year quarter (13%) (133%) 27% (22%) For the three months ended September 30, 2023 (1) Balance includes general and administrative expenses and depreciation and amortization . (2) Income from operations for the intersegment elimination represents rental income from segments renting from other segments. R ent al income is presented within other income, which is not presented in the table.

Balance Sheet Highlights 17 $ in millions 9/30/2023 12/31/2022 $ Change Cash and cash equivalents and investments in marketable securities* $277.0 $293.6 ($16.6) Working capital $273.3 $279.5 ($6.2) Total stockholders’ equity $593.7 $542.6 $51.1 *Excluding restricted cash

Reconciliation of Net Income to EBITDA and Adjusted EBITDA 18 (1) Other, net for the three and nine months ended September 30, 2023 relates to transaction costs incurred for our investments and tax restructuring fees and non - cash changes related to change in the fair value of our financing obligation to purchase the remaining equity interests, changes i n t he fair value of our contingent liabilities, and changes in the fair value of the Company's Collar Agreement. Other, net for the three and six months ended June 30, 2023, rel ate s to non - cash changes in the fair value of the Company’s financing obligations to purchase the remaining equity interest, changes in the fair value of its contingent li abi lities, and changes in the fair value of the Company’s Collar Agreement. (2) Other, net for the three and nine months ended September 30, 2022 relates to transaction costs incurred, net of the write - off re lated to APCMG contingent consideration to reflect the fair value as of September 30, 2022. (3) Certain APC minority interests where APC owns the asset but not the right to the dividends is reclassified from APC excluded ass et costs to income from equity method investments

Guidance Reconciliation of Net Income to EBITDA and Adjusted EBITDA 19 Note: See “Use of Non - GAAP Financial Measures” slide for more information.

Updated 2023 Guidance www.apollomed.net 20 2023 Guidance (Original) 2023 Guidance (Updated) ($'s in K, except EPS) Low High Low High Total Revenue 1,300,000 1,500,000 1,340,000 1,390,000 Net Income 49,500 71,500 59,500 71,500 EBITDA 89,500 129,500 114,500 129,500 Adj. EBITDA 120,000 160,000 135,000 150,000 EPS - Diluted $0.95 $1.20 $1.10 $1.20 Note: See “Guidance Reconciliation of Net Income to EBITDA and Adjusted EBITDA” and “Use of Non - GAAP Financial Measures” for add itional information. There can be no assurance that actual amounts will not be materially higher or lower than these expectations. See “Forward - Looking Statements” for additional i nformation.

21 Summary of Selected Financial Results – Breaking Out Excluded Assets $ in millions Nine Months Ended September 30, 2023 Nine Months Ended September 30, 2022 ApolloMed Consolidated Excluded Assets ApolloMed Assets ApolloMed Consolidated Excluded Assets ApolloMed Assets Revenue $ $ Capitation, net 906.4 - 906.4 677.3 - 677.3 Risk pool settlements and incentives 48.6 - 48.6 101.7 - 101.7 Management fee income 32.3 - 32.3 30.5 - 30.5 Fee - for - services, net 41.2 - 41.2 35.7 - 35.7 Other income 5.1 - 5.1 4.8 - 4.8 Total revenue 1033.6 - 1033.6 850.0 - 850.0 Total operating expenses 945.1 3.3 941.8 758.3 2.9 755.4 Income (losses) per operations 88.5 (3.3) 91.8 91.7 (2.9) 94.6 Total Other income (expense) 0.4 (1.7) 2.1 (15.5) (13.1) (2.4) Net income (loss) $ 57.9 (5) 62.9 $ 46.6 (16.0) 62.6

$ in millions September 30, 2023 December 31, 2022 ApolloMed Consolidated Excluded Assets ApolloMed Assets ApolloMed Consolidated Excluded Assets ApolloMed Assets Current assets Cash and cash equivalents $ 273.9 11.6 262.3 $ 288.0 30.2 257.8 Investments in marketable securities 3.0 0.5 2.5 5.6 4.5 1.1 Receivables, net 95.9 0 95.9 49.6 - 49.6 Receivables - related parties and loan receivable - related party 86.9 0 86.9 67.2 - 67.2 Other receivables, prepaid expenses and other current assets 16.5 1.5 15 17.6 0.8 16.8 Income taxes receivable - - - - (1.1) 1.1 Total current assets 476.2 13.6 462.6 428.0 34.4 393.6 Non - current assets Land, property, and equipment, net 128.6 120.4 8.2 108.5 101.3 7.2 Goodwill and intangibles 349.7 - 349.7 346.0 - 346.0 Loan receivable and loan receivable - related parties, net of current portion 25.0 - 25.0 - - - Income taxes receivable, non - current 15.9 - 15.9 15.9 - 15.9 Investments in other entities and privately held entities 47.3 20.6 26.7 41.2 27.6 13.6 Other assets and right - of - use assets 30.4 5.2 25.2 26.5 3.2 23.3 Total non - current assets 596.9 146.2 450.7 538.1 132.1 406.0 Total assets $ 1073.1 159.8 913.3 $ 966.1 166.5 799.6 22 Summary Balance Sheet – Breaking Out Excluded Assets (1) Includes AP Excluded Assets and certain other assets such as APC's minority interests in LSMA and PMIOC where APC owns th e a sset but not the right to the dividends associated with those assets. (1)

$ in millions September 30, 2023 December 31, 2022 ApolloMed Consolidated Excluded Assets ApolloMed Assets ApolloMed Consolidated Excluded Assets ApolloMed Assets Current liabilities Fiduciary payable, accounts payable and accrued liabilities $ 59.4 2.3 57.1 $ 57.7 2.8 54.9 Medical liabilities 97.5 - 97.5 81.3 - 81.3 Income taxes payable 30.1 1.1 29 4.3 - 4.3 Dividend payable 0.6 - 0.6 0.7 - 0.7 Finance and operating lease liabilities 4.2 0.1 4.1 4.2 - 4.2 Current portion of long - term debt 3.0 1.0 2.0 0.6 - - Other liabilities - - - - - - Total current liabilities 194.8 4.5 190.3 148.8 3.4 145.4 Non - current liabilities Deferred tax liability $ 12.1 0.9 11.2 14.2 0.9 13.3 Finance and operating lease liabilities, net of current portion 22.2 0.9 21.3 21.2 - 21.2 Long - term debt, net of current portion and deferred financing costs 206.2 28.8 177.4 20.3 - 20.3 Other long - term liabilities 14.1 - 14.1 203.4 26.6 176.8 Total non - current liabilities 254.6 30.6 224.0 259.1 27.5 231.6 Total liabilities 449.4 35.1 414.3 407.9 30.9 377.0 Total mezzanine equity and stockholder's equity $ 623.7 124.7 499.0 $ 558.2 135.6 422.6 23 Summary Balance Sheet – Breaking Out Excluded Assets (continued) (1) Includes AP Excluded Assets and certain other assets such as APC's minority interests in LSMA and PMIOC where APC owns th e a sset but not the right to the dividends associated with those assets. (1)

$ in millions September 30, 2023 September 30, 2022 ApolloMed Consolidated Excluded Assets ApolloMed Assets ApolloMed Consolidated Excluded Assets ApolloMed Assets Cash flows from operating activities Net income $ 57.9 (5.0) 63 $ 46.6 (16.0) 62.6 Adjustments to reconcile net income to net cash provided by operating activities: Depreciation and amortization $ 12.8 1.3 11.5 $ 13.5 0.9 12.6 Amortization of debt issuance cost 0.7 - 0.7 0.7 - 0.7 Share - based compensation 13.4 - 13.4 10.5 - 10.5 Unrealized loss on investments 6.9 4.0 2.9 21.9 - 5.2 Gain on sales of equity securities - - - (2.3) - (2.3) Loss (income) from equity method investments, net (3.1) 0.1 (3.2) (4.4) - (4.4) Unrealized gain in interest rate swaps (1.0) (1.0) - (4.3) (4.3) - Deferred tax (3.9) - (3.9) (3.1) - (3.1) Other 0.9 0.9 - Changes in operating assets and liabilities, net of acquisition amounts: Receivables, net, receivable, net - related parties, other receivable, prepaid expenses and other current assets, right of use assets, other assets, fiduciary accounts payable, medical liabilities, operating lease liabilities, other long - term liabilities (58.8) (0.8) (58.2) (73.3) 0.6 (73.9) Accounts payable and accrued liabilities (1.1) (1.8) 0.6 0.8 0.4 0.4 Income taxes payable 25.2 - 25.2 (10.4) - (10.4) Net cash provided by operating activities $ 49.0 (3.2) 52 $ (2.9) (0.8) (2.1) Summary Cash Flow Statement – Breaking Out Excluded Assets 24
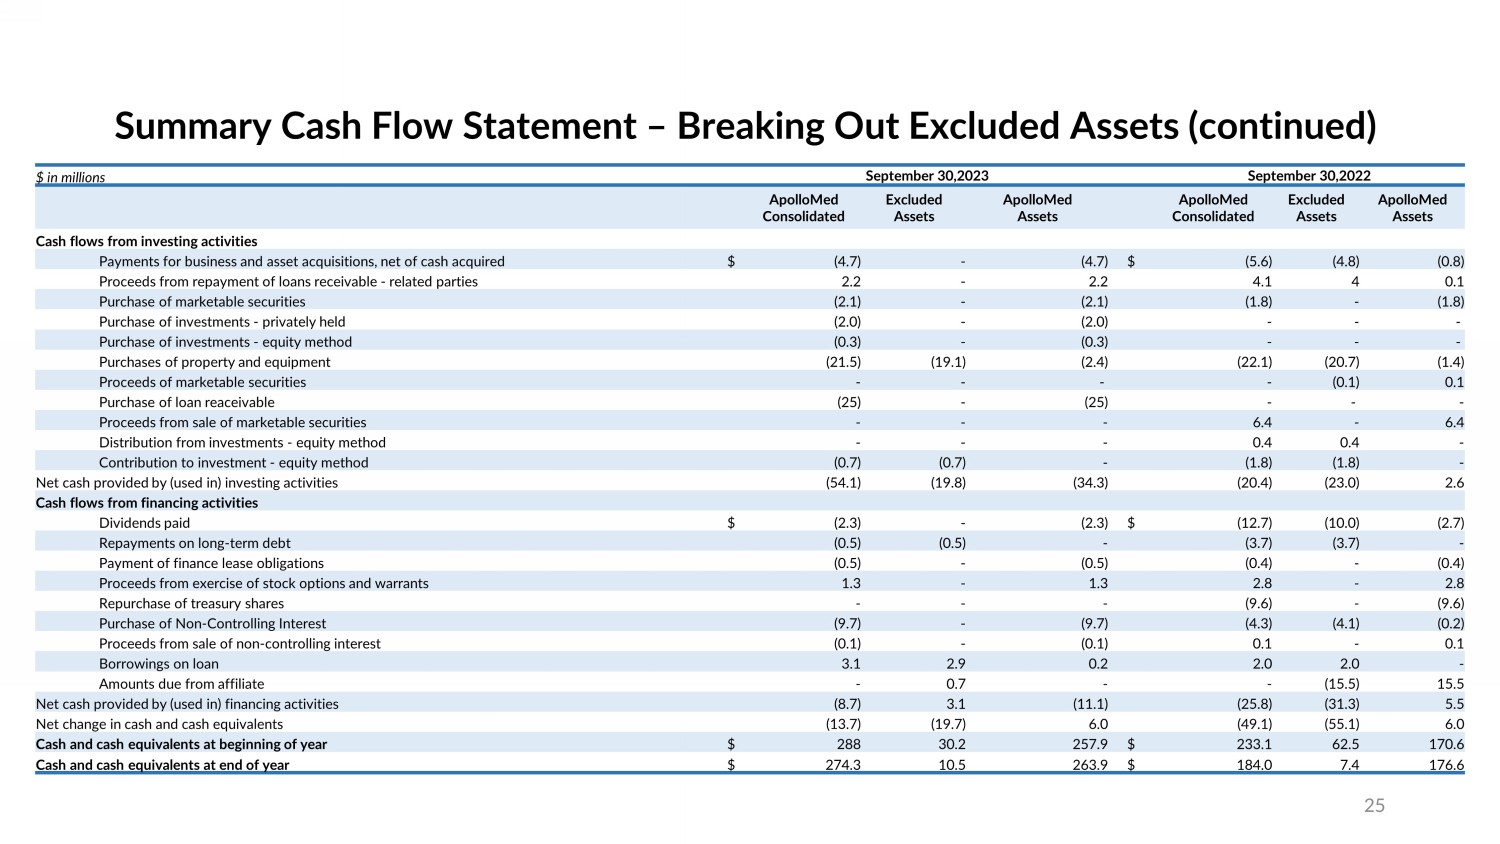
$ in millions September 30,2023 September 30,2022 ApolloMed Consolidated Excluded Assets ApolloMed Assets ApolloMed Consolidated Excluded Assets ApolloMed Assets Cash flows from investing activities Payments for business and asset acquisitions, net of cash acquired $ (4.7) - (4.7) $ (5.6) (4.8) (0.8) Proceeds from repayment of loans receivable - related parties 2.2 - 2.2 4.1 4 0.1 Purchase of marketable securities (2.1) - (2.1) (1.8) - (1.8) Purchase of investments - privately held (2.0) - (2.0) - - - Purchase of investments - equity method (0.3) - (0.3) - - - Purchases of property and equipment (21.5) (19.1) (2.4) (22.1) (20.7) (1.4) Proceeds of marketable securities - - - - (0.1) 0.1 Purchase of loan reaceivable (25) - (25) - - - Proceeds from sale of marketable securities - - - 6.4 - 6.4 Distribution from investments - equity method - - - 0.4 0.4 - Contribution to investment - equity method (0.7) (0.7) - (1.8) (1.8) - Net cash provided by (used in) investing activities (54.1) (19.8) (34.3) (20.4) (23.0) 2.6 Cash flows from financing activities Dividends paid $ (2.3) - (2.3) $ (12.7) (10.0) (2.7) Repayments on long - term debt (0.5) (0.5) - (3.7) (3.7) - Payment of finance lease obligations (0.5) - (0.5) (0.4) - (0.4) Proceeds from exercise of stock options and warrants 1.3 - 1.3 2.8 - 2.8 Repurchase of treasury shares - - - (9.6) - (9.6) Purchase of Non - Controlling Interest (9.7) - (9.7) (4.3) (4.1) (0.2) Proceeds from sale of non - controlling interest (0.1) - (0.1) 0.1 - 0.1 Borrowings on loan 3.1 2.9 0.2 2.0 2.0 - Amounts due from affiliate - 0.7 - - (15.5) 15.5 Net cash provided by (used in) financing activities (8.7) 3.1 (11.1) (25.8) (31.3) 5.5 Net change in cash and cash equivalents (13.7) (19.7) 6.0 (49.1) (55.1) 6.0 Cash and cash equivalents at beginning of year $ 288 30.2 257.9 $ 233.1 62.5 170.6 Cash and cash equivalents at end of year $ 274.3 10.5 263.9 $ 184.0 7.4 176.6 Summary Cash Flow Statement – Breaking Out Excluded Assets (continued) 25

Use of Non - GAAP Financial Measures This presentation contains the non - GAAP financial measures EBITDA and Adjusted EBITDA, of which the most directly comparable fin ancial measure presented in accordance with U.S. generally accepted accounting principles (“GAAP”) is net income. These measures are not in acc ordance with, or alternatives to GAAP, and may be different from other non - GAAP financial measures used by other companies. The Company uses Adju sted EBITDA as a supplemental performance measure of our operations, for financial and operational decision - making, and as a supplemental means o f evaluating period - to - period comparisons on a consistent basis. Adjusted EBITDA is calculated as earnings before interest, taxes, depreciation, and am ortization, excluding income or loss from equity method investments, non - recurring transactions, stock - based compensation, and APC excluded assets costs. Beg inning in the third quarter ended September 30, 2022, the Company has revised the calculation for Adjusted EBITDA to exclude provider bonus payme nts and losses from recently acquired IPAs, which it believes to be more reflective of its business. The Company believes the presentation of these non - GAAP financial measures provides investors with relevant and useful informati on, as it allows investors to evaluate the operating performance of the business activities without having to account for differences recogniz ed because of non - core or non - recurring financial information. When GAAP financial measures are viewed in conjunction with non - GAAP financial measures, in vestors are provided with a more meaningful understanding of the Company’s ongoing operating performance. In addition, these non - GAAP financial measu res are among those indicators the Company uses as a basis for evaluating operational performance, allocating resources, and planning and forecas tin g future periods. Non - GAAP financial measures are not intended to be considered in isolation, or as a substitute for, GAAP financial measures. Othe r c ompanies may calculate both EBITDA and Adjusted EBITDA differently, limiting the usefulness of these measures for comparative purposes. To the exten t t his release contains historical or future non - GAAP financial measures, the Company has provided corresponding GAAP financial measures for comparative purposes. The reconciliation between certain GAAP and non - GAAP measures is provided above. 26

For inquiries, please contact: ApolloMed Investor Relations Asher Dewhurst (626) 943 - 6491 investors@apollomed.net
v3.23.3
| X |
- DefinitionBoolean flag that is true when the XBRL content amends previously-filed or accepted submission.
| Name: |
dei_AmendmentFlag |
| Namespace Prefix: |
dei_ |
| Data Type: |
xbrli:booleanItemType |
| Balance Type: |
na |
| Period Type: |
duration |
|
| X |
- DefinitionFor the EDGAR submission types of Form 8-K: the date of the report, the date of the earliest event reported; for the EDGAR submission types of Form N-1A: the filing date; for all other submission types: the end of the reporting or transition period. The format of the date is YYYY-MM-DD.
| Name: |
dei_DocumentPeriodEndDate |
| Namespace Prefix: |
dei_ |
| Data Type: |
xbrli:dateItemType |
| Balance Type: |
na |
| Period Type: |
duration |
|
| X |
- DefinitionThe type of document being provided (such as 10-K, 10-Q, 485BPOS, etc). The document type is limited to the same value as the supporting SEC submission type, or the word 'Other'.
| Name: |
dei_DocumentType |
| Namespace Prefix: |
dei_ |
| Data Type: |
dei:submissionTypeItemType |
| Balance Type: |
na |
| Period Type: |
duration |
|
| X |
- DefinitionAddress Line 1 such as Attn, Building Name, Street Name
| Name: |
dei_EntityAddressAddressLine1 |
| Namespace Prefix: |
dei_ |
| Data Type: |
xbrli:normalizedStringItemType |
| Balance Type: |
na |
| Period Type: |
duration |
|
| X |
- DefinitionAddress Line 2 such as Street or Suite number
| Name: |
dei_EntityAddressAddressLine2 |
| Namespace Prefix: |
dei_ |
| Data Type: |
xbrli:normalizedStringItemType |
| Balance Type: |
na |
| Period Type: |
duration |
|
| X |
- Definition
+ References
+ Details
| Name: |
dei_EntityAddressCityOrTown |
| Namespace Prefix: |
dei_ |
| Data Type: |
xbrli:normalizedStringItemType |
| Balance Type: |
na |
| Period Type: |
duration |
|
| X |
- DefinitionCode for the postal or zip code
| Name: |
dei_EntityAddressPostalZipCode |
| Namespace Prefix: |
dei_ |
| Data Type: |
xbrli:normalizedStringItemType |
| Balance Type: |
na |
| Period Type: |
duration |
|
| X |
- DefinitionName of the state or province.
| Name: |
dei_EntityAddressStateOrProvince |
| Namespace Prefix: |
dei_ |
| Data Type: |
dei:stateOrProvinceItemType |
| Balance Type: |
na |
| Period Type: |
duration |
|
| X |
- DefinitionA unique 10-digit SEC-issued value to identify entities that have filed disclosures with the SEC. It is commonly abbreviated as CIK. Reference 1: http://www.xbrl.org/2003/role/presentationRef
-Publisher SEC
-Name Exchange Act
-Number 240
-Section 12
-Subsection b-2
| Name: |
dei_EntityCentralIndexKey |
| Namespace Prefix: |
dei_ |
| Data Type: |
dei:centralIndexKeyItemType |
| Balance Type: |
na |
| Period Type: |
duration |
|
| X |
- DefinitionIndicate if registrant meets the emerging growth company criteria. Reference 1: http://www.xbrl.org/2003/role/presentationRef
-Publisher SEC
-Name Exchange Act
-Number 240
-Section 12
-Subsection b-2
| Name: |
dei_EntityEmergingGrowthCompany |
| Namespace Prefix: |
dei_ |
| Data Type: |
xbrli:booleanItemType |
| Balance Type: |
na |
| Period Type: |
duration |
|
| X |
- DefinitionCommission file number. The field allows up to 17 characters. The prefix may contain 1-3 digits, the sequence number may contain 1-8 digits, the optional suffix may contain 1-4 characters, and the fields are separated with a hyphen.
| Name: |
dei_EntityFileNumber |
| Namespace Prefix: |
dei_ |
| Data Type: |
dei:fileNumberItemType |
| Balance Type: |
na |
| Period Type: |
duration |
|
| X |
- DefinitionTwo-character EDGAR code representing the state or country of incorporation.
| Name: |
dei_EntityIncorporationStateCountryCode |
| Namespace Prefix: |
dei_ |
| Data Type: |
dei:edgarStateCountryItemType |
| Balance Type: |
na |
| Period Type: |
duration |
|
| X |
- DefinitionThe exact name of the entity filing the report as specified in its charter, which is required by forms filed with the SEC. Reference 1: http://www.xbrl.org/2003/role/presentationRef
-Publisher SEC
-Name Exchange Act
-Number 240
-Section 12
-Subsection b-2
| Name: |
dei_EntityRegistrantName |
| Namespace Prefix: |
dei_ |
| Data Type: |
xbrli:normalizedStringItemType |
| Balance Type: |
na |
| Period Type: |
duration |
|
| X |
- DefinitionThe Tax Identification Number (TIN), also known as an Employer Identification Number (EIN), is a unique 9-digit value assigned by the IRS. Reference 1: http://www.xbrl.org/2003/role/presentationRef
-Publisher SEC
-Name Exchange Act
-Number 240
-Section 12
-Subsection b-2
| Name: |
dei_EntityTaxIdentificationNumber |
| Namespace Prefix: |
dei_ |
| Data Type: |
dei:employerIdItemType |
| Balance Type: |
na |
| Period Type: |
duration |
|
| X |
- DefinitionLocal phone number for entity.
| Name: |
dei_LocalPhoneNumber |
| Namespace Prefix: |
dei_ |
| Data Type: |
xbrli:normalizedStringItemType |
| Balance Type: |
na |
| Period Type: |
duration |
|
| X |
- DefinitionBoolean flag that is true when the Form 8-K filing is intended to satisfy the filing obligation of the registrant as pre-commencement communications pursuant to Rule 13e-4(c) under the Exchange Act. Reference 1: http://www.xbrl.org/2003/role/presentationRef
-Publisher SEC
-Name Exchange Act
-Number 240
-Section 13e
-Subsection 4c
| Name: |
dei_PreCommencementIssuerTenderOffer |
| Namespace Prefix: |
dei_ |
| Data Type: |
xbrli:booleanItemType |
| Balance Type: |
na |
| Period Type: |
duration |
|
| X |
- DefinitionBoolean flag that is true when the Form 8-K filing is intended to satisfy the filing obligation of the registrant as pre-commencement communications pursuant to Rule 14d-2(b) under the Exchange Act. Reference 1: http://www.xbrl.org/2003/role/presentationRef
-Publisher SEC
-Name Exchange Act
-Number 240
-Section 14d
-Subsection 2b
| Name: |
dei_PreCommencementTenderOffer |
| Namespace Prefix: |
dei_ |
| Data Type: |
xbrli:booleanItemType |
| Balance Type: |
na |
| Period Type: |
duration |
|
| X |
- DefinitionTitle of a 12(b) registered security. Reference 1: http://www.xbrl.org/2003/role/presentationRef
-Publisher SEC
-Name Exchange Act
-Number 240
-Section 12
-Subsection b
| Name: |
dei_Security12bTitle |
| Namespace Prefix: |
dei_ |
| Data Type: |
dei:securityTitleItemType |
| Balance Type: |
na |
| Period Type: |
duration |
|
| X |
- DefinitionName of the Exchange on which a security is registered. Reference 1: http://www.xbrl.org/2003/role/presentationRef
-Publisher SEC
-Name Exchange Act
-Number 240
-Section 12
-Subsection d1-1
| Name: |
dei_SecurityExchangeName |
| Namespace Prefix: |
dei_ |
| Data Type: |
dei:edgarExchangeCodeItemType |
| Balance Type: |
na |
| Period Type: |
duration |
|
| X |
- DefinitionBoolean flag that is true when the Form 8-K filing is intended to satisfy the filing obligation of the registrant as soliciting material pursuant to Rule 14a-12 under the Exchange Act. Reference 1: http://www.xbrl.org/2003/role/presentationRef
-Publisher SEC
-Name Exchange Act
-Section 14a
-Number 240
-Subsection 12
| Name: |
dei_SolicitingMaterial |
| Namespace Prefix: |
dei_ |
| Data Type: |
xbrli:booleanItemType |
| Balance Type: |
na |
| Period Type: |
duration |
|
| X |
- DefinitionTrading symbol of an instrument as listed on an exchange.
| Name: |
dei_TradingSymbol |
| Namespace Prefix: |
dei_ |
| Data Type: |
dei:tradingSymbolItemType |
| Balance Type: |
na |
| Period Type: |
duration |
|
| X |
- DefinitionBoolean flag that is true when the Form 8-K filing is intended to satisfy the filing obligation of the registrant as written communications pursuant to Rule 425 under the Securities Act. Reference 1: http://www.xbrl.org/2003/role/presentationRef
-Publisher SEC
-Name Securities Act
-Number 230
-Section 425
| Name: |
dei_WrittenCommunications |
| Namespace Prefix: |
dei_ |
| Data Type: |
xbrli:booleanItemType |
| Balance Type: |
na |
| Period Type: |
duration |
|
Apollo Medical (NASDAQ:AMEH)
Historical Stock Chart
From Feb 2025 to Mar 2025

Apollo Medical (NASDAQ:AMEH)
Historical Stock Chart
From Mar 2024 to Mar 2025

