Deterioration in Receivables and Inventory
Management Masked by Significant Slowing of Payments to
Suppliers
The 1000 largest non-financial companies in the U.S.
significantly improved their ability to generate cash in 2017,
producing the strongest working capital performance since 2008. But
their ability to collect from customers and manage inventory
actually both deteriorated, masked by a significant increase in the
time companies take to pay suppliers, according to the latest
Working Capital Survey results from The Hackett Group, Inc.
(NASDAQ: HCKT).
In 2017, companies significantly extended payments to suppliers,
taking 3.4 days longer to pay than in 2016 and improving Days
Payable Outstanding (DPO) by increasing it to 56.7 days. Increasing
DPO keeps cash on the balance sheet longer and improves cash
position. The Hackett Group’s survey found evidence that for many
companies, improving DPO involves companies simply pushing the
working capital burden onto their suppliers, including much smaller
companies, by forcing them to accept longer payment terms. Supply
chain financing is also growing in popularity as a way to improve
DPO performance while limiting the impact on suppliers.
Performance of the other major elements of working capital
performance, receivables and inventory, both deteriorated slightly
in 2017. Days Sales Outstanding (DSO) rose by 4.4 percent to 39.5
days and Days Inventory On hand (DIO) rose by just 0.6 percent to
51 days.
The Hackett Group’s annual working capital survey is featured in
CFO Magazine. A complimentary analysis of the survey results is
also available from The Hackett Group, with registration, at this
link: http://go.poweredbyhackett.com/qphs
The Hackett Group’s 2018 US Working Capital Survey and scorecard
calculates working capital performance based on the latest publicly
available annual financial statements of the 1000 largest
non-financial companies in the United States, utilizing data
sourced from FactSet. Overall, the survey found the companies had a
Cash Conversion Cycle (CCC) of 33.8 days, an improvement of 1.5
days (4 percent) over last year. This is a significant improvement
over the high CCC of 37.3 days seen in 2015, and nearly matches the
lowest recent CCC of 33.4 days seen in 2008, which was driven
largely in changes made in response to the recession. CCC is a
standard metric used to quantify the ability of companies to
convert invested resources into cash, and incorporates payables,
receivables and inventory.
Top performers by industry in The Hackett Group’s survey are now
nearly three times faster than typical companies at converting
working capital into cash (16.7 days for top quartile companies
versus 47.5 days for typical). They collect from customers 2.7
weeks faster (29.1 days vs 47.7), pay suppliers three weeks slower
(66.9 days vs 45.4) and hold less than half the inventory (23.9
days vs 57.7). This translates into a $1.1 trillion improvement
opportunity for companies that are not top performers, an amount
equal to nearly 6 percent of the U.S. Gross Domestic Product (GDP).
Inventory remains the largest opportunity ($443 billion). However
for 2017 the opportunity in payables ($358 billion) grew larger
than the opportunity in receivables ($334 billion).
Despite the strong overall working capital performance of
companies in the survey, the opportunity gap between typical
companies and top performers continues to grow, indicating that top
performers are highly focused on generating improvements in this
area, while many typical companies are neglecting working capital
improvement.
Rising interest rates and extremely high M&A activity were
two major factors impacting on U.S. working capital performance in
2017. Tax reform and continued reliance on cheap debt helped drive
cash on hand up 17 percent, to its highest level ever ($1.07
trillion), while debt rose by nearly 10 percent (to $5.6 trillion).
Despite rising interest rates, companies are continuing to leverage
debt, in many cases to fund acquisitions. Debt as a percentage of
revenue has continued to climb, reaching 51 percent of revenue in
2017, steadily increasing over the last few years from closer to 33
percent revenue for the period 2008-2013.
Capital expenditures also increased by 5.5 percent, the first
increase since 2014, indicating that companies may be shifting
towards investing in themselves, rather than continuing to focus on
returning cash to shareholders, as they have since the financial
crisis.
“For the first time in years we’re finally seeing rising
interest rates, and that is driving more companies to look at
improvements to working capital,” said The Hackett Group Associate
Principal Craig Bailey. “The record level of M&A is also
starting to increase the focus on both cost and cash. So we’re
seeing a significant improvement in working capital performance.
But debt is also reaching record levels, and despite the
improvements, it appears clear that most companies are still
looking for quick fixes and avoiding doing the process improvement
and other hard work required to truly improve working capital.”
“The primary strategy many companies are using to improve
working capital performance is simply to hold back payments to
suppliers, in some cases extending payment terms up to 120 days,”
said Bailey. “Payables are often the easiest starting point for
working capital improvement, as the processes are largely in
finance’s area of control, and it has less risk of impacting on
customers. Unfortunately, when companies extend payment terms it
has significant impact on the DSO performance of their suppliers.
This year it is driving DSO to a 10-year high. It can even
destabilize a supply base, if companies are not careful.”
“Another increasingly popular way companies are improving
payables performance is through supply chain financing,” explained
Bailey. “But it’s truly not the best way to improve overall working
capital performance, as it basically enables companies to avoid
dealing with process inefficiency by using a bank to offer
suppliers financing of their receivables.”
“The focus on slowing payments to suppliers also significantly
drives the burden of working capital performance onto smaller
companies, most of which are below the radar of our survey. Many
smaller companies, and also other companies that cannot easily
improve their payables performance, such as those with consolidated
supply bases, or those with a multitude of small suppliers, are
struggling,” said Bailey.
According to The Hackett Group Director Shawn Townsend, “Even
just in terms of payables optimization, there are better ways to
make improvements than to delay supplier payments. Some companies
understand this, which is why despite improved overall working
capital performance, the opportunity gap between typical companies
and top performers continues to increase. Some organizations show
what can truly be accomplished, while many others avoid dealing
with the underlying issues.”
“There are simply much better options available. For example,
companies can focus on differentiating critical from non-critical
suppliers. They can strive to improve the procure-to-pay cycle
without impacting supply base, through process improvement,
digitization, robotic process automation, blockchain, and other
digital transformation approaches,” said Townsend.
A complimentary analysis of the results from The Hackett Group’s
2018 working capital survey is available, with registration, at
this link: http://go.poweredbyhackett.com/qphs.
About The Hackett Group
The Hackett Group (NASDAQ:HCKT) is an intellectual
property-based strategic consultancy and leading enterprise
benchmarking and best practices digital transformation firm to
global companies, offering digital transformation including robotic
process automation and enterprise cloud application implementation.
Services include business transformation, enterprise
analytics, working capital management and global
business services. The Hackett Group also provides dedicated
expertise in business strategy, operations, finance, human capital
management, strategic sourcing, procurement and information
technology, including its award-winning Oracle and SAP
practices.
The Hackett Group has completed more than 15,000 benchmarking
studies with major corporations and government agencies, including
97% of the Dow Jones Industrials, 89% of the Fortune 100, 87% of
the DAX 30 and 59% of the FTSE 100. These studies drive its Best
Practice Intelligence Center™ which includes the firm's
benchmarking metrics, best practices repository and best practice
configuration guides and process flows, which enable
The Hackett Group’s clients and partners to achieve world-class
performance.
More information on The Hackett Group is available at:
www.thehackettgroup.com, info@thehackettgroup.com, or by
calling (770) 225-3600.
View source
version on businesswire.com: https://www.businesswire.com/news/home/20180719005047/en/
The Hackett Group, Inc.Gary Baker, 917-796-2391Global
Communications Directorgbaker@thehackettgroup.com
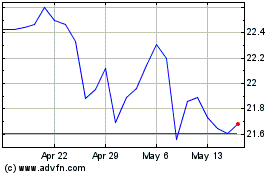
Hackett (NASDAQ:HCKT)
Historical Stock Chart
From Oct 2024 to Nov 2024

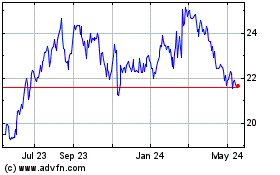
Hackett (NASDAQ:HCKT)
Historical Stock Chart
From Nov 2023 to Nov 2024
