false
0001893311
0001893311
2023-12-01
2023-12-01
0001893311
luxh:CommonStockParValue0.00001PerShareMember
2023-12-01
2023-12-01
0001893311
luxh:SeriesACumulativeRedeemablePreferredMember
2023-12-01
2023-12-01
iso4217:USD
xbrli:shares
iso4217:USD
xbrli:shares
UNITED
STATES
SECURITIES
AND EXCHANGE COMMISSION
WASHINGTON,
D.C. 20549
FORM 8-K
CURRENT
REPORT
PURSUANT
TO SECTION 13 OR 15(d) OF THE
SECURITIES
EXCHANGE ACT OF 1934
Date
of Report (Date of earliest event reported): December 1, 2023
| LuxUrban Hotels Inc. |
| (Exact
Name of Registrant as Specified in Charter) |
| Delaware |
|
001-41473 |
|
82-3334945 |
(State
or Other Jurisdiction
of
Incorporation) |
|
(Commission
File
Number) |
|
(IRS
Employer
Identification
No.) |
| 2125 Biscayne Blvd, Suite 253, Miami, Florida |
|
33137 |
| (Address
of Principal Executive Offices) |
|
(Zip
Code) |
Registrant’s
telephone number, including area code: (844) -220-9973
| N/A |
| (Former
Name or Former Address, if Changed Since Last Report) |
Check
the appropriate box below if the Form 8-K filing is intended to simultaneously satisfy the filing obligation of the Registrant under
any of the following provisions (see General Instruction A.2. below):
| ☐ |
Written
communications pursuant to Rule 425 under the Securities Act (17 CFR 230.425) |
| ☐ |
Soliciting
material pursuant to Rule 14a-12 under the Exchange Act (17 CFR 240.14a-12) |
| ☐ |
Pre-commencement
communications pursuant to Rule 14d-2(b) under the Exchange Act (17 CFR 240.14d-2(b)) |
| ☐ |
Pre-commencement
communications pursuant to Rule 13e-4© under the Exchange Act (17 CFR 240.13e 4(c)) |
Indicate
by check mark whether the registrant is an emerging growth company as defined in Rule 405 of the Securities Act of 1933 (§230.405
of this chapter) or Rule 12b-2 of the Securities Exchange Act of 1934 (§240.12b-2 of this chapter).
Emerging growth company
☒
If
an emerging growth company, indicate by check mark if the registrant has elected not to use the extended transition period for complying
with any new or revised financial accounting standards provided pursuant to Section 13(a) of the Exchange Act.
Securities
registered pursuant to Section 12(b) of the Act:
| Title
of each class |
|
Ticker
symbol(s) |
|
Name
of each exchange on which registered |
| Common
Stock, par value $0.00001 per share |
|
LUXH |
|
The
Nasdaq Stock Market LLC |
| |
|
|
|
|
| 13.00%
Series A Cumulative Redeemable Preferred Stock, $0.00001 par value per share |
|
LUXHP |
|
The
Nasdaq Stock Market LLC |
| Item
7.01 |
Regulation
FD Disclosure. |
LuxUrban
Hotels Inc. (the “Company”) has made available an Investor Presentation, which is attached to this Current Report on Form
8-K as Exhibit 99.1 and incorporated herein by reference.
The
information presented in Item 7.01 of this Current Report on Form 8-K and Exhibit 99.1 shall not be deemed to be “filed”
for purposes of Section 18 of the Securities Exchange Act of 1934, as amended (the “Exchange Act”), or otherwise subject
to the liabilities of that section, unless the Company specifically states that the information is to be considered “filed”
under the Exchange Act or specifically incorporates it by reference into a filing under the Securities Act of 1933, as amended, or the
Exchange Act.
| Item
9.01 |
Financial
Statements and Exhibits. |
SIGNATURE
Pursuant
to the requirements of the Securities Exchange Act of 1934, the registrant has duly caused this report to be signed on its behalf by
the undersigned hereunto duly authorized.
| Dated:
December 1, 2023 |
LUXURBAN
HOTELS INC. |
| |
|
| |
By: |
/s/
Shanoop Kothari |
| |
|
Name: |
Shanoop Kothari |
| |
|
Title: |
President,
Co-Chief Executive Officer,
Chief Financial Officer and Secretary |
Exhibit 99.1

1 Nasdaq: LUXH, LUXHP
2 DISCLAIMER Forward Looking Statements This presentation contains certain “forward - looking statements” within the meaning of the Private Securities Litigation Reform Act of 1995 (set forth in Section 27 A of the Securities Act of 1933 , as amended, and Section 21 E of the Securities Exchange Act of 1934 , as amended) . The statements contained in this presentation that are not purely historical are forward - looking statements . Forward - looking statements include, but are not limited to, statements regarding expectations, hopes, beliefs, intentions or strategies regarding the future . In addition, any statements that refer to projections, forecasts or other characterizations of future events or circumstances, including any underlying assumptions, are forward - looking statements . Generally, the words “anticipates,” “believes,” “continues,” “could,” “estimates,” “expects,” “intends,” “may,” “might,” “plans,” “possible,” “potential,” “predicts,” “projects,” “should,” “would” and similar expressions may identify forward - looking statements, but the absence of these words does not mean that a statement is not forward - looking . Forward - looking statements in this presentation may include, for example, statements with respect to financial and operational guidance, the success of the Company’s collaboration with Wyndham Hotels & Resorts, scheduled property openings, expected closing of noted lease transactions, the Company’s ability to continue closing on additional leases for properties in the Company’s pipeline, as well the Company’s anticipated ability to commercialize efficiently and profitably the properties it leases and will lease in the future . The forward - looking statements contained in this presentation are based on current expectations and belief concerning future developments and their potential effect on the Company . There can be no assurance that future developments will be those that have been anticipated . These forward - looking statements are subject to a number of risks, uncertainties (some of which are beyond our control) or other assumptions that may cause actual results of performance to be materially different from those expressed or implied by these forward - looking statements, including those set forth under the caption “Risk Factors” in our public filings with the SEC, including in Item 1 A of our 10 - K for the year ended December 31 , 2022 , and any updates to those factors as set forth in subsequent Quarterly Reports on Form 10 - Q or other public filings with the SEC . The forward - looking information and forward - looking statements contained in this presentation are made as of the date of this presentation, and the Company does not undertake to update any forward - looking information and/or forward - looking statements that are contained or referenced herein, except in accordance with applicable securities laws . Non - GAAP Information The Company defines cash net income as net income (loss) before non - cash financing costs, non - cash stock compensation expense, non - cash stock option expense, non - cash rent amortization expense, accrued taxes, non - cash issuance of common stock for operating expenses, and depreciation . The Company believes that cash net income is useful to investors as a measure of a company's operating performance, without regard to generally non - recurring items and non - cash activity . The Company seeks to achieve profitable, long - term growth by monitoring and analyzing key operating metrics, including EBITDA . The Company defines EBITDA as net income (loss) before interest, taxes, financing costs, depreciation and amortization, stock compensation expense and stock option expense, and incremental costs associated with its exit from SoBeNY . The Company defines net debt as current and long - term loans payable and short - term financing costs (together, total debt) less cash and cash equivalents . The Company’s management uses these non - GAAP financial metrics and related computations to evaluate and manage the business and to plan and make near and long - term operating and strategic decisions . The management team believes these non - GAAP financial metrics are useful to investors to provide supplemental information in addition to the GAAP financial results . Management reviews the use of its primary key operating metrics from time - to - time . EBITDA, net debt and cash net income are not intended to be a substitute for any GAAP financial measure and as calculated, may not be comparable to similarly titled measures of performance of other companies in other industries or within the same industry . The Company’s management team believes it is useful to provide investors with the same financial information that it uses internally to make comparisons of historical operating results, identify trends in underlying operating results, and evaluate its business . For purposes of the guidance provided herein for the years ended December 31 , 2023 and December 31 , 2024 , however, estimating such GAAP measures with the required precision necessary to provide a meaningful reconciliation could not be accomplished without unreasonable effort . Non - GAAP measures for future periods, which cannot be reconciled to the most comparable GAAP financial measures are calculated in a manner which is consistent with the accounting policies applied in the Company’s consolidated financial statements . A reconciliation of net income (loss) to EBITDA and net income (loss) to cash net income is included in the financial tables included with this presentation .
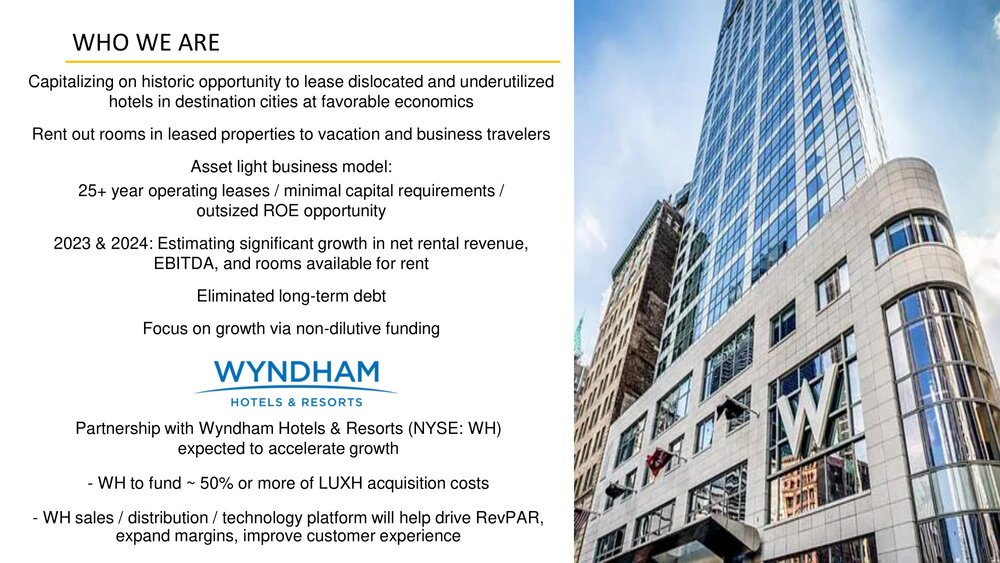
3 Capitalizing on historic opportunity to lease dislocated and underutilized hotels in destination cities at favorable economics Rent out rooms in leased properties to vacation and business travelers Asset light business model: 25+ year operating leases / minimal capital requirements / outsized ROE opportunity 2023 & 2024: Estimating significant growth in net rental revenue, EBITDA, and rooms available for rent Eliminated long - term debt Focus on growth via non - dilutive funding Partnership with Wyndham Hotels & Resorts (NYSE: WH) expected to accelerate growth - WH to fund ~ 50% or more of LUXH acquisition costs - WH sales / distribution / technology platform will help drive RevPAR, expand margins, improve customer experience WHO WE ARE
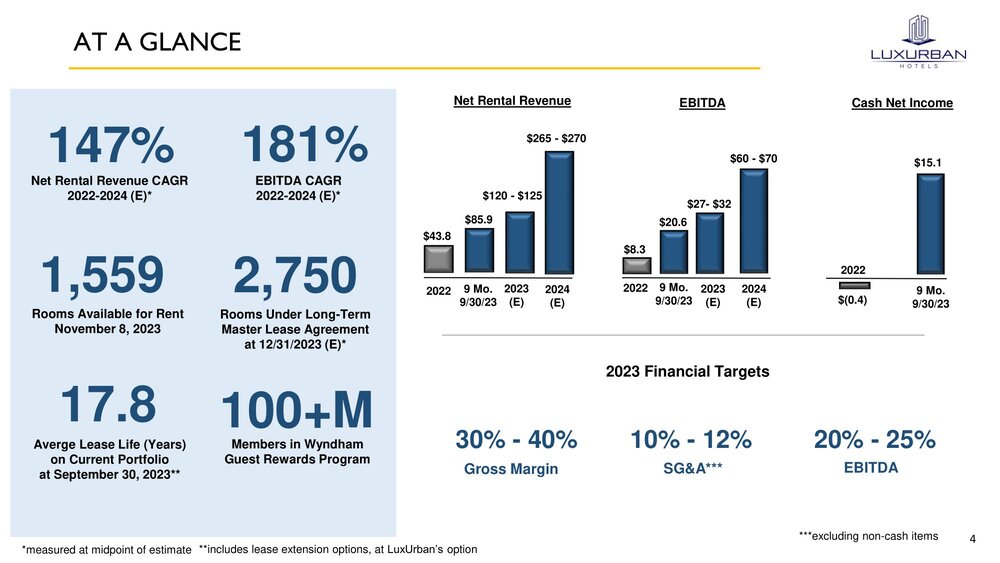
4 AT A GLANCE SERVICE Net Rental Revenue $85.9 $120 - $125 $265 - $270 9 Mo. 9/30/23 2023 (E) 2024 (E) $43.8 2022 $20.6 $27 - $32 $60 - $70 9 Mo. 9/30/23 2023 (E) 2024 (E) $8.3 2022 EBITDA $15.1 9 Mo. 9/30/23 $(0.4) 2022 Cash Net Income Net Rental Revenue CAGR 2022 - 2024 (E)* EBITDA CAGR 2022 - 2024 (E)* Averge Lease Life (Years) on Current Portfolio at September 30, 2023** Members in Wyndham Guest Rewards Program Rooms Under Long - Term Master Lease Agreement at 12/31/2023 (E)* 147% 181% 100+M 2,750 2023 Financial Targets Gross Margin SG&A*** EBITDA 30% - 40% 10% - 12% 20% - 25% *measured at midpoint of estimate ***excluding non - cash items Rooms Available for Rent November 8, 2023 1,559 17.8 **includes lease extension options, at LuxUrban’s option
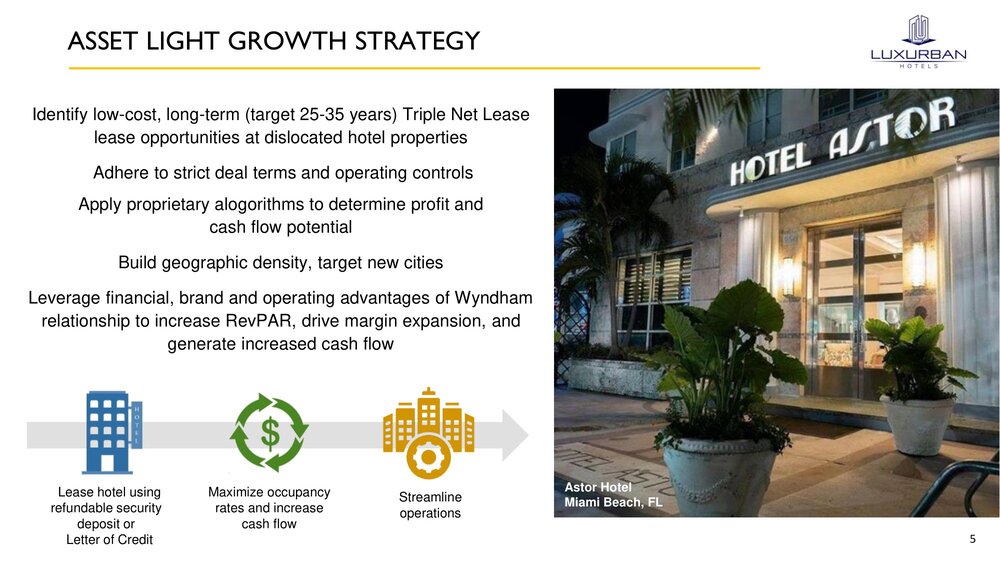
5 ASSET LIGHT GROWTH STRATEGY SERVICE Streamline operations Lease hotel using refundable security deposit or L etter of Credit Maximize occupancy rates and increase cash flow Identify low - cost, long - term (target 25 - 35 years) Triple Net Lease lease opportunities at dislocated hotel properties Adhere to strict deal terms and operating controls Apply proprietary alogorithms to determine profit and cash flow potential Build geographic density, target new cities Leverage financial, brand and operating advantages of Wyndham relationship to increase RevPAR, drive margin expansion, and g enerate increased cash flow Astor Hotel Miami Beach, FL
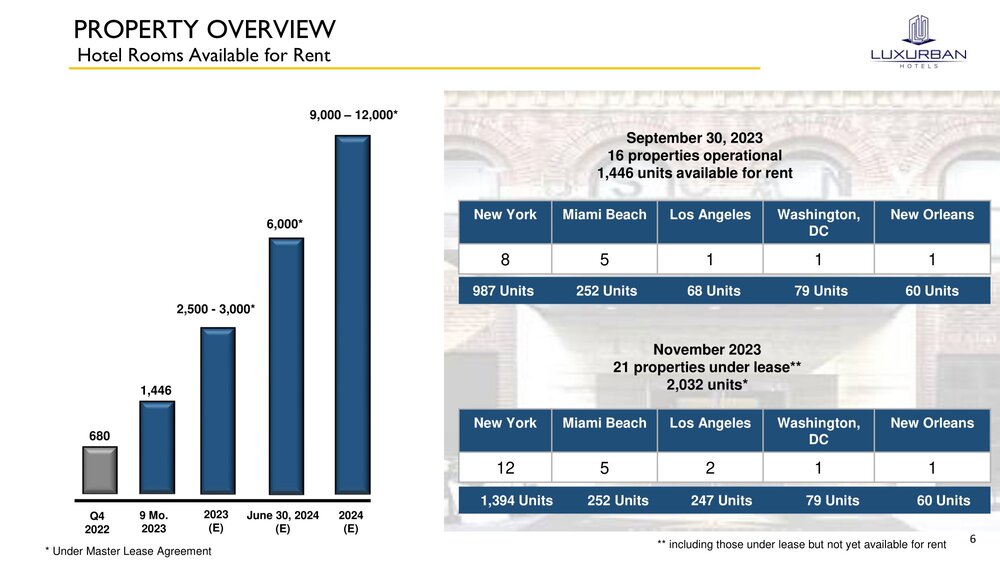
6 PROPERTY OVERVIEW Hotel Rooms Available for Rent SERVICE 680 1,446 June 30, 2024 (E) Q4 2022 9 Mo. 2023 2023 (E) 2024 (E) New Orleans Washington, DC Los Angeles Miami Beach New York 1 1 1 5 8 September 30, 2023 16 properties operational 1,446 units available for rent November 2023 21 properties under lease** 2 ,032 units* New Orleans Washington, DC Los Angeles Miami Beach New York 1 1 2 5 12 987 Units 252 Units 68 Units 79 Units 60 Units 1,394 Units 252 Units 247 Units 79 Units 60 Units ** including those under lease but not yet available for rent 2,500 - 3,000* 6,000* 9,000 – 12,000* * Under Master Lease Agreement
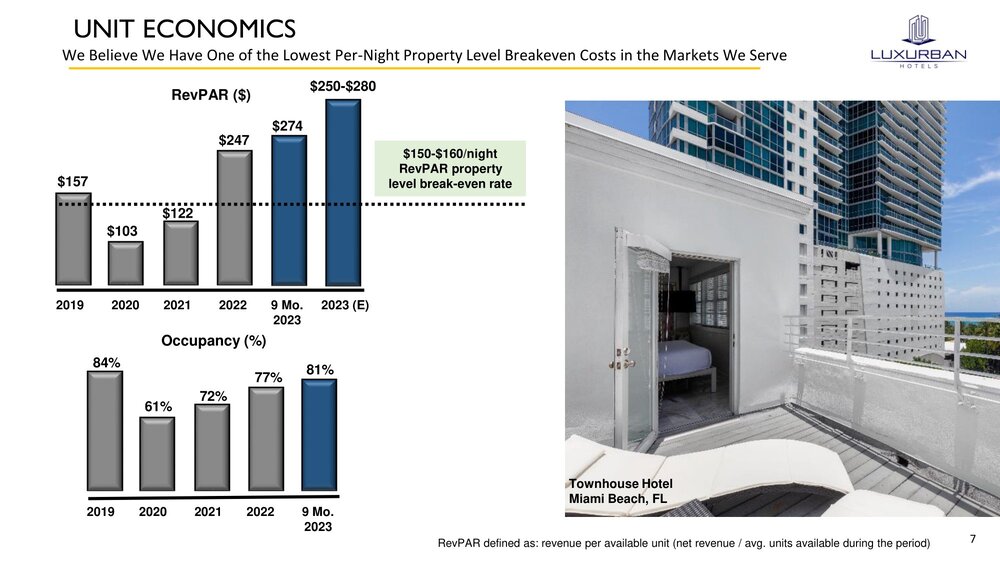
7 UNIT ECONOMICS RevPAR defined as: revenue per available unit (net revenue / avg. units available during the period) 2019 2020 2021 2022 9 Mo. 2023 (E) 2023 2019 2020 2021 2022 9 Mo. 2023 RevPAR ($) Occupancy (%) 84% 61% 72% 77% 81% $103 $157 $122 $247 $250 - $280 $150 - $160/night RevPAR property level break - even rate We Bel ie ve We Have One of the Lowest Per - Night Property Level Breakeven Costs in the Markets We Serve Townhouse Hotel Miami Beach, FL $274

8 WYNDHAM COLLABORATION OVERVIEW 95+ Countries ~9,100 Hotels 24 Global Brands 852,000 Rooms Initial 17 LuxUrban Hotels onboarded to Wyndham platform Opportunity to introduce additi o nal properties into the brand throughout course of relationship Term of 15 - 20 years, with LuxUrban maintaining operational control Wyndham to provide financial, sales and operational support, including growth & working capital
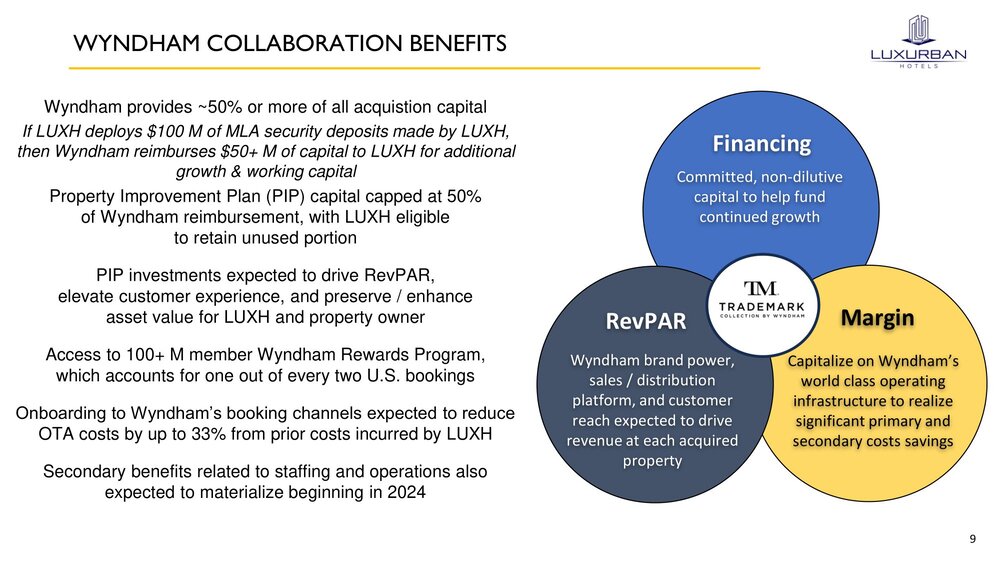
9 WYNDHAM COLLABORATION BENEFITS Margin Capitalize on Wyndham’s world class operating infrastructure to realize significant primary and secondary costs savings RevPAR Wyndham brand power, sales / distribution platform, and customer reach expected to drive revenue at each acquired property Financing Committed, non - dilutive capital to help fund continued growth Wyndham provides ~50% or more of all acquistion capital If LUXH deploys $100 M of MLA security deposits made by LUXH, then Wyndham reimburses $50+ M of capital to LUXH for additi o nal growth & working capital Property Improvement Plan (PIP) capital capped at 50% of Wyndham reimbursement, with LUXH eligible to retain unused portion PIP investments expected to drive RevPAR, elevate customer experience, and preserve / enhance asset value for LUXH and property owner Access to 100+ M member Wyndham Rewards Program, whi ch accounts for one out of every two U.S. bookings Onboarding to Wyndham’s booking channels expected to reduce OTA costs by up to 33% from prior costs incurred by LUXH Secondary benefits related to staffing and operations also expected to materialize beginning in 2024
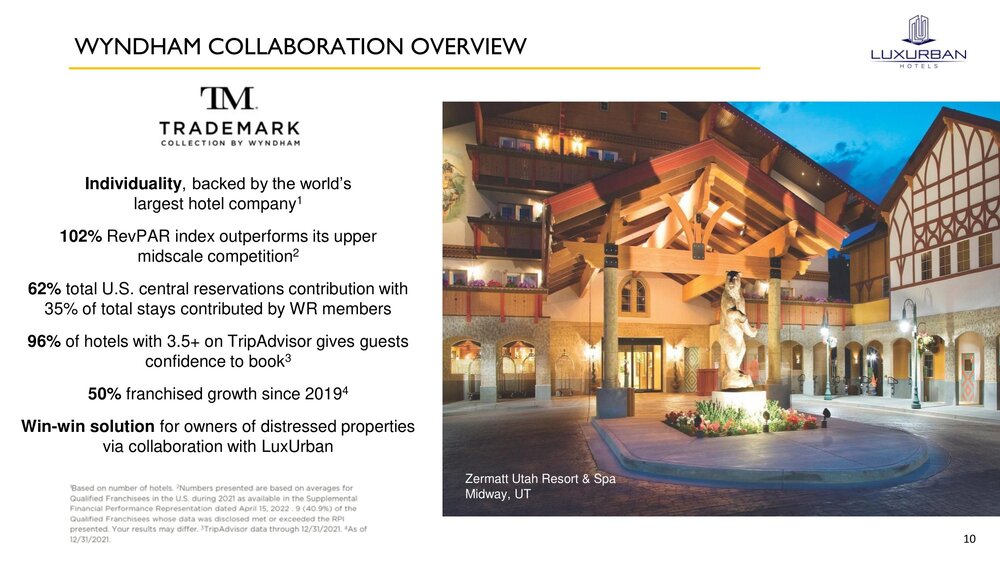
10 WYNDHAM COLLABORATION OVERVIEW Individuality , backed by the world’s largest hotel company 1 102% RevPAR index outperforms its upper midscale competition 2 62% total U.S. central reservations contribution with 35% of total stays contributed by WR members 96% of hotels with 3.5+ on TripAdvisor gives guests confidence to book 3 50% franchised growth since 2019 4 Win - win solution for owners of distressed properties via collaboration with LuxUrban Zermatt Utah Resort & Spa Midway, UT
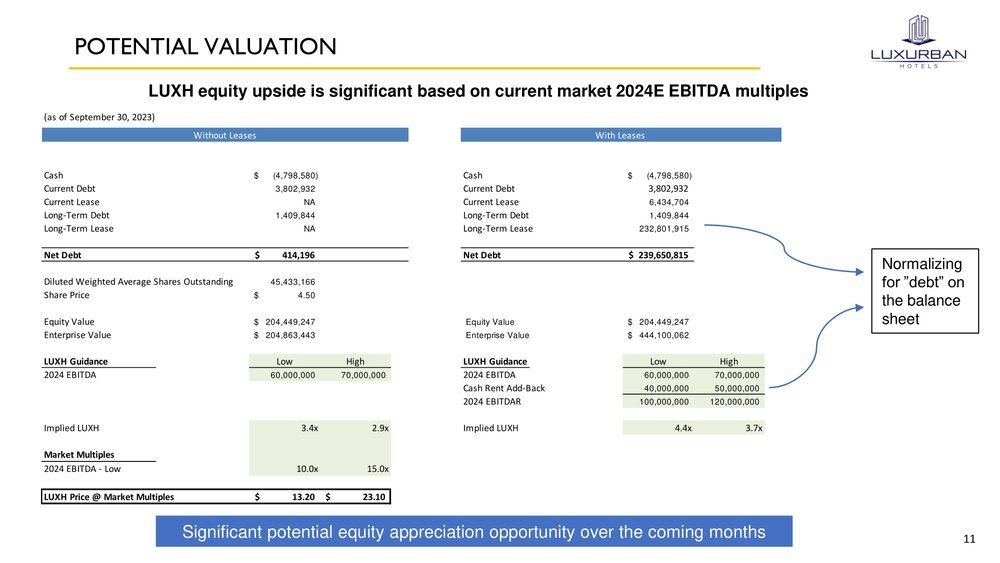
11 POTENTIAL VALUATION LUXH equity upside is significant based on current market 2024E EBITDA multiples Significant potential equity appreciation opportunity over the coming months Normalizing for ”debt” on the balance sheet (as of September 30, 2023) Cash (4,798,580)$ Cash (4,798,580)$ Current Debt 3,802,932 Current Debt 3,802,932 Current Lease NA Current Lease 6,434,704 Long-Term Debt 1,409,844 Long-Term Debt 1,409,844 Long-Term Lease NA Long-Term Lease 232,801,915 Net Debt 414,196$ Net Debt 239,650,815$ Diluted Weighted Average Shares Outstanding 45,433,166 Share Price 4.50$ Equity Value 204,449,247$ Equity Value 204,449,247$ Enterprise Value 204,863,443$ Enterprise Value 444,100,062$ LUXH Guidance Low High LUXH Guidance Low High 2024 EBITDA 60,000,000 70,000,000 2024 EBITDA 60,000,000 70,000,000 Cash Rent Add-Back 40,000,000 50,000,000 2024 EBITDAR 100,000,000 120,000,000 Implied LUXH 3.4x 2.9x Implied LUXH 4.4x 3.7x Market Multiples 2024 EBITDA - Low 10.0x 15.0x LUXH Price @ Market Multiples 13.20$ 23.10$ Without Leases With Leases

12 Avg. acquisition cost / unit $13,465 2023 YTD RevPar $274 YTD EBITDA Margin 24% Payback period* 6 months PROPERTY ACQUISITION MATH Six - month payback period on acquisition capital deployed. * Payback period: $13,465 avg. acquisition cost / [($274 RevPar * 365 days * 24% EBITDA margin) / 12 months]
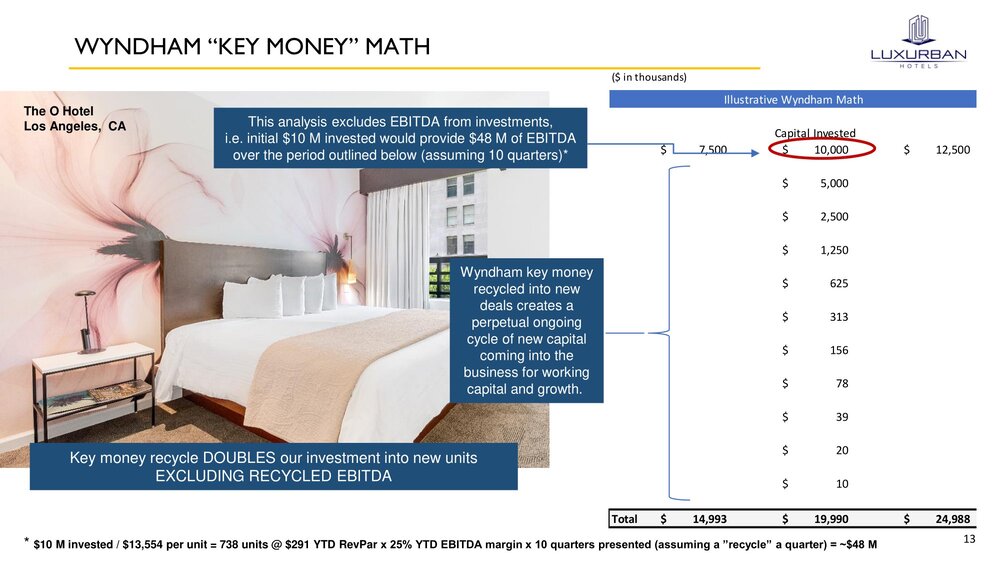
13 WYNDHAM “KEY MONEY” MATH ($ in thousands) Capital Invested 7,500$ 10,000$ 12,500$ 3,750$ 5,000$ 6,250$ 1,875$ 2,500$ 3,125$ 938$ 1,250$ 1,563$ 469$ 625$ 781$ 234$ 313$ 391$ 117$ 156$ 195$ 59$ 78$ 98$ 29$ 39$ 49$ 15$ 20$ 24$ 7$ 10$ 12$ Total 14,993$ 19,990$ 24,988$ Illustrative Wyndham Math The O Hotel Los Angeles, CA This analysis excludes EBITDA from investments, i.e. initial $10 M invested would provide $48 M of EBITDA over the period outlined below (assuming 10 quarters)* Wyndham key money recycled into new deals creates a perpetual ongoing cycle of new capital coming into the business for working capital and growth. * $10 M invested / $13,554 per unit = 738 units @ $291 YTD RevPar x 25% YTD EBITDA margin x 10 quarters presented (assuming a ”recycle” a quarter) = ~$48 M Key money recycle DOUBLES our investment into new units EXCLUDING RECYCLED EBITDA

14 APPENDIX The Bogart Hotel Brooklyn, NY
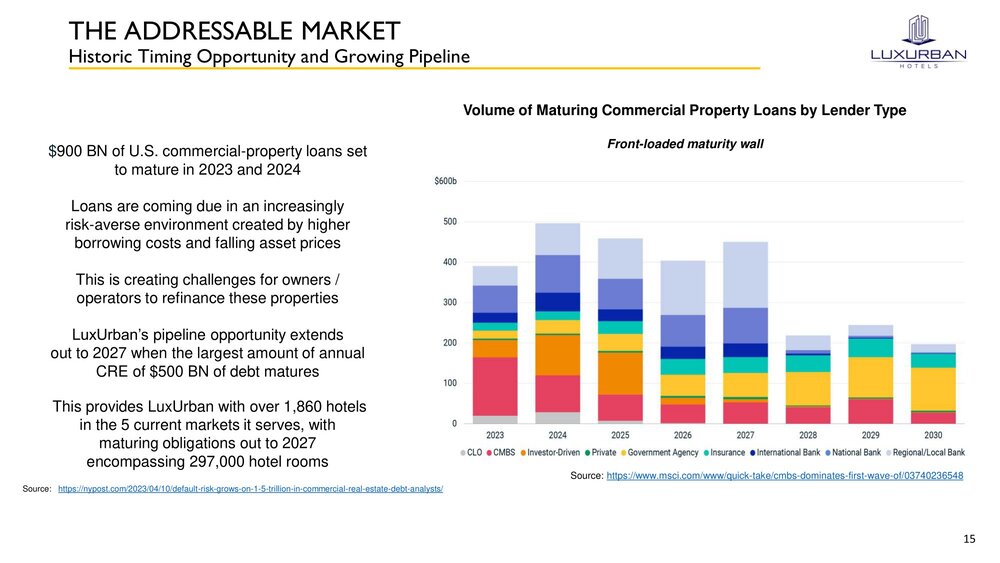
15 THE ADDRESSABLE MARKET Historic Timing Opportunity and Growing Pipeline Volume of Maturing Commercial Property Loans by Lender Type Front - loaded maturity wall Source: https://nypost.com/2023/04/10/default - risk - grows - on - 1 - 5 - trillion - in - commercial - real - estate - debt - analysts/ Source: https://www.msci.com/www/quick - take/cmbs - dominates - first - wave - of/03740236548 $ 900 BN of U.S. commercial - property loans set to mature in 2023 and 2024 Loans are coming due in an increasingly risk - averse environment created by higher borrowing costs and falling asset prices This is creating challenges for owners / operators to refinance these properties L uxUrban’s pipeline opportunity extends out to 2027 when the largest amount of annual CRE of $500 BN of debt matures This provides LuxUrban with over 1,860 hotels in the 5 current markets it serves, with maturing obligations out to 2027 encompassing 297,000 hotel rooms

16 Q3 2023 FINANCIAL OVERVIEW ($ in Ms ) SERVICE Record net rental revenue and EBITDA First ever quarterly GAAP net income 1,446 units available for rent Net Rental Revenue Cash and equivalents T otal Debt Shareholders’ Equity Net Income EBITDA $31.2 $11.6 $4.9 $ (3.2) $8.4 $2.4 Q3 2023 v. Q3 2022 September 30, 2023 v. December 31, 2022 $4.8 $1.1 $5.2 $14.0 $21.5 $ (3.3) Cash position increased 4x Total debt* and net debt** declined Shareholders’ Equity improved by ~$25 M * Total Debt is comprised of short - term business financing, current loans payable and non - current loans payable ** Net Debt is comprised of Total Debt minus Cash & Cash Equivalents
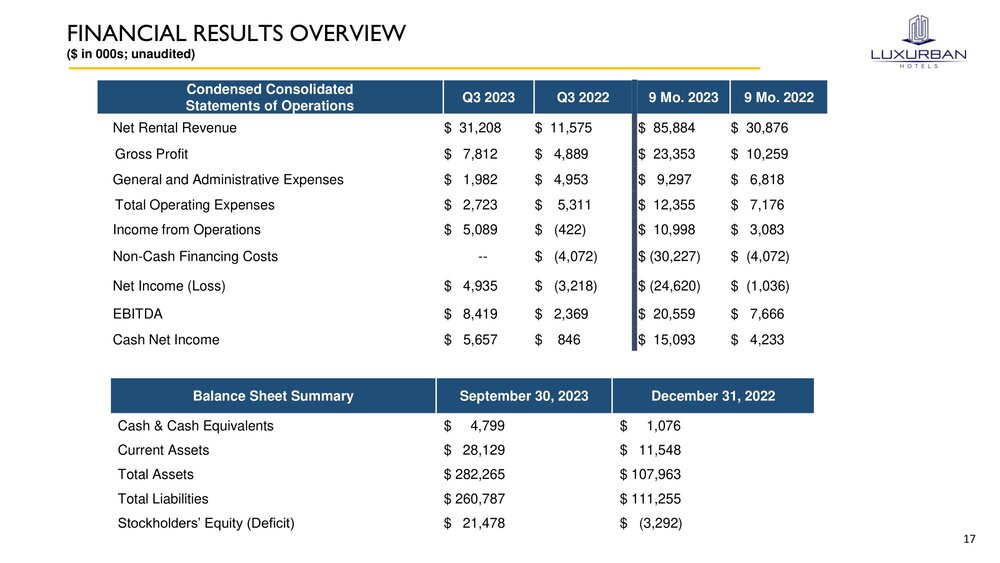
17 FINANCIAL RESULTS OVERVIEW ($ in 000s; unaudited) 9 Mo. 2022 9 Mo. 2023 Q3 2022 Q3 2023 Condensed Consolidated Statements of Operations $ 30,876 $ 85,884 $ 11,575 $ 31,208 Net Rental Revenue $ 10,259 $ 23,353 $ 4,889 $ 7,812 Gross Profit $ 6,818 $ 9,297 $ 4,953 $ 1,982 General and Administrative Expenses $ 7,176 $ 12,355 $ 5,311 $ 2,723 Total Operating Expenses $ 3,083 $ 10,998 $ (422) $ 5,089 Income from Operations $ (4,072) $ (30,227) $ (4,072) -- Non - Cash Financing Costs $ (1,036) $ (24,620) $ (3,218) $ 4,935 Net Income (Loss) $ 7,666 $ 20,559 $ 2,369 $ 8,419 EBITDA $ 4,233 $ 15,093 $ 846 $ 5,657 Cash Net Income December 31, 2022 September 30, 2023 Balance Sheet Summary $ 1,076 $ 4,799 Cash & Cash Equivalents $ 11,548 $ 28,129 Current Assets $ 107,963 $ 282,265 Total Assets $ 111,255 $ 260,787 Total Liabilities $ (3,292) $ 21,478 Stockholders’ Equity (Deficit)
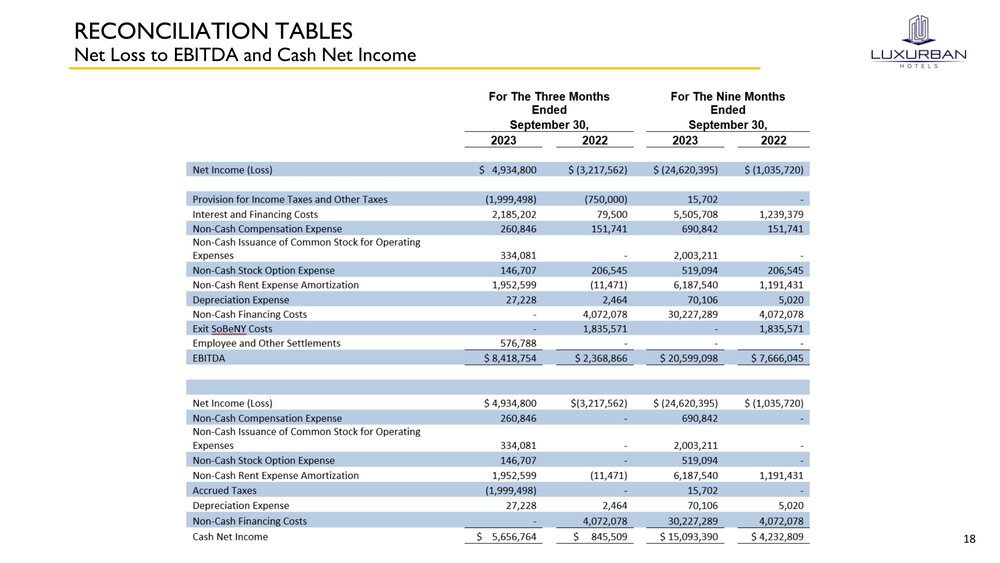
18 RECONCILIATION TABLES Net Loss to EBITDA and Cash Net Income

19 RECONCILIATION TABLES Net Loss to EBITDA and Cash Net Income
v3.23.3
Cover
|
Dec. 01, 2023 |
| Document Type |
8-K
|
| Amendment Flag |
false
|
| Document Period End Date |
Dec. 01, 2023
|
| Entity File Number |
001-41473
|
| Entity Registrant Name |
LuxUrban Hotels Inc.
|
| Entity Central Index Key |
0001893311
|
| Entity Tax Identification Number |
82-3334945
|
| Entity Incorporation, State or Country Code |
DE
|
| Entity Address, Address Line One |
2125 Biscayne Blvd
|
| Entity Address, Address Line Two |
Suite 253
|
| Entity Address, City or Town |
Miami
|
| Entity Address, State or Province |
FL
|
| Entity Address, Postal Zip Code |
33137
|
| City Area Code |
(844)
|
| Local Phone Number |
220-9973
|
| Written Communications |
false
|
| Soliciting Material |
false
|
| Pre-commencement Tender Offer |
false
|
| Pre-commencement Issuer Tender Offer |
false
|
| Entity Emerging Growth Company |
true
|
| Elected Not To Use the Extended Transition Period |
false
|
| Common Stock Par Value 0. 00001 Per Share [Member] |
|
| Title of 12(b) Security |
Common
Stock, par value $0.00001 per share
|
| Trading Symbol |
LUXH
|
| Security Exchange Name |
NASDAQ
|
| Series A Cumulative Redeemable Preferred [Member] |
|
| Title of 12(b) Security |
13.00%
Series A Cumulative Redeemable Preferred Stock, $0.00001 par value per share
|
| Trading Symbol |
LUXHP
|
| Security Exchange Name |
NASDAQ
|
| X |
- DefinitionBoolean flag that is true when the XBRL content amends previously-filed or accepted submission.
| Name: |
dei_AmendmentFlag |
| Namespace Prefix: |
dei_ |
| Data Type: |
xbrli:booleanItemType |
| Balance Type: |
na |
| Period Type: |
duration |
|
| X |
- DefinitionFor the EDGAR submission types of Form 8-K: the date of the report, the date of the earliest event reported; for the EDGAR submission types of Form N-1A: the filing date; for all other submission types: the end of the reporting or transition period. The format of the date is YYYY-MM-DD.
| Name: |
dei_DocumentPeriodEndDate |
| Namespace Prefix: |
dei_ |
| Data Type: |
xbrli:dateItemType |
| Balance Type: |
na |
| Period Type: |
duration |
|
| X |
- DefinitionThe type of document being provided (such as 10-K, 10-Q, 485BPOS, etc). The document type is limited to the same value as the supporting SEC submission type, or the word 'Other'.
| Name: |
dei_DocumentType |
| Namespace Prefix: |
dei_ |
| Data Type: |
dei:submissionTypeItemType |
| Balance Type: |
na |
| Period Type: |
duration |
|
| X |
- DefinitionAddress Line 1 such as Attn, Building Name, Street Name
| Name: |
dei_EntityAddressAddressLine1 |
| Namespace Prefix: |
dei_ |
| Data Type: |
xbrli:normalizedStringItemType |
| Balance Type: |
na |
| Period Type: |
duration |
|
| X |
- DefinitionAddress Line 2 such as Street or Suite number
| Name: |
dei_EntityAddressAddressLine2 |
| Namespace Prefix: |
dei_ |
| Data Type: |
xbrli:normalizedStringItemType |
| Balance Type: |
na |
| Period Type: |
duration |
|
| X |
- Definition
+ References
+ Details
| Name: |
dei_EntityAddressCityOrTown |
| Namespace Prefix: |
dei_ |
| Data Type: |
xbrli:normalizedStringItemType |
| Balance Type: |
na |
| Period Type: |
duration |
|
| X |
- DefinitionCode for the postal or zip code
| Name: |
dei_EntityAddressPostalZipCode |
| Namespace Prefix: |
dei_ |
| Data Type: |
xbrli:normalizedStringItemType |
| Balance Type: |
na |
| Period Type: |
duration |
|
| X |
- DefinitionName of the state or province.
| Name: |
dei_EntityAddressStateOrProvince |
| Namespace Prefix: |
dei_ |
| Data Type: |
dei:stateOrProvinceItemType |
| Balance Type: |
na |
| Period Type: |
duration |
|
| X |
- DefinitionA unique 10-digit SEC-issued value to identify entities that have filed disclosures with the SEC. It is commonly abbreviated as CIK. Reference 1: http://www.xbrl.org/2003/role/presentationRef
-Publisher SEC
-Name Exchange Act
-Number 240
-Section 12
-Subsection b-2
| Name: |
dei_EntityCentralIndexKey |
| Namespace Prefix: |
dei_ |
| Data Type: |
dei:centralIndexKeyItemType |
| Balance Type: |
na |
| Period Type: |
duration |
|
| X |
- DefinitionIndicate if registrant meets the emerging growth company criteria. Reference 1: http://www.xbrl.org/2003/role/presentationRef
-Publisher SEC
-Name Exchange Act
-Number 240
-Section 12
-Subsection b-2
| Name: |
dei_EntityEmergingGrowthCompany |
| Namespace Prefix: |
dei_ |
| Data Type: |
xbrli:booleanItemType |
| Balance Type: |
na |
| Period Type: |
duration |
|
| X |
- DefinitionCommission file number. The field allows up to 17 characters. The prefix may contain 1-3 digits, the sequence number may contain 1-8 digits, the optional suffix may contain 1-4 characters, and the fields are separated with a hyphen.
| Name: |
dei_EntityFileNumber |
| Namespace Prefix: |
dei_ |
| Data Type: |
dei:fileNumberItemType |
| Balance Type: |
na |
| Period Type: |
duration |
|
| X |
- DefinitionTwo-character EDGAR code representing the state or country of incorporation.
| Name: |
dei_EntityIncorporationStateCountryCode |
| Namespace Prefix: |
dei_ |
| Data Type: |
dei:edgarStateCountryItemType |
| Balance Type: |
na |
| Period Type: |
duration |
|
| X |
- DefinitionThe exact name of the entity filing the report as specified in its charter, which is required by forms filed with the SEC. Reference 1: http://www.xbrl.org/2003/role/presentationRef
-Publisher SEC
-Name Exchange Act
-Number 240
-Section 12
-Subsection b-2
| Name: |
dei_EntityRegistrantName |
| Namespace Prefix: |
dei_ |
| Data Type: |
xbrli:normalizedStringItemType |
| Balance Type: |
na |
| Period Type: |
duration |
|
| X |
- DefinitionThe Tax Identification Number (TIN), also known as an Employer Identification Number (EIN), is a unique 9-digit value assigned by the IRS. Reference 1: http://www.xbrl.org/2003/role/presentationRef
-Publisher SEC
-Name Exchange Act
-Number 240
-Section 12
-Subsection b-2
| Name: |
dei_EntityTaxIdentificationNumber |
| Namespace Prefix: |
dei_ |
| Data Type: |
dei:employerIdItemType |
| Balance Type: |
na |
| Period Type: |
duration |
|
| X |
- DefinitionLocal phone number for entity.
| Name: |
dei_LocalPhoneNumber |
| Namespace Prefix: |
dei_ |
| Data Type: |
xbrli:normalizedStringItemType |
| Balance Type: |
na |
| Period Type: |
duration |
|
| X |
- DefinitionBoolean flag that is true when the Form 8-K filing is intended to satisfy the filing obligation of the registrant as pre-commencement communications pursuant to Rule 13e-4(c) under the Exchange Act. Reference 1: http://www.xbrl.org/2003/role/presentationRef
-Publisher SEC
-Name Exchange Act
-Number 240
-Section 13e
-Subsection 4c
| Name: |
dei_PreCommencementIssuerTenderOffer |
| Namespace Prefix: |
dei_ |
| Data Type: |
xbrli:booleanItemType |
| Balance Type: |
na |
| Period Type: |
duration |
|
| X |
- DefinitionBoolean flag that is true when the Form 8-K filing is intended to satisfy the filing obligation of the registrant as pre-commencement communications pursuant to Rule 14d-2(b) under the Exchange Act. Reference 1: http://www.xbrl.org/2003/role/presentationRef
-Publisher SEC
-Name Exchange Act
-Number 240
-Section 14d
-Subsection 2b
| Name: |
dei_PreCommencementTenderOffer |
| Namespace Prefix: |
dei_ |
| Data Type: |
xbrli:booleanItemType |
| Balance Type: |
na |
| Period Type: |
duration |
|
| X |
- DefinitionTitle of a 12(b) registered security. Reference 1: http://www.xbrl.org/2003/role/presentationRef
-Publisher SEC
-Name Exchange Act
-Number 240
-Section 12
-Subsection b
| Name: |
dei_Security12bTitle |
| Namespace Prefix: |
dei_ |
| Data Type: |
dei:securityTitleItemType |
| Balance Type: |
na |
| Period Type: |
duration |
|
| X |
- DefinitionName of the Exchange on which a security is registered. Reference 1: http://www.xbrl.org/2003/role/presentationRef
-Publisher SEC
-Name Exchange Act
-Number 240
-Section 12
-Subsection d1-1
| Name: |
dei_SecurityExchangeName |
| Namespace Prefix: |
dei_ |
| Data Type: |
dei:edgarExchangeCodeItemType |
| Balance Type: |
na |
| Period Type: |
duration |
|
| X |
- DefinitionBoolean flag that is true when the Form 8-K filing is intended to satisfy the filing obligation of the registrant as soliciting material pursuant to Rule 14a-12 under the Exchange Act. Reference 1: http://www.xbrl.org/2003/role/presentationRef
-Publisher SEC
-Name Exchange Act
-Section 14a
-Number 240
-Subsection 12
| Name: |
dei_SolicitingMaterial |
| Namespace Prefix: |
dei_ |
| Data Type: |
xbrli:booleanItemType |
| Balance Type: |
na |
| Period Type: |
duration |
|
| X |
- DefinitionTrading symbol of an instrument as listed on an exchange.
| Name: |
dei_TradingSymbol |
| Namespace Prefix: |
dei_ |
| Data Type: |
dei:tradingSymbolItemType |
| Balance Type: |
na |
| Period Type: |
duration |
|
| X |
- DefinitionBoolean flag that is true when the Form 8-K filing is intended to satisfy the filing obligation of the registrant as written communications pursuant to Rule 425 under the Securities Act. Reference 1: http://www.xbrl.org/2003/role/presentationRef
-Publisher SEC
-Name Securities Act
-Number 230
-Section 425
| Name: |
dei_WrittenCommunications |
| Namespace Prefix: |
dei_ |
| Data Type: |
xbrli:booleanItemType |
| Balance Type: |
na |
| Period Type: |
duration |
|
| X |
- Details
| Name: |
us-gaap_StatementClassOfStockAxis=luxh_CommonStockParValue0.00001PerShareMember |
| Namespace Prefix: |
|
| Data Type: |
na |
| Balance Type: |
|
| Period Type: |
|
|
| X |
- Details
| Name: |
us-gaap_StatementClassOfStockAxis=luxh_SeriesACumulativeRedeemablePreferredMember |
| Namespace Prefix: |
|
| Data Type: |
na |
| Balance Type: |
|
| Period Type: |
|
|
LuxUrban Hotels (NASDAQ:LUXH)
Historical Stock Chart
From May 2024 to Jun 2024

LuxUrban Hotels (NASDAQ:LUXH)
Historical Stock Chart
From Jun 2023 to Jun 2024
