Rapidly emerging from a massive setback in 2012, the U.S. energy
sector is geared up to be one of the top performers in 2013 given
its strong fundamentals and low valuations (Read: (5 Sector ETFs
Surging to Start 2013).
The energy ETFs were in the red for most of 2012, mainly due to
a sluggish oil market, but these funds began to bounce back from
the latter part of the year, and we expect this wining momentum to
continue for the rest of 2013.
Since the pulse of the energy sector is closely tied to the
swings in the macro economy, the improvement in the U.S. economy
should trigger energy consumption. While the recent strengthening
of the U.S. dollar will likely affect oil prices, rising U.S. oil
production and greater energy conservation should be sufficient to
mitigate price losses due to currency headwinds.
The surge in the energy sector is mainly due to a rise in U.S.
oil production which is limiting the nation’s net oil imports. The
U.S., which is the largest consumer of oil, has seen growth in
energy production by leaps and bounds. The million barrel-per-day
jump in oil production was the biggest increase globally in 2012,
and a record single-year increase in the country’s history.
Also, the current boom in oil production shows little sign of
waning thereby strengthening the sector for the long term. In fact,
by 2035, the U.S. is expected to be “energy independent” and start
exporting natural gas by the end of this decade (Read: 3 Energy
ETFs for America's Production Boom).
This pumped optimism into the energy stocks and consequently the
ETFs since the start of 2013 (Read: Time to Buy Energy ETFs?).
According to the Energy Information Administration (EIA), which
provides official energy statistics from the U.S. government, world
liquid fuel consumption grew an estimated 0.7 million barrels per
day in 2012 to a record-high level of 89.0 million barrels per day.
The companies engaged in the drilling and extraction of oil were
the major beneficiaries of the trend.
The bullish fundamentals make it important to find a top ranked
pick in this segment. In order to do this, investors can look at
the Zacks ETF Rank and find the top energy ETF.
About the Zacks ETF Rank
The Zacks ETF Rank provides a recommendation for the ETF in the
context of our outlook for the underlying industry, sector, style
box or asset class (Read: Zacks ETF Rank Guide). Our proprietary
methodology also takes into account the risk preferences of
investors. ETFs are ranked on a scale of 1 (Strong Buy) to 5
(Strong Sell) while these also receive one of the three risk
ratings, namely Low, Medium or High.
The aim of our models is to select the best ETF within each risk
category. We assign each ETF one of the five ranks within each risk
bucket. Thus, the Zacks Rank reflects the expected return of an ETF
relative to other products with a similar level of risk (see more
in the Zacks ETF Center).
For investors seeking to apply this methodology to their
portfolio in the Energy sector, we have taken a closer look at the
top ranked PXI. This ETF, with a Zacks ETF Rank of 1 or ‘Strong
Buy’ (see the full list of top ranked ETFs), is detailed below:
PowerShares Dynamic Energy
Fund (PXI) in
Focus
Launched in October 2006, the PowerShares Dynamic Energy Fund
(PXI) – is an ETF designed to provide broad exposure to the US
energy sector. PXI tracks the Dynamic Energy Sector Intellidex
Index, and has amassed a net asset base of $132.0 million.
Holding 60 stocks in its basket, the fund is well diversified
across individual securities as it puts nearly equal weight on each
holding. The product puts just about 25.7% of its total assets in
the top 10 holdings, suggesting lower concentration risk (read:
Alternative ETF Weighting Methodologies 101).
Noble Energy Inc. (NBL), EOG Resources
Inc. (EOG) and Halliburton Co (HAL) are
its top three holdings with a respective weight of 2.68%, 2.63% and
2.60%. However, this choice is a bit pricey in the U.S. energy
space with around 66 bps of annual fees.
Its daily trading volume of 31,000 is also lower than the many
other choices. Basically, more ‘active’ funds like PXI seek to beat
out traditional indexes. This approach results in relatively higher
fees and turnover than the simpler funds in the space.
Capitalization-wise, the fund is almost uniformly distributed
with a large cap focus of 40% followed by a small cap and mid cap
focus of 38% and 22%, respectively. Style-wise also, the fund
structure calls for uniformity among value and growth funds. The
strategy of adopting equality in stock selection for each and every
parameter makes this fund a low-risk opportunity and a better
hedging instrument.
PXI started the year 2013 on a solid note, like many other
energy funds. Over the last one-year period, the return from PXI
(32.65%) massively outperformed the S&P/ TSX Capped energy
index (10.6%). Its return beat some of the category behemoths
including SPDR Energy Select Sector Fund (XLE)
Vanguard Energy ETF (VDE) and iShares Dow
Jones US Energy ETF (IYE) as well during the time
period.

Bottom Line
So far, the product has been relatively unappreciated as evident
by its lower trading volume. The fund is currently hovering below
its 52-week high price and given its potential, could continue to
appreciate in the months ahead as well.
So if current trends continue in the market, PXI could prove to
be an intriguing option for investors to play the energy boom this
year, especially while maintaining a focus on the domestic
market.
Want the latest recommendations from Zacks Investment Research?
Today, you can download 7 Best Stocks for the Next 30
Days. Click to get this free report >>
HALLIBURTON CO (HAL): Free Stock Analysis Report
NOBLE ENERGY (NBL): Free Stock Analysis Report
PWRSH-DYN EGY (PXI): ETF Research Reports
VIPERS-ENERGY (VDE): ETF Research Reports
SPDR-EGY SELS (XLE): ETF Research Reports
To read this article on Zacks.com click here.
Zacks Investment Research
Want the latest recommendations from Zacks Investment Research?
Today, you can download 7 Best Stocks for the Next 30 Days. Click
to get this free report
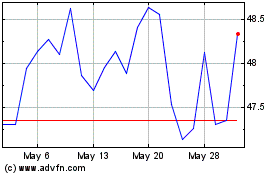
Invesco ETF Trust Invesc... (NASDAQ:PXI)
Historical Stock Chart
From Dec 2024 to Jan 2025

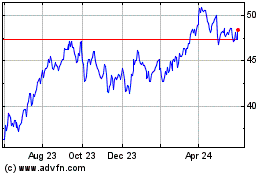
Invesco ETF Trust Invesc... (NASDAQ:PXI)
Historical Stock Chart
From Jan 2024 to Jan 2025
