SonoSite, Inc. (Nasdaq:SONO), the world leader and
specialist in hand-carried ultrasound for the point-of-care, today
reported financial results for the fourth quarter and year ended
December 31, 2009.
REVENUE
Revenues in the fourth quarter of 2009 were $69.7 million, a
decrease of 1% compared to the fourth quarter of 2008. Full year of
2009 revenues were $227.4 million, down 7% versus full year of
2008.
Revenues for the partial year acquisition of CardioDynamics were
$4.2 million for the fourth quarter and $7.1 million for the full
year of 2009.
Excluding partial year revenues from CDIC, SonoSite fourth
quarter revenues were $65.5 million, down 7% versus the fourth
quarter of 2008. Full year revenues excluding CDIC were $220.3
million, a decrease of 10% compared to 2008.
Changes in foreign currency rates increased worldwide revenues
by 4% in the fourth quarter and decreased revenues by 2% for the
full year.
OPERATING INCOME AND CASH FLOW
Fourth Quarter Results
Fourth quarter operating income was $6.8 million, an increase of
46% compared to the fourth quarter of 2008. Operating income for
the fourth quarter 2009 included charges from CDIC of $3.3 million,
related to operating results as well as acquisition and
integration.
Excluding CDIC, operating income in the fourth quarter of 2009
was $10.1 million, an increase of 117% compared to the fourth
quarter of 2008. Operating margins reached 15.4% for the
quarter.
Full Year Results
For the full year of 2009, operating income was $13.7 million,
including charges from CDIC of $6.9 million; a decrease of 39%
compared to the full year of 2008.
Excluding CDIC, full year of 2009 operating income was $20.6
million, down 8% versus the full year of 2008 on a $24 million or
10% revenue decline versus full year 2008.
Cash Flow
Operating cash flow was $15.3 million for the quarter and $24.4
million for the full year of 2009, as compared to $11.2 million and
$29.2 million for the comparable periods of 2008. Operating cash
flow for the full year of 2009 reflects the $21 million received to
settle a patent dispute in the fourth quarter.
Net income
For the fourth quarter of 2009, the Company recorded net income
of $2.2 million or $0.12 per share, compared to $6.0 million or
$0.34 per share in 2008. For the full year of 2009, net income was
$3.2 million or $0.18 per share compared to $11.2 million or $0.64
per share for the full year of 2008. Excluding non-recurring items
such as bond gains, acquisition expenses, and patent royalty
revenue, net income would have been $0.36 per share for the full
year of 2009 or essentially even with 2008.
COMMENTARY
“In a very tough year we simply got stronger as a company,
improving our operating model and tightening our capital allocation
process,” said Kevin M. Goodwin, SonoSite President and CEO. “We
successfully integrated CardioDynamics which included significant
changes to their sales force during the fourth quarter, while
successfully closing out our litigation matters and achieving 9%
operating margins, a level similar to 2008, despite core revenues
falling by $24 million or 10%.”
“With a difficult year behind us we are stronger and more
focused on growth initiatives for 2010 and beyond. We have leaned
out our ‘SG&A structure’ and are deploying our strategy across
four key vertical markets,” said Mr. Goodwin.
“We have also initiated market development in cardiovascular
disease management markets enabling us to expand our role in the
cardiovascular health marketplace.”
“Additionally, we are at work on revising our capital structure
with the recently announced “Dutch Auction” tender offer to
repurchase $100 million of our shares. Following a two year
evaluation of investment alternatives, it became clear to us that
investing in our own stock was our best choice,” Mr. Goodwin
further commented.
As of December 31, 2009, the company held $257.7 million in cash
and investments and had outstanding senior convertible notes of
$114.7 million for net liquidity of $143.0 million.
2010 FINANCIAL OUTLOOK
The company provided the following guidance:
- Revenue growth of up to 10%
- Level gross margin
- Operating margin of 11 –
13%
NON-GAAP MEASURES
This release includes a discussion of management measures that
are non-GAAP. We believe it is useful for investors to understand
the comparison of operating results in 2009 versus 2008 by
eliminating the impact of the CDIC related charges, convertible
debt repurchase, and partial year patent royalty revenues using
non-GAAP measures.
Conference Call Information
SonoSite will hold a conference call on February 11 at 1:30 pm
PT/4:30 pm ET. The call will be broadcast live and can be accessed
via http://www.sonosite.com/company/investors.
A replay of the audio webcast will be available beginning February
11, 2010, 5:30 pm PT and will be available until February 25, 2010,
9:59 pm PT by dialing 719-457-0820 or toll-free 888-203-1112. The
confirmation code 7406921 is required to access the replay. The
call will also be archived on SonoSite’s website.
About SonoSite
SonoSite, Inc. (www.sonosite.com) is the innovator and world
leader in hand-carried ultrasound. Headquartered near Seattle, the
company is represented by ten subsidiaries and a global
distribution network in over 100 countries. SonoSite’s small,
lightweight systems are expanding the use of ultrasound across the
clinical spectrum by cost-effectively bringing high performance
ultrasound to the point of patient care.
Forward-looking Information
and the Private Litigation Reform Act of 1995
Certain statements in this press release relating to our future
financial position and operating results are “forward-looking
statements” for the purposes of the safe harbor provisions of the
Private Securities Litigation Reform Act of 1995. These
forward-looking statements are based on the opinions and estimates
of our management at the time the statements are made and are
subject to risks and uncertainties that could cause actual results
to differ materially from those expected or implied by the
forward-looking statements. These statements are not guaranties of
future performance, are based on potentially inaccurate assumptions
and are subject to known and unknown risks and uncertainties,
including, without limitation, the risk that the acquisition of
CardioDynamics will not yield the expected potential benefits, our
ability to manufacture, market and sell our newest products,
spending patterns in the hospital market, healthcare reform,
prolonged adverse conditions in the U.S. or world economies or
SonoSite’s industry and the other factors contained in Item 1A.
“Risk Factors” section of our most recent Annual Report on Form
10-K filed with the Securities and Exchange Commission. We caution
readers not to place undue reliance upon these forward-looking
statements that speak only as to the date of this release. We
undertake no obligation to publicly revise any forward-looking
statements to reflect new information, events or circumstances
after the date of this release or to reflect the occurrence of
unanticipated events.
SonoSite, Inc.
Selected Financial
Information
Condensed Consolidated Statements of Income
(in thousands except per share data)
(unaudited) Three Months Ended Twelve Months Ended December 31,
December 31,
2009
2008
As Adjusted
2009
2008
As Adjusted
Revenue $ 69,728 $ 70,162 $ 227,389 $ 243,524 Cost of
revenue 21,433 22,753
69,466 73,715
Gross margin 48,295 47,409 157,923 169,809 Gross margin percentage
69.3 % 67.6 % 69.5 % 69.7 % Operating expenses: Research and
development 7,468 8,124 29,037 28,698 Sales, general and
administrative 33,979 34,610
115,206 118,679
Total operating expenses 41,447 42,734 144,243 147,377
Operating income* 6,848 4,675 13,680 22,432 Other
(loss) income, net** (2,695 ) 5,500
(8,181 ) (3,091 ) Income
before income taxes 4,153 10,175 5,499 19,341 Income tax
provision 1,967 4,206
2,265 8,120 Net
income $ 2,186 $ 5,969 $ 3,234
$ 11,221 Net income per share: Basic $
0.13 $ 0.35 $ 0.19 $
0.66 Diluted $ 0.12 $
0.34 $ 0.18 $ 0.64
Weighted average common and
potential common shares outstanding:
Basic 17,346 17,028
17,239 16,892
Diluted 17,832 17,511
17,698 17,486
Reconciliation of Non-GAAP net income: Income before
income taxes $ 4,153 $ 10,175 $ 5,499 $ 19,341 Adjustments to
income before income taxes for: Patent royalty revenue (652 ) -
(652 ) - Acquisition of CardioDynamics: Acquisition costs, net of
bargain purchase (gain) (79 ) - 389 - Integration costs 1,591 -
4,301 - Amortization of intangible assets 892 - 1,252 - Operating
loss, net 885 - 1,001 - Loss (gain) on repurchase of convertible
debt, net 239 (8,246 )
(1,100 ) (8,246 ) Non-GAAP income
before income taxes 7,029 1,929 10,690 11,095 Non-GAAP
income tax provision 3,329 797
4,403 4,658
Non-GAAP net income $ 3,700 $ 1,132 $
6,287 $ 6,437 Non-GAAP net
income per share: Basic $ 0.21 $ 0.07 $
0.36 $ 0.38 Diluted $
0.21 $ 0.06 $ 0.36 $ 0.37
Weighted average common and
potential common shares outstanding:
Basic 17,346 17,028
17,239 16,892
Diluted 17,832
17,511 17,698
17,486 *includes acquisition and
integration related charges of $3.3 million in the fourth quarter
and $8.0 million for the year ended 2009 reduced by a bargain
purchase gain of $1.1 million in the year to date.
**includes (gain) loss on
repurchase of convertible debt, net of deferred financing
costs.
Condensed Consolidated Balance Sheets
(in thousands) (unaudited) December 31,2009 December 31,2008
As Adjusted
Cash and cash equivalents $ 183,065 $ 209,258
Short-term investment securities 74,682 69,882 Accounts receivable,
net 71,347 66,094 Inventories 29,554 29,115 Deferred income taxes,
current 7,861 13,372 Prepaid expenses and other current assets
11,019 6,623 Total
current assets 377,528 394,344 Property and equipment, net
9,160 8,955 Investment securities - 578 Deferred income taxes, net
775 793 Intangible assets, net 27,920 16,829 Other assets
4,425 5,383 Total assets
$ 419,808 $ 426,882
Accounts payable $ 6,175 $ 6,189 Accrued expenses 25,605 31,921
Deferred revenue, current portion 5,504
2,755 Total current liabilities 37,284 40,865
Long-term debt, net 92,905 111,336 Deferred income taxes,
net 2,722 9,871 Deferred revenue 18,081 1,367 Other non-current
liabilities 13,670 12,383
Total liabilities 164,662 175,822 Shareholders'
equity: Common stock and additional paid-in capital 291,514 285,928
Accumulated deficit (32,802 ) (36,036 ) Accumulated other
comprehensive income (3,566 ) 1,168
Total shareholders' equity 255,146
251,060 Total liabilities and
shareholders' equity $ 419,808 $ 429,882
Condensed Consolidated Statements of Cash Flow
(in thousands) (unaudited) Twelve Months Ended
December 31,
2009
2008
As Adjusted
Operating activities: Net income $ 3,234 $ 11,221
Adjustments to reconcile net income to net cash provided by
operating activities: Depreciation and amortization 5,352 4,125
Stock-based compensation 6,632 8,709 Amortization of debt discount
and debt issuance costs 5,015 8,305 Deferred income tax provision
303 3,552 Gain on convertible debt repurchase (1,100 ) (8,246 )
Gain on purchase of CardioDynamics (1,099 ) - Other adjustments 586
(170 ) Changes in working capital 5,434
1,675 Net cash provided by operating
activities 24,357 29,171 Investing activities: Investment
securities, net (3,824 ) 50,390 Purchases of property and equipment
(2,586 ) (2,841 ) Acquisition of CardioDynamics (8,185 ) - Earn-out
consideration associated with SonoMetric acquisition
(387 ) (921 ) Net cash (used in) provided by
investing activities (14,982 ) 46,628 Financing activities:
Excess tax benefit from exercise of stock based compensation 144
1,025 Shares retired for taxes (1,342 ) - Retirement of convertible
debt and related hedge transactions (30,360 ) (61,923 ) Proceeds
from exercise of stock options & employee stock purchase plan
1,769 4,551 Net
cash used in financing activities (29,789 ) (56,347 ) Effect
of exchange rate changes on cash and cash equivalents
(5,779 ) 1,105 Net change in cash and
cash equivalents (26,193 ) 20,557 Cash and cash equivalents at
beginning of period 209,258
188,701 Cash and cash equivalents at end of period $
183,065 $ 209,258
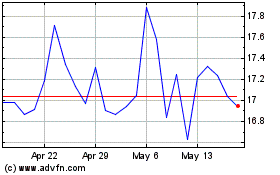
Sonos (NASDAQ:SONO)
Historical Stock Chart
From Jun 2024 to Jul 2024

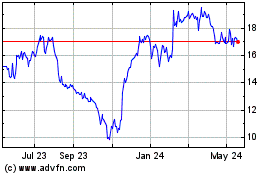
Sonos (NASDAQ:SONO)
Historical Stock Chart
From Jul 2023 to Jul 2024
