Global Blue Releases the Monthly Tax Free Shopping Business Update for June 2024
July 05 2024 - 5:07AM
Business Wire
- Fresh data from Global Blue reveals that the global dynamic
recovery for Tax Free Shopping accelerated across Continental
Europe and Asia Pacific.
- Globally, issued Sales in Store like-for-like recovery
reached 168%1 in June 2024 compared to the same period in 2019, vs.
163%1 in April/May 2024 and 140%1 in Q1 2024.
An accelerating worldwide recovery, compared to 2019
levels
Globally, June 2024 recovery is ahead of April/May 2024
recovery, reaching 168%1 vs. 163%1 in April/May and 140%1 in Q1.
This is driven by a solid momentum across destinations.
In Continental Europe, June 2024 recovery has slightly
accelerated compared to April/May 2024, reaching 147%1 in June vs.
141%1 in April/May and 128%1 in Q1, propelled by strong recoveries
in France (164%1), Spain (160%1) and Italy (163%1). In terms of
origin markets, GCC shopper recovery significantly
influenced the positive impact of the recovery in June, reaching
335%1 vs. 302%1 in April/May. This seasonal boost is linked to the
shift in the Eid Al Adha calendar2. US shopper recovery also
remains strong, reaching 317%1 in June vs. 308%1 in April/May.
In Asia Pacific, the recovery rate remained strong at
236%1 in June vs. 223%1 in April/May. Regarding origin
markets, travelers from Hong Kong and Taiwan continue to lead
the recovery, reaching 764%1 in June vs. 601%1 in April/May. North
East Asia travelers follow closely, with a recovery rate of 386%1
in June vs. 352%1 in April/May.
For Mainland Chinese shoppers, the worldwide issued Sales
in Store like-for-like recovery reached 122%1 in June, in line with
April/May and 101%1 in Q1 ‘24. Within Continental Europe,
Mainland Chinese shopper recovery reached 58%1 in June vs. 63%1 in
April/May. In Asia Pacific, Mainland Chinese shopper
recovery continues to accelerate, reaching 214%1 in June and 190%1
in April/May.
A strong year-on-year performance for international
shopping
When analyzing the year-on-year variation in Tax Free Shopping
growth, the worldwide issued Sales in Store like-for-like
year-on-year performance reached +32%3 in June 2024 vs. +47%3 in
April/May and +40%3 in Q1.
In Continental Europe, the issued Sales in Store growth
rate grew by +14%3 in June 2024 vs. last year, influenced by a
positive dynamic across nationalities. Regarding origin
markets, the positive momentum for issued Sales in Store growth
is visible across all nationalities, with GCC shoppers leading the
way, with the US at +39%3 and Mainland Chinese at a +13%3 growth
rate in June 2024.
In Asia Pacific, the issued Sales in Store growth rate
continues to remain high, reaching +92%3 in June 2024 vs. last
year. All nationalities contributed positively, with
Mainland Chinese leading the way at +161%3 in June 2024 vs. 2023,
North East shoppers at +122%3 and Hong Kong and Taiwan at
+66%3.
APPENDIX
Worldwide recovery rate (versus 2019) rate
Issued SIS L/L
recovery1
(in % of 2019)
% Issued SIS 2019
June
2024
May
2024
April
2024
March
2024
CY Q1
2024
CY Q4
2023
France
22%
164%
170%
158%
160%
165%
140%
Italy
24%
163%
164%
145%
135%
123%
123%
Spain
14%
160%
169%
166%
152%
151%
133%
Germany
13%
90%
73%
73%
69%
65%
74%
Other countries
27%
137%
127%
129%
121%
126%
111%
Total Continental Europe
100%
147%
145%
137%
130%
128%
118%
Japan
54%
359%
360%
262%
235%
232%
225%
Singapore
42%
85%
103%
81%
111%
92%
75%
South Korea
4%
170%
164%
140%
127%
125%
111%
Total Asia Pacific
100%
236%
250%
192%
181%
166%
150%
Total worldwide
100%
168%
172%
153%
145%
140%
127%
Worldwide Year-on-Year Growth Rate (2024 vs. 2023)
Issued SIS L/L
Year-on-Year
Growth3
% Issued SIS 2023
June
2024
May
2024
April
2024
March
2024
February
2024
CY
Q1 2024
France
26%
+5%
+14%
+13%
+3%
+21%
+11%
Italy
25%
+15%
+29%
+30%
+20%
+44%
+29%
Spain
15%
+29%
+33%
+38%
+18%
+52%
+32%
Germany
8%
-1%
-7%
+15%
-10%
+9%
+6%
Other countries
26%
+16%
+21%
+24%
+9%
+30%
+16%
Total Continental
Europe
100%
+14%
+19%
+25%
+9%
+32%
+19%
Japan
65%
+135%
+222%
+167%
+146%
+170%
+137%
Singapore
27%
-2%
+2%
-4%
+24%
+36%
25%
South Korea
8%
+61%
+58%
+63%
+96%
+138%
110%
Total Asia Pacific
100%
+92%
+134%
+103%
+102%
+120%
97%
Total worldwide
100%
+32%
+47%
+46%
+33%
57%
40%
GLOSSARY
- Gulf Cooperation Council countries include:
Kuwait, Qatar, Saudi Arabia, United Arab Emirates, Bahrain, Oman -
South East Asia includes: Indonesia, Thailand, Cambodia,
Philippines, Vietnam, Malaysia, Singapore - North East Asia
includes: Japan, South Korea
ABOUT GLOBAL BLUE
Global Blue is the business partner for the shopping journey,
providing technology and services to enhance the experience and
drive performance.
With over 40 years of expertise, today we connect thousands of
retailers, acquirers, and hotels with nearly 80 million consumers
across 53 countries, in three industries: Tax Free Shopping,
Payments and Post-Purchase solutions.
With over 2,000 employees, Global Blue generated €28bn Sales in
Store and €422M revenue in FY 2023/24. Global Blue is listed on the
New York Stock Exchange.
For more information, please visit www.globalblue.com
Global Blue Monthly Intelligence Briefing, June 2024, Source:
Global Blue
1 Recovery rate is equal to 2024 Issued Sales in Store divided
by 2019 Issued Sales in Store, like-for-like (i.e.: at constant
merchant scope and exchange rates). 2 Eid Al Adha took place from
June 15, 2024, to June 20, 2024, while it took place from August
10, 2019 to August 14, 2019. 3 Growth rate variation year-on-year
(2024 vs. the same period in 2023)
View source
version on businesswire.com: https://www.businesswire.com/news/home/20240705935221/en/
MEDIA Virginie Alem – SVP Marketing & Communications
Mail: valem@globalblue.com
INVESTOR RELATIONS Frances Gibbons – Head of Investor
Relations Mob: +44 (0)7815 034 212 Mail:
fgibbons@globalblue.com
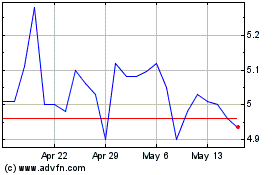
Global Blue (NYSE:GB)
Historical Stock Chart
From Dec 2024 to Jan 2025

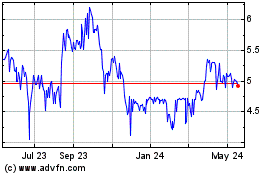
Global Blue (NYSE:GB)
Historical Stock Chart
From Jan 2024 to Jan 2025
