SECURITIES AND EXCHANGE COMMISSION
Washington D.C. 20549
FORM 6-K
REPORT OF FOREIGN ISSUER
PURSUANT TO RULE 13a-16 OR 15d-16
OF THE SECURITIES EXCHANGE ACT OF 1934
Date: 9 November 2023
Commission File Number: 001-14958
NATIONAL GRID plc
(Registrant’s Name)
1-3 Strand
London WC2N 5EH, England
(Registrant’s Address)
Indicate by check mark whether the registrant files or will file annual reports under cover of Form 20-F or Form 40-F.
☒ Form 20-F ☐ Form 40-F
Indicate by check mark if the registrant is submitting the Form 6-K in paper as permitted by Regulation S-T Rule 101(b)(1): ☐
Indicate by check mark if the registrant is submitting the Form 6-K in paper as permitted by Regulation S-T Rule 101(b)(7): ☐
Indicate by check mark whether the registrant by furnishing the information contained in this Form is also thereby furnishing the information to the Commission pursuant to Rule 12g3- 2(b) under the Securities Exchange Act of 1934. ☐ Yes ☒ No
If “Yes” is marked, indicate below the file number assigned to the registrant in connection with Rule 12g3-2(b): n/a
INCORPORATION BY REFERENCE
This report and Exhibit 99.1 of this report on Form 6-K shall be deemed to be incorporated by reference into the registration statements on Form F-3 (Registration Number 333-256888) and Form S-8 (Registration Numbers 333-184558, 333-170716, 333-175852, 333-155527, 333-149828, 333-107727, 333-103768, 333-97249, 333-65968, and 333-33094) of National Grid plc (the "Company") (including any prospectuses forming a part of such registration statements) and to be a part thereof from the date on which this report is filed, to the extent not superseded by documents or reports subsequently filed or furnished.
Please see Exhibit 99.1 Announcement sent to the London Stock Exchange on 9 November 2023 — 'National Grid 2023/24 Half Year Results Statement'
SIGNATURE
Pursuant to the requirements of the Securities Exchange Act of 1934, the registrant has duly caused this report to be signed on its behalf by the undersigned, thereunto duly authorized.
| | | | | | | | | | | |
| | NATIONAL GRID plc |
| | | |
| | By: | /s/Pritti Patel
_______________________ |
| | | Pritti Patel
Company Secretary |
Date: 9 November 2023
EXHIBIT INDEX
FALSE000100431531/330/9/20232024Q2NATIONAL GRID PLC6-K00010043152023-04-012023-09-30iso4217:GBPiso4217:GBPxbrli:shares00010043152022-04-012022-09-300001004315ifrs-full:IssuedCapitalMember2023-03-310001004315ifrs-full:SharePremiumMember2023-03-310001004315ifrs-full:RetainedEarningsMember2023-03-310001004315ifrs-full:OtherReservesMember2023-03-310001004315ifrs-full:EquityAttributableToOwnersOfParentMember2023-03-310001004315ifrs-full:NoncontrollingInterestsMember2023-03-3100010043152023-03-310001004315ifrs-full:RetainedEarningsMember2023-04-012023-09-300001004315ifrs-full:EquityAttributableToOwnersOfParentMember2023-04-012023-09-300001004315ifrs-full:NoncontrollingInterestsMember2023-04-012023-09-300001004315ifrs-full:OtherReservesMember2023-04-012023-09-300001004315ifrs-full:IssuedCapitalMember2023-04-012023-09-300001004315ifrs-full:SharePremiumMember2023-04-012023-09-300001004315ifrs-full:IssuedCapitalMember2023-09-300001004315ifrs-full:SharePremiumMember2023-09-300001004315ifrs-full:RetainedEarningsMember2023-09-300001004315ifrs-full:OtherReservesMember2023-09-300001004315ifrs-full:EquityAttributableToOwnersOfParentMember2023-09-300001004315ifrs-full:NoncontrollingInterestsMember2023-09-3000010043152023-09-300001004315ifrs-full:IssuedCapitalMember2022-03-310001004315ifrs-full:SharePremiumMember2022-03-310001004315ifrs-full:RetainedEarningsMember2022-03-310001004315ifrs-full:OtherReservesMember2022-03-310001004315ifrs-full:EquityAttributableToOwnersOfParentMember2022-03-310001004315ifrs-full:NoncontrollingInterestsMember2022-03-3100010043152022-03-310001004315ifrs-full:RetainedEarningsMember2022-04-012022-09-300001004315ifrs-full:EquityAttributableToOwnersOfParentMember2022-04-012022-09-300001004315ifrs-full:OtherReservesMember2022-04-012022-09-300001004315ifrs-full:NoncontrollingInterestsMember2022-04-012022-09-300001004315ifrs-full:IssuedCapitalMember2022-04-012022-09-300001004315ifrs-full:SharePremiumMember2022-04-012022-09-300001004315ifrs-full:IssuedCapitalMember2022-09-300001004315ifrs-full:SharePremiumMember2022-09-300001004315ifrs-full:RetainedEarningsMember2022-09-300001004315ifrs-full:OtherReservesMember2022-09-300001004315ifrs-full:EquityAttributableToOwnersOfParentMember2022-09-300001004315ifrs-full:NoncontrollingInterestsMember2022-09-3000010043152022-09-300001004315nggtf:TheNarragansettElectricCompanyMember2023-04-012023-09-300001004315nggtf:TheNarragansettElectricCompanyMember2022-04-012022-09-300001004315nggtf:NationalGridRenewablesAndEmeraldEnergyVentureLLCMember2023-04-012023-09-300001004315nggtf:NationalGridRenewablesAndEmeraldEnergyVentureLLCMember2022-04-012022-09-300001004315nggtf:GasTTopCoLimitedMember2023-03-312023-03-31xbrli:pure0001004315nggtf:FixedInterestRateBondsMember2023-09-30nggtf:segment0001004315ifrs-full:OperatingSegmentsMembernggtf:UKElectricityTransmissionMember2023-04-012023-09-300001004315ifrs-full:EliminationOfIntersegmentAmountsMembernggtf:UKElectricityTransmissionMember2023-04-012023-09-300001004315nggtf:UKElectricityTransmissionMember2023-04-012023-09-300001004315ifrs-full:OperatingSegmentsMembernggtf:UKElectricityTransmissionMember2022-04-012022-09-300001004315ifrs-full:EliminationOfIntersegmentAmountsMembernggtf:UKElectricityTransmissionMember2022-04-012022-09-300001004315nggtf:UKElectricityTransmissionMember2022-04-012022-09-300001004315ifrs-full:OperatingSegmentsMembernggtf:UKElectricityDistributionMember2023-04-012023-09-300001004315ifrs-full:EliminationOfIntersegmentAmountsMembernggtf:UKElectricityDistributionMember2023-04-012023-09-300001004315nggtf:UKElectricityDistributionMember2023-04-012023-09-300001004315ifrs-full:OperatingSegmentsMembernggtf:UKElectricityDistributionMember2022-04-012022-09-300001004315ifrs-full:EliminationOfIntersegmentAmountsMembernggtf:UKElectricityDistributionMember2022-04-012022-09-300001004315nggtf:UKElectricityDistributionMember2022-04-012022-09-300001004315ifrs-full:OperatingSegmentsMembernggtf:UKElectricitySystemOperatorMember2023-04-012023-09-300001004315ifrs-full:EliminationOfIntersegmentAmountsMembernggtf:UKElectricitySystemOperatorMember2023-04-012023-09-300001004315nggtf:UKElectricitySystemOperatorMember2023-04-012023-09-300001004315ifrs-full:OperatingSegmentsMembernggtf:UKElectricitySystemOperatorMember2022-04-012022-09-300001004315ifrs-full:EliminationOfIntersegmentAmountsMembernggtf:UKElectricitySystemOperatorMember2022-04-012022-09-300001004315nggtf:UKElectricitySystemOperatorMember2022-04-012022-09-300001004315ifrs-full:OperatingSegmentsMembernggtf:NewEnglandMember2023-04-012023-09-300001004315ifrs-full:EliminationOfIntersegmentAmountsMembernggtf:NewEnglandMember2023-04-012023-09-300001004315nggtf:NewEnglandMember2023-04-012023-09-300001004315ifrs-full:OperatingSegmentsMembernggtf:NewEnglandMember2022-04-012022-09-300001004315ifrs-full:EliminationOfIntersegmentAmountsMembernggtf:NewEnglandMember2022-04-012022-09-300001004315nggtf:NewEnglandMember2022-04-012022-09-300001004315ifrs-full:OperatingSegmentsMembernggtf:NewYorkSegmentMember2023-04-012023-09-300001004315ifrs-full:EliminationOfIntersegmentAmountsMembernggtf:NewYorkSegmentMember2023-04-012023-09-300001004315nggtf:NewYorkSegmentMember2023-04-012023-09-300001004315ifrs-full:OperatingSegmentsMembernggtf:NewYorkSegmentMember2022-04-012022-09-300001004315ifrs-full:EliminationOfIntersegmentAmountsMembernggtf:NewYorkSegmentMember2022-04-012022-09-300001004315nggtf:NewYorkSegmentMember2022-04-012022-09-300001004315nggtf:NationalGridVenturesMemberifrs-full:OperatingSegmentsMember2023-04-012023-09-300001004315ifrs-full:EliminationOfIntersegmentAmountsMembernggtf:NationalGridVenturesMember2023-04-012023-09-300001004315nggtf:NationalGridVenturesMember2023-04-012023-09-300001004315nggtf:NationalGridVenturesMemberifrs-full:OperatingSegmentsMember2022-04-012022-09-300001004315ifrs-full:EliminationOfIntersegmentAmountsMembernggtf:NationalGridVenturesMember2022-04-012022-09-300001004315nggtf:NationalGridVenturesMember2022-04-012022-09-300001004315ifrs-full:OperatingSegmentsMembernggtf:OtherSegmentsMember2023-04-012023-09-300001004315ifrs-full:EliminationOfIntersegmentAmountsMembernggtf:OtherSegmentsMember2023-04-012023-09-300001004315nggtf:OtherSegmentsMember2023-04-012023-09-300001004315ifrs-full:OperatingSegmentsMembernggtf:OtherSegmentsMember2022-04-012022-09-300001004315ifrs-full:EliminationOfIntersegmentAmountsMembernggtf:OtherSegmentsMember2022-04-012022-09-300001004315nggtf:OtherSegmentsMember2022-04-012022-09-300001004315ifrs-full:OperatingSegmentsMember2023-04-012023-09-300001004315ifrs-full:EliminationOfIntersegmentAmountsMember2023-04-012023-09-300001004315ifrs-full:OperatingSegmentsMember2022-04-012022-09-300001004315ifrs-full:EliminationOfIntersegmentAmountsMember2022-04-012022-09-300001004315ifrs-full:CountryOfDomicileMember2023-04-012023-09-300001004315ifrs-full:CountryOfDomicileMember2022-04-012022-09-300001004315country:US2023-04-012023-09-300001004315country:US2022-04-012022-09-300001004315ifrs-full:OperatingSegmentsMembernggtf:BeforeExceptionalItemsAndRemeasurementsNettingMembernggtf:UKElectricityTransmissionMember2023-04-012023-09-300001004315ifrs-full:OperatingSegmentsMembernggtf:BeforeExceptionalItemsAndRemeasurementsNettingMembernggtf:UKElectricityTransmissionMember2022-04-012022-09-300001004315nggtf:ExceptionalItemsAndRemeasurementsNettingMemberifrs-full:OperatingSegmentsMembernggtf:UKElectricityTransmissionMember2023-04-012023-09-300001004315nggtf:ExceptionalItemsAndRemeasurementsNettingMemberifrs-full:OperatingSegmentsMembernggtf:UKElectricityTransmissionMember2022-04-012022-09-300001004315ifrs-full:OperatingSegmentsMembernggtf:BeforeExceptionalItemsAndRemeasurementsNettingMembernggtf:UKElectricityDistributionMember2023-04-012023-09-300001004315ifrs-full:OperatingSegmentsMembernggtf:BeforeExceptionalItemsAndRemeasurementsNettingMembernggtf:UKElectricityDistributionMember2022-04-012022-09-300001004315nggtf:ExceptionalItemsAndRemeasurementsNettingMemberifrs-full:OperatingSegmentsMembernggtf:UKElectricityDistributionMember2023-04-012023-09-300001004315nggtf:ExceptionalItemsAndRemeasurementsNettingMemberifrs-full:OperatingSegmentsMembernggtf:UKElectricityDistributionMember2022-04-012022-09-300001004315ifrs-full:OperatingSegmentsMembernggtf:BeforeExceptionalItemsAndRemeasurementsNettingMembernggtf:UKElectricitySystemOperatorMember2023-04-012023-09-300001004315ifrs-full:OperatingSegmentsMembernggtf:BeforeExceptionalItemsAndRemeasurementsNettingMembernggtf:UKElectricitySystemOperatorMember2022-04-012022-09-300001004315nggtf:ExceptionalItemsAndRemeasurementsNettingMemberifrs-full:OperatingSegmentsMembernggtf:UKElectricitySystemOperatorMember2023-04-012023-09-300001004315nggtf:ExceptionalItemsAndRemeasurementsNettingMemberifrs-full:OperatingSegmentsMembernggtf:UKElectricitySystemOperatorMember2022-04-012022-09-300001004315ifrs-full:OperatingSegmentsMembernggtf:BeforeExceptionalItemsAndRemeasurementsNettingMembernggtf:NewEnglandMember2023-04-012023-09-300001004315ifrs-full:OperatingSegmentsMembernggtf:BeforeExceptionalItemsAndRemeasurementsNettingMembernggtf:NewEnglandMember2022-04-012022-09-300001004315nggtf:ExceptionalItemsAndRemeasurementsNettingMemberifrs-full:OperatingSegmentsMembernggtf:NewEnglandMember2023-04-012023-09-300001004315nggtf:ExceptionalItemsAndRemeasurementsNettingMemberifrs-full:OperatingSegmentsMembernggtf:NewEnglandMember2022-04-012022-09-300001004315ifrs-full:OperatingSegmentsMembernggtf:BeforeExceptionalItemsAndRemeasurementsNettingMembernggtf:NewYorkSegmentMember2023-04-012023-09-300001004315ifrs-full:OperatingSegmentsMembernggtf:BeforeExceptionalItemsAndRemeasurementsNettingMembernggtf:NewYorkSegmentMember2022-04-012022-09-300001004315nggtf:ExceptionalItemsAndRemeasurementsNettingMemberifrs-full:OperatingSegmentsMembernggtf:NewYorkSegmentMember2023-04-012023-09-300001004315nggtf:ExceptionalItemsAndRemeasurementsNettingMemberifrs-full:OperatingSegmentsMembernggtf:NewYorkSegmentMember2022-04-012022-09-300001004315nggtf:NationalGridVenturesMemberifrs-full:OperatingSegmentsMembernggtf:BeforeExceptionalItemsAndRemeasurementsNettingMember2023-04-012023-09-300001004315nggtf:NationalGridVenturesMemberifrs-full:OperatingSegmentsMembernggtf:BeforeExceptionalItemsAndRemeasurementsNettingMember2022-04-012022-09-300001004315nggtf:ExceptionalItemsAndRemeasurementsNettingMembernggtf:NationalGridVenturesMemberifrs-full:OperatingSegmentsMember2023-04-012023-09-300001004315nggtf:ExceptionalItemsAndRemeasurementsNettingMembernggtf:NationalGridVenturesMemberifrs-full:OperatingSegmentsMember2022-04-012022-09-300001004315ifrs-full:OperatingSegmentsMembernggtf:BeforeExceptionalItemsAndRemeasurementsNettingMembernggtf:OtherSegmentsMember2023-04-012023-09-300001004315ifrs-full:OperatingSegmentsMembernggtf:BeforeExceptionalItemsAndRemeasurementsNettingMembernggtf:OtherSegmentsMember2022-04-012022-09-300001004315nggtf:ExceptionalItemsAndRemeasurementsNettingMemberifrs-full:OperatingSegmentsMembernggtf:OtherSegmentsMember2023-04-012023-09-300001004315nggtf:ExceptionalItemsAndRemeasurementsNettingMemberifrs-full:OperatingSegmentsMembernggtf:OtherSegmentsMember2022-04-012022-09-300001004315nggtf:BeforeExceptionalItemsAndRemeasurementsNettingMember2023-04-012023-09-300001004315nggtf:BeforeExceptionalItemsAndRemeasurementsNettingMember2022-04-012022-09-300001004315nggtf:ExceptionalItemsAndRemeasurementsNettingMember2023-04-012023-09-300001004315nggtf:ExceptionalItemsAndRemeasurementsNettingMember2022-04-012022-09-300001004315nggtf:BeforeExceptionalItemsAndRemeasurementsNettingMemberifrs-full:CountryOfDomicileMember2023-04-012023-09-300001004315nggtf:BeforeExceptionalItemsAndRemeasurementsNettingMemberifrs-full:CountryOfDomicileMember2022-04-012022-09-300001004315nggtf:ExceptionalItemsAndRemeasurementsNettingMemberifrs-full:CountryOfDomicileMember2023-04-012023-09-300001004315nggtf:ExceptionalItemsAndRemeasurementsNettingMemberifrs-full:CountryOfDomicileMember2022-04-012022-09-300001004315nggtf:BeforeExceptionalItemsAndRemeasurementsNettingMembercountry:US2023-04-012023-09-300001004315nggtf:BeforeExceptionalItemsAndRemeasurementsNettingMembercountry:US2022-04-012022-09-300001004315nggtf:ExceptionalItemsAndRemeasurementsNettingMembercountry:US2023-04-012023-09-300001004315nggtf:ExceptionalItemsAndRemeasurementsNettingMembercountry:US2022-04-012022-09-300001004315ifrs-full:OperatingSegmentsMembernggtf:UKElectricityTransmissionMember2023-09-300001004315ifrs-full:OperatingSegmentsMembernggtf:UKElectricityTransmissionMember2023-03-310001004315ifrs-full:OperatingSegmentsMembernggtf:UKElectricityDistributionMember2023-09-300001004315ifrs-full:OperatingSegmentsMembernggtf:UKElectricityDistributionMember2023-03-310001004315ifrs-full:OperatingSegmentsMembernggtf:UKElectricitySystemOperatorMember2023-09-300001004315ifrs-full:OperatingSegmentsMembernggtf:UKElectricitySystemOperatorMember2023-03-310001004315ifrs-full:OperatingSegmentsMembernggtf:NewEnglandMember2023-09-300001004315ifrs-full:OperatingSegmentsMembernggtf:NewEnglandMember2023-03-310001004315ifrs-full:OperatingSegmentsMembernggtf:NewYorkSegmentMember2023-09-300001004315ifrs-full:OperatingSegmentsMembernggtf:NewYorkSegmentMember2023-03-310001004315nggtf:NationalGridVenturesMemberifrs-full:OperatingSegmentsMember2023-09-300001004315nggtf:NationalGridVenturesMemberifrs-full:OperatingSegmentsMember2023-03-310001004315ifrs-full:OperatingSegmentsMembernggtf:OtherSegmentsMember2023-09-300001004315ifrs-full:OperatingSegmentsMembernggtf:OtherSegmentsMember2023-03-310001004315ifrs-full:CountryOfDomicileMember2023-09-300001004315ifrs-full:CountryOfDomicileMember2023-03-310001004315country:US2023-09-300001004315country:US2023-03-310001004315ifrs-full:PropertyPlantAndEquipmentMember2023-09-300001004315ifrs-full:PropertyPlantAndEquipmentMember2023-03-310001004315ifrs-full:PropertyPlantAndEquipmentMember2023-04-012023-09-300001004315ifrs-full:PropertyPlantAndEquipmentMember2022-04-012022-09-300001004315ifrs-full:IntangibleAssetsOtherThanGoodwillMember2023-09-300001004315ifrs-full:IntangibleAssetsOtherThanGoodwillMember2023-03-310001004315ifrs-full:IntangibleAssetsOtherThanGoodwillMember2023-04-012023-09-300001004315ifrs-full:IntangibleAssetsOtherThanGoodwillMember2022-04-012022-09-300001004315nggtf:UKElectricityTransmissionMembernggtf:TransmissionMember2023-04-012023-09-300001004315nggtf:UKElectricityDistributionMembernggtf:TransmissionMember2023-04-012023-09-300001004315nggtf:UKElectricitySystemOperatorMembernggtf:TransmissionMember2023-04-012023-09-300001004315nggtf:NewEnglandMembernggtf:TransmissionMember2023-04-012023-09-300001004315nggtf:TransmissionMembernggtf:NewYorkSegmentMember2023-04-012023-09-300001004315nggtf:NationalGridVenturesMembernggtf:TransmissionMember2023-04-012023-09-300001004315nggtf:OtherSegmentsMembernggtf:TransmissionMember2023-04-012023-09-300001004315nggtf:TransmissionMember2023-04-012023-09-300001004315nggtf:UKElectricityTransmissionMembernggtf:DistributionMember2023-04-012023-09-300001004315nggtf:UKElectricityDistributionMembernggtf:DistributionMember2023-04-012023-09-300001004315nggtf:UKElectricitySystemOperatorMembernggtf:DistributionMember2023-04-012023-09-300001004315nggtf:NewEnglandMembernggtf:DistributionMember2023-04-012023-09-300001004315nggtf:DistributionMembernggtf:NewYorkSegmentMember2023-04-012023-09-300001004315nggtf:NationalGridVenturesMembernggtf:DistributionMember2023-04-012023-09-300001004315nggtf:OtherSegmentsMembernggtf:DistributionMember2023-04-012023-09-300001004315nggtf:DistributionMember2023-04-012023-09-300001004315nggtf:UKElectricityTransmissionMembernggtf:SystemOperatorMember2023-04-012023-09-300001004315nggtf:UKElectricityDistributionMembernggtf:SystemOperatorMember2023-04-012023-09-300001004315nggtf:UKElectricitySystemOperatorMembernggtf:SystemOperatorMember2023-04-012023-09-300001004315nggtf:NewEnglandMembernggtf:SystemOperatorMember2023-04-012023-09-300001004315nggtf:SystemOperatorMembernggtf:NewYorkSegmentMember2023-04-012023-09-300001004315nggtf:NationalGridVenturesMembernggtf:SystemOperatorMember2023-04-012023-09-300001004315nggtf:OtherSegmentsMembernggtf:SystemOperatorMember2023-04-012023-09-300001004315nggtf:SystemOperatorMember2023-04-012023-09-300001004315nggtf:OtherProductAndServicesMembernggtf:UKElectricityTransmissionMember2023-04-012023-09-300001004315nggtf:OtherProductAndServicesMembernggtf:UKElectricityDistributionMember2023-04-012023-09-300001004315nggtf:OtherProductAndServicesMembernggtf:UKElectricitySystemOperatorMember2023-04-012023-09-300001004315nggtf:OtherProductAndServicesMembernggtf:NewEnglandMember2023-04-012023-09-300001004315nggtf:OtherProductAndServicesMembernggtf:NewYorkSegmentMember2023-04-012023-09-300001004315nggtf:NationalGridVenturesMembernggtf:OtherProductAndServicesMember2023-04-012023-09-300001004315nggtf:OtherSegmentsMembernggtf:OtherProductAndServicesMember2023-04-012023-09-300001004315nggtf:OtherProductAndServicesMember2023-04-012023-09-300001004315nggtf:GenerationMembernggtf:UKElectricityTransmissionMember2023-04-012023-09-300001004315nggtf:GenerationMembernggtf:UKElectricityDistributionMember2023-04-012023-09-300001004315nggtf:GenerationMembernggtf:UKElectricitySystemOperatorMember2023-04-012023-09-300001004315nggtf:GenerationMembernggtf:NewEnglandMember2023-04-012023-09-300001004315nggtf:GenerationMembernggtf:NewYorkSegmentMember2023-04-012023-09-300001004315nggtf:NationalGridVenturesMembernggtf:GenerationMember2023-04-012023-09-300001004315nggtf:OtherSegmentsMembernggtf:GenerationMember2023-04-012023-09-300001004315nggtf:GenerationMember2023-04-012023-09-300001004315nggtf:UKElectricityTransmissionMemberifrs-full:CountryOfDomicileMember2023-04-012023-09-300001004315nggtf:UKElectricityDistributionMemberifrs-full:CountryOfDomicileMember2023-04-012023-09-300001004315nggtf:UKElectricitySystemOperatorMemberifrs-full:CountryOfDomicileMember2023-04-012023-09-300001004315nggtf:NewEnglandMemberifrs-full:CountryOfDomicileMember2023-04-012023-09-300001004315nggtf:NewYorkSegmentMemberifrs-full:CountryOfDomicileMember2023-04-012023-09-300001004315nggtf:NationalGridVenturesMemberifrs-full:CountryOfDomicileMember2023-04-012023-09-300001004315nggtf:OtherSegmentsMemberifrs-full:CountryOfDomicileMember2023-04-012023-09-300001004315nggtf:UKElectricityTransmissionMembercountry:US2023-04-012023-09-300001004315nggtf:UKElectricityDistributionMembercountry:US2023-04-012023-09-300001004315nggtf:UKElectricitySystemOperatorMembercountry:US2023-04-012023-09-300001004315nggtf:NewEnglandMembercountry:US2023-04-012023-09-300001004315nggtf:NewYorkSegmentMembercountry:US2023-04-012023-09-300001004315nggtf:NationalGridVenturesMembercountry:US2023-04-012023-09-300001004315nggtf:OtherSegmentsMembercountry:US2023-04-012023-09-300001004315nggtf:UKElectricityTransmissionMembernggtf:TransmissionMember2022-04-012022-09-300001004315nggtf:UKElectricityDistributionMembernggtf:TransmissionMember2022-04-012022-09-300001004315nggtf:UKElectricitySystemOperatorMembernggtf:TransmissionMember2022-04-012022-09-300001004315nggtf:NewEnglandMembernggtf:TransmissionMember2022-04-012022-09-300001004315nggtf:TransmissionMembernggtf:NewYorkSegmentMember2022-04-012022-09-300001004315nggtf:NationalGridVenturesMembernggtf:TransmissionMember2022-04-012022-09-300001004315nggtf:OtherSegmentsMembernggtf:TransmissionMember2022-04-012022-09-300001004315nggtf:TransmissionMember2022-04-012022-09-300001004315nggtf:UKElectricityTransmissionMembernggtf:DistributionMember2022-04-012022-09-300001004315nggtf:UKElectricityDistributionMembernggtf:DistributionMember2022-04-012022-09-300001004315nggtf:UKElectricitySystemOperatorMembernggtf:DistributionMember2022-04-012022-09-300001004315nggtf:NewEnglandMembernggtf:DistributionMember2022-04-012022-09-300001004315nggtf:DistributionMembernggtf:NewYorkSegmentMember2022-04-012022-09-300001004315nggtf:NationalGridVenturesMembernggtf:DistributionMember2022-04-012022-09-300001004315nggtf:OtherSegmentsMembernggtf:DistributionMember2022-04-012022-09-300001004315nggtf:DistributionMember2022-04-012022-09-300001004315nggtf:UKElectricityTransmissionMembernggtf:SystemOperatorMember2022-04-012022-09-300001004315nggtf:UKElectricityDistributionMembernggtf:SystemOperatorMember2022-04-012022-09-300001004315nggtf:UKElectricitySystemOperatorMembernggtf:SystemOperatorMember2022-04-012022-09-300001004315nggtf:NewEnglandMembernggtf:SystemOperatorMember2022-04-012022-09-300001004315nggtf:SystemOperatorMembernggtf:NewYorkSegmentMember2022-04-012022-09-300001004315nggtf:NationalGridVenturesMembernggtf:SystemOperatorMember2022-04-012022-09-300001004315nggtf:OtherSegmentsMembernggtf:SystemOperatorMember2022-04-012022-09-300001004315nggtf:SystemOperatorMember2022-04-012022-09-300001004315nggtf:OtherProductAndServicesMembernggtf:UKElectricityTransmissionMember2022-04-012022-09-300001004315nggtf:OtherProductAndServicesMembernggtf:UKElectricityDistributionMember2022-04-012022-09-300001004315nggtf:OtherProductAndServicesMembernggtf:UKElectricitySystemOperatorMember2022-04-012022-09-300001004315nggtf:OtherProductAndServicesMembernggtf:NewEnglandMember2022-04-012022-09-300001004315nggtf:OtherProductAndServicesMembernggtf:NewYorkSegmentMember2022-04-012022-09-300001004315nggtf:NationalGridVenturesMembernggtf:OtherProductAndServicesMember2022-04-012022-09-300001004315nggtf:OtherSegmentsMembernggtf:OtherProductAndServicesMember2022-04-012022-09-300001004315nggtf:OtherProductAndServicesMember2022-04-012022-09-300001004315nggtf:GenerationMembernggtf:UKElectricityTransmissionMember2022-04-012022-09-300001004315nggtf:GenerationMembernggtf:UKElectricityDistributionMember2022-04-012022-09-300001004315nggtf:GenerationMembernggtf:UKElectricitySystemOperatorMember2022-04-012022-09-300001004315nggtf:GenerationMembernggtf:NewEnglandMember2022-04-012022-09-300001004315nggtf:GenerationMembernggtf:NewYorkSegmentMember2022-04-012022-09-300001004315nggtf:NationalGridVenturesMembernggtf:GenerationMember2022-04-012022-09-300001004315nggtf:OtherSegmentsMembernggtf:GenerationMember2022-04-012022-09-300001004315nggtf:GenerationMember2022-04-012022-09-300001004315nggtf:UKElectricityTransmissionMemberifrs-full:CountryOfDomicileMember2022-04-012022-09-300001004315nggtf:UKElectricityDistributionMemberifrs-full:CountryOfDomicileMember2022-04-012022-09-300001004315nggtf:UKElectricitySystemOperatorMemberifrs-full:CountryOfDomicileMember2022-04-012022-09-300001004315nggtf:NewEnglandMemberifrs-full:CountryOfDomicileMember2022-04-012022-09-300001004315nggtf:NewYorkSegmentMemberifrs-full:CountryOfDomicileMember2022-04-012022-09-300001004315nggtf:NationalGridVenturesMemberifrs-full:CountryOfDomicileMember2022-04-012022-09-300001004315nggtf:OtherSegmentsMemberifrs-full:CountryOfDomicileMember2022-04-012022-09-300001004315nggtf:UKElectricityTransmissionMembercountry:US2022-04-012022-09-300001004315nggtf:UKElectricityDistributionMembercountry:US2022-04-012022-09-300001004315nggtf:UKElectricitySystemOperatorMembercountry:US2022-04-012022-09-300001004315nggtf:NewEnglandMembercountry:US2022-04-012022-09-300001004315nggtf:NewYorkSegmentMembercountry:US2022-04-012022-09-300001004315nggtf:NationalGridVenturesMembercountry:US2022-04-012022-09-300001004315nggtf:OtherSegmentsMembercountry:US2022-04-012022-09-300001004315nggtf:ExceptionalItemsMember2023-04-012023-09-300001004315nggtf:RemeasurementsMember2023-04-012023-09-300001004315nggtf:ExceptionalItemsMember2022-04-012022-09-300001004315nggtf:RemeasurementsMember2022-04-012022-09-300001004315nggtf:ExceptionalItemsMembernggtf:CostEfficiencyProgrammeMember2023-04-012023-09-300001004315nggtf:ExceptionalItemsMembernggtf:CostEfficiencyProgrammeMember2022-04-012022-09-300001004315nggtf:CostEfficiencyProgrammeMember2021-11-012021-11-300001004315nggtf:ExceptionalItemsMembernggtf:CostEfficiencyProgrammeMember2021-11-012023-09-300001004315nggtf:TheNarragansettElectricCompanyMembernggtf:ExceptionalItemsMember2022-05-252022-05-25iso4217:USD0001004315nggtf:GasTTopCoLimitedMemberifrs-full:AssetsAndLiabilitiesClassifiedAsHeldForSaleMember2023-09-300001004315nggtf:GasTTopCoLimitedMemberifrs-full:AssetsAndLiabilitiesClassifiedAsHeldForSaleMember2023-03-310001004315nggtf:FAAOptionsMemberifrs-full:AssetsAndLiabilitiesClassifiedAsHeldForSaleMember2023-09-300001004315nggtf:FAAOptionsMemberifrs-full:AssetsAndLiabilitiesClassifiedAsHeldForSaleMember2023-03-310001004315nggtf:FAAForwardMemberifrs-full:AssetsAndLiabilitiesClassifiedAsHeldForSaleMember2023-09-300001004315nggtf:FAAForwardMemberifrs-full:AssetsAndLiabilitiesClassifiedAsHeldForSaleMember2023-03-310001004315nggtf:RAAOptionsMemberifrs-full:AssetsAndLiabilitiesClassifiedAsHeldForSaleMember2023-09-300001004315nggtf:RAAOptionsMemberifrs-full:AssetsAndLiabilitiesClassifiedAsHeldForSaleMember2023-03-310001004315ifrs-full:AssetsAndLiabilitiesClassifiedAsHeldForSaleMember2023-09-300001004315ifrs-full:AssetsAndLiabilitiesClassifiedAsHeldForSaleMember2023-03-310001004315nggtf:UKGasTransmissionMember2023-01-312023-01-310001004315nggtf:UKGasTransmissionMember2023-01-310001004315nggtf:MacquarieInfrastructureAndRealAssetsMIRAAndBritishColumbiaInvestmentManagementCorporationBCIMembernggtf:GasTTopCoLimitedMember2023-01-312023-01-310001004315nggtf:GasTTopCoLimitedMember2023-01-312023-01-310001004315nggtf:GasTTopCoLimitedMember2023-07-192023-07-190001004315ifrs-full:DiscontinuedOperationsMember2023-04-012023-09-300001004315ifrs-full:DiscontinuedOperationsMember2022-04-012022-09-300001004315nggtf:AfterExceptionalItemsAndRemeasurementsNettingMemberifrs-full:DiscontinuedOperationsMember2023-04-012023-09-300001004315nggtf:AfterExceptionalItemsAndRemeasurementsNettingMemberifrs-full:DiscontinuedOperationsMember2022-04-012022-09-3000010043152022-04-012023-03-31xbrli:shares0001004315nggtf:FinalDividendMember2022-04-012023-03-310001004315nggtf:InterimDividendMember2022-04-012023-03-310001004315nggtf:FinalDividendMember2021-04-012022-03-310001004315ifrs-full:Level1OfFairValueHierarchyMembernggtf:InvestmentsHeldAtFVTPLMember2023-09-300001004315ifrs-full:Level2OfFairValueHierarchyMembernggtf:InvestmentsHeldAtFVTPLMember2023-09-300001004315ifrs-full:Level3OfFairValueHierarchyMembernggtf:InvestmentsHeldAtFVTPLMember2023-09-300001004315nggtf:InvestmentsHeldAtFVTPLMember2023-09-300001004315ifrs-full:Level1OfFairValueHierarchyMembernggtf:InvestmentsHeldAtFVTPLMember2023-03-310001004315ifrs-full:Level2OfFairValueHierarchyMembernggtf:InvestmentsHeldAtFVTPLMember2023-03-310001004315ifrs-full:Level3OfFairValueHierarchyMembernggtf:InvestmentsHeldAtFVTPLMember2023-03-310001004315nggtf:InvestmentsHeldAtFVTPLMember2023-03-310001004315nggtf:InvestmentsHeldAtFVTOCIMemberifrs-full:Level1OfFairValueHierarchyMember2023-09-300001004315nggtf:InvestmentsHeldAtFVTOCIMemberifrs-full:Level2OfFairValueHierarchyMember2023-09-300001004315nggtf:InvestmentsHeldAtFVTOCIMemberifrs-full:Level3OfFairValueHierarchyMember2023-09-300001004315nggtf:InvestmentsHeldAtFVTOCIMember2023-09-300001004315nggtf:InvestmentsHeldAtFVTOCIMemberifrs-full:Level1OfFairValueHierarchyMember2023-03-310001004315nggtf:InvestmentsHeldAtFVTOCIMemberifrs-full:Level2OfFairValueHierarchyMember2023-03-310001004315nggtf:InvestmentsHeldAtFVTOCIMemberifrs-full:Level3OfFairValueHierarchyMember2023-03-310001004315nggtf:InvestmentsHeldAtFVTOCIMember2023-03-310001004315ifrs-full:Level1OfFairValueHierarchyMembernggtf:FinancingDerivativesMember2023-09-300001004315nggtf:FinancingDerivativesMemberifrs-full:Level2OfFairValueHierarchyMember2023-09-300001004315nggtf:FinancingDerivativesMemberifrs-full:Level3OfFairValueHierarchyMember2023-09-300001004315nggtf:FinancingDerivativesMember2023-09-300001004315ifrs-full:Level1OfFairValueHierarchyMembernggtf:FinancingDerivativesMember2023-03-310001004315nggtf:FinancingDerivativesMemberifrs-full:Level2OfFairValueHierarchyMember2023-03-310001004315nggtf:FinancingDerivativesMemberifrs-full:Level3OfFairValueHierarchyMember2023-03-310001004315nggtf:FinancingDerivativesMember2023-03-310001004315ifrs-full:Level1OfFairValueHierarchyMembernggtf:CommodityDerivativesMember2023-09-300001004315nggtf:CommodityDerivativesMemberifrs-full:Level2OfFairValueHierarchyMember2023-09-300001004315nggtf:CommodityDerivativesMemberifrs-full:Level3OfFairValueHierarchyMember2023-09-300001004315nggtf:CommodityDerivativesMember2023-09-300001004315ifrs-full:Level1OfFairValueHierarchyMembernggtf:CommodityDerivativesMember2023-03-310001004315nggtf:CommodityDerivativesMemberifrs-full:Level2OfFairValueHierarchyMember2023-03-310001004315nggtf:CommodityDerivativesMemberifrs-full:Level3OfFairValueHierarchyMember2023-03-310001004315nggtf:CommodityDerivativesMember2023-03-310001004315ifrs-full:Level1OfFairValueHierarchyMember2023-09-300001004315ifrs-full:Level2OfFairValueHierarchyMember2023-09-300001004315ifrs-full:Level3OfFairValueHierarchyMember2023-09-300001004315ifrs-full:Level1OfFairValueHierarchyMember2023-03-310001004315ifrs-full:Level2OfFairValueHierarchyMember2023-03-310001004315ifrs-full:Level3OfFairValueHierarchyMember2023-03-310001004315ifrs-full:Level1OfFairValueHierarchyMembernggtf:FinancingDerivativesMember2023-09-300001004315nggtf:FinancingDerivativesMemberifrs-full:Level2OfFairValueHierarchyMember2023-09-300001004315nggtf:FinancingDerivativesMemberifrs-full:Level3OfFairValueHierarchyMember2023-09-300001004315nggtf:FinancingDerivativesMember2023-09-300001004315ifrs-full:Level1OfFairValueHierarchyMembernggtf:FinancingDerivativesMember2023-03-310001004315nggtf:FinancingDerivativesMemberifrs-full:Level2OfFairValueHierarchyMember2023-03-310001004315nggtf:FinancingDerivativesMemberifrs-full:Level3OfFairValueHierarchyMember2023-03-310001004315nggtf:FinancingDerivativesMember2023-03-310001004315nggtf:CommodityDerivativesMemberifrs-full:Level1OfFairValueHierarchyMember2023-09-300001004315nggtf:CommodityDerivativesMemberifrs-full:Level2OfFairValueHierarchyMember2023-09-300001004315nggtf:CommodityDerivativesMemberifrs-full:Level3OfFairValueHierarchyMember2023-09-300001004315nggtf:CommodityDerivativesMember2023-09-300001004315nggtf:CommodityDerivativesMemberifrs-full:Level1OfFairValueHierarchyMember2023-03-310001004315nggtf:CommodityDerivativesMemberifrs-full:Level2OfFairValueHierarchyMember2023-03-310001004315nggtf:CommodityDerivativesMemberifrs-full:Level3OfFairValueHierarchyMember2023-03-310001004315nggtf:CommodityDerivativesMember2023-03-310001004315ifrs-full:ContingentConsiderationMemberifrs-full:Level1OfFairValueHierarchyMember2023-09-300001004315ifrs-full:ContingentConsiderationMemberifrs-full:Level2OfFairValueHierarchyMember2023-09-300001004315ifrs-full:ContingentConsiderationMemberifrs-full:Level3OfFairValueHierarchyMember2023-09-300001004315ifrs-full:ContingentConsiderationMember2023-09-300001004315ifrs-full:ContingentConsiderationMemberifrs-full:Level1OfFairValueHierarchyMember2023-03-310001004315ifrs-full:ContingentConsiderationMemberifrs-full:Level2OfFairValueHierarchyMember2023-03-310001004315ifrs-full:ContingentConsiderationMemberifrs-full:Level3OfFairValueHierarchyMember2023-03-310001004315ifrs-full:ContingentConsiderationMember2023-03-310001004315ifrs-full:AtFairValueMember2023-09-300001004315ifrs-full:AtFairValueMember2023-03-31nggtf:investment0001004315nggtf:CommodityPriceRiskTenPercentIncreaseMembernggtf:CommodityDerivativesMember2023-09-300001004315nggtf:CommodityPriceRiskTenPercentIncreaseMembernggtf:CommodityDerivativesMember2022-09-300001004315nggtf:CommodityPriceRiskTenPercentDecreaseMembernggtf:CommodityDerivativesMember2023-09-300001004315nggtf:CommodityPriceRiskTenPercentDecreaseMembernggtf:CommodityDerivativesMember2022-09-300001004315nggtf:MarketRiskMarketAreaPriceTenPercentIncreaseMembernggtf:CommodityDerivativesMember2023-09-300001004315nggtf:MarketRiskMarketAreaPriceTenPercentIncreaseMembernggtf:CommodityDerivativesMember2022-09-300001004315nggtf:MarketRiskMarketAreaPriceTenPercentDecreaseMembernggtf:CommodityDerivativesMember2023-09-300001004315nggtf:MarketRiskMarketAreaPriceTenPercentDecreaseMembernggtf:CommodityDerivativesMember2022-09-300001004315nggtf:MarketRiskLimitedPriceInflationMarketCurveTwentyBasisPointsIncreaseMembernggtf:FinancingDerivativesMember2023-09-300001004315nggtf:MarketRiskLimitedPriceInflationMarketCurveTwentyBasisPointsIncreaseMembernggtf:FinancingDerivativesMember2022-09-300001004315nggtf:FinancingDerivativesMembernggtf:MarketRiskLimitedPriceInflationMarketCurveTwentyBasisPointsDecreaseMember2023-09-300001004315nggtf:FinancingDerivativesMembernggtf:MarketRiskLimitedPriceInflationMarketCurveTwentyBasisPointsDecreaseMember2022-09-300001004315nggtf:MarketRiskRetailPriceIndexAndConsumerPriceIndexTwentyBasisPointsIncreaseMembernggtf:FinancingDerivativesMember2023-09-300001004315nggtf:MarketRiskRetailPriceIndexAndConsumerPriceIndexTwentyBasisPointsIncreaseMembernggtf:FinancingDerivativesMember2022-09-300001004315nggtf:MarketRiskRetailPriceIndexAndConsumerPriceIndexTwentyBasisPointsDecreaseMembernggtf:FinancingDerivativesMember2023-09-300001004315nggtf:MarketRiskRetailPriceIndexAndConsumerPriceIndexTwentyBasisPointsDecreaseMembernggtf:FinancingDerivativesMember2022-09-300001004315nggtf:DiscountRateRisk50BasisPointsIncreaseMembernggtf:OtherFinancialInstrumentsMember2023-09-300001004315nggtf:DiscountRateRisk50BasisPointsIncreaseMembernggtf:OtherFinancialInstrumentsMember2022-09-300001004315nggtf:DiscountRateRisk50BasisPointsDecreaseMembernggtf:OtherFinancialInstrumentsMember2023-09-300001004315nggtf:DiscountRateRisk50BasisPointsDecreaseMembernggtf:OtherFinancialInstrumentsMember2022-09-300001004315nggtf:OtherFinancialInstrumentsMembernggtf:VentureCapitalPriceRiskTenPercentIncreaseMember2023-09-300001004315nggtf:VentureCapitalPriceRiskTenPercentDecreaseMembernggtf:OtherFinancialInstrumentsMember2023-09-300001004315nggtf:FinancingDerivativesMemberifrs-full:Level3OfFairValueHierarchyMember2023-03-310001004315nggtf:FinancingDerivativesMemberifrs-full:Level3OfFairValueHierarchyMember2022-03-310001004315ifrs-full:Level3OfFairValueHierarchyMembernggtf:CommodityDerivativesMember2023-03-310001004315ifrs-full:Level3OfFairValueHierarchyMembernggtf:CommodityDerivativesMember2022-03-310001004315nggtf:OtherFinancialInstrumentsMemberifrs-full:Level3OfFairValueHierarchyMember2023-03-310001004315nggtf:OtherFinancialInstrumentsMemberifrs-full:Level3OfFairValueHierarchyMember2022-03-310001004315ifrs-full:Level3OfFairValueHierarchyMember2022-03-310001004315nggtf:FinancingDerivativesMemberifrs-full:Level3OfFairValueHierarchyMember2023-04-012023-09-300001004315nggtf:FinancingDerivativesMemberifrs-full:Level3OfFairValueHierarchyMember2022-04-012022-09-300001004315ifrs-full:Level3OfFairValueHierarchyMembernggtf:CommodityDerivativesMember2023-04-012023-09-300001004315ifrs-full:Level3OfFairValueHierarchyMembernggtf:CommodityDerivativesMember2022-04-012022-09-300001004315nggtf:OtherFinancialInstrumentsMemberifrs-full:Level3OfFairValueHierarchyMember2023-04-012023-09-300001004315nggtf:OtherFinancialInstrumentsMemberifrs-full:Level3OfFairValueHierarchyMember2022-04-012022-09-300001004315ifrs-full:Level3OfFairValueHierarchyMember2023-04-012023-09-300001004315ifrs-full:Level3OfFairValueHierarchyMember2022-04-012022-09-300001004315nggtf:FinancingDerivativesMemberifrs-full:Level3OfFairValueHierarchyMember2023-09-300001004315nggtf:FinancingDerivativesMemberifrs-full:Level3OfFairValueHierarchyMember2022-09-300001004315ifrs-full:Level3OfFairValueHierarchyMembernggtf:CommodityDerivativesMember2023-09-300001004315ifrs-full:Level3OfFairValueHierarchyMembernggtf:CommodityDerivativesMember2022-09-300001004315nggtf:OtherFinancialInstrumentsMemberifrs-full:Level3OfFairValueHierarchyMember2023-09-300001004315nggtf:OtherFinancialInstrumentsMemberifrs-full:Level3OfFairValueHierarchyMember2022-09-300001004315ifrs-full:Level3OfFairValueHierarchyMember2022-09-300001004315nggtf:CapitalExpendituresMemberifrs-full:DerivativesMember2023-09-300001004315nggtf:CapitalExpendituresMemberifrs-full:DerivativesMember2023-03-310001004315nggtf:FinancingDerivativesMember2023-09-300001004315nggtf:FinancingDerivativesMember2023-03-310001004315nggtf:CommodityDerivativesMember2023-09-300001004315nggtf:CommodityDerivativesMember2023-03-310001004315ifrs-full:WhollyOrPartlyFundedDefinedBenefitPlansMember2023-09-300001004315ifrs-full:WhollyOrPartlyFundedDefinedBenefitPlansMember2023-03-310001004315ifrs-full:WhollyUnfundedDefinedBenefitPlansMember2023-09-300001004315ifrs-full:WhollyUnfundedDefinedBenefitPlansMember2023-03-310001004315nggtf:SubsidiaryGuarantorNationalGridGasPlcMember2007-10-292007-10-290001004315nggtf:IssuerOfNotesBritishTranscoFinanceInc.Member2007-10-292007-10-290001004315nggtf:ParentGuarantorAndNiagaraMohawkPowerCorporationMember2023-04-012023-09-300001004315nggtf:OtherSubsidiariesMember2023-09-300001004315nggtf:ParentGuarantorAndNiagaraMohawkPowerCorporationMember2023-09-300001004315nggtf:OtherSubsidiariesMember2023-04-012023-09-30
London | 9 November 2023: National Grid, a leading energy transmission and distribution company, today announces its Half-Year results for the period ended 30 September 2023. Record network investment: a new phase of capital delivery John Pettigrew, Chief Executive, said: “Today we’ve announced solid results, and reconfirmed our full-year guidance, as we continue to enhance critical energy infrastructure across the communities we serve. This financial performance reflects our role at the heart of the energy transition and a new phase of capital delivery that is firmly underway. Capital investment in our regulated networks reached a record £3.5 billion in this half year, as we step up our investment in 17 major onshore and offshore transmission projects in the UK. In the US, we’re now progressing a number of major transmission projects to unlock renewable generation and upgrade infrastructure across our jurisdictions. And we’re delivering this critical investment at the same time as ensuring affordability for our customers, having now exceeded our £400 million efficiency savings target earlier than planned. In recognition of this strong progress, we are today updating our 2020/21 to 2025/26 five-year financial framework, which will modestly enhance our asset and EPS growth within our existing ranges. And whilst we’re pleased to see momentum around policy reform on both sides of the Atlantic, we now look forward to seeing announcements and consultations translated into decisions and action in order to deliver the energy transition. We’re ready to meet the opportunities, and are set up to tackle the challenges ahead, to deliver a clean, fair and affordable energy future for all.” Financial Summary Six months ended 30 September: continuing operations1 Statutory results2 Underlying3 Unaudited 2023 2022 % change 2023 2022 % change Operating profit (£m) 1,985 2,239 (11%) 1,796 2,117 (15%) Profit before tax (£m) 1,371 1,666 (18%) 1,144 1,455 (21%) Earnings per share (p) 28.8 33.4 (14%) 23.8 32.4 (27%) Dividend per share (p) 19.40 17.84 9% Unaudited 2023 2022 % change Capital investment4 (£m) 3,868 3,883 0% 1. Excluding UK Gas Transmission which is held as a discontinued operation. Amounts above are presented at actual currency. 2. For statutory EPS and profit before tax in 2022, comparative amounts have been re-presented to reflect the classification of the Further Acquisition Agreement (the FAA option) as held for sale and within discontinued operations. 3. ‘Underlying’ represents statutory results from continuing operations, but excluding exceptional items, remeasurements and timing. Further detail and definitions for all alternative performance measures (including constant currency) are provided on page 63. 4. Capital investment, an Alternative Performance Measure (APM), represents statutory capital expenditure of £3,706 million (2022: £3,717 million) plus contributions to joint ventures and associates and NG Partners additions. Further detail and reconciliations are provided on page 63. Highlights Solid financial delivery across the half year ■ Solid underlying operating profit on a continuing basis of £1.8 billion. Whilst this performance is in line with expectations, non-recurring items reported in 2022/23 explain why underlying operating profit is down 15% at actual exchange rates (14% at constant currency) versus the prior period. These items in the prior half year included: St William property land sales (£201 million); a two month contribution from the Narragansett Electric Company (NECO) (£53 million); and insurance proceeds received at our IFA1 interconnector following a fire in September 2021 (£70 million). Underlying EPS for continuing operations of 23.8p, down from 32.4p in the prior period, in line with our expectation of underlying EPS to have a greater weighting to the second half. ■ Statutory operating profit down 11% to £2.0 billion, driven principally by gains on NECO and St William land sales in the prior period, partly offset by favourable timing. Statutory EPS of 28.8p, down from 33.4p in the prior period. ■ Interim dividend of 19.40p/ordinary share* in line with policy (17.84p/ordinary share in the prior period). * This represents 35% of the total dividend per share of 55.44p in respect of the last financial year to 31 March 2023, in line with the Group’s dividend policy. National Grid 2023/24 Half Year Results Statement 1 Exhibit 99.1

Highlights continued Record regulatory capital investment driving the energy transition ■ Capital investment of £3.9 billion for continuing operations, £70 million higher than the prior period at constant currency (£15 million lower at actual exchange rates). Of this total, capital investment in our regulated networks1 reached a record £3.5 billion, up 10% on the prior period at constant currency (7% at actual exchange rates). ■ Group capital investment was principally driven by higher connections spend and early investment relating to Accelerated Strategic Transmission Investment (ASTI) in our UK Electricity Transmission business; increased spend on our new transmission projects in New York, such as our Smart Path Connect project; higher asset condition and Grid Modernization spend in New England; partially offset by lower investment in National Grid Ventures (NGV) compared to the prior period due to lower spend on the IFA1 Sellindge converter station rebuild, Isle of Grain expansion and Viking interconnector as these projects near completion. Good, early progress on ASTI projects ■ Welcomed Ofgem’s decision to place 17 ASTI projects into our UK Electricity Transmission operating licence. ■ Signed JVs with SP Transmission plc (ScottishPower) for Eastern Green Link 1 in August, and with Scottish Hydro Electric Transmission plc (SSE) for Eastern Green Link 2 in June; selected suppliers for converter stations and cables at the Eastern Green Links 1 and 2 offshore projects, received planning consents on the English side of the links. ■ Launched the procurement process for the enterprise model to deliver the majority of our onshore projects. Continued capital re-allocation from National Gas Transmission ■ Agreed to sell a further 20% equity interest in National Gas Transmission to the consortium led by Macquarie Asset Management and British Columbia Investment Management Corporation, on equivalent financial terms to the 60% stake sold to the consortium in January 2023. ■ Agreed a new option with the same consortium, exercisable between 1 May 2024 and 31 July 2024, allowing it to acquire the remaining interest. Strong regulatory progress underpinning future growth ■ Welcomed the Energy Act 2023 receiving Royal Assent and passing into UK legislation. ■ Published our ‘Delivering for 2035’ policy paper, outlining five priority areas where action is required by the UK government and Ofgem to ensure networks can play their part in decarbonising the power sector by 2035. ■ Welcomed the Electricity Networks Commissioner’s (ENC) report and its recommendations for a strategic spatial energy plan reducing timelines on transmission infrastructure delivery. ■ Began the first year of new price controls under RIIO-ED2, running for five years until 31 March 2028. ■ Planning to move forward in settlement negotiations with the New York Public Service Commission (PSC) for new rates at KEDNY-KEDLI, hoping to reach a Joint Proposal in the first quarter of calendar year 2024. ■ Filed our Electric Sector Modernization Plan (ESMP) in Massachusetts, proposing $2 billion of investment over the next five years in our electric distribution network to help meet state clean energy goals (not part of any rate order we currently have in Massachusetts). ■ Community Offshore Wind JV successful in New York’s offshore wind solicitation with a provisional offtake award of 1.3 GW. ■ Received approval for our Propel NY Energy transmission project on Long Island, a partnership between New York Transco and the New York Power Authority, which will bring offshore wind into the state. ■ Our Twin States Clean Energy Link, a 1.2 GW transmission project, selected by US Department of Energy (DOE) to move to the next stage of negotiation under the DOE’s Transmission Facilitation Program. Support for our communities and customers ■ Working to return £200 million of interconnector revenues to UK consumers that we announced in May 2022, and the further £100 million that we announced in May 2023. ■ As part of our two-year winter support fund we announced last year, £19 million will be available to support our most vulnerable customers this coming winter. ■ Received two Edison Electric Institute Awards in June for outstanding storm response for the two most severe winter storms in New England last year (on 23 December 2022, and 13 March 2023). National Grid 2023/24 Half Year Results Statement 2 1 UK Electricity Transmission, UK Electricity Distribution, UK Electricity System Operator, New England and New York.
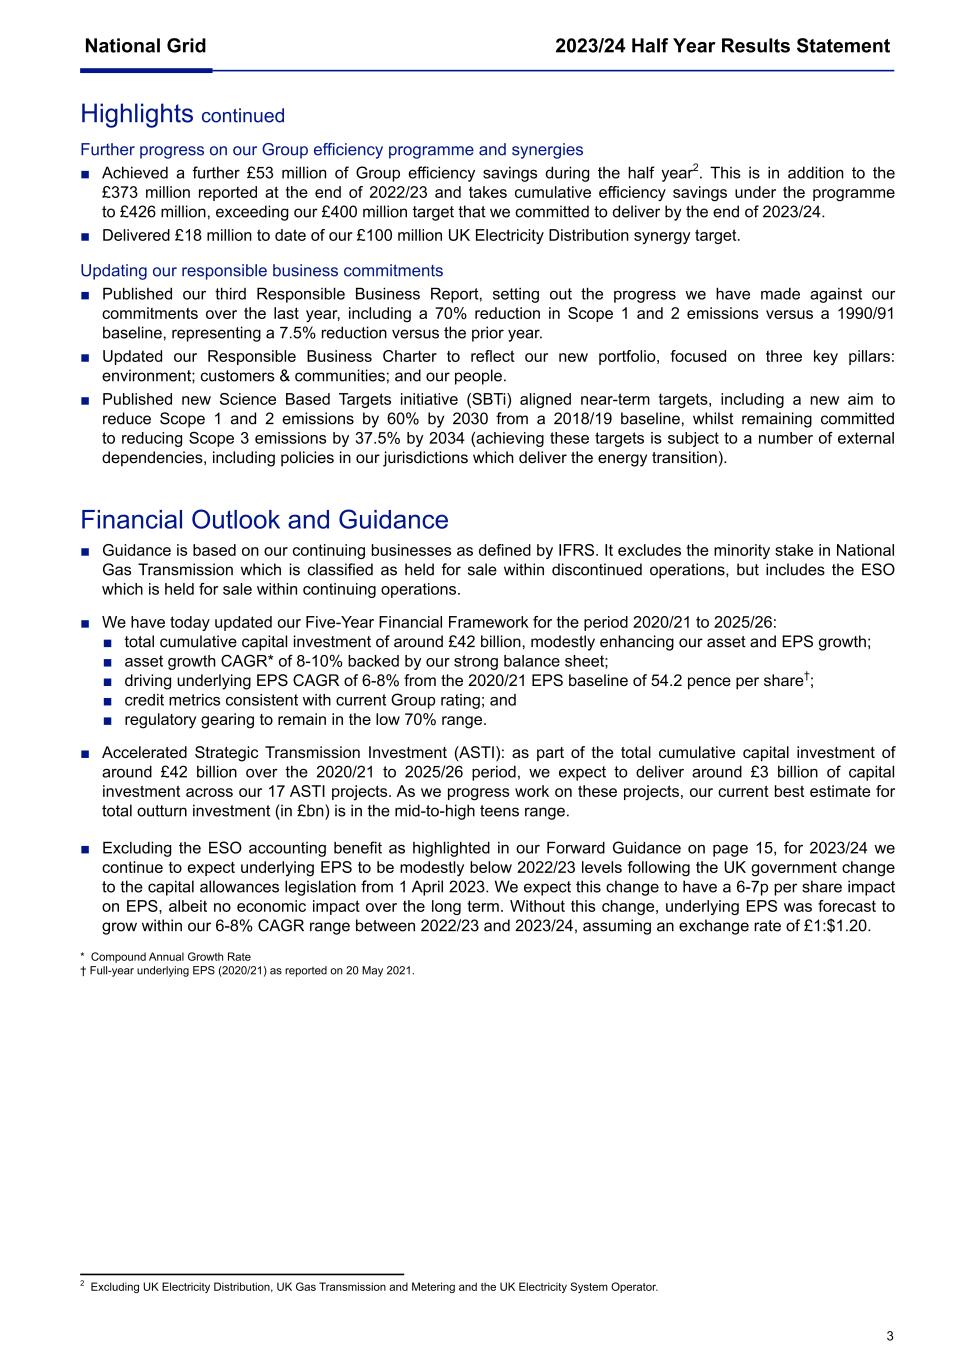
Highlights continued Further progress on our Group efficiency programme and synergies ■ Achieved a further £53 million of Group efficiency savings during the half year2. This is in addition to the £373 million reported at the end of 2022/23 and takes cumulative efficiency savings under the programme to £426 million, exceeding our £400 million target that we committed to deliver by the end of 2023/24. ■ Delivered £18 million to date of our £100 million UK Electricity Distribution synergy target. Updating our responsible business commitments ■ Published our third Responsible Business Report, setting out the progress we have made against our commitments over the last year, including a 70% reduction in Scope 1 and 2 emissions versus a 1990/91 baseline, representing a 7.5% reduction versus the prior year. ■ Updated our Responsible Business Charter to reflect our new portfolio, focused on three key pillars: environment; customers & communities; and our people. ■ Published new Science Based Targets initiative (SBTi) aligned near-term targets, including a new aim to reduce Scope 1 and 2 emissions by 60% by 2030 from a 2018/19 baseline, whilst remaining committed to reducing Scope 3 emissions by 37.5% by 2034 (achieving these targets is subject to a number of external dependencies, including policies in our jurisdictions which deliver the energy transition). Financial Outlook and Guidance ■ Guidance is based on our continuing businesses as defined by IFRS. It excludes the minority stake in National Gas Transmission which is classified as held for sale within discontinued operations, but includes the ESO which is held for sale within continuing operations. ■ We have today updated our Five-Year Financial Framework for the period 2020/21 to 2025/26: ■ total cumulative capital investment of around £42 billion, modestly enhancing our asset and EPS growth; ■ asset growth CAGR* of 8-10% backed by our strong balance sheet; ■ driving underlying EPS CAGR of 6-8% from the 2020/21 EPS baseline of 54.2 pence per share†; ■ credit metrics consistent with current Group rating; and ■ regulatory gearing to remain in the low 70% range. ■ Accelerated Strategic Transmission Investment (ASTI): as part of the total cumulative capital investment of around £42 billion over the 2020/21 to 2025/26 period, we expect to deliver around £3 billion of capital investment across our 17 ASTI projects. As we progress work on these projects, our current best estimate for total outturn investment (in £bn) is in the mid-to-high teens range. ■ Excluding the ESO accounting benefit as highlighted in our Forward Guidance on page 15, for 2023/24 we continue to expect underlying EPS to be modestly below 2022/23 levels following the UK government change to the capital allowances legislation from 1 April 2023. We expect this change to have a 6-7p per share impact on EPS, albeit no economic impact over the long term. Without this change, underlying EPS was forecast to grow within our 6-8% CAGR range between 2022/23 and 2023/24, assuming an exchange rate of £1:$1.20. * Compound Annual Growth Rate † Full-year underlying EPS (2020/21) as reported on 20 May 2021. National Grid 2023/24 Half Year Results Statement 3 2 Excluding UK Electricity Distribution, UK Gas Transmission and Metering and the UK Electricity System Operator.
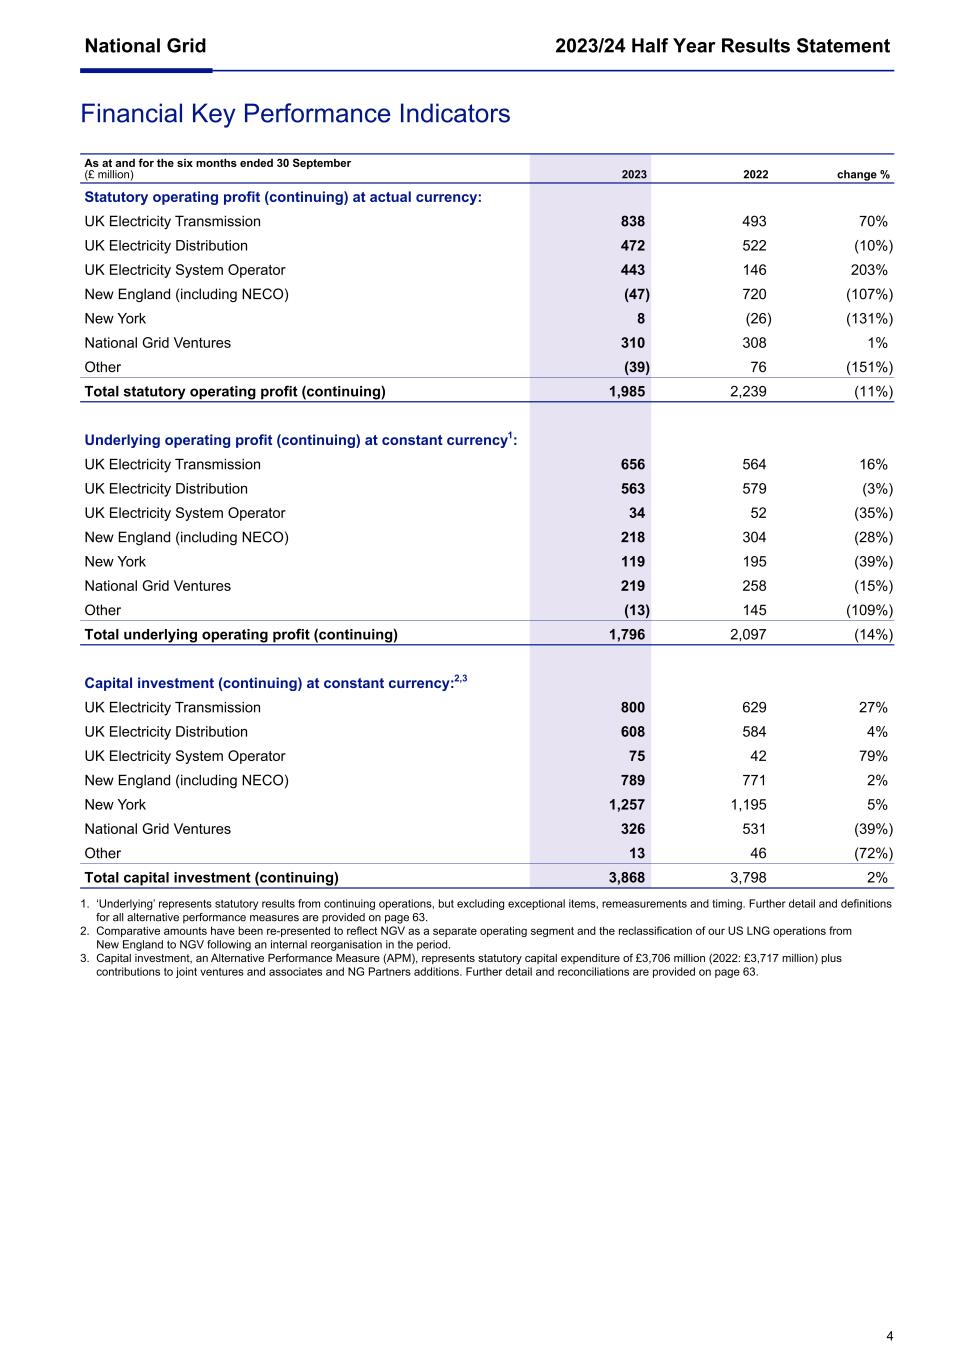
Financial Key Performance Indicators As at and for the six months ended 30 September (£ million) 2023 2022 change % Statutory operating profit (continuing) at actual currency: UK Electricity Transmission 838 493 70% UK Electricity Distribution 472 522 (10%) UK Electricity System Operator 443 146 203% New England (including NECO) (47) 720 (107%) New York 8 (26) (131%) National Grid Ventures 310 308 1% Other (39) 76 (151%) Total statutory operating profit (continuing) 1,985 2,239 (11%) Underlying operating profit (continuing) at constant currency1: UK Electricity Transmission 656 564 16% UK Electricity Distribution 563 579 (3%) UK Electricity System Operator 34 52 (35%) New England (including NECO) 218 304 (28%) New York 119 195 (39%) National Grid Ventures 219 258 (15%) Other (13) 145 (109%) Total underlying operating profit (continuing) 1,796 2,097 (14%) Capital investment (continuing) at constant currency:2,3 UK Electricity Transmission 800 629 27% UK Electricity Distribution 608 584 4% UK Electricity System Operator 75 42 79% New England (including NECO) 789 771 2% New York 1,257 1,195 5% National Grid Ventures 326 531 (39%) Other 13 46 (72%) Total capital investment (continuing) 3,868 3,798 2% 1. ‘Underlying’ represents statutory results from continuing operations, but excluding exceptional items, remeasurements and timing. Further detail and definitions for all alternative performance measures are provided on page 63. 2. Comparative amounts have been re-presented to reflect NGV as a separate operating segment and the reclassification of our US LNG operations from New England to NGV following an internal reorganisation in the period. 3. Capital investment, an Alternative Performance Measure (APM), represents statutory capital expenditure of £3,706 million (2022: £3,717 million) plus contributions to joint ventures and associates and NG Partners additions. Further detail and reconciliations are provided on page 63. National Grid 2023/24 Half Year Results Statement 4

Contacts Investor Relations Nick Ashworth +44 (0) 7814 355 590 Angela Broad +44 (0) 7825 351 918 James Flanagan +44 (0) 7970 778 952 Alexandra Bateman +44 (0) 7970 479 571 Media Molly Neal +44 (0) 7583 102 727 Lyndsey Evans +44 (0) 7714 672 052 Brunswick Dan Roberts +44 (0) 7980 959 590 Results presentation webcast An audio webcast and live Q&A with management will be held at 09:15 (BST) today. Please use this link to join via a laptop, smartphone or tablet: https://www.nationalgrid.com/investors/events/results-centre A replay of the webcast will be available soon after the event at the same link. UK (and International) +44 (0) 330 551 0200 UK (Toll Free) 0808 109 0700 US (Local) +1 786 697 3501 Password Quote “National Grid Half Year” when prompted by the operator Use of Alternative Performance Measures (APMs) Throughout this release we use a number of alternative (or non-IFRS) and regulatory performance measures to provide users with a clearer picture of the regulated performance of the business. This is in line with how management monitor and manage the business day-to-day. Further detail and definitions for all alternative performance measures are provided on pages 63 to 67. Inside information This announcement contains inside information for the purposes of Article 7 of the UK Market Abuse Regulation. The person responsible for arranging the release of this announcement on behalf of National Grid is Justine Campbell, Group General Counsel & Company Secretary. National Grid 2023/24 Half Year Results Statement 5
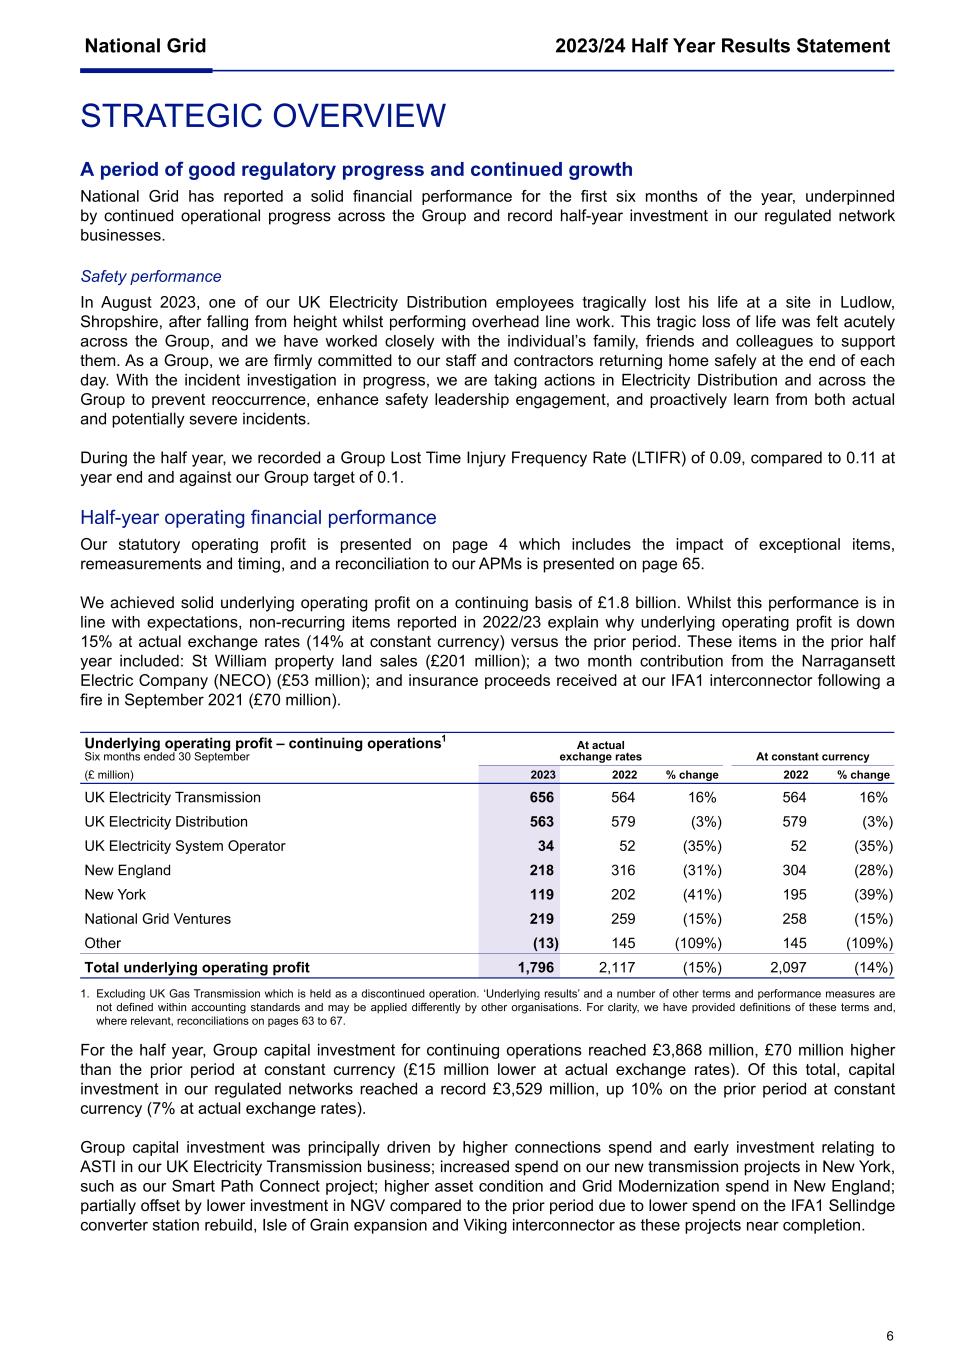
STRATEGIC OVERVIEW A period of good regulatory progress and continued growth National Grid has reported a solid financial performance for the first six months of the year, underpinned by continued operational progress across the Group and record half-year investment in our regulated network businesses. Safety performance In August 2023, one of our UK Electricity Distribution employees tragically lost his life at a site in Ludlow, Shropshire, after falling from height whilst performing overhead line work. This tragic loss of life was felt acutely across the Group, and we have worked closely with the individual’s family, friends and colleagues to support them. As a Group, we are firmly committed to our staff and contractors returning home safely at the end of each day. With the incident investigation in progress, we are taking actions in Electricity Distribution and across the Group to prevent reoccurrence, enhance safety leadership engagement, and proactively learn from both actual and potentially severe incidents. During the half year, we recorded a Group Lost Time Injury Frequency Rate (LTIFR) of 0.09, compared to 0.11 at year end and against our Group target of 0.1. Half-year operating financial performance Our statutory operating profit is presented on page 4 which includes the impact of exceptional items, remeasurements and timing, and a reconciliation to our APMs is presented on page 65. We achieved solid underlying operating profit on a continuing basis of £1.8 billion. Whilst this performance is in line with expectations, non-recurring items reported in 2022/23 explain why underlying operating profit is down 15% at actual exchange rates (14% at constant currency) versus the prior period. These items in the prior half year included: St William property land sales (£201 million); a two month contribution from the Narragansett Electric Company (NECO) (£53 million); and insurance proceeds received at our IFA1 interconnector following a fire in September 2021 (£70 million). Underlying operating profit – continuing operations1 Six months ended 30 September At actual exchange rates At constant currency (£ million) 2023 2022 % change 2022 % change UK Electricity Transmission 656 564 16% 564 16% UK Electricity Distribution 563 579 (3%) 579 (3%) UK Electricity System Operator 34 52 (35%) 52 (35%) New England 218 316 (31%) 304 (28%) New York 119 202 (41%) 195 (39%) National Grid Ventures 219 259 (15%) 258 (15%) Other (13) 145 (109%) 145 (109%) Total underlying operating profit 1,796 2,117 (15%) 2,097 (14%) 1. Excluding UK Gas Transmission which is held as a discontinued operation. ‘Underlying results’ and a number of other terms and performance measures are not defined within accounting standards and may be applied differently by other organisations. For clarity, we have provided definitions of these terms and, where relevant, reconciliations on pages 63 to 67. For the half year, Group capital investment for continuing operations reached £3,868 million, £70 million higher than the prior period at constant currency (£15 million lower at actual exchange rates). Of this total, capital investment in our regulated networks reached a record £3,529 million, up 10% on the prior period at constant currency (7% at actual exchange rates). Group capital investment was principally driven by higher connections spend and early investment relating to ASTI in our UK Electricity Transmission business; increased spend on our new transmission projects in New York, such as our Smart Path Connect project; higher asset condition and Grid Modernization spend in New England; partially offset by lower investment in NGV compared to the prior period due to lower spend on the IFA1 Sellindge converter station rebuild, Isle of Grain expansion and Viking interconnector as these projects near completion. National Grid 2023/24 Half Year Results Statement 6

Positioning National Grid for the future – our strategic pivot The strategic pivot that we announced in 2021 will enable the Group to play a key role at the heart of the energy transition, drive long-term shareholder value and deliver affordability for our customers. It included the acquisition of UK Electricity Distribution (June 2021), the sale of NECO (May 2022), and the sale of a majority stake in UK Gas Transmission (January 2023, when the company began to operate under a new name, National Gas Transmission). On 19 July, we announced the sale of a further 20% in National Gas Transmission to a consortium led by Macquarie Asset Management. The equity sale is on equivalent financial terms to the original 60% transaction (acquired by the same consortium) that was completed in January 2023. Completion of the sale of this further 20% is subject to the same National Security and Investment (NSI) clearance process as the initial 60% tranche and, subject to such clearance, will complete in the same way. This will take the consortium’s equity stake in National Gas Transmission to 80%. As part of the same announcement, National Grid confirmed that it had entered into a new option agreement with the Consortium for the potential sale of the final 20% shareholding in National Gas Transmission. The Consortium has the option, exercisable between 1 May 2024 and 31 July 2024, to acquire the remaining interest. If the option is partially exercised by the Consortium, National Grid will have the right to put the remainder of its equity interest in National Gas Transmission to the Consortium, which can be exercised by National Grid between 1 December 2024 and 31 December 2024. If one or both of these options are exercised, the consideration for the remaining interest is expected to be paid in cash to National Grid on equivalent financial terms to the original 60% transaction, subject to certain adjustments. National Grid’s asset base will move to around 75% electricity (up from 60% in 2021) once the 20% equity sale in National Gas Transmission (that we announced in July) completes. Supporting our customers and communities Over the half year, we have made good progress on making sure our economic and social role has the greatest impact on the communities we serve. We have continued to see a tough economic backdrop for our customers and communities as inflation, and rising energy prices, have contributed to the cost-of-living crisis. As a responsible business, our focus remains on delivering the energy transition in the UK and the US to help move towards a clean energy future that is affordable for customers. As part of this, we announced last year our winter funding packages to help our most vulnerable customers and communities in the UK and US. Of the $17 million we committed to help customers in New York and Massachusetts, around $9 million has already been distributed in the past year through our network partners to assist over 35,000 households with high energy costs. The remaining funds will be distributed across the forthcoming winter months in 2023/24. In the UK, we have £11 million remaining of the original £50 million support fund that we established last year, and we plan to distribute it this coming winter across a number of areas. This will include expanding our UK Electricity Distribution Community Matters Fund that offers grants to customers struggling with fuel poverty; continuing our support for home visit, customer advice and fuel vouchers through the National Energy Foundation and Fuel Bank Foundation; and supporting Citizens Advice by funding an additional 15 full-time caseworkers, delivering support to an additional 2,400 people with specialist advice. We also continue to work with Ofgem on the early return of £200 million of interconnector revenues to UK consumers that we announced in May 2022. We also plan to return a further £100 million of revenues to customers, as we announced in May 2023, subject to Ofgem’s consent. National Grid 2023/24 Half Year Results Statement 7
UK regulatory progress and Winter Outlook We have seen good regulatory progress in the UK across a number of policy and regulatory areas. From recommendations made to accelerate transmission investment, through to the Energy Act 2023 receiving Royal Assent, the progress we have seen this year will support the UK’s drive for decarbonisation, greater energy affordability and increased energy security, goals for which National Grid is wholly aligned and supportive in delivering. Energy Act 2023 and Future Systems and Network Regulation (FSNR) At the end of October, we welcomed the Energy Act receiving Royal Assent and passing into legislation. The Act is a crucial next step in delivering a secure and affordable clean energy network and establishes important policy and governance foundations to deliver on the UK’s net zero ambitions. The Act enables the separation of the Electricity System Operator (ESO) from National Grid and the formation of an Independent System Operator and Planner (ISOP). The ISOP, formerly referred to as the Future System Operator, will have a critical role in delivering strategic, whole system energy planning and oversight as we continue to invest in and transform the UK’s energy infrastructure. We expect the ISOP to be established as a public entity in 2024 with responsibilities across both the electricity and gas systems. We also welcomed the introduction of a net zero duty for Ofgem within the Act, which widens the regulator’s remit to consider net zero targets as part of its decision making. The inclusion of marine grids in the legislation’s definition of offshore wind associated infrastructure is also welcome and will assist in simplifying the consenting process. Also in October, we welcomed Ofgem’s publication of the FSNR Framework Decision. This sets out the overarching framework for the network price controls for electricity and gas transmission, and gas distribution, which will run from April 2026, known as ‘RIIO-3’. For electricity transmission, the main points from the FSNR Decision included: ■ the continuation of five-year price controls, including the setting of returns and assessment of financeability (to ensure that necessary capital is attracted to support expansion needed in the grid); ■ evolution of a RIIO-style framework, with the introduction of a major projects regime for significant network investments identified in the Centralised Strategic Network Plan (see below); ■ the need for streamlining of the regulatory framework, recognising the requirement for companies to propose investments that are anticipatory; and ■ a focus on the need to accelerate digitalisation. The detail of the frameworks will now be developed through the sector specific methodology phase which will be managed through a combination of working groups and a consultation to be published in December 2023. The final methodology decision will be made in Spring 2024. The Decision also confirmed that the overarching RIIO-3 framework will provide a foundation for the Electricity Distribution price control which will start in April 2028. The precise framework and process for Electricity Distribution will be consulted on separately in late 2024. Further progress on ASTI On 25 August, Ofgem published transmission licence modifications which formally place the ASTI projects into Transmission Operators’ licences. This includes the 17 ASTI projects that Ofgem awarded to National Grid in December 2022 to upgrade the East coast transmission network in support of the UK government’s 50 GW 2030 offshore wind target. We are pleased with progress, and we have continued to engage with Ofgem on the profile and timing of the required ASTI investment. We expect the majority of this investment to be deployed towards the end of this decade. The 17 ASTI projects will be delivered by our Strategic Infrastructure (SI) business unit which ensures efficient and effective delivery. As each project completes, it will be transferred to UK Electricity Transmission which will then be responsible for the ongoing operation and maintenance of the infrastructure when in service3. National Grid 2023/24 Half Year Results Statement 8 3 ASTI capital expenditure is reported as part of the UK Electricity Transmission segment.

We have made good progress on our ASTI projects over the half year, including: signing JVs with ScottishPower for Eastern Green Link 1 in August, and with SSE for Eastern Green Link 2 in June; selecting the preferred suppliers for converter stations and cables at Eastern Green Links 1 and 2; completing the ‘examination’ stage of our Development Consent Order (DCO) application for the Yorkshire Green project; and launching the procurement process for the ‘Great Grid Upgrade Partnership’, the contractual model that will be used to deliver the majority of our onshore projects. The model has been designed on industry best practice with contracts expected to be awarded early in the new year. Transforming the network – reforming the pace of the energy transition In May, National Grid published ‘Delivering for 2035: Upgrading the grid for a secure, clean and affordable energy future’. The paper outlines five priority areas where action is required by the UK government and Ofgem to ensure electricity networks can fully play their part in decarbonising the power sector by 2035. These priority areas are: ■ reforming the planning system, centred around a strategic spatial energy plan; ■ ensuring the regulatory and governance framework is set up for delivery; ■ transforming how clean energy connects to the grid and accelerating net zero projects; ■ putting communities and consumers at the forefront of the transition; and ■ developing supply chain capacity and a skills pipeline across the country. The recommendations we made in the publication are critical to reforming the scale and pace of the energy transition needed over the next decade, particularly in transmission, to enable the decarbonisation of the UK power sector by 2035. Whilst significant progress has been made towards transforming the UK’s power system in recent years, full decarbonisation will require more urgent action from industry, the UK government and Ofgem. We are pleased to see a number of positive developments in this half year that support our call for urgent reform. In August, we welcomed the publication of the Electricity Networks Commissioner’s (ENC’s) report and its recommendations aimed at significantly reducing timelines for delivering onshore and offshore transmission network infrastructure. Many of the recommendations align with our priority areas. In particular, we support the ENC’s recommendation for a strategic spatial approach to planning energy infrastructure and the robust need case this would provide. The UK government has committed to publishing an Action Plan in response to the ENC report by the end of 2023, setting out future actions for government, Ofgem and industry. Key proposals by the ENC also link with Ofgem’s consultation published in June on proposed arrangements for the Centralised Strategic Network Plan (CSNP). The CSNP will be a new transmission network planning approach that will be delivered by the ISOP. The Ofgem consultation covers the first stage of the CSNP regulatory framework setting out how it expects the ISOP to model future supply and demand (currently the Future Energy Scenarios, or FES) that will inform future network investment need. National Grid fully supports the creation of a CSNP and agrees with the direction of the proposals in the Ofgem consultation. As with the ENC recommendations, the aims of the CSNP align with our five priority areas in our ‘Delivering for 2035’ paper. Connections reform across our transmission and distribution networks National Grid has launched a new reform initiative to accelerate grid connections across our transmission and distribution networks. During the half year, the ESO has continued to work with stakeholders, including UK Electricity Transmission, to improve and reform the connections process to the transmission network. We have been working on two major aspects, the shorter term Five Point Plan, and a longer full connection reform process. The transmission connection queue now stands at over 400 GW for Great Britain which represents a significant oversubscription of what is required to meet the scenarios in the ESO Future Energy Scenario publication. The Five Point Plan has been worked through with all transmission owners and customers. Progress is being made with around 5 GW of connection contracts being rescinded through the Transmission Entry Capacity (TEC) Amnesty, and our change of the treatment of batteries has accelerated over 10 GW of connections by at least four years. Work is being undertaken by the transmission owners to assess the full impact of the implementation of the Five Point Plan. One of the key changes will be the introduction of Queue Management clauses into connection agreements so that if connecting customers miss key milestones in their development then the ESO will have the right to terminate the connection. It is expected that Ofgem will decide on the code modification required to enable this in November this year. National Grid 2023/24 Half Year Results Statement 9
For longer-term reform, the ESO published a consultation in the summer, and we are responding with a recommended solution at the end of November. We are working with Ofgem to understand a way forward that can expedite the implementation and delivery of the benefits of the proposed connection reform. We have also taken further action on connections reform across our UK Electricity Distribution network. In September, we announced plans to release 10 GW of grid capacity for the connection of renewable generation assets to our network. This follows engagement since the beginning of the year with the ESO, Ofgem and the UK government to find solutions to speed up the connection of low carbon technologies. Through a new agreement with the ESO, projects that require additional transmission network reinforcement will be offered the chance to connect under an interim, non-firm connection arrangement. In return for an earlier connection, the interim arrangements would mean some projects could be curtailed when there is too much generation on the system, such as on some of the windiest and sunniest summer days. In the long term, these interim arrangements will be replaced with firm connections as network capacity increases. In addition, from September we have started to replace the current ‘first come, first served’ connection model with a ‘first ready, first connected’ approach on our UK Electricity Distribution network. This updated approach, which will apply on a non-firm basis to a subset of supply points, will accelerate the connection of ‘shovel ready’ projects to allow more low carbon projects to connect faster. As a result, these changes will allow customers to accelerate their connection dates and provide a more agile approach to managing connection requests. We also continue to work with members of the Energy Networks Association (ENA) on reforming the connection process to distribution networks. This includes promoting mature projects that are closer to delivery above those that may be ‘blocking’ the queue; and changing how transmission and distribution networks coordinate connections, improving their interactivity. Ofgem inflation consultation On 1 August, Ofgem published a ‘call for input’ on the impact of high inflation on network price controls. This was expected as it was raised by Ofgem as part of the Electricity Distribution Draft Determinations in summer 2022. There are five policy considerations that Ofgem have asked stakeholders to comment on, namely: no action; reporting and transparency; future price control design; true up; and voluntary submissions. The document recognises the importance of stable regulation and the risk of changing how regulation works. We have worked with the ENA to put forward our views and, given the timeline, we believe this is best discussed as part of the RIIO-3 price controls. Ofgem is expected to publish an informal consultation in late 2023 which will provide more detail around whether it intends to launch a standalone consultation or whether it will wait for the next price control period. UK Winter Outlook In September, the ESO published the electricity Winter Outlook for the upcoming winter in Great Britain. Despite the ongoing conflicts in Ukraine and the Middle East, the broad European energy market has improved since last year. The market has bolstered European gas storage and supplies, and the French nuclear fleet capacity is back to pre-pandemic levels. The ESO has built on the experience of the 2022/23 winter and continued to build resilience and minimise the potential impact of risks and uncertainties in the energy markets. As such, the System Operator’s Base Case scenario is that there will be adequate margins (4.4 GW/7.4%) through the forthcoming winter to ensure Great Britain remains within the reliability standard4. Alongside the Base Case, the ESO has stress tested the impact of credible Great Britain and EU energy market events on the system against available operational tools. As a result, it plans to reintroduce the Demand Flexibility Service for this winter to incentivise customers to reduce consumption during periods when margins are tightest. This measure, alongside the robust set of tools already deployed by the ESO, will contribute to maintaining adequate margins and mitigate impacts to customers. National Grid 2023/24 Half Year Results Statement 10 4 The reliability standard is set at less than three hours Loss of Load Expectation (LOLE).
US regulatory progress We have seen good momentum on regulatory progress across our US jurisdictions during the half year. New York rate filings On 1 September, New York Public Service Commission (PSC) Staff responded to our rate filing that we made for our downstate gas business, KEDNY-KEDLI, in April. The response proposed a Return on Equity (ROE) of 9.1% (compared to our request for 9.8%), revenue increases of $389 million for KEDNY and $220 million for KEDLI (compared to our request of $466 million and $277 million respectively) and a 7.5% reduction on our request for capital expenditure in 2024/25. In addition, PSC Staff also recommended increasing Leak Prone Pipe (LPP) replacement targets for both KEDNY and KEDLI (for example, 55 miles of pipe replacement at KEDNY in calendar year 2024 against our request for around 40 miles; and 125 miles of pipe replacement at KEDLI in calendar year 2024 against our request for around 110 miles). PSC Staff supported future Renewable Natural Gas (RNG) connections to the gas network, recognising that projects are at an early stage; the regulator also expressed support for advancing and funding an opportunity to use an existing green hydrogen facility for blending in a closed system on Long Island. National Grid responded to the PSC Staff position on 22 September, and we plan to move forward in settlement negotiations, hoping to reach a Joint Proposal with stakeholders in the first quarter of calendar year 2024. We also remain on track to file for new rates at our Niagara Mohawk (NIMO) electric and gas business (upstate New York) in summer 2024. New York transmission investment In July, we received Federal Energy Regulatory Commission (FERC) approval for cost recovery on our Smart Path Connect transmission rebuild and refurbishment project in upstate New York. The order included a 10.3% ROE with a 50:50 debt:equity ratio, with cost recovery effective from 1 April 2023. The project, to develop 110 miles of transmission lines in partnership with the New York Power Authority (NYPA), will unlock more than 1,000 MW of existing renewable resources, deliver significant production cost savings and emissions reductions, and will decrease transmission congestion. The project is on track to be completed by 2025. Massachusetts – Electric Sector Modernization Plan submitted On 1 September, we filed our Electric Sector Modernization Plan (ESMP) in Massachusetts. The plan outlines the investment required in our electric distribution network over the next five years and beyond to help the State meet its clean energy goals under the 2050 Clean Energy and Climate Plan (CECP). Under the plan, we have proposed to invest up to $2 billion over the next five years across the following areas: ■ Network infrastructure: upgraded power lines, transformers, substations, to make the network more resilient, connect clean energy and plan in advance for growth in electric demand; ■ Technology and platforms: new planning tools for smarter decision making, including new data and monitoring systems to ensure system stability, and new IT infrastructure; and ■ Customer programmes: help customers reduce carbon footprint, drive smart energy use. Customers and all other interested parties will be able to provide their feedback through public and technical workshops that National Grid will conduct jointly with other electric distribution companies. We will use feedback to inform the formal filing of a Future Grid Plan to the Department for Public Utilities (DPU) in January 2024, after which the DPU will consider the Plan and direct the company on how to proceed. The proposed investment under the ESMP is not currently part of any rate order for our service territory. We remain on track to file for new rates for our Massachusetts Electric business in mid-November 2023, and we will propose a mechanism for recovery of the ESMP investment as part of that filing. Twin States Clean Energy Link In October, the Twin States Clean Energy Link was selected by the US Department of Energy (DOE) as one of three projects in the US to enter capacity contract negotiations through the DOE’s Transmission Facilitation Program. Twin States is a bidirectional transmission project being proposed by National Grid and Citizens Energy Corporation. If built, the line will deliver 1,200 MW of hydro-sourced generation from Canada to New England when it is needed and will allow for excess power from offshore wind in New England to be delivered to Canada. Moving forward, we will continue working with local, state and federal stakeholders to progress the project which has the potential to create significant savings for customers in New England. National Grid 2023/24 Half Year Results Statement 11

Community Offshore Wind (COSW) On 24 October, the New York State Energy Research and Development Authority (NYSERDA) announced three successful projects that will receive Offshore Renewable Energy Certificates (ORECs) as part of New York’s third large-scale offshore wind solicitation. COSW, our JV with RWE, was selected as one of the successful projects with a provisional offtake award of 1.3 GW. The project would be located within COSW’s 3.2 GW seabed lease in the New York Bight. In August 2023, COSW also submitted an offtake bid for up to 1.3 GW in response to the New Jersey Board of Public Utilities (BPU) solicitation. We await selection decisions in the first or second quarter of calendar year 2024. Further progress on Group efficiency savings As part of our Group efficiency savings programme, we achieved a further £53 million of savings in the first half of the year5. This is in addition to the £373 million reported at the end of 2022/23 and takes our cumulative efficiency savings under the programme to £426 million. This exceeds our £400 million savings target that we announced in November 2021 and that we committed to deliver by the end of 2023/24. Of the £53 million savings achieved this financial year, almost £40 million has been in New York and New England. This has principally been through property rationalisation and implementing a more strategic approach to National Grid’s sourcing and contract management strategies, enabling the business to reduce its external spend. It has also been driven by the use of digital solutions such as OnMyWay (which digitises National Grid’s paper-based work for electric line crews, enabling more efficient job coordination), FutureNow (which digitises our electric network investment planning), and Vegetation Management Optimization (which optimises our vegetation management strategy and execution for value, cost and reliability). The continued roll out of new customer initiatives, including the use of lower cost service providers supporting our front office teams, and increased use of e-billing and self-service options for customers has enabled further cost reduction. In our field operations, we have identified ways to reduce the workloads of our maintenance teams whilst maintaining the safe and reliable operation of the network. For example, we have maximised resource capacity through combined training for teams, more efficient coordination with external partners to reduce completion time, and optimising crew sizes where it is safe to do so. In addition, we have improved productivity through combining projects where appropriate and making them more efficient to deliver. Throughout the rest of our business, we have driven efficiencies following the 2020/21 Business Unit reorganisation, enabled by new digital capabilities, contract renegotiations and procurement strategies. We will continue to drive further efficiencies, and we would expect a similar level of savings in the second half of this year compared to the first half. Updating our responsible business commitments to reflect our repositioned portfolio National Grid believes that all businesses need to stand for more than just profits. We have a critical role in enabling net zero and ensuring that the benefits of the energy transition are shared with everyone, with nobody left behind. This responsibility is integral to our core strategy and underpins our Responsible Business Fundamentals – ensuring safe and reliable operations, living our values, whilst influencing, and expecting the same of our partners and supply chain. Progress against our Responsible Business commitments Our 2022/23 Responsible Business Report, released in June, sets out the progress we have made against our commitments in 2022/23. These included: ■ a 70% reduction in Scope 1 and 2 emissions versus a 1990/91 baseline, representing a 7.5% reduction versus the prior year; ■ maintaining our CDP Climate Change ‘A list rating’ for the seventh consecutive year; ■ achieving 60,096 employee volunteering hours. This means that, since 2020, we have achieved a cumulative 100,000 employee volunteering hours versus our target of 500,000 to be reached by 2030; and ■ integrating our responsible business commitments within our performance management frameworks. Underpinning this progress against our commitments is the record level of investment we have made across our networks in the past year, making us one of the FTSE’s biggest investors in the delivery of net zero. National Grid 2023/24 Half Year Results Statement 12 5 Excluding UK Electricity Distribution, UK Gas Transmission and Metering and the UK Electricity System Operator.
Updating our Responsible Business Charter Since we launched our first Responsible Business Charter three years ago the external environment has continued to change, and our business has evolved significantly with the repositioning of our portfolio. To reflect these changes, we updated the Charter in September following engagement with stakeholders and with a focus on three core pillars: our environment; our customers and community; and our people. Each of these pillars is underpinned by our Responsible Business Fundamentals, with the previous pillars of economy and governance now embedded within these new focus areas. New SBTi aligned targets On environment, our new aim is to reduce scope 1 and 2 emissions by 60% by 2030, from a 2018/19 baseline6, whilst remaining committed to reducing scope 3 emissions by 37.5% by 2034. These near-term emission targets across the Group align National Grid to a 1.5 degrees pathway and have been verified by the SBTi. We have also updated our emission reduction ambitions for our supply chain, adding clarity on how we will target our suppliers to reduce Scope 3 emissions across the company. Achieving these targets is subject to a number of external dependencies, including policies in our jurisdictions which deliver the energy transition. We are engaging actively with policy makers to enable these. On our customers and communities, we aim to support an affordable, and fair, energy transition, where nobody is left behind. We will continue to mobilise hardship funds and energy efficiency measures, and improve our reporting, on the benefits that these initiatives provide. We will also continue to provide meaningful skills development for 45,000 people by 2030 with a focus on communities facing socio-economic disadvantage, and report on the progress of our Grid for Good employability programmes. We will deliver 500,000 hours of volunteering by the same date. On our third pillar, people, we are investing to build the skills needed to deliver the clean energy future. Building a diverse, equitable and inclusive organisation that reflects the communities we serve, is key to our success. Whilst we have made good progress here, we will move forward with goals that include: achieving 35% gender diversity and 20% ethnic diversity in our management population by 2025, representing a 1.5% and 3% increase, respectively, compared to today; aiming for 50% female representation and 40% ethnic diversity in our new talent population by 2025; aiming to lead the industry on wellbeing, with metrics above the prior year level; and we remain committed to making sure pay is equitable for all our colleagues. Board changes On 17 May, we announced that Thérèse Esperdy will step down from the Board as a Non-Executive Director on 31 December 2023 after serving more than nine years. On 21 September, we announced that Ian Livingston will succeed Thérèse Esperdy as the Senior Independent Director on 31 December 2023. National Grid 2023/24 Half Year Results Statement 13 6 Our previous SBT was to reduce Scope 1 and 2 emissions by 50% by 2030 from a 2015/16 baseline.

FIVE-YEAR FINANCIAL FRAMEWORK Our five-year financial framework (1 April 2021 to 31 March 2026) includes UK Electricity Distribution from acquisition, the sale of NECO in May 2022, and the sale of a 60% stake in our UK Gas Transmission business in January 2023. Capital investment and Group asset growth Following our update, we now expect to invest around £42 billion across our energy networks and adjacent businesses, in the UK and US, over the five-year period to 2025/26. Of this, around £32 billion is considered to be aligned with the principles of the EU Taxonomy legislation as at the date of reporting. We expect this increased investment to be modestly enhancing to asset and EPS growth. In the UK, we expect around £11 billion of investment in Electricity Transmission, of which around £3 billion is driven by ASTI projects (which forms part of our best current view on total outturn investment for all 17 ASTI projects of mid-to-high teens (in £bn)). We expect our Electricity Distribution network to invest around £6 billion over the five years to 2025/26 in asset replacement, reinforcement and new connections, facilitating the infrastructure for electric vehicles, heat pumps and directly connected generation. In our US regulated businesses, we expect to invest around £12 billion in New York and £9 billion in New England, over the five years to 2025/26. Over half of this will be safety related projects in our gas networks with the remainder in our electric networks such as for storm hardening, other net zero investments, and further electric transmission investment. We expect NGV to invest £3-4 billion over the five years to 2025/26 in completing the interconnector programme, the Isle of Grain Liquefied Natural Gas (LNG) capacity expansion project, and US renewable generation. As we have worked through the transactions, coupled with the sum of these investments, and the broad economic protection our businesses have against rising macroeconomic variables such as inflation, Group asset growth is expected to be 8-10% CAGR through to 2025/26. Group gearing We expect regulatory gearing to remain in the low 70% range for the remainder of the five-year framework. We remain committed to a strong, overall investment grade credit rating. Combined with the benefit of our hybrid debt, we expect gearing levels, and the other standard metrics we monitor, to sit within our current BBB+/Baa1 corporate rating band. Group underlying earnings growth and dividend growth From 2020/21 through to 2025/26, we expect our CAGR in underlying earnings per share to be in our 6-8% range from the baseline 54.2 pence per share7 (this includes our long run average scrip uptake assumption of 25% per annum). This will underpin our sustainable, progressive dividend policy into the future. Excluding the ESO accounting benefit as highlighted in our Forward Guidance on page 15, for 2023/24 we continue to expect underlying EPS to be modestly below 2022/238 levels following the UK government change to the capital allowances legislation from 1 April 2023. We expect this change to have a 6-7p per share impact on EPS, albeit no economic impact over the long term. Without this change, underlying EPS was forecast to grow within our 6-8% CAGR range between 2022/23 and 2023/24, assuming an exchange rate of £1:$1.20. National Grid 2023/24 Half Year Results Statement 14 7 Full-year underlying EPS (2020/21) as reported on 20 May 2021. 8 With our 40% stake in National Gas Transmission accounted for as held for sale, it is not included in our underlying EPS guidance for 2023/24.
2023/24 FORWARD GUIDANCE This forward guidance is based on our continuing businesses as defined by IFRS. It excludes the minority stake in National Gas Transmission which is classified as held for sale within discontinued operations, but includes the ESO which is held for sale within continuing operations. The outlook and forward guidance contained in this statement should be viewed, together with the forward- looking statements set out in this release, in the context of the cautionary statement. The forward guidance in this section is presented on an underlying basis and excludes remeasurements and exceptional items. UK Electricity Transmission Net revenue (excluding timing) is expected to increase by around £260 million compared to 2022/23 primarily driven by the non-repeat of the prior year Western Link settlement, and higher revenues driven by indexation. This includes the impact on underlying revenues of the new UK capital allowances legislation. Costs are expected to offset around a third of the revenue increase, including higher depreciation due to the increasing asset base. We expect to deliver around 100 bps of outperformance in the third year of RIIO-T2 in operational Return on Equity. This is in line with our target to deliver 100 basis points of operational outperformance on average through the five-year period of the RIIO-T2 price control. UK Electricity Distribution Net revenue (excluding timing) is expected to be modestly lower compared to 2022/23, as we enter the first year of the RIIO-ED2 price control. This includes the impact on underlying revenues of the new UK capital allowances legislation. Controllable costs are expected to be modestly higher compared to the prior year due to increased workload associated with the new price control, inflationary impacts, and the non-repeat of some one- off items, whilst depreciation is expected to be slightly higher, driven by increasing rate base. In line with our target, we expect to deliver around 100-125 basis points of outperformance in the first year of RIIO-ED2 in operational Return on Equity. UK Electricity System Operator (ESO) Underlying operating profit (excluding timing) is expected to be around £30 million higher than 2022/23, driven by around £50 million lower depreciation following being classified as held for sale at the end of October 2023. Under the RIIO-2 price control, totex in ESO is no longer subject to the totex incentive mechanism and is instead regulated under a pass-through mechanism, with cost increases or efficiencies trued-up the following year. New England The completion of the sale of NECO in May 2022 will reduce underlying operating profit (excluding timing) in 2023/24 by around $65 million. For the remaining business we expect net revenue (excluding timing) to be around $160 million higher from expected rate increases, with just over half of this being offset by cost increases due to depreciation, rate funded increases, and inflation. Return on Equity for New England is expected to slightly improve in respect of underlying performance compared to 2022/23. Alongside this, there is expected to be an additional one-off benefit of around 40 basis points in 2023/24 partially relating to the regulatory recovery of a historical property tax matter. National Grid 2023/24 Half Year Results Statement 15

New York Net Revenue (excluding timing) is expected to be around $270 million higher, including increases from proposed rate settlements. Just under one third of this increase will be offset by depreciation as a result of higher investment. Lower controllable costs, as a result of efficiencies and non-recurrence of one-off items are broadly offset by higher rate funded costs. Return on Equity for New York is expected to be broadly in line with 2022/23. NGV and Other activities In NGV, we expect operating profit to be around 5% lower than 2022/23 driven by the reduction in interconnector auction revenues as energy markets return to more usual levels following the high prices experienced last year. We also expect other activities’ underlying operating profit to be lower year-on-year by just over £100 million. This is driven by reduced sales in our Commercial Property business, partly offset by the impact of our significant community spend in 2022/23. Joint Ventures and Associates Our share of the profit after tax of joint ventures and associates is expected to be just under £100 million lower than 2022/23 as a result of lower auction revenues in our joint venture interconnectors. Interest and Tax Net finance costs in 2023/24 are expected to be around £20 million lower than 2022/23. This follows the repayment of the acquisition bridge loan and lower inflationary rate increases, partially offset by increasing rates on new issuances. Other interest is expected to remain broadly flat. For the full year 2023/24, the underlying effective tax rate, excluding the share of post-tax profits from joint ventures and associates, is expected to be around 26%. Investment, Growth and Net Debt Overall Group capital investment for continuing operations in 2023/24 is expected to be above £8 billion. Asset Growth is expected to be within the 8-10% CAGR range, reflecting an increase in capex along with indexation impacting our UK regulated businesses. Depreciation is expected to increase, reflecting the impact of continued high levels of capital investment. Operating cash flow generated from continuing operations (excluding acquisitions, disposals and transaction costs) is expected to increase by around 30% compared to 2022/23 principally driven by ESO over-recoveries and higher operating profits. This increase is expected to be mostly offset by higher cash interest, higher cash capital investment and higher cash dividends than 2022/23. Net debt is expected to increase by around £3.5 billion (from £41.0 billion as at 31 March 2023) at a GBP:USD rate of 1.20, driven by our continued levels of significant investment in critical clean energy infrastructure, with regulatory gearing broadly flat year over year. This includes proceeds from the sale of a further 20% stake in National Gas Transmission to the consortium led by Macquarie Asset Management that we announced in July. Weighted average number of shares (WAV) is expected to be approximately 3,690 million in 2023/24. National Grid 2023/24 Half Year Results Statement 16
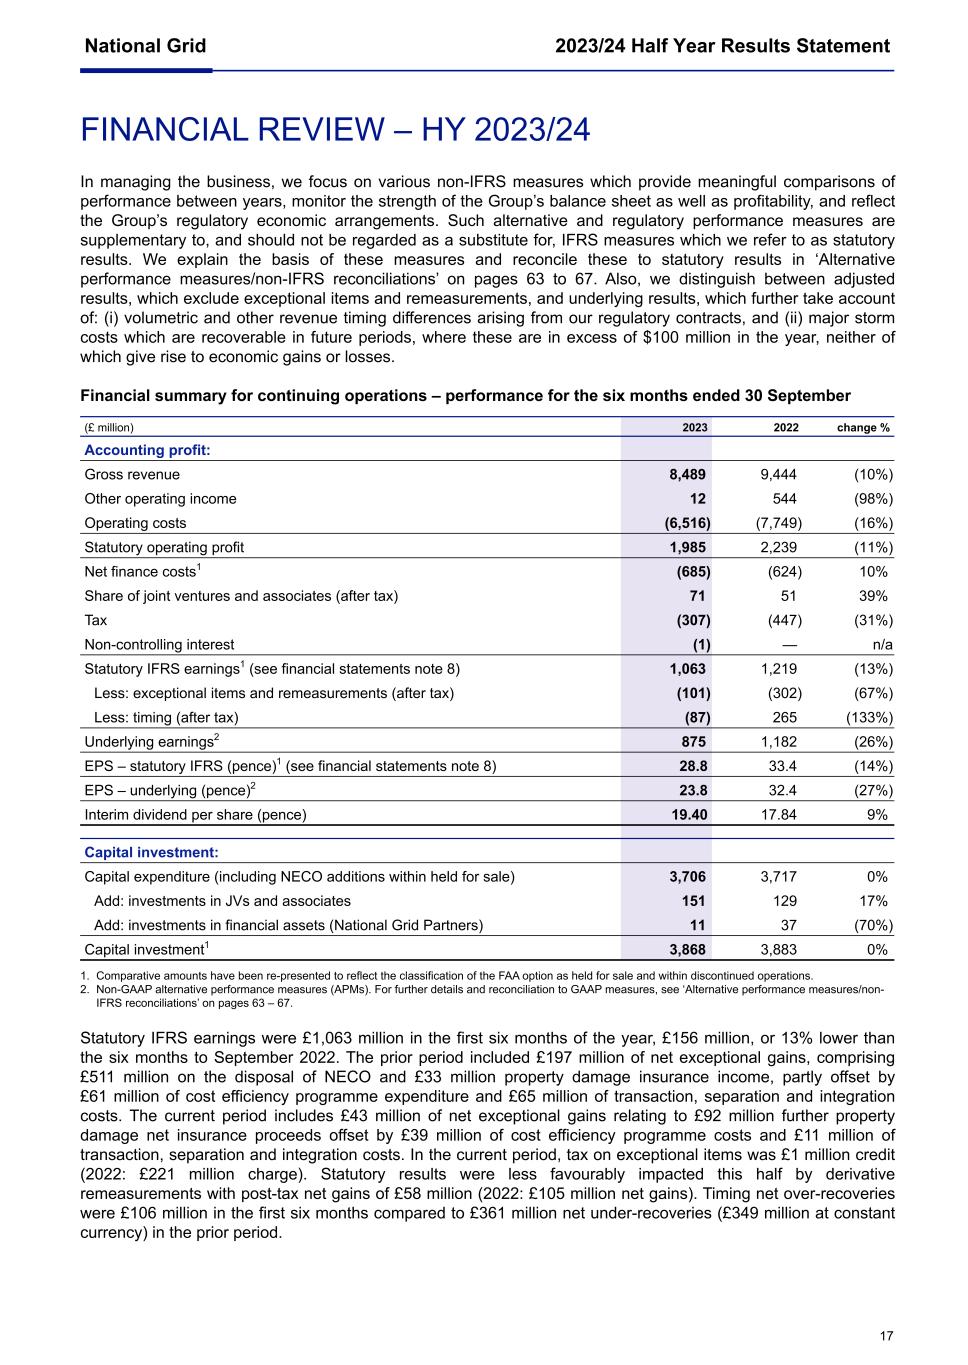
FINANCIAL REVIEW – HY 2023/24 In managing the business, we focus on various non-IFRS measures which provide meaningful comparisons of performance between years, monitor the strength of the Group’s balance sheet as well as profitability, and reflect the Group’s regulatory economic arrangements. Such alternative and regulatory performance measures are supplementary to, and should not be regarded as a substitute for, IFRS measures which we refer to as statutory results. We explain the basis of these measures and reconcile these to statutory results in ‘Alternative performance measures/non-IFRS reconciliations’ on pages 63 to 67. Also, we distinguish between adjusted results, which exclude exceptional items and remeasurements, and underlying results, which further take account of: (i) volumetric and other revenue timing differences arising from our regulatory contracts, and (ii) major storm costs which are recoverable in future periods, where these are in excess of $100 million in the year, neither of which give rise to economic gains or losses. Financial summary for continuing operations – performance for the six months ended 30 September (£ million) 2023 2022 change % Accounting profit: Gross revenue 8,489 9,444 (10%) Other operating income 12 544 (98%) Operating costs (6,516) (7,749) (16%) Statutory operating profit 1,985 2,239 (11%) Net finance costs1 (685) (624) 10% Share of joint ventures and associates (after tax) 71 51 39% Tax (307) (447) (31%) Non-controlling interest (1) — n/a Statutory IFRS earnings1 (see financial statements note 8) 1,063 1,219 (13%) Less: exceptional items and remeasurements (after tax) (101) (302) (67%) Less: timing (after tax) (87) 265 (133%) Underlying earnings2 875 1,182 (26%) EPS – statutory IFRS (pence)1 (see financial statements note 8) 28.8 33.4 (14%) EPS – underlying (pence)2 23.8 32.4 (27%) Interim dividend per share (pence) 19.40 17.84 9% Capital investment: Capital expenditure (including NECO additions within held for sale) 3,706 3,717 0% Add: investments in JVs and associates 151 129 17% Add: investments in financial assets (National Grid Partners) 11 37 (70%) Capital investment1 3,868 3,883 0% 1. Comparative amounts have been re-presented to reflect the classification of the FAA option as held for sale and within discontinued operations. 2. Non-GAAP alternative performance measures (APMs). For further details and reconciliation to GAAP measures, see ‘Alternative performance measures/non- IFRS reconciliations’ on pages 63 – 67. Statutory IFRS earnings were £1,063 million in the first six months of the year, £156 million, or 13% lower than the six months to September 2022. The prior period included £197 million of net exceptional gains, comprising £511 million on the disposal of NECO and £33 million property damage insurance income, partly offset by £61 million of cost efficiency programme expenditure and £65 million of transaction, separation and integration costs. The current period includes £43 million of net exceptional gains relating to £92 million further property damage net insurance proceeds offset by £39 million of cost efficiency programme costs and £11 million of transaction, separation and integration costs. In the current period, tax on exceptional items was £1 million credit (2022: £221 million charge). Statutory results were less favourably impacted this half by derivative remeasurements with post-tax net gains of £58 million (2022: £105 million net gains). Timing net over-recoveries were £106 million in the first six months compared to £361 million net under-recoveries (£349 million at constant currency) in the prior period. National Grid 2023/24 Half Year Results Statement 17
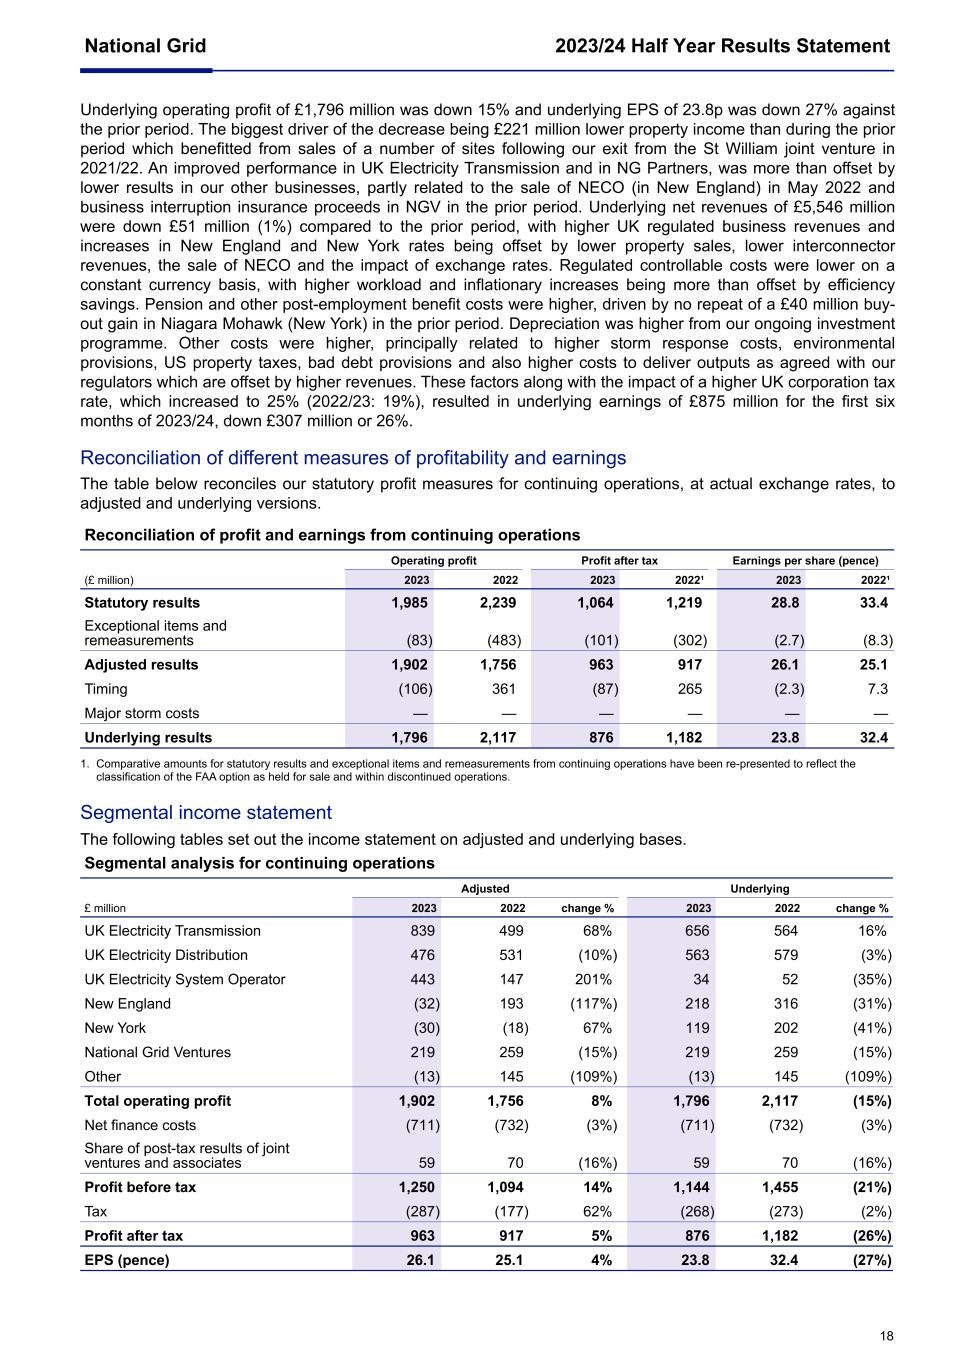
Underlying operating profit of £1,796 million was down 15% and underlying EPS of 23.8p was down 27% against the prior period. The biggest driver of the decrease being £221 million lower property income than during the prior period which benefitted from sales of a number of sites following our exit from the St William joint venture in 2021/22. An improved performance in UK Electricity Transmission and in NG Partners, was more than offset by lower results in our other businesses, partly related to the sale of NECO (in New England) in May 2022 and business interruption insurance proceeds in NGV in the prior period. Underlying net revenues of £5,546 million were down £51 million (1%) compared to the prior period, with higher UK regulated business revenues and increases in New England and New York rates being offset by lower property sales, lower interconnector revenues, the sale of NECO and the impact of exchange rates. Regulated controllable costs were lower on a constant currency basis, with higher workload and inflationary increases being more than offset by efficiency savings. Pension and other post-employment benefit costs were higher, driven by no repeat of a £40 million buy- out gain in Niagara Mohawk (New York) in the prior period. Depreciation was higher from our ongoing investment programme. Other costs were higher, principally related to higher storm response costs, environmental provisions, US property taxes, bad debt provisions and also higher costs to deliver outputs as agreed with our regulators which are offset by higher revenues. These factors along with the impact of a higher UK corporation tax rate, which increased to 25% (2022/23: 19%), resulted in underlying earnings of £875 million for the first six months of 2023/24, down £307 million or 26%. Reconciliation of different measures of profitability and earnings The table below reconciles our statutory profit measures for continuing operations, at actual exchange rates, to adjusted and underlying versions. Reconciliation of profit and earnings from continuing operations Operating profit Profit after tax Earnings per share (pence) (£ million) 2023 2022 2023 2022¹ 2023 2022¹ Statutory results 1,985 2,239 1,064 1,219 28.8 33.4 Exceptional items and remeasurements (83) (483) (101) (302) (2.7) (8.3) Adjusted results 1,902 1,756 963 917 26.1 25.1 Timing (106) 361 (87) 265 (2.3) 7.3 Major storm costs — — — — — — Underlying results 1,796 2,117 876 1,182 23.8 32.4 1. Comparative amounts for statutory results and exceptional items and remeasurements from continuing operations have been re-presented to reflect the classification of the FAA option as held for sale and within discontinued operations. Segmental income statement The following tables set out the income statement on adjusted and underlying bases. Segmental analysis for continuing operations Adjusted Underlying £ million 2023 2022 change % 2023 2022 change % UK Electricity Transmission 839 499 68% 656 564 16% UK Electricity Distribution 476 531 (10%) 563 579 (3%) UK Electricity System Operator 443 147 201% 34 52 (35%) New England (32) 193 (117%) 218 316 (31%) New York (30) (18) 67% 119 202 (41%) National Grid Ventures 219 259 (15%) 219 259 (15%) Other (13) 145 (109%) (13) 145 (109%) Total operating profit 1,902 1,756 8% 1,796 2,117 (15%) Net finance costs (711) (732) (3%) (711) (732) (3%) Share of post-tax results of joint ventures and associates 59 70 (16%) 59 70 (16%) Profit before tax 1,250 1,094 14% 1,144 1,455 (21%) Tax (287) (177) 62% (268) (273) (2%) Profit after tax 963 917 5% 876 1,182 (26%) EPS (pence) 26.1 25.1 4% 23.8 32.4 (27%) National Grid 2023/24 Half Year Results Statement 18
UK Electricity Transmission statutory operating of £838 million was up from £493 million in the prior period and included exceptional charges of £1 million as part of our cost efficiency programme (2022: £6 million). Adjusted operating profit of £839 million increased by £340 million compared to the prior period and included £248 million favourable swings driven by the collection of prior period balances and an in-year over-recovery due to changes to UK capital allowances legislation. Underlying operating profit was £656 million compared to £564 million in the prior period. This increase was driven by inflationary uplifts partly offset by the net impact to allowed revenues from taxes (higher UK corporation tax rate, more than offset by a change to first-year UK capital allowances). Separately, prior period revenues were adversely impacted by £69 million related to the return of Western Link liquidated damages to customers. UK Electricity Distribution statutory operating profit of £472 million was down from £522 million in the prior period and included exceptional charges of £4 million for transaction and integration costs (2022: £9 million). Adjusted operating profit decreased by £55 million to £476 million (2022: £531 million) and included £39 million adverse timing swings mainly related to under-recovery of inflation true-ups, recovery of pass-through costs and the return of prior period balances. Underlying operating profit decreased by £16 million to £563 million (2022: £579 million). Underlying net revenues increased as a result of inflation and higher allowances for the increase in the UK corporation tax rate, but were offset by a decrease due to the impact of first-year UK capital allowances and also adversely impacted by reduced incentives opportunities in the new RIIO-ED2 framework. The prior year also included a gain on disposal of a smart metering business. UK Electricity System Operator statutory operating profit of £443 million was up from £146 million in the prior period and included exceptional charges of £1 million in the prior period as part of our cost efficiency programme. Adjusted operating profit was £443 million compared to £147 million in the prior period. There has been a material impact on both statutory and adjusted operating profit from an over-collection of allowed revenues during the first six months of the year. This has arisen from the BSUoS fixed price tariff substantially exceeding the actual costs incurred during the period. This tariff is set ahead of the current financial year, with the objective of NG ESO to recover the estimated system balancing costs forecast to arise in the current period. The £409 million in-year over-collection will be returned by means of an adjustment to tariffs in 2024/25. Underlying operating profit was £34 million compared to £52 million in the prior period, principally as a result of lower incentives and accelerated depreciation of intangible assets. New England statutory operating loss of £47 million was down from a statutory operating profit of £720 million in the prior period and included an exceptional charge of £6 million (2022: £33 million) as part of our cost efficiency programme, an exceptional charge of £3 million (2022: £511 million gain) related to the disposal of NECO (Rhode Island business sold in 2022/23) and commodity derivative remeasurement losses of £6 million (2022: £49 million gains). New England incurred an adjusted operating loss of £32 million, £225 million adverse to the prior period (£217 million adverse on a constant currency basis). This was principally driven by a £131 million adverse timing swing related to under-recoveries of net metering credits and energy efficiency programme costs. In-year timing under-recoveries were £250 million (2022: £123 million under-recoveries, or £119 million under-recoveries at constant currency). Underlying operating profit was £218 million (2022: £316 million, or £304 million at constant currency), primarily as a result of the disposal of NECO which contributed £53 million to underlying operating profit for the two months owned in the prior period (£69 million contribution to adjusted operating profit). Underlying operating profit benefitted from increases in revenues from higher rates (through the performance based regulation), increased returns in wholesale networks and capital trackers and bad debt recoveries, but these were more than offset by an adverse impact from higher storm costs, increased depreciation, increased bad debt provisions and higher costs from both workload and inflation. New York statutory operating profit of £8 million was up from a statutory operating loss of £26 million in the prior period and included exceptional charges of £9 million (2022: £24 million) as part of our cost efficiency programme and commodity derivative remeasurement gains of £47 million (2022: £16 million gains). Adjusted operating loss of £30 million in the first six months was £12 million adverse to the prior period. This included a favourable £71 million timing swing primarily from higher wholesale transmission auction sales, partly offset by collection of downstate New York surcharges. In-year timing under-recoveries were £149 million (2022: £220 million under- recoveries, or £212 million under-recoveries at constant currency). Underlying operating profit was £119 million, £83 million lower than the prior period (£76 million lower at constant currency). Underlying net revenues were £46 million higher principally from increases in rates and an increase in energy efficiency programme funding partly offset by exchange rate movements. Controllable costs were lower with inflationary impacts more than offset by efficiency savings. Pension expense was higher as a result of a £40 million gain from a Niagara Mohawk pension buy-out in the prior period. Bad debts increased by £17 million, with a benefit in the prior period related to the Bill Relief Program. Other costs were higher related to property taxes, environmental reserves and also energy efficiency programme costs (funded in revenue). National Grid 2023/24 Half Year Results Statement 19
National Grid Ventures’ statutory operating profit of £310 million was up from £308 million in the prior period and included exceptional IFA1 fire property damage net insurance proceeds of £92 million (2022: £50 million) and exceptional charges of £1 million (2022: £1 million) as part of our cost efficiency programme. Adjusted operating profit of £219 million was £40 million lower than the prior period, driven by IFA1 interconnector profits which were lower (principally related to insurance recoveries in the prior period) and fewer projects completed in NG Renewables this year, partly offset by higher North Sea Link interconnector revenues and a gain on disposal of a smart metering business. ‘Other’ activities’ statutory operating loss of £39 million was down from a statutory operating profit of £76 million in the prior period and included exceptional charges of £23 million (2022: £4 million credit) as part of our cost efficiency programme, exceptional charges of £3 million (2022: £56 million) related to transaction and separation costs for disposal of a 60% share of our UK Gas Transmission and Metering business in 2022/23 and an exceptional charge of £17 million in our captive insurance business in the prior period. The adjusted operating loss of £13 million (2022: £145 million profit) was substantially lower than the prior period, which was the result of the non-repeat of the higher level of profits in the prior year in our Commercial Property business (£201 million related to site sales in the prior year, following our exit from the St William joint venture in 2021/22), partly offset by higher captive insurance profits and favourable fair value movements in NG Partners. Financing costs and tax Net finance costs Statutory net finance costs of £685 million were up from £624 million in the prior period and included derivative remeasurement gains of £26 million (2022: £108 million). Adjusted net finance costs for continuing operations of £711 million (2022: £732 million) were £21 million, or 3% lower than the prior period (£10 million, or 1% lower at constant currency). This was driven by lower inflation on RPI/CPI-linked debt, lower bridge financing costs (in relation to the acquisition of National Grid Electricity Distribution) and higher capitalised interest, partly offset by new financing requirements to fund our ongoing capital investment programme and the impact of higher interest rates. Joint ventures and associates The Group’s share of net profits from joint ventures and associates on a statutory basis was £71 million (2022: £51 million) and included derivative fair value remeasurement gains of £12 million (2022: £19 million losses). On an adjusted basis, share of net profits from joint ventures and associates was £59 million (2022: £70 million) with the decrease mainly driven by the sale of our interest in the Millennium gas pipeline during 2022/23. Tax The statutory tax charge for continuing operations was £307 million (2022: £447 million) including the impact of tax on exceptional items and remeasurements of £20 million charge (2022: £270 million charge). The adjusted tax charge for continuing operations was £287 million (2022: £177 million), resulting in an effective tax rate for continuing operations (excluding profits from joint ventures and associates) of 24.1% (2022: 17.3%) and an underlying effective tax rate for continuing operations (excluding profits from joint ventures and associates) of 24.7% (2022: 19.7%). The underlying effective tax rate is higher than in the prior period primarily due to the increase in UK corporation tax rate to 25% from 1 April 2023 and the profit mix including the higher level of Property disposals incurring a lower tax charge in the prior period. Net debt Net debt is a measure derived from IFRS (comprising cash and cash equivalents, current financial investments, borrowings and bank overdrafts and financing derivatives) and is defined and reconciled to these balances in note 11 to the financial statements. During the first six months of the year, net debt increased to £43.9 billion, £2.9 billion higher than at 31 March 2023. This was driven by cash generated from operations (continuing operations) of £3.1 billion and dividends received on financial investments of £0.1 billion, offset by £3.6 billion of cash outflows for capital investment (net of disposals) and movements in financial investment outside net debt, £0.2 billion of tax paid, £0.7 billion of interest outflows, £1.3 billion paid in dividends, £0.1 billion accretions on index-linked debt and exchange movements on opening net debt of £0.2 billion. During the period we raised around £3.0 billion of new long-term senior debt to refinance maturing debt and to fund a portion of our significant capital programme. As at 30 September 2023, we have £8.0 billion of committed facilities available for general corporate purposes. National Grid 2023/24 Half Year Results Statement 20

There are no significant updates relating to credit agency actions. National Grid’s balance sheet remains robust, and we remain committed to a strong, overall investment grade credit rating. Interim dividend The Board has approved an interim dividend of 19.40p per ordinary share ($1.1899 per American Depositary Share). This represents 35% of the total dividend per share of 55.44p in respect of the last financial year to 31 March 2023 and is in line with the Group’s dividend policy. The interim dividend is expected to be paid on 11 January 2024 to shareholders on the register as at 24 November 2023. Since 2021/22, the Board’s aim has been to grow the annual dividend per share in line with UK CPIH, thus maintaining the dividend per share in real terms. The Board will review this policy regularly, taking into account a range of factors including expected business performance and regulatory developments. The scrip dividend alternative will again be offered in respect of the 2023/24 interim dividend. As previously announced, we do not expect to buy back the scrip shares issued during 2023/24. National Grid 2023/24 Half Year Results Statement 21
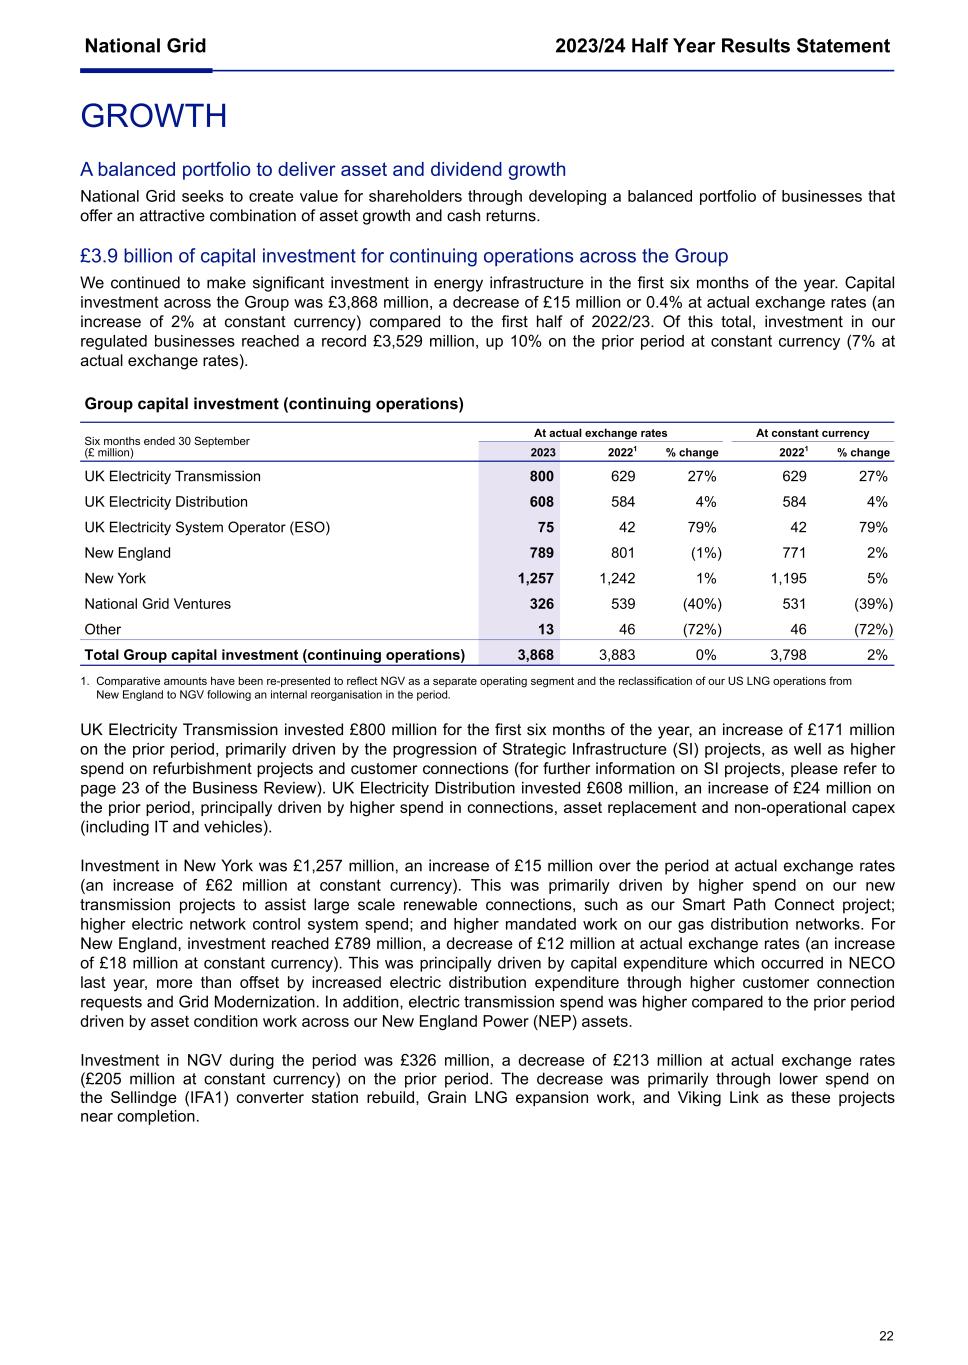
GROWTH A balanced portfolio to deliver asset and dividend growth National Grid seeks to create value for shareholders through developing a balanced portfolio of businesses that offer an attractive combination of asset growth and cash returns. £3.9 billion of capital investment for continuing operations across the Group We continued to make significant investment in energy infrastructure in the first six months of the year. Capital investment across the Group was £3,868 million, a decrease of £15 million or 0.4% at actual exchange rates (an increase of 2% at constant currency) compared to the first half of 2022/23. Of this total, investment in our regulated businesses reached a record £3,529 million, up 10% on the prior period at constant currency (7% at actual exchange rates). Group capital investment (continuing operations) Six months ended 30 September (£ million) At actual exchange rates At constant currency 2023 20221 % change 20221 % change UK Electricity Transmission 800 629 27% 629 27% UK Electricity Distribution 608 584 4% 584 4% UK Electricity System Operator (ESO) 75 42 79% 42 79% New England 789 801 (1%) 771 2% New York 1,257 1,242 1% 1,195 5% National Grid Ventures 326 539 (40%) 531 (39%) Other 13 46 (72%) 46 (72%) Total Group capital investment (continuing operations) 3,868 3,883 0% 3,798 2% 1. Comparative amounts have been re-presented to reflect NGV as a separate operating segment and the reclassification of our US LNG operations from New England to NGV following an internal reorganisation in the period. UK Electricity Transmission invested £800 million for the first six months of the year, an increase of £171 million on the prior period, primarily driven by the progression of Strategic Infrastructure (SI) projects, as well as higher spend on refurbishment projects and customer connections (for further information on SI projects, please refer to page 23 of the Business Review). UK Electricity Distribution invested £608 million, an increase of £24 million on the prior period, principally driven by higher spend in connections, asset replacement and non-operational capex (including IT and vehicles). Investment in New York was £1,257 million, an increase of £15 million over the period at actual exchange rates (an increase of £62 million at constant currency). This was primarily driven by higher spend on our new transmission projects to assist large scale renewable connections, such as our Smart Path Connect project; higher electric network control system spend; and higher mandated work on our gas distribution networks. For New England, investment reached £789 million, a decrease of £12 million at actual exchange rates (an increase of £18 million at constant currency). This was principally driven by capital expenditure which occurred in NECO last year, more than offset by increased electric distribution expenditure through higher customer connection requests and Grid Modernization. In addition, electric transmission spend was higher compared to the prior period driven by asset condition work across our New England Power (NEP) assets. Investment in NGV during the period was £326 million, a decrease of £213 million at actual exchange rates (£205 million at constant currency) on the prior period. The decrease was primarily through lower spend on the Sellindge (IFA1) converter station rebuild, Grain LNG expansion work, and Viking Link as these projects near completion. National Grid 2023/24 Half Year Results Statement 22
BUSINESS REVIEW UK ELECTRICITY TRANSMISSION Operations and capital expenditure UK Electricity Transmission has continued to deliver good levels of performance and our capital investment programme has progressed as expected. Capital expenditure reached £800 million, up £171 million on the prior period. This increase was primarily driven by the progression of Strategic Infrastructure (SI) projects (see below for further information), and an increase in spend versus the prior period on asset health work and customer connections. Progress continues on our London Power Tunnels 2 (LPT2) project where we reached the completion of tunnelling in October in line with our timetable. The £1 billion project is for the construction of 32.5 kilometres of underground cable tunnels connecting Wimbledon to New Cross, New Cross to Hurst, and Hurst to Crayford by 2027. In August, we reached 1,000,000 hours worked without a Lost Time Injury (LTI) on the project. We continue to make good progress on our £1 billion Hinkley-Seabank project where we are building a new high voltage electricity connection between Bridgewater and Seabank. We have completed the installation of all 116 T-pylons as part of the project (the first new pylon design in nearly a century), and the 57-kilometre connection is on track for completion by December 2025. We have also continued progress on our Visual Impact Provision (VIP) projects, where we are removing overhead transmission lines in Areas of Outstanding Natural Beauty (AONB) and replacing them with underground cables to reduce our visual impact on the natural environment. During the half year, we energised new lines in Dorset and the Peak District, with our Dorset project being shortlisted as one of four final schemes in the upcoming National APM Awards for the Engineering, Construction and Infrastructure Project of the Year award. Strategic Infrastructure (SI) projects Strategic Infrastructure is a part of National Grid Electricity Transmission (NGET) and is responsible for delivering the 17 ASTI projects to connect more clean, low-carbon power to the transmission network in England and Wales. SI ensures the efficient and effective delivery of ASTI projects, which are transferred to UK Electricity Transmission once they are complete and ready to be accepted onto the wider network. UK Electricity Transmission will then be responsible for the ongoing operation and maintenance of the infrastructure when in service9. We have made good progress on our ASTI projects, including: signing JVs with Scottish Power for Eastern Green Link 1 in August, and with SSE for Eastern Green Link 2 in June; selecting the preferred suppliers for converter stations and cables at Eastern Green Links 1 and 2; completing the ‘examination’ stage of our Development Consent Order (DCO) application for the Yorkshire Green project; and launching the procurement process for the ‘Great Grid Upgrade Partnership’, the contractual model that will be used to deliver the majority of our onshore projects. The Great Grid Upgrade Partnership is the opportunity for supply chain partners to help deliver the ‘Great Grid Upgrade’, the largest overhaul of the grid in generations. SI is seeking supply chain partners to deliver £4.5 billion of onshore network construction under an ‘enterprise’ partnership approach. This approach aims to deliver integrated planning and working between projects, enabling the supply chain to combine capacity, capability, knowledge and experience to accelerate delivery and generate cost efficiencies. This, in turn, will deliver value for money for consumers whilst working with local communities to leave a positive legacy. The model has been designed on industry best practice, with contracts expected to be awarded early in the new year. Customer Connections Over the last five years, UK Electricity Transmission has connected 10 GW of new clean energy and interconnectors to the electricity transmission network. In the first half of 2023/24 the business connected 2,970 MW of generation and 314 MVA of demand capacity, including the world’s largest offshore wind farm Dogger Bank and first Transmission connected solar farm. Of the 2,970 MW of generation, 1,400 MW is the connection of the Viking Link interconnector; 1,200 MW the first part of the Dogger Bank connection; 70 MW for solar; and the remaining 300 MW a mix of technologies including battery storage. National Grid 2023/24 Half Year Results Statement 23 9 ASTI capital expenditure is reported as part of the UK Electricity Transmission segment.
Regulatory progress In our third year of RIIO-T2, we continue to make good progress in delivering the agreed regulatory outputs despite challenging global supply chain conditions. During the half year, we continued to outperform on network reliability targets, achieving 99.9999% during the period. We have seen good regulatory progress in the UK across a number of areas this year, including: Royal Assent for the Energy Act 2023; Ofgem’s publication of the FSNR decision document; publication of the ENC’s report and recommendations on reducing timelines for delivering onshore and offshore transmission network infrastructure; publication of proposed arrangements for the CSNP and future transmission network planning. For further information and background on each of these developments, please refer to pages 8 – 10 in the Strategic Overview section. UK ELECTRICITY DISTRIBUTION Operations and capital expenditure UK Electricity Distribution continues to perform well in the first year of RIIO-ED2. During the period, capital expenditure reached £608 million, £24 million higher than the prior period principally driven by higher spend in connections, asset replacement and non-operational capex (including IT and vehicles). Our larger capital investment projects remain on track, including the £65 million Hinkley Point connection to link the new nuclear power station and UK Electricity Transmission’s 400 kV circuit between Bridgwater and Seabank (UK Electricity Distribution is providing ‘safe space’ around these assets). The vast majority of works are now complete, and UK Electricity Transmission has taken on the responsibility for works at Seabank. The project is expected to complete in 2024. Over the last three years, we have been targeting specific ‘green’ investment at parts of our network where we anticipate there will be a high density of Low Carbon Technologies to support the country’s path to net zero. Investment in 17 projects will directly benefit Motorway Service Areas (MSA) and equivalent trunk roads in England and Wales by delivering over 100 MW of capacity, enough to support around 700 150 kW Rapid EV Chargers. The seven projects still to complete in this portfolio include a £7 million investment at Tibshelf Services in Derbyshire to allow for network reinforcement and expansion of EV chargers expected to complete before the end of calendar year 2023. Customer connections During the period we connected 51 renewable customers to the network, reaching a total of 323 MW. At domestic level, we also connected 750 energy storage technologies; 7,700 EV chargers; 3,500 heat pumps; and 15,400 solar PV installations across the period. UK Electricity Distribution has taken further action on connections reform. In September, we announced plans to release 10 GW of grid capacity for the connection of renewable generation assets to our network. For further background on the work we have been involved in to reform the connections process, please refer to pages 9 – 10 of the Strategic Overview section. Regulatory Progress On 1 April, UK Electricity Distribution began the first year of new price controls under RIIO-ED2, running for five years until 31 March 2028. As we announced at our UK Electricity Distribution Investor Event in July, we are targeting outperformance of 100 to 125 bps across the price control period. This will largely be achieved through incentives delivery and totex efficiency, underpinned by synergies from the acquisition. To date, we have delivered £18 million of our £100 million synergy target that we announced in July 2023. In August, the ENA named UK Electricity Distribution as the largest flexibility provider of all UK DNOs, having procured 846 MW of flexibility volume. This capacity mainly relates to Demand, EV and solar contracts across a range of flexibility products, including managing peak load demand on the network and pre-emptively reducing network load when necessary, and supporting the network in the event of specific faults such as during maintenance work. National Grid 2023/24 Half Year Results Statement 24

UK ELECTRICITY SYSTEM OPERATOR (ESO) The ESO has performed well during the first half of the year. Capital expenditure reached £75 million in the first half, £33 million higher than prior period, driven primarily by higher IT spend. Progress on network connection reform During the half year, we have continued to work with stakeholders to improve and reform the connections process to the transmission network. We have been working on two major aspects, the shorter term Five Point Plan, and a longer full connection reform process. The transmission connection queue now stands at over 400 GW for Great Britain, which represents a significant over subscription of what is required to connect to meet the scenarios in the ESO Future Energy Scenario publication. For further background on the work we have been involved in to reform the connections process, please refer to pages 9 – 10 of the Strategic Overview section. Winter outlook In September, the ESO published the electricity Winter Outlook for the upcoming winter in Great Britain. Despite the ongoing conflicts in Ukraine and the Middle East, the broad European energy market has improved since last year. The market has bolstered European gas storage and supplies, and the French nuclear fleet capacity is back to pre-pandemic levels. The ESO has built on the experience of the 2022/23 winter and continued to build resilience and minimise the potential impact of risks and uncertainties in the energy markets. As such, the System Operator’s Base Case scenario is that there will be adequate margins (4.4 GW/7.4%) through the forthcoming winter to ensure Great Britain remains within the reliability standard. For more information on the Winter Outlook, please refer to page 10 of the Strategic Overview section. Progress on ESO separation The Energy Act 2023, which received Royal Assent in October, includes legislation to enable the separation of the ESO from National Grid and the formation of an ISOP. The ISOP will have a critical role in delivering strategic, whole system energy planning and oversight as we continue to invest in and transform the UK’s energy infrastructure, and we expect the ISOP to be established as a Public Corporation in 2024 with responsibilities across both the electricity and gas systems. National Grid 2023/24 Half Year Results Statement 25
NEW ENGLAND Operations and capital expenditure We achieved good operational performance across New England during the half year. Capital expenditure remains on track with £789 million deployed during the half year, (1%) lower at actual exchange rates (2% higher at constant currency) than the prior period. This was principally driven by capital expenditure which occurred in NECO last year, more than offset by increased electric distribution expenditure through higher customer connection requests and Grid Modernization. In addition, electric transmission spend was higher compared to the prior period driven by asset condition work across our New England Power (NEP) assets. Our LPP replacement programme also continues on track with 61 miles of gas pipeline replaced between April 2023 and September 2023. Storm activity National Grid was pleased to receive two Edison Electric Institute Awards in June for outstanding storm response for the two most severe winter storms in New England last year (on 23 December 2022, and 13 March 2023). During the first half of this year, our Emergency Response Organization was activated on six occasions in response to storms, including Hurricane Lee, a large system that impacted parts of New England and Canada. As a comparison, during the same period in 2022/23 the Emergency Response Organization was activated on four occasions. Emergency Response performance was strong with outages restored for five events in less than 24 hours, and reconnections following the 8 September storm (which affected over 125,000 customers) were completed in less than 72 hours. Regulatory progress On 1 September, we filed our Electric Sector Modernization Plan (ESMP) in Massachusetts. The plan outlines the investment required in our electric distribution network over the next five years and beyond to help the state meet its clean energy goals under the 2050 Clean Energy and Climate Plan (CECP). Under the plan, we have proposed to invest up to $2 billion over the next five years. For further background on the ESMP filing, please refer to page 11 of the Strategic Overview section. The proposed investment under the ESMP is not currently part of any rate order for our service territory. We remain on track to file for new rates for our Massachusetts Electric business in mid-November 2023, and we will propose a mechanism for recovery of the ESMP investment as part of that filing. In October, the Twin States Clean Energy Link was selected by the US Department of Energy (DOE) as one of three projects in the US to enter capacity contract negotiations through the DOE’s Transmission Facilitation Program. Twin States is a bidirectional transmission project being proposed by National Grid and Citizens Energy Corporation. If built, the line will deliver 1,200 MW of hydro-sourced generation from Canada to New England when it is needed. For further background on the project, please refer to page 11 of the Strategic Overview section. Finally, in October, we were awarded $50 million through the Federal Infrastructure Investment and Jobs Act for our ‘Future Grid’ proposal which will deploy digital technologies in our New York and Massachusetts electric distribution networks to improve system reliability and resilience. Customers and communities During the half year we have continued to build upon our customer and community outreach programme across our Massachusetts service territory. In June, we launched our four Clean Energy Academy summer pilots, building on the successful launch of our spring pilots in March 2023. This Strategic Workforce Development Initiative is designed to educate and inspire interest in STEM, energy and utility industries. The academies have provided participants from historically marginalised and underrepresented groups with career experience, development and employment opportunities. Our Clean Energy Career Academy offered over 70 college engineering students the opportunity to learn more about clean energy, be mentored, visit our facilities and network with National Grid engineers and executives. In addition, our Clean Energy STEM and Tech Academies offered 270 middle and high school students aged 14 to 18 career exploration pathways in the energy industry. Our Energy Infrastructure Academy, for work-ready-adults, has already resulted in 22 individuals securing a job with National Grid and its vendor partners. National Grid 2023/24 Half Year Results Statement 26
In September we held our ‘Week of Service’ across Massachusetts, which involved 250 National Grid employees volunteering in support of community organisations across the state. Events included promoting environmental protection through beach clean-ups in Dorchester; supporting veterans and their families in Worcester; preparing meals for home-bound people in Jamaica Plain; and packing critical winter clothing items for children throughout Massachusetts who need them most in wintertime. The Week of Service was part of National Grid’s ‘Grid for Good’ programme, a company-wide initiative that supports communities we serve through volunteering, charitable contributions to organisations focused on workforce development and STEM education, and environmental sustainability. This year, the Company has a goal to engage colleagues in more than 14,500 hours of service across Massachusetts. The Massachusetts Advanced Meter Infrastructure (AMI) programme successfully kicked off in September 2023 with stakeholder engagement across business teams. Our improved self-service and digital channels continue to improve customer experience and have reduced the number of calls by over 2 million. Customers using digital channels to report and monitor electric outage communications reached a new storm high of 97%. NEW YORK Operations and capital expenditure Our New York business delivered good operational performance during the half year. Capital expenditure reached £1,257 million during the half year, an increase of £15 million at actual exchange rates (£62 million at constant currency) compared to the prior period. This was primarily driven by higher spend on our new transmission projects to assist large scale renewable connections, such as our Smart Path Connect project; higher electric network control system spend; higher mandated work on our gas distribution networks; partly offset by higher ‘right of use’ lease additions in the prior period. Excluding these lease additions in the prior year, capital expenditure increased by £153 million at actual exchange rates (£193 million at constant currency). Of our large-scale electric transmission projects: ■ Smart Path Connect remains on track for energisation in December 2025. The $550 million project includes the rebuild and upgrade of approximately 55 miles of our Adirondack-Porter 230 kV transmission circuits to 345 kV in Northern New York. ■ Construction has begun on the first stage of our substation upgrade as part of the $800 million CLCPA Phase 1 funding for transmission upgrades. This also includes projects such as Inghams-Rotterdam and Churchtown- Pleasant Valley circuit rebuilds (129 miles) to support 330 MW of incremental headroom capacity for renewable generation. ■ Engineering contracts were awarded in October for transmission projects as part of the $2.1 billion CLCPA Phase 2 funding for transmission networks and modernising the electric network. Our LPP replacement programme continued on track with 148 miles of pipeline replaced between the start of April and the end of September. During the half year, we also officially began operations at our Newtown Creek renewable gas recovery system that recovers biogas from the Newtown Creek Wastewater Treatment Plant in Brooklyn. Storm activity During the half year, New York State has prepared 32 times for storms and severe weather, including five major storm events. To date, the storm season has delivered an equal to slightly increased amount of activity compared to previous years. However, New York has not seen a storm with significant intensity in the current financial year. Where our service territories have been affected by storm activity, we have restored electricity to 95% of disconnected customers within 9 to 12 hours. National Grid 2023/24 Half Year Results Statement 27
Regulatory progress On 1 September, PSC Staff responded to our rate filing that we made for our downstate gas business, KEDNY- KEDLI, in April. National Grid responded to the PSC Staff position on 22 September, and we plan to move forward in settlement negotiations, aiming to reach a Joint Proposal with stakeholders in the first quarter of calendar year 2024. For further information on our KEDNY-KEDLI filing, and the PSC Staff response, please refer to page 11 of the Strategic Overview section. We remain on track to file for new rates at our Niagara Mohawk (NIMO) electric and gas business (upstate New York) in summer 2024. Finally, in October 2023 we were awarded $50 million through the Federal Infrastructure Investment and Jobs Act for our ‘Future Grid’ proposal which will deploy digital technologies in our New York and Massachusetts electric distribution networks to improve system reliability and resilience. Customers and communities Our ongoing commitment to customers and communities has continued during the half year. To celebrate the third year of our Project C initiative, we expanded the Company’s annual day of service to a week of service. This included more than 2,000 company employee volunteers engaging in 200 events taking place in communities across New York. This year’s theme, ‘Live together. Grow together.’, highlights the importance of creating meaningful change in the communities we serve. As part of the week of service our employees also pledged to complete Acts of Kindness, including collecting and donating books, food and clothing to a local charity, and donating blood to a blood bank. Across the whole Project C initiative, New York employees also contributed over 15,000 hours of volunteering in local communities during the half year. NATIONAL GRID VENTURES (NGV) Capital investment, including joint ventures, reached £326 million in the half year, a decrease of £213 million at actual exchange rates (£205 million at constant currency) on the prior period. The decrease was primarily through lower spend on the Sellindge (IFA1) converter station rebuild, Grain LNG expansion work and Viking Link as these projects near completion. Interconnectors North Sea Link (NSL) delivered strong reliability and operated at over 99% availability during the first half of the year. IFA1 operated at 80% availability during the half year following outages relating to the newly commissioned bipole which was reinstated following the Sellindge converter station rebuild. In July, the final length of cable was laid on the Viking Link and was successfully tested in August, marking the end of the cable installation process. We remain on track to commission the world’s longest interconnector, stretching 760 kilometres, by the end of calendar year 2023. On our other interconnectors, IFA2 (France) operated at 97% availability during the half year; Nemo Link (Belgium) at 97% availability; and BritNed (Netherlands) at 96%. BritNed has historically been one of the best performing interconnectors in the world in terms of safety with over 4,500 days without a Lost Time Injury (LTI). Offshore Hybrid Asset (OHA) projects In 2022, Ofgem opened an OHA pilot seeking to work with selected developer(s) on establishing an investible OHA regime. OHAs are the next phase of interconnection, not only linking two countries but also connecting with offshore wind generation. The two projects in the Ofgem OHA pilot are Lion Link and Nautilus, both NGV projects, which provides us an opportunity to shape the OHA regime and prepare it for further investment. Ofgem further consulted on the regulatory regime for OHAs in June and NGV responded to the consultation. Ofgem has also been assessing Lion Link and Nautilus, and the regulator also expects to consult in December 2023 on their Initial Project Assessment (IPA). A final decision on regulatory parameters and IPA is expected in March 2024. National Grid 2023/24 Half Year Results Statement 28
Grain LNG Grain LNG continues to perform well and in line with expectations. This half year we launched the ‘Cap29’ auction process for expiring capacity at Grain from 2029. The auction is expected to complete in December. The expansion programme to deliver additional LNG storage on site (Capacity 25) continues, with the delivery of major structural elements of the project expected by the end of calendar year 2023. When complete, the expansion will increase total site storage to 1,200,000 cubic metres and total regasification capacity to 800 GWh/day, equivalent to one-third of UK gas demand. The project remains on track to be ready for commercial operations in summer 2025. Providence LNG In May, we commissioned an LNG facility at Fields Point (Providence), Rhode Island, at a previously existing LNG storage site. The facility has existing natural gas supply infrastructure that can be used for liquefaction, requiring no new gas pipelines. It serves three commercial customers for storage and vaporisation services: Boston Gas and Rhode Island Energy on long-term contracts, and Con Edison on a rolling short-term contract. For liquefaction services, the asset has two customers: Boston Gas and Rhode Island Energy. Long Island (LI) Generation In the half year, Long Island Generation produced 2,694 GWh of energy and remains above target in terms of its availability. Emissions for the first half of 2023/24 are 8% lower than the first half of 2022/23 and remain on track to deliver the 2023/24 target. US Renewables On 24 October, the New York State Energy Research and Development Authority (NYSERDA) announced three successful projects that will receive Offshore Renewable Energy Certificates (ORECs) as part of New York’s third large-scale offshore wind solicitation. COSW, our JV with RWE, was selected as one of the successful projects with a provisional offtake award of 1.3 GW. For further background on the NYSERDA announcement, please refer to page 12 in the Strategic Overview section. In August 2023, COSW also submitted an offtake bid for up to 1.3 GW in response to the New Jersey Board of Public Utilities (BPU) solicitation and we await selection decisions in the first or second quarter of calendar year 2024. In October, we announced the start of operations at our 274 MW Yellowbud solar project in Ohio. The project, located in the Pennsylvania-Jersey-Maryland (PJM) market, has a Power Purchase Agreement (PPA) for its offtake with Amazon. This takes the total operating capacity of National Grid Renewables to 1,308 MW with a further 801 MW currently under construction. NGV Transmission Projects National Grid Ventures has had a successful first half of the year through New York Transco, a partnership of New York’s major utilities, including NGV. In June 2023, New York Transco’s Propel NY Energy transmission project was selected by the New York Independent System Operator (NYISO) to deliver increased transmission capacity between the mainland and Long Island. The project is in partnership with the New York Power Authority. This follows the bid New York Transco submitted in October 2021 as part of the NYISO’s Long Island Offshore Wind Export Public Policy Transmission Need solicitation. Total investment for the project is $2.8 billion, of which NGV’s share is around $340 million. Also in June 2023, our New York Energy Solution transmission line upgrade project was fully energised. This project was selected by the NYISO to provide transmission upgrades to New York’s power system, while enhancing reliability and facilitating upstate clean energy resources to downstate demand centres. Total investment for the project is $670 million, of which NGV’s share is around $100 million. OTHER ACTIVITIES Capital investment in Other activities was £13 million during the half year, £33 million lower than the prior period, principally driven by fewer National Grid Partners (NGP) investments in the first half. National Grid 2023/24 Half Year Results Statement 29
APPENDIX Unless otherwise stated, all financial commentaries in this results statement are given on an underlying basis at actual exchange rates for continuing operations. Underlying represents statutory results excluding exceptional items, remeasurements, timing and major storm costs. The underlying basis is further defined on page 63. Alternative Performance Measures derived from IFRS The following are terms or metrics that are reconciled to IFRS measures and are defined on pages 63 to 67: Net revenue Adjusted profit measures Underlying results Constant currency Timing impacts Capital investment; including Capital investment (regulated networks) Net debt – defined in note 11 on page 55. National Grid 2023/24 Half Year Results Statement 30
PROVISIONAL 2023/24 FINANCIAL TIMETABLE Date Event 9 November 2023 2023/24 half-year results 22 November 2023 ADRs go ex-dividend for 2023/24 interim dividend 23 November 2023 Ordinary shares go ex-dividend for 2023/24 interim dividend 24 November 2023 Record date for 2023/24 interim dividend 30 November 2023 Scrip reference price announced for 2023/24 interim dividend 11 December 2023 (5pm London time) Scrip election date for 2023/24 interim dividend 11 January 2024 2023/24 interim dividend paid to qualifying shareholders 23 May 2024 2023/24 Preliminary Results 6 June 2024 Ordinary shares and ADRs go ex-dividend for 2023/24 final dividend 7 June 2024 Record date for 2023/24 final dividend 13 June 2024 Scrip reference price announced for 2023/24 final dividend 24 June 2024 (5pm London time) Scrip election date for 2023/24 final dividend 10 July 2024 2024 AGM 19 July 2024 2023/24 final dividend paid to qualifying shareholders 7 November 2024 2024/25 half-year results National Grid 2023/24 Half Year Results Statement 31
CAUTIONARY STATEMENT This announcement contains certain statements that are neither reported financial results nor other historical information. These statements are forward-looking statements within the meaning of Section 27A of the Securities Act of 1933, as amended, and Section 21E of the Securities Exchange Act of 1934, as amended. These statements include information with respect to National Grid’s (the Company) financial condition, its results of operations and businesses, strategy, plans and objectives. Words such as ‘aims’, ‘anticipates’, ‘expects’, ‘should’, ‘intends’, ‘plans’, ‘believes’, ‘outlook’, ‘seeks’, ‘estimates’, ‘targets’, ‘may’, ‘will’, ‘continue’, ‘project’ and similar expressions, as well as statements in the future tense, identify forward-looking statements. This document also references climate-related targets and climate-related risks which differ from conventional financial risks in that they are complex, novel and tend to involve projection over long-term scenarios which are subject to significant uncertainty and change. These forward-looking statements are not guarantees of National Grid’s future performance and are subject to assumptions, risks and uncertainties that could cause actual future results to differ materially from those expressed in or implied by such forward-looking statements or targets. Many of these assumptions, risks and uncertainties relate to factors that are beyond National Grid’s ability to control, predict or estimate precisely, such as changes in laws or regulations, including announcements from and decisions by governmental bodies or regulators, including those relating to the RIIO-T2 and RIIO-ED2 price controls and proposals for the future of the electricity system operator in the United Kingdom; the timing of construction and delivery by third parties of new generation projects requiring connection; breaches of, or changes in, environmental, climate change and health and safety laws or regulations, including breaches or other incidents arising from the potentially harmful nature of its activities; network failure or interruption (including any that result in safety and/or environmental events), the inability to carry out critical non network operations and damage to infrastructure, due to adverse weather conditions including the impact of major storms as well as the results of climate change, due to counterparties being unable to deliver physical commodities, or due to the failure of or unauthorised access to or deliberate breaches of National Grid’s IT systems and supporting technology; failure to adequately forecast and respond to disruptions in energy supply; performance against regulatory targets and standards and against National Grid’s peers with the aim of delivering stakeholder expectations regarding costs and efficiency savings, as well as against targets and standards designed to deliver net zero; and customers and counterparties (including financial institutions) failing to perform their obligations to the Company. Other factors that could cause actual results to differ materially from those described in this announcement include fluctuations in exchange rates, interest rates and commodity price indices; restrictions and conditions (including filing requirements) in National Grid’s borrowing and debt arrangements, funding costs and access to financing; regulatory requirements for the Company to maintain financial resources in certain parts of its business and restrictions on some subsidiaries’ transactions such as paying dividends, lending or levying charges; the delayed timing of recoveries and payments in National Grid’s regulated businesses, and whether aspects of its activities are contestable; the funding requirements and performance of National Grid’s pension schemes and other post- retirement benefit schemes; the failure to attract, develop and retain employees with the necessary competencies, including leadership and business capabilities, and any significant disputes arising with National Grid’s employees or the breach of laws or regulations by its employees; the failure to respond to market developments, including competition for onshore transmission; the threats and opportunities presented by emerging technology; the failure by the Company to respond to, or meet its own commitments as a leader in relation to, climate change development activities relating to energy transition, including the integration of distributed energy resources; and the need to grow the Company’s business to deliver its strategy, as well as incorrect or unforeseen assumptions or conclusions (including unanticipated costs and liabilities) relating to business development activity, including the integration of its UK Electricity Distribution business, the sale of its UK Gas Transmission business, and the separation and transfer of the ESO to the public sector. For further details regarding these and other assumptions, risks and uncertainties that may impact National Grid, please read the Strategic Report section and the ‘Risk factors’ on pages 225 to 228 of National Grid’s most recent Annual Report and Accounts, as updated by the principal risks and uncertainties statement on page 60 of this announcement. In addition, new factors emerge from time to time and National Grid cannot assess the potential impact of any such factor on its activities or the extent to which any factor, or combination of factors, may cause actual future results to differ materially from those contained in any forward-looking statement. Except as may be required by law or regulation, the Company undertakes no obligation to update any of its forward-looking statements, which speak only as of the date of this announcement. National Grid 2023/24 Half Year Results Statement 32
| | | | | |
| National Grid | 2023/24 Half Year Results Statement |
UNAUDITED CONDENSED CONSOLIDATED INTERIM FINANCIAL STATEMENTS
| | | | | | | | | | | |
Consolidated income statement | | | |
| for the six months ended 30 September | | | |
| | | |
2023 | Notes | | Total £m |
| Continuing operations | | | |
| Revenue | 2(a),3 | | 8,489 | |
| Provision for bad and doubtful debts | | | (91) | |
| Other operating costs |
| | (6,425) | |
| Other operating income | | | 12 | |
| Operating profit | 2(b) | | 1,985 | |
| Finance income | 5 | | 115 | |
| Finance costs | 5 | | (800) | |
| Share of post-tax results of joint ventures and associates | 2(b) | | 71 | |
| Profit before tax | 2(b) | | 1,371 | |
| Tax | 7 | | (307) | |
| Profit after tax from continuing operations |
| | 1,064 | |
| Profit after tax from discontinued operations | 6 | | 65 | |
| Total profit for the period (continuing and discontinued) | | | 1,129 | |
| Attributable to: | | | |
| Equity shareholders of the parent | | | 1,128 | |
| Non-controlling interests | | | 1 | |
| Earnings per share (pence) | | | |
| Basic earnings per share (continuing) | 8 | | 28.8 | |
| Diluted earnings per share (continuing) | 8 | | 28.7 | |
| Basic earnings per share (continuing and discontinued) | 8 | | 30.6 | |
| Diluted earnings per share (continuing and discontinued) | 8 | | 30.5 | |
| | | |
20221 | Notes | | Total £m |
| Continuing operations | | | |
| Revenue | 2(a),3 | | 9,444 | |
| Provision for bad and doubtful debts | | | (52) | |
| Other operating costs |
| | (7,697) | |
| Other operating income |
| | 544 | |
| Operating profit | 2(b) | | 2,239 | |
| Finance income | 5 | | 37 | |
| Finance costs | 5 | | (661) | |
| Share of post-tax results of joint ventures and associates | 2(b) | | 51 | |
| Profit before tax | 2(b) | | 1,666 | |
| Tax | 7 | | (447) | |
| Profit after tax from continuing operations |
| | 1,219 | |
| Profit after tax from discontinued operations | 6 | | 37 | |
| Total profit for the period (continuing and discontinued) | | | 1,256 | |
| Attributable to: | | | |
| Equity shareholders of the parent | | | 1,256 | |
| Non-controlling interests | | | — | |
| Earnings per share (pence) | | | |
| Basic earnings per share (continuing) | 8 | | 33.4 | |
| Diluted earnings per share (continuing) | 8 | | 33.2 | |
| Basic earnings per share (continuing and discontinued) | 8 | | 34.4 | |
| Diluted earnings per share (continuing and discontinued) | 8 | | 34.2 | |
1.Comparative amounts have been re-presented to reflect the classification of the Further Acquisition Agreement (the FAA option) as held for sale and within discontinued operations.
| | | | | |
| National Grid | 2023/24 Half Year Results Statement |
| | | | | | | | | | | | | | |
| Consolidated statement of comprehensive income | | | | |
| for the six months ended 30 September | | | | |
| | | | |
| | | 2023 | 2022¹ |
| Notes | | £m | £m |
| Profit after tax from continuing operations | | | 1,064 | | 1,219 | |
| Profit after tax from discontinued operations | | | 65 | | 37 | |
| Other comprehensive income from continuing operations | | | | |
| Items from continuing operations that will never be reclassified to profit or loss: | | | | |
| Remeasurement losses on pension assets and post-retirement benefit obligations | 12 | | (263) | | (631) | |
| Net (losses)/gains in respect of cash flow hedging of capital expenditure | | | (2) | | 14 | |
| Tax on items that will never be reclassified to profit or loss | | | 64 | | 159 | |
| Total items from continuing operations that will never be reclassified to profit or loss | | | (201) | | (458) | |
| Items from continuing operations that may be reclassified subsequently to profit or loss: | | | | |
| Retranslation of net assets offset by net investment hedge | | | 118 | | 2,360 | |
| Exchange differences reclassified to the consolidated income statement on disposal | | | — | | (145) | |
| Net gains in respect of cash flow hedges | | | 201 | | 450 | |
| Net gains/(losses) in respect of cost of hedging | | | 40 | | (64) | |
Net losses on investments in debt instruments measured at fair value through other
comprehensive income | | | (16) | | (47) | |
| Share of other comprehensive income of associates, net of tax | | | — | | 1 | |
| Tax on items that may be reclassified subsequently to profit or loss | | | (59) | | (86) | |
Total items from continuing operations that may be reclassified subsequently
to profit or loss | | | 284 | | 2,469 | |
| Other comprehensive income for the period, net of tax, from continuing operations | | | 83 | | 2,011 | |
| Other comprehensive loss for the period, net of tax, from discontinued operations | 6 | | (9) | | (86) | |
| Other comprehensive income for the period, net of tax | | | 74 | | 1,925 | |
| Total comprehensive income for the period from continuing operations | | | 1,147 | | 3,230 | |
| Total comprehensive income/(loss) for the period from discontinued operations | 6 | | 56 | | (49) | |
| Total comprehensive income for the period | | | 1,203 | | 3,181 | |
| | | | | | | | | | | |
| Attributable to: | | | |
| Equity shareholders of the parent | | | |
| From continuing operations | | 1,146 | | 3,227 | |
| From discontinued operations | | 56 | | (49) | |
| | 1,202 | | 3,178 | |
| | | |
| Non-controlling interests | | 1 | | 3 | |
1.Comparative amounts have been re-presented to reflect the classification of the FAA option within the UK Gas Transmission business disposal group.
| | | | | |
| National Grid | 2023/24 Half Year Results Statement |
| | | | | | | | | | | | | | | | | | | | | | | | | | |
| Consolidated statement of changes in equity |
| for the six months ended 30 September |
| | | | | | | | |
| | Share
capital | Share premium account | Retained earnings | Other equity reserves | Total
share-holders’ equity | Non-controlling interests | Total
equity |
| Notes | £m | £m | £m | £m | £m | £m | £m |
| At 1 April 2023 | | 488 | | 1,302 | | 31,608 | | (3,860) | | 29,538 | | 24 | | 29,562 | |
| Profit for the period | | — | | — | | 1,128 | | — | | 1,128 | | 1 | | 1,129 | |
| Other comprehensive (loss)/income for the period | | — | | — | | (199) | | 273 | | 74 | | — | | 74 | |
| Total comprehensive income for the period | | — | | — | | 929 | | 273 | | 1,202 | | 1 | | 1,203 | |
| Equity dividends | 9 | — | | — | | (1,325) | | — | | (1,325) | | — | | (1,325) | |
| Scrip dividend-related share issue | | 1 | | (1) | | — | | — | | — | | — | | — | |
| Issue of treasury shares | | — | | — | | 20 | | — | | 20 | | — | | 20 | |
| Transactions in own shares | | — | | — | | (1) | | — | | (1) | | — | | (1) | |
| Share-based payments | | — | | — | | 19 | | — | | 19 | | — | | 19 | |
Cash flow hedges transferred to the statement
of financial position, net of tax | | — | | — | | — | | 2 | | 2 | | — | | 2 | |
| At 30 September 2023 | | 489 | | 1,301 | | 31,250 | | (3,585) | | 29,455 | | 25 | | 29,480 | |
| At 1 April 2022 | | 485 | | 1,300 | | 26,611 | | (4,563) | | 23,833 | | 23 | | 23,856 | |
| Profit for the period | | — | | — | | 1,256 | | — | | 1,256 | | — | | 1,256 | |
| Other comprehensive (loss)/income for the period | | — | | — | | (564) | | 2,486 | | 1,922 | | 3 | | 1,925 | |
| Total comprehensive income for the period | | — | | — | | 692 | | 2,486 | | 3,178 | | 3 | | 3,181 | |
| Equity dividends | 9 | — | | — | | (1,119) | | — | | (1,119) | | — | | (1,119) | |
| Scrip dividend-related share issue | | 1 | | (1) | | — | | — | | — | | — | | — | |
| Issue of treasury shares | | — | | — | | 14 | | — | | 14 | | — | | 14 | |
| Transactions in own shares | | — | | 5 | | (3) | | — | | 2 | | — | | 2 | |
| Share-based payments | | — | | — | | 20 | | — | | 20 | | — | | 20 | |
Cash flow hedges transferred to the statement
of financial position, net of tax | | — | | — | | — | | 3 | | 3 | | — | | 3 | |
| At 30 September 2022 | | 486 | | 1,304 | | 26,215 | | (2,074) | | 25,931 | | 26 | | 25,957 | |
| | | | | |
| National Grid | 2023/24 Half Year Results Statement |
| | | | | | | | | | | | | | |
| Consolidated statement of financial position | | | | |
| | | | |
| | | 30 September 2023 | 31 March 2023 |
| Notes | | £m | £m |
| Non-current assets | | | | |
| Goodwill | | | 9,905 | | 9,847 | |
| Other intangible assets | 2(c) | | 3,717 | | 3,604 | |
| Property, plant and equipment | 2(c) | | 67,396 | | 64,433 | |
| Other non-current assets | | | 570 | | 567 | |
| Pension assets | 12 | | 2,352 | | 2,645 | |
| Financial and other investments | | | 871 | | 859 | |
| Investments in joint ventures and associates | | | 1,414 | | 1,300 | |
| Derivative financial assets | 10 | | 325 | | 276 | |
| Total non-current assets | | | 86,550 | | 83,531 | |
| Current assets | | | | |
| Inventories and current intangible assets | | | 931 | | 876 | |
| Trade and other receivables | | | 3,340 | | 3,883 | |
| Current tax assets | | | 18 | | 43 | |
| Financial and other investments | 11 | | 1,680 | | 2,605 | |
| Derivative financial assets | 10 | | 60 | | 153 | |
| Cash and cash equivalents | 11 | | 227 | | 163 | |
| Assets held for sale | 6 | | 1,441 | | 1,443 | |
| Total current assets | | | 7,697 | | 9,166 | |
| Total assets | | | 94,247 | | 92,697 | |
| Current liabilities | | | | |
| Borrowings | 11 | | (2,691) | | (2,955) | |
| Derivative financial liabilities | 10 | | (321) | | (222) | |
| Trade and other payables | | | (4,465) | | (5,068) | |
| Contract liabilities | | | (159) | | (252) | |
| Current tax liabilities | | | (231) | | (236) | |
| | | | |
| Provisions | | | (361) | | (288) | |
| Liabilities held for sale | 6 | | (51) | | (109) | |
| Total current liabilities | | | (8,279) | | (9,130) | |
| Non-current liabilities | | | | |
| Borrowings | 11 | | (42,106) | | (40,030) | |
| Derivative financial liabilities | 10 | | (1,116) | | (1,071) | |
| Other non-current liabilities | | | (1,004) | | (921) | |
| Contract liabilities | | | (1,904) | | (1,754) | |
| Deferred tax liabilities | | | (7,318) | | (7,181) | |
| Pensions and other post-retirement benefit obligations | 12 | | (615) | | (694) | |
| Provisions | | | (2,425) | | (2,354) | |
| Total non-current liabilities | | | (56,488) | | (54,005) | |
| Total liabilities | | | (64,767) | | (63,135) | |
| Net assets | | | 29,480 | | 29,562 | |
| Equity | | | | |
| Share capital | | | 489 | | 488 | |
| Share premium account | | | 1,301 | | 1,302 | |
| Retained earnings | | | 31,250 | | 31,608 | |
| Other equity reserves | | | (3,585) | | (3,860) | |
| Total shareholders’ equity | | | 29,455 | | 29,538 | |
| Non-controlling interests | | | 25 | | 24 | |
| Total equity | | | 29,480 | | 29,562 | |
| | | | | |
| National Grid | 2023/24 Half Year Results Statement |
| | | | | | | | | | | | | | |
| Consolidated cash flow statement | | | | |
| for the six months ended 30 September | | | | |
| | | | |
| | | 2023 | 2022 |
| Notes | | £m | £m |
| Cash flows from operating activities | | | | |
| Operating profit from continuing operations | 2(b) | | 1,985 | | 2,239 | |
| Adjustments for: | | | | |
| Gain on sale of investments | 4 | | — | | (511) | |
| Other fair value movements | | | (19) | | 31 | |
| Depreciation, amortisation and impairment | 2(c) | | 1,021 | | 932 | |
| Share-based payments | | | 19 | | 20 | |
| Changes in working capital | | | (10) | | (378) | |
| Changes in provisions | | | 39 | | 81 | |
| Changes in pensions and other post-retirement benefit obligations | | | 27 | | (54) | |
| Cash generated from operations – continuing operations | | | 3,062 | | 2,360 | |
| Tax paid | | | (201) | | (88) | |
| Net cash flow from operating activities – continuing operations | | | 2,861 | | 2,272 | |
| Net cash flow from operating activities – discontinued operations | | | — | | 256 | |
| Cash flows from investing activities | | | | |
| Purchases of intangible assets | | | (269) | | (224) | |
| Purchases of property, plant and equipment | | | (3,210) | | (3,258) | |
| Disposals of property, plant and equipment | | | 18 | | 63 | |
| Investments in joint ventures and associates | | | (151) | | (376) | |
| Dividends received from joint ventures and associates | | | 121 | | 107 | |
| Disposal of interest in The Narragansett Electric Company¹ | | | — | | 2,968 | |
| Disposal of financial and other investments | | | 65 | | 70 | |
| Acquisition of financial investments | | | (32) | | (62) | |
| Contributions to National Grid Renewables and Emerald Energy Venture LLC | | | (5) | | (8) | |
| Net movements in short-term financial investments | | | 885 | | 599 | |
| Interest received | | | 69 | | 20 | |
| Cash inflows on derivatives | | | 103 | | — | |
| Cash outflows on derivatives | | | (4) | | (377) | |
| Insurance claim from loss of property, plant and equipment |
| | — | | 33 | |
| Net cash flow used in investing activities – continuing operations | | | (2,410) | | (445) | |
| Net cash flow used in investing activities – discontinued operations | | | — | | (181) | |
| Cash flows from financing activities | | | | |
| Proceeds from issue of treasury shares | | | 20 | | 14 | |
| Transactions in own shares | | | (1) | | 2 | |
| Proceeds received from loans | | | 3,033 | | 9,047 | |
| Repayments of loans | | | (839) | | (9,049) | |
| Payments of lease liabilities | | | (61) | | (78) | |
| Net movements in short-term borrowings | | | (444) | | 380 | |
| Cash inflows on derivatives | | | 68 | | 201 | |
| Cash outflows on derivatives | | | (60) | | (230) | |
| Interest paid | | | (779) | | (669) | |
| Dividends paid to shareholders | 9 | | (1,325) | | (1,119) | |
| Net cash flow used in financing activities – continuing operations | | | (388) | | (1,501) | |
| Net cash flow used in financing activities – discontinued operations | | | — | | (334) | |
| Net increase in cash and cash equivalents | | | 63 | | 67 | |
| Reclassification to held for sale | | | — | | (5) | |
| Exchange movements | | | 1 | | 15 | |
| Net cash and cash equivalents at start of period | | | 163 | | 182 | |
| Net cash and cash equivalents at end of period | | | 227 | | 259 | |
1.The balance for the period ended 30 September 2022 consists of cash proceeds received, net of cash disposed.
| | | | | |
| National Grid | 2023/24 Half Year Results Statement |
Notes to the financial statements
1. Basis of preparation and new accounting standards, interpretations and amendments
The half year financial information covers the six month periods ended 30 September 2023 and 30 September 2022 and has been prepared in accordance with IAS 34 ‘Interim Financial Reporting’ as issued by the International Accounting Standards Board (IASB). This condensed set of financial statements comprises the unaudited financial information for the half years ended 30 September 2023 and 2022, together with the audited consolidated statement of financial position as at 31 March 2023. The half year financial information has been prepared applying consistent accounting policies to those applied by the Group for the year ended 31 March 2023. The notes to the unaudited financial information are prepared on a continuing basis unless otherwise stated.
The financial information for the six months ended 30 September 2023 does not constitute statutory accounts as defined in Section 434 of the Companies Act 2006. It should be read in conjunction with the statutory accounts for the year ended 31 March 2023, which were prepared in accordance with International Financial Reporting Standards (IFRS) as issued by the IASB.
The key sources of estimation uncertainty and areas of judgement for the period ended 30 September 2023 are aligned to those disclosed in the Annual Report and Accounts for year ended 31 March 2023, with the following amendments:
•whilst the entirety of the UK Electricity System Operator (ESO) is expected to transfer out of the Group to become part of an independent system operator public body, the Independent System Operator and Planner (ISOP), we have concluded that the held for sale criteria were not met as at 30 September 2023 due to the ESO not being available for sale in its present condition given the formation of the ISOP at the half year remained subject to legislative approval. The Group has identified this as an additional area of judgement in the period. The ESO was subsequently classified as held for sale at the end of October 2023 (see note 17); and
•the value attributable to GasT TopCo Limited in determining the fair value of the options over the Group’s 40% interests (see note 6) is no longer considered to represent a key source of estimation uncertainty.
| | | | | |
| National Grid | 2023/24 Half Year Results Statement |
1. Basis of preparation and new accounting standards, interpretations and amendments (continued)
Going concern
As part of the Directors’ consideration of the appropriateness of adopting the going concern basis of accounting in preparing the half year financial information, the Directors have considered the Group’s principal risks (discussed on page 60) alongside potential downside business cash flow scenarios impacting the Group’s operations. The Directors specifically considered both a base case and a reasonable worst-case scenario for business cash flows. The assessment is prepared on the conservative assumption that the Group has no access to the debt capital markets.
The main additional cash flow impacts identified in the reasonable worst-case scenario are:
•the timing of the sale of assets classified as held for sale;
•adverse impacts of inflation and incremental spend on our capital expenditure programme;
•adverse impact from timing across the Group (i.e. a net under-recovery of allowed revenues or reductions in over-collections) and slower collections of outstanding receivables;
•higher operating and financing costs than expected; including non-delivery of planned efficiencies across the Group; and
•the potential impact of further significant storm costs in the US.
As part of their analysis, the Board also considered the following potential levers at their discretion to improve the position identified by the analysis if the debt capital markets are not accessible:
•the payment of dividends to shareholders;
•significant changes in the phasing of the Group’s capital expenditure programme, with elements of non-essential works and programmes delayed; and
•a number of further reductions in operating expenditure across the Group.
As at 30 September 2023, the Group had undrawn committed facilities available for general corporate purposes amounting to £8.0 billion. Based on these available liquidity resources and having considered the reasonable worst-case scenario, and the further levers at the Board’s discretion, the Group has not identified any material uncertainties relating to events or conditions that, individually or collectively, may cast significant doubt on its ability to continue as a going concern for the foreseeable future, a period not less than 12 months from the date of this report.
In addition to the above, the ability to raise new and extend existing financing was separately included in the analysis, and the Directors noted the c.£3.0 billion of new long-term senior debt issued in the period from 1 April to 30 September 2023 as evidence of the Group’s ability to continue to have access to the debt capital markets if needed.
Based on the above, the Directors have concluded the Group is well placed to manage its financing and other business risks satisfactorily, and have a reasonable expectation that the Group will have adequate resources to continue in operation for at least 12 months from the signing date of these consolidated interim financial statements. They therefore consider it appropriate to adopt the going concern basis of accounting in preparing the half year financial information.
New IFRS accounting standards, interpretations and amendments adopted in the period
There are no new standards, interpretations or amendments, issued by the IASB or by the IFRS Interpretations Committee (IFRIC), that are applicable for the period commencing on 1 April 2023 and have had a material impact on the Group’s results.
New IFRS accounting standards, interpretations and amendments not yet adopted
There are no new accounting standards and amendments to existing standards that have been issued, but are not yet effective that were not disclosed in our Annual Report and Accounts. The Group has not early adopted any standard, amendment or interpretation that has been issued but is not yet effective.
| | | | | |
| National Grid | 2023/24 Half Year Results Statement |
2. Segmental analysis
Revenue and the results of the business are analysed by operating segment, based on the information the Board use internally for the purposes of evaluating the performance of each operating segment and determining resource allocation between them. The Board is National Grid’s chief operating decision maker (as defined by IFRS 8 ‘Operating Segments’) and assesses the profitability of a profit measure that excludes certain income and expenses. We call that measure ‘adjusted profit’. Adjusted profit excludes exceptional items and remeasurements (as defined in note 4) and is used by management to monitor financial performance as it is considered that it aids the comparability of our reported financial performance from year to year. As a matter of course, the Board also considers profitability by segment, excluding the effect of major storms and timing adjustments relating to revenue and certain pass-through costs. However, the measure of profit disclosed in this note is operating profit before exceptional items and remeasurements, as this is the measure that is most consistent with the IFRS results reported within these financial statements.
In the year ended 31 March 2023, the National Grid Ventures (NGV) operating segment met the quantitative thresholds set out in IFRS 8 to be identified as the Group’s sixth separate reportable segment. Accordingly, the Group’s operating segments were modified and the data relating to previous periods has been restated to reflect this change. The results of our six principal businesses are reported to the Board and are accordingly treated as reportable operating segments. All other operating segments are either reported to the Board on an aggregated basis or do not meet the quantitative threshold in order to be considered a separate operating segment. The following table describes the main activities for each reportable operating segment:
| | | | | |
| UK Electricity Transmission | The high-voltage electricity transmission networks in England and Wales. This includes our Accelerated Strategic Transmission Investment projects to connect more clean, low-carbon power to the transmission network in England and Wales. |
| UK Electricity Distribution | The electricity distribution networks of NGED in the East Midlands, West Midlands and South West of England and South Wales. |
| UK Electricity System Operator | The Great Britain system operator. The ESO has not met the criteria to be classified as held for sale as at 30 September 2023. |
| New England | Gas distribution networks, electricity distribution networks and high-voltage electricity transmission networks in New England. |
| New York | Gas distribution networks, electricity distribution networks and high-voltage electricity transmission networks in New York. |
| National Grid Ventures | Comprises all commercial operations in LNG at the Isle of Grain in the UK and Providence, Rhode Island in the US, our electricity generation business in the US, our electricity interconnectors in the UK and our investment in National Grid Renewables Development LLC, our renewables business in the US. NGV operates outside our regulated core business. Our US LNG operations were reclassified from the New England segment following an internal reorganisation in the period. |
The New England and New York segments typically experience seasonal fluctuations in revenue and operating profit due to higher delivery volumes during the second half of the financial year, for example as a result of colder weather over the winter months driving increased heating demand. These seasonal fluctuations have a consequential impact on the working capital balances (primarily trade debtors and accrued income) in the consolidated statement of financial position at 30 September 2023 when compared to 31 March 2023. The majority of UK revenues are derived from the supply of network capacity rather than the supply of commodities and therefore are not subject to the same seasonal fluctuations as in New York and New England.
Other activities that do not form part of any of the segments in the above table primarily relate to our UK property business together with insurance and corporate activities in the UK and US and the Group’s investments in technology and innovation companies through National Grid Partners.
| | | | | |
| National Grid | 2023/24 Half Year Results Statement |
2. Segmental analysis (continued)
(a)Revenue
| | | | | | | | | | | | | | | | | | | | | | | |
| Six months ended 30 September | 2023 | | 2022² |
| Total sales | Sales between segments1 | Sales to third parties | | Total sales | Sales between segments1 | Sales to third
parties |
| £m | £m | £m | | £m | £m | £m |
| Operating segments – continuing operations: | | | | | | | |
| UK Electricity Transmission | 1,356 | | (19) | | 1,337 | | | 969 | | (14) | | 955 | |
| UK Electricity Distribution | 850 | | (2) | | 848 | | | 1,005 | | (8) | | 997 | |
| UK Electricity System Operator | 1,734 | | (17) | | 1,717 | | | 2,060 | | (15) | | 2,045 | |
| New England | 1,441 | | — | | 1,441 | | | 1,760 | | — | | 1,760 | |
| New York | 2,365 | | — | | 2,365 | | | 2,758 | | — | | 2,758 | |
| National Grid Ventures | 666 | | (27) | | 639 | | | 685 | | (9) | | 676 | |
| Other | 142 | | — | | 142 | | | 253 | | — | | 253 | |
| Total revenue from continuing operations | 8,554 | | (65) | | 8,489 | | | 9,490 | | (46) | | 9,444 | |
| | | | | | | |
| Geographical areas: | | | | | | | |
| UK | | | 4,309 | | | | | 4,589 | |
| US | | | 4,180 | | | | | 4,855 | |
| Total revenue from continuing operations | | | 8,489 | | | | | 9,444 | |
1.Sales between operating segments are priced having regard to the regulatory and legal requirements to which the businesses are subject. The analysis of revenue by geographical area is on the basis of destination. There are no material sales between the UK and US geographical areas.
2.Comparative amounts have been re-presented to reflect NGV as a separate operating segment.
(b)Operating profit/(loss)
| | | | | | | | | | | | | | | | | | | | | | | | | | |
| Before exceptional items and remeasurements | | Exceptional items and remeasurements (see note 4) | | After exceptional items and remeasurements |
| Six months ended 30 September | 2023 | 2022¹ | | 2023 | 2022¹ | | 2023 | 2022¹ |
| £m | £m | | £m | £m | | £m | £m |
| Operating segments – continuing operations: | | | | | | | | |
| UK Electricity Transmission | 839 | | 499 | | (1) | | (6) | | | 838 | | 493 | |
| UK Electricity Distribution | 476 | | 531 | | | (4) | | (9) | | | 472 | | 522 | |
| UK Electricity System Operator | 443 | | 147 | | | — | | (1) | | | 443 | | 146 | |
| New England | (32) | | 193 | | | (15) | | 527 | | | (47) | | 720 | |
| New York | (30) | | (18) | | | 38 | | (8) | | | 8 | | (26) | |
| National Grid Ventures | 219 | | 259 | | | 91 | | 49 | | | 310 | | 308 | |
| Other | (13) | | 145 | | | (26) | | (69) | | | (39) | | 76 | |
| Total operating profit from continuing operations | 1,902 | | 1,756 | | | 83 | | 483 | | | 1,985 | | 2,239 | |
| | | | | | | | |
| Geographical areas: | | | | | | | | |
| UK | 1,956 | | 1,550 | | | 60 | | (32) | | | 2,016 | | 1,518 | |
| US | (54) | | 206 | | | 23 | | 515 | | | (31) | | 721 | |
| Total operating profit from continuing operations | 1,902 | | 1,756 | | | 83 | | 483 | | | 1,985 | | 2,239 | |
1.Comparative amounts have been re-presented to reflect NGV as a separate operating segment.
| | | | | | | | | | | | | | | | | | | | | | | | | | |
| Before exceptional items and remeasurements | | Exceptional items and remeasurements (see note 4) | | After exceptional items and remeasurements |
| Six months ended 30 September | 2023 | 2022¹ | | 2023 | 2022¹ | | 2023 | 2022¹ |
| £m | £m | | £m | £m | | £m | £m |
| Reconciliation to profit before tax: | | | | | | | | |
| Operating profit from continuing operations | 1,902 | | 1,756 | | | 83 | | 483 | | | 1,985 | | 2,239 | |
| Share of post-tax results of joint ventures and associates | 59 | | 70 | | | 12 | | (19) | | | 71 | | 51 | |
| Finance income | 123 | | 69 | | | (8) | | (32) | | | 115 | | 37 | |
| Finance costs | (834) | | (801) | | | 34 | | 140 | | | (800) | | (661) | |
| Total profit before tax from continuing operations | 1,250 | | 1,094 | | | 121 | | 572 | | | 1,371 | | 1,666 | |
1.Comparative amounts have been re-presented to reflect the classification of the FAA option as held for sale and within discontinued operations.
| | | | | |
| National Grid | 2023/24 Half Year Results Statement |
2. Segmental analysis (continued)
(c)Capital expenditure
Capital expenditure represents additions to property, plant and equipment and other intangible assets but excludes additional investments in and loans to joint ventures and associates.
| | | | | | | | | | | | | | | | | | | | | | | | | | |
| Net book value of property, plant and equipment and other intangible assets | | Capital expenditure | | Depreciation, amortisation
and impairment |
| 30 September 2023 | 31 March 2023¹ | | 30 September 2023 | 30 September 2022¹ | | 30 September 2023 | 30 September 2022¹ |
| £m | £m | | £m | £m | | £m | £m |
| Operating segments: | | | | | | | | |
| UK Electricity Transmission | 16,030 | | 15,483 | | | 800 | | 629 | | | (250) | | (235) | |
| UK Electricity Distribution | 13,940 | | 13,462 | | | 608 | | 584 | | | (105) | | (104) | |
| UK Electricity System Operator | 434 | | 411 | | | 75 | | 42 | | | (52) | | (40) | |
| New England | 13,781 | | 13,033 | | | 789 | | 801 | | | (204) | | (184) | |
| New York | 22,937 | | 21,730 | | | 1,257 | | 1,242 | | | (321) | | (292) | |
| National Grid Ventures | 3,956 | | 3,880 | | | 175 | | 410 | | | (84) | | (73) | |
| Other | 35 | | 38 | | | 2 | | 9 | | | (5) | | (4) | |
| Total | 71,113 | | 68,037 | | | 3,706 | | 3,717 | | | (1,021) | | (932) | |
| | | | | | | | |
| Geographical areas: | | | | | | | | |
| UK | 33,475 | | 32,343 | | | 1,649 | | 1,594 | | | (464) | | (432) | |
| US | 37,638 | | 35,694 | | | 2,057 | | 2,123 | | | (557) | | (500) | |
| Total | 71,113 | | 68,037 | | | 3,706 | | 3,717 | | | (1,021) | | (932) | |
| | | | | | | | |
| By asset type: | | | | | | | | |
| Property, plant and equipment | 67,396 | | 64,433 | | | 3,449 | | 3,490 | | | (868) | | (829) | |
| Other intangible assets | 3,717 | | 3,604 | | | 257 | | 227 | | | (153) | | (103) | |
| Total | 71,113 | | 68,037 | | | 3,706 | | 3,717 | | | (1,021) | | (932) | |
1.Comparative amounts have been re-presented to reflect NGV as a separate operating segment and the reclassification of our US LNG operations from New England to NGV following an internal reorganisation in the period.
| | | | | |
| National Grid | 2023/24 Half Year Results Statement |
3. Revenue
Under IFRS 15 ‘Revenue from Contracts with Customers’, revenue is recorded as or when the Group satisfies a performance obligation by transferring a promised good or service to a customer. A good or service is transferred when the customer obtains control of that good or service.
The transfer of control of our distribution or transmission services coincides with the use of our network, as electricity and gas pass through our network and reach our customers. The Group principally satisfies its performance obligations over time and the amount of revenue recorded corresponds to the amounts billed and accrued for volumes of gas and electricity delivered/transferred to/from our customers.
| | | | | | | | | | | | | | | | | | | | | | | | | | |
Revenue for the six months ended 30 September 2023 | UK Electricity Transmission
£m | UK Electricity Distribution
£m | UK Electricity System Operator
£m | New
England
£m | New
York
£m | National Grid Ventures
£m | Other
£m | Total
£m |
| Revenue under IFRS 15 | | | | | | | | |
| Transmission | 1,299 | | — | | 5 | | 43 | | 283 | | 426 | | — | | 2,056 | |
| Distribution | — | | 810 | | — | | 1,329 | | 2,047 | | — | | — | | 4,186 | |
| System Operator | — | | — | | 1,712 | | — | | — | | — | | — | | 1,712 | |
Other1 | 9 | | 36 | | — | | 4 | | 7 | | 75 | | — | | 131 | |
| Total IFRS 15 revenue | 1,308 | | 846 | | 1,717 | | 1,376 | | 2,337 | | 501 | | — | | 8,085 | |
| Other revenue | | | | | | | | |
| Generation | — | | — | | — | | — | | — | | 181 | | — | | 181 | |
Other2 | 29 | | 2 | | — | | 65 | | 28 | | (43) | | 142 | | 223 | |
| Total other revenue | 29 | | 2 | | — | | 65 | | 28 | | 138 | | 142 | | 404 | |
| Total revenue from continuing operations | 1,337 | | 848 | | 1,717 | | 1,441 | | 2,365 | | 639 | | 142 | | 8,489 | |
| | | | | | | | | | | | | | | | | | | | | | | | | | |
Geographic split of revenue for the six months ended 30 September 2023 | UK Electricity Transmission
£m | UK Electricity Distribution
£m | UK Electricity System Operator
£m | New England
£m | New
York
£m | National Grid Ventures
£m | Other
£m | Total
£m |
| Revenue under IFRS 15 | | | | | | | | |
| UK | 1,308 | | 846 | | 1,717 | | — | | — | | 430 | | — | | 4,301 | |
| US | — | | — | | — | | 1,376 | | 2,337 | | 71 | | — | | 3,784 | |
| Total IFRS 15 revenue | 1,308 | | 846 | | 1,717 | | 1,376 | | 2,337 | | 501 | | — | | 8,085 | |
| Other revenue | | | | | | | | |
| UK | 29 | | 2 | | — | | — | | — | | (50) | | 27 | | 8 | |
| US | — | | — | | — | | 65 | | 28 | | 188 | | 115 | | 396 | |
| Total other revenue | 29 | | 2 | | — | | 65 | | 28 | | 138 | | 142 | | 404 | |
| Total revenue from continuing operations | 1,337 | | 848 | | 1,717 | | 1,441 | | 2,365 | | 639 | | 142 | | 8,489 | |
1.The UK Electricity Transmission and UK Electricity Distribution other IFRS 15 revenue principally relates to engineering recharges, which are the recovery of costs incurred for construction work requested by customers, such as the re-routing of existing network assets. Within NGV, the other IFRS 15 revenue principally relates to revenue generated from our NG Renewables business.
2.Other revenue, recognised in accordance with accounting standards other than IFRS 15, includes property sales by our UK commercial property business, rental income, income arising in connection with the Transition Services Agreements in place following the sales of The Narragansett Electric Company (NECO) and the UK Gas Transmission business, and an adjustment to NGV revenue in respect of the interconnector cap and floor and Use of Revenue regimes constructed by Ofgem.
| | | | | |
| National Grid | 2023/24 Half Year Results Statement |
3. Revenue (continued)
| | | | | | | | | | | | | | | | | | | | | | | | | | |
Revenue for the six months ended 30 September 2022 | UK Electricity Transmission
£m | UK Electricity Distribution
£m | UK Electricity System Operator
£m | New England
£m | New York
£m | National Grid Ventures¹ £m | Other¹ £m | Total
£m |
| Revenue under IFRS 15 | | | | | | | | |
| Transmission | 931 | | — | | 77 | | 53 | | 117 | | 306 | | — | | 1,484 | |
| Distribution | — | | 940 | | — | | 1,675 | | 2,617 | | — | | — | | 5,232 | |
| System Operator | — | | — | | 1,968 | | — | | — | | — | | — | | 1,968 | |
Other2 | 16 | | 43 | | — | | 4 | | 6 | | 69 | | — | | 138 | |
| Total IFRS 15 revenue | 947 | | 983 | | 2,045 | | 1,732 | | 2,740 | | 375 | | — | | 8,822 | |
| Other revenue | | | | | | | | |
| Generation | — | | — | | — | | — | | — | | 224 | | — | | 224 | |
Other3 | 8 | | 14 | | — | | 28 | | 18 | | 77 | | 253 | | 398 | |
| Total other revenue | 8 | | 14 | | — | | 28 | | 18 | | 301 | | 253 | | 622 | |
| Total revenue from continuing operations | 955 | | 997 | | 2,045 | | 1,760 | | 2,758 | | 676 | | 253 | | 9,444 | |
| | | | | | | | | | | | | | | | | | | | | | | | | | |
Geographic split of revenue for the six months ended 30 September 2022 | UK Electricity Transmission
£m | UK Electricity Distribution
£m | UK Electricity System Operator
£m | New England
£m | New York
£m | National Grid Ventures¹ £m | Other¹ £m | Total
£m |
| Revenue under IFRS 15 | | | | | | | | |
| UK | 947 | | 983 | | 2,045 | | — | | — | | 310 | | — | | 4,285 | |
| US | — | | — | | — | | 1,732 | | 2,740 | | 65 | | — | | 4,537 | |
| Total IFRS 15 revenue | 947 | | 983 | | 2,045 | | 1,732 | | 2,740 | | 375 | | — | | 8,822 | |
| Other revenue | | | | | | | | |
| UK | 8 | | 14 | | — | | — | | — | | 83 | | 199 | | 304 | |
| US | — | | — | | — | | 28 | | 18 | | 218 | | 54 | | 318 | |
| Total other revenue | 8 | | 14 | | — | | 28 | | 18 | | 301 | | 253 | | 622 | |
| Total revenue from continuing operations | 955 | | 997 | | 2,045 | | 1,760 | | 2,758 | | 676 | | 253 | | 9,444 | |
1.Comparative amounts have been re-presented to reflect NGV as a separate operating segment.
2.The UK Electricity Transmission and UK Electricity Distribution other IFRS 15 revenue principally relates to engineering recharges, which are the recovery of costs incurred for construction work requested by customers, such as the re-routing of existing network assets. Within NGV, the other IFRS 15 revenue principally relates to revenue generated from our NG Renewables business.
3.Other revenue, recognised in accordance with accounting standards other than IFRS 15, includes property sales by our UK commercial property business, rental income and income arising in connection with the Transition Services Agreement with PPL Rhode Island Holdings, LLC following the sale of NECO. In the period ended 30 September 2022 the Group also recognised other income relating to an insurance claim.
| | | | | |
| National Grid | 2023/24 Half Year Results Statement |
4. Exceptional items and remeasurements
To monitor our segmental financial performance, we use an adjusted consolidated profit measure that excludes certain income and expenses. We exclude items from adjusted profit because, if included, these items could distort understanding of our performance in the period and the comparability between periods. With respect to restructuring costs, these represent additional expenses incurred that are not related to normal business and day‑to-day activities. These can take place over multiple reporting periods given the scale of the Group, the nature and complexity of the transformation initiatives and due to the impact of strategic transactions.
Remeasurements comprise unrealised gains or losses recorded in the consolidated income statement arising from changes in the fair value of certain financial assets and liabilities categorised as held at fair value through profit and loss (FVTPL). Once the fair value movements are realised (for example, when the derivative matures), the previously recognised fair value movements are then reversed through remeasurements and recognised within earnings before exceptional items and remeasurements. These assets and liabilities include commodity contracts and derivative financial instruments to the extent that hedge accounting is either not achieved or is not effective. We have also classified the unrealised gains or losses reported in profit and loss on certain additional assets treated as FVTPL within remeasurements. These relate to financial assets (which fail the ‘solely payments of principal and interest test’ under IFRS 9), the money market fund investments used by Group Treasury for cash management purposes and the net foreign exchange gains and losses on borrowing activities. These are offset by foreign exchange losses and gains on financing derivatives measured at fair value. In all cases, these fair values increase or decrease because of changes in foreign exchange, commodity or other financial indices over which we have no control.
| | | | | | | | | | | |
| Six months ended 30 September 2023 | Exceptional items
£m | Remeasurements
£m | Total
£m |
| Included within operating profit from continuing operations | | | |
| Cost efficiency programme | (39) | | — | | (39) | |
| Transaction, separation and integration costs¹ | (11) | | — | | (11) | |
| IFA1 fire insurance proceeds | 92 | | — | | 92 | |
| Net gains on commodity contract derivatives | — | | 41 | | 41 | |
| 42 | | 41 | | 83 | |
| | | |
| | | |
| | | |
| | | |
| | | |
| | | |
| | | |
| | | |
| | | |
| | | |
| | | |
| | | | | | | | | | | |
| Six months ended 30 September 2022² | Exceptional items
£m | Remeasurements
£m | Total
£m |
| Included within operating profit from continuing operations | | | |
| Net gain on disposal of NECO | 511 | | — | | 511 | |
| Cost efficiency programme | (61) | | — | | (61) | |
Transaction, separation and integration costs1 | (65) | | — | | (65) | |
| IFA1 fire insurance proceeds | 33 | | — | | 33 | |
| Net gains on commodity contract derivatives | — | | 65 | | 65 | |
| 418 | | 65 | | 483 | |
| | | |
| | | |
| | | |
| | | |
| | | |
| | | |
| | | |
| | | |
| | | |
| | | |
| | | |
1.Transaction, separation and integration costs represent the aggregate of distinct activities undertaken by the Group in the periods presented.
2.Comparative amounts have been re-presented to reflect the classification of the FAA option as held for sale and within discontinued operations.
Cost efficiency programme: During the period, the Group incurred a further £39 million (2022: £61 million) of costs in relation to the major cost efficiency programme announced in November 2021, that targeted at least £400 million savings per annum across the Group by the end of three years. The costs recognised in the period primarily relate to redundancy provisions, employee costs and professional fees incurred in delivering the programme. Whilst the costs incurred during the period do not meet the quantitative threshold to be classified as exceptional on a standalone basis, when taken in aggregate with the £142 million of costs incurred since the announcement of the programme, the costs qualify for exceptional treatment in line with our exceptional items policy. Estimated costs expected to be incurred over the remainder of the programme to 31 March 2024 remain consistent with those disclosed in the Annual Report and Accounts for year the ended 31 March 2023. The total cash outflow for the period in relation to these costs was £28 million (2022: £38 million).
Transaction, separation and integration costs: During the period, £11 million (2022: £65 million) of transaction and separation costs were incurred in relation to the disposals of NECO and the UK Gas Transmission business (see note 6) and the integration of NGED. The costs incurred primarily relate to legal fees, professional fees, and employee costs. The costs have been classified as exceptional, consistent with similar costs for the year ended 31 March 2023 and past precedent. The total cash outflow for the period in relation to these costs was £9 million (2022: £59 million).
| | | | | |
| National Grid | 2023/24 Half Year Results Statement |
4. Exceptional items and remeasurements (continued)
IFA1 interconnector insurance recovery: In September 2021, a fire at the IFA1 converter station in Sellindge, Kent caused significant damage to infrastructure on-site. In the period, the Group recognised net insurance claims of £92 million (2022: £33 million) which were recognised as exceptional in line with our exceptional items policy and consistent with related claims in the prior year. The total cash inflow in the period in relation to the property damage insurance proceeds was £nil (2022: £33 million).
Net gain on disposal of NECO: During the prior period, the Group recognised a gain of £511 million on the disposal of 100% of the share capital of NECO to PPL Rhode Island Holdings, LLC for cash consideration of £3.1 billion ($3.9 billion). The receipt of cash was recognised within net cash used in investing activities within the consolidated cash flow statement.
Details of remeasurements, tax exceptional items and the tax effect of exceptional items and remeasurements are also provided in this note.
| | | | | | | | | | | |
| Six months ended 30 September 2023 | Exceptional items
£m | Remeasurements
£m | Total
£m |
| Included within operating profit from continuing operations | 42 | | 41 | | 83 | |
| | | |
| | | |
| | | |
| | | |
| | | |
Included within net finance costs (note 5) | | | |
| Net gains on derivative financial instruments | — | | 34 | | 34 | |
| Net losses on financial assets at fair value through profit and loss | — | | (8) | | (8) | |
| — | | 26 | | 26 | |
| Included within share of post-tax results of joint ventures and associates | | | |
| Net gains on financial instruments | — | | 12 | | 12 | |
| — | | 12 | | 12 | |
| | | |
| Total included within profit before tax from continuing operations | 42 | | 79 | | 121 | |
| Tax on exceptional items and remeasurements | 1 | | (21) | | (20) | |
Total exceptional items and remeasurements after tax from
continuing operations | 43 | | 58 | | 101 | |
| | | | | | | | | | | |
| Six months ended 30 September 2022¹ | Exceptional items
£m | Remeasurements
£m | Total
£m |
| Included within operating profit from continuing operations | 418 | | 65 | | 483 | |
| | | |
| | | |
| | | |
| | | |
| | | |
| | | |
Included within net finance costs (note 5) | | | |
| Net gains on derivative financial instruments | — | | 140 | | 140 | |
| Net losses on financial assets at fair value through profit and loss | — | | (32) | | (32) | |
| — | | 108 | | 108 | |
| Included within share of post-tax results of joint ventures and associates | | | |
| Net losses on financial instruments | — | | (19) | | (19) | |
| — | | (19) | | (19) | |
| | | |
| Total included within profit before tax from continuing operations | 418 | | 154 | | 572 | |
| Tax on exceptional items and remeasurements | (221) | | (49) | | (270) | |
Total exceptional items and remeasurements after tax from
continuing operations | 197 | | 105 | | 302 | |
1.Comparative amounts have been re-presented to reflect the classification of the FAA option as held for sale and within discontinued operations.
| | | | | |
| National Grid | 2023/24 Half Year Results Statement |
5. Finance income and costs
| | | | | | | | | | | | | | |
| | | 2023 | 2022¹ |
| Six months ended 30 September | Notes | | £m | £m |
| Finance income | | | | |
| Interest income from financing activities | | | 52 | | 14 | |
| Net interest on pensions and other post-retirement benefit obligations | | | 51 | | 41 | |
| Net losses on financial assets at fair value through profit and loss | | | (8) | | (32) | |
| Other interest income | | | 20 | | 14 | |
| | | 115 | | 37 | |
| Finance costs | | | | |
Interest expense on financial instruments2 | | | (903) | | (878) | |
| Unwinding of discount on provisions | | | (50) | | (42) | |
| Other interest | | | (8) | | 8 | |
Net gains on derivative financial instruments3 | | | 34 | | 140 | |
Less: interest capitalised4 | | | 127 | | 111 | |
| | | (800) | | (661) | |
| | | | |
| Net finance costs | | | (685) | | (624) | |
1.Comparative amounts have been re-presented to reflect the classification of the FAA option as held for sale and within discontinued operations.
2.Finance costs include principal accretion on inflation-linked debt of £149 million (2022: £240 million) and income related to principal accretion on inflation-linked swaps of £18 million (2022: £5 million expense).
3.Includes a net foreign exchange gain on borrowing activities, offset by foreign exchange losses and gains on financing derivatives measured at fair value.
4.Interest on funding attributable to assets in the course of construction in the current period was capitalised at a rate of 4.7% (2022: 4.3%). In the UK, capitalised interest qualifies for a current year tax deduction with tax relief claimed of £21 million (2022: £13 million). In the US, capitalised interest is added to the cost of property, plant and equipment and qualifies for tax depreciation allowances.
| | | | | |
| National Grid | 2023/24 Half Year Results Statement |
6. Assets held for sale and discontinued operations
Assets and businesses are classified as held for sale when their carrying amounts are recovered through sale rather than through continuing use. They only meet the held for sale condition when the assets are ready for immediate sale in their present condition, management is committed to the sale and it is highly probable that the sale will complete within one year. Depreciation ceases on assets and businesses when they are classified as held for sale and the assets and businesses are impaired if their carrying value exceeds their fair value less expected costs to sell.
The results and cash flows of assets or businesses classified as held for sale or sold during the year, that meet the criteria of being a major separate line of business or geographical area of operation, are shown separately from our continuing operations, and presented within discontinued operations in the income statement and cash flow statement.
The following assets and liabilities were classified as held for sale:
| | | | | | | | | | | | | | | | | | | | | | | |
| 30 September 2023 | | 31 March 2023 |
| Total assets
held for sale
£m | Total liabilities held for sale
£m | Net assets held for sale
£m | | Total assets
held for sale
£m | Total liabilities held for sale
£m | Net assets held for sale
£m |
Investment in GasT TopCo Limited | 1,441 | | — | | 1,441 | | | 1,443 | | — | | 1,443 | |
| FAA option | — | | — | | — | | | — | | (109) | | (109) | |
| FAA forward | — | | (7) | | (7) | | | — | | — | | — | |
| RAA option | — | | (44) | | (44) | | | — | | — | | — | |
| Net assets held for sale | 1,441 | | (51) | | 1,390 | | | 1,443 | | (109) | | 1,334 | |
On 31 January 2023, the Group disposed of 100% of the UK Gas Transmission business for cash consideration of £4.0 billion and a 40% interest in a newly incorporated UK limited company, GasT TopCo Limited. The other 60% was purchased by Macquarie Infrastructure and Real Assets (MIRA) and British Columbia Investment Management Corporation (BCI) (together, the ‘Consortium’). The Group also entered into a Further Acquisition Agreement (the FAA option) with the Consortium over its remaining 40% interest. The Group’s interest in GasT TopCo Limited was immediately classified as held for sale with effect from 31 January 2023 together with the FAA option, as detailed in note 10 of the Annual Report and Accounts for the year ended 31 March 2023. The Group has not applied equity accounting in relation to its investment in GasT TopCo Limited.
On 19 July 2023, following the partial exercise of the FAA option by the Consortium, the Group agreed to sell a further 20% out of the remaining 40% interests in GasT TopCo Limited (the FAA forward). Completion is expected in the second half of calendar year 2023, subject to regulatory approval. As part of the transaction, the Group entered into a new option agreement with the Consortium, the Remaining Acquisition Agreement (the RAA option), to replace the FAA option for the potential sale of all or part of the remaining 20% equity interest in GasT TopCo Limited. The RAA option is exercisable, at the Consortium’s option, between 1 May 2024 and 31 July 2024. If the RAA option is partially exercised by the Consortium, the Group will have the right to put the remainder of its interests in GasT TopCo Limited to the Consortium, which can be exercised by the Group between 1 December 2024 and 31 December 2024.
The FAA forward to complete the sale of 20% of GasT TopCo Limited is a Level 3 derivative and some of the assumptions which are used to determine the fair value are specific to the contract and not readily observable in active markets. The most significant unobservable input is the valuation of GasT TopCo Limited’s unlisted equity.
The RAA option is also a Level 3 derivative. Significant unobservable inputs include the valuation and volatility of GasT TopCo Limited’s unlisted equity. These inputs are used as part of a Black-Scholes option pricing model to provide the reported fair values.
The disposal of the Group’s interests in GasT TopCo Limited is considered to be the final stage of the plan to dispose of the UK Transmission business first announced in 2021. As a result, the results of the business prior to the recognition of the associate and any remeasurements pertaining to the financial derivatives noted above are shown separately from the continuing business for all periods presented on the face of the income statement as a discontinued operation. This is also reflected in the statement of comprehensive income, as well as earnings per share (EPS) being shown split between continuing and discontinued operations.
| | | | | |
| National Grid | 2023/24 Half Year Results Statement |
6. Assets held for sale and discontinued operations (continued)
The summary income statements for the periods ended 30 September 2023 and 2022 are as follows:
| | | | | | | | | | | | | | | | |
| | | | | |
| | | | | | | 2023 | 2022¹ |
| | | | | | | £m | £m |
| Discontinued operations | | | | | | | | |
| Revenue | | | | | | | — | | 805 | |
| Other operating costs | | | | | | | — | | (459) | |
| Operating profit | | | | | | | — | | 346 | |
| Finance income | | | | | | | 9 | | 9 | |
| Finance costs² | | | | | | | 61 | | (261) | |
| Profit/(loss) before tax | | | | | | | 70 | | 94 | |
| Tax | | | | | | | (5) | | (57) | |
| Profit/(loss) after tax from discontinued operations | | | | | | | 65 | | 37 | |
1.Comparative amounts have been re-presented to reflect the classification of the FAA option as held for sale and within discontinued operations.
2.Finance costs include the remeasurement of the FAA option, the FAA forward and the RAA option.
The summary statements of comprehensive income are as follows:
| | | | | | | | |
| 2023 | 2022¹ |
| £m | £m |
| Profit after tax from discontinued operations | 65 | | 37 | |
| Other comprehensive (loss)/income from discontinued operations | | |
| Items from discontinued operations that will never be reclassified to profit or loss: | | |
| Remeasurement losses on pension assets and post-retirement benefit obligations | — | | (126) | |
| Tax on items that will never be reclassified to profit or loss | — | | 31 | |
| Total losses from discontinued operations that will never be reclassified to profit or loss | — | | (95) | |
| Items from discontinued operations that may be reclassified subsequently to profit or loss: | | |
| Net gains in respect of cash flow hedges | — | | 8 | |
| Net gains in respect of cost of hedging | — | | 4 | |
Net losses on investments in debt instruments measured at fair value through other
comprehensive income | (12) | | — | |
| Tax on items that may be reclassified subsequently to profit or loss | 3 | | (3) | |
| Total (losses)/gains from discontinued operations that may be reclassified subsequently to profit or loss | (9) | | 9 | |
| Other comprehensive loss for the period, net of tax, from discontinued operations | (9) | | (86) | |
| Total comprehensive income/(loss) for the period from discontinued operations | 56 | | (49) | |
1.Comparative amounts have been re-presented to reflect the classification of the FAA option as held for sale and within discontinued operations.
| | | | | |
| National Grid | 2023/24 Half Year Results Statement |
7. Tax from continuing operations
The tax charge from continuing operations for the six month period ended 30 September 2023 is £307 million (2022: £447 million). It is based on management’s estimate of the weighted average effective tax rate by jurisdiction expected for the full year. The effective tax rate is 22.4% (2022: 26.8%), which includes the impact of our share of post-tax results of joint ventures and associates.
The effective tax rate for the year ended 31 March 2023 was 24.4% including the impact of our share of post-tax results of joint ventures and associates.
The legislation implementing the Organisation for Economic Co-operation and Development’s (OECD) proposals for a global minimum corporation tax rate (‘Pillar 2’) was enacted into UK law on 11 July 2023. The legislation includes an income inclusion rule and a domestic minimum tax, which together are designed to ensure a minimum effective tax rate of 15% in each country in which the Group operates. Similar legislation is being enacted by other governments around the world. The legislation is effective for National Grid from 1 April 2024 and therefore the rules do not impact the Group’s consolidated financial statements for year ended 31 March 2024. We have applied the mandatory exception in the UK to recognising and disclosing information about the deferred tax assets and liabilities related to Pillar 2 income taxes in accordance with the amendments to IAS 12 published by the IASB on 23 May 2023. The Group’s work is ongoing to assess the potential impact in the financial statements for year ended 31 March 2025.
| | | | | |
| National Grid | 2023/24 Half Year Results Statement |
8. Earnings per share
The earnings per share (EPS) calculations are based on profit after tax attributable to equity shareholders of the parent company which excludes non-controlling interests.
(a)Basic earnings per share
| | | | | | | | | | | | | | |
| Earnings | EPS | Earnings | EPS |
| Six months ended 30 September | 2023 | 2023 | 2022¹ | 2022¹ |
| £m | pence | £m | pence |
| | | | |
| | | | |
| Profit after tax from continuing operations attributable to the parent | 1,063 | | 28.8 | | 1,219 | | 33.4 | |
| | | | |
| | | | |
| Profit after tax from discontinued operations attributable to the parent | 65 | | 1.8 | | 37 | | 1 | |
| | | | |
| | | | |
| Total profit after tax attributable to the parent | 1,128 | | 30.6 | | 1,256 | | 34.4 | |
| | | | |
| | 2023 | | 2022 |
| | millions | | millions |
| Weighted average number of shares – basic | | 3,682 | | | 3,651 | |
1.Comparative amounts have been re-presented to reflect the classification of the FAA option as held for sale and within discontinued operations.
(b)Diluted earnings per share
| | | | | | | | | | | | | | |
| Earnings | EPS | Earnings | EPS |
| Six months ended 30 September | 2023 | 2023 | 2022¹ | 2022¹ |
| £m | pence | £m | pence |
| | | | |
| | | | |
| Profit after tax from continuing operations attributable to the parent | 1,063 | | 28.7 | | 1,219 | | 33.2 | |
| | | | |
| | | | |
| Profit after tax from discontinued operations attributable to the parent | 65 | | 1.8 | | 37 | | 1 | |
| | | | |
| | | | |
| Total profit after tax attributable to the parent | 1,128 | | 30.5 | | 1,256 | | 34.2 | |
| | | | |
| | 2023 | | 2022 |
| | millions | | millions |
| Weighted average number of shares – diluted | | 3,700 | | | 3,668 | |
1.Comparative amounts have been re-presented to reflect the classification of the FAA option as held for sale and within discontinued operations.
| | | | | |
| National Grid | 2023/24 Half Year Results Statement |
9. Dividends
| | | | | | | | | | | |
| Pence
per share | Cash
dividend
paid
£m | Scrip
dividend
£m |
| Ordinary dividends | | | |
Final dividend in respect of the year ended 31 March 2023 | 37.60 | | 1,325 | | 56 | |
Interim dividend in respect of the year ended 31 March 2023 | 17.84 | | 488 | | 163 | |
Final dividend in respect of the year ended 31 March 2022 | 33.76 | | 1,119 | | 114 | |
The Directors are proposing an interim dividend of 19.40 pence per share to be paid in respect of the year ending 31 March 2024. This would absorb £716 million of shareholders’ equity.
A final dividend for the year ended 31 March 2023 of 37.60 pence per share was paid in August 2023. The cash dividend paid was £1,325 million with an additional £56 million settled via a scrip issue.
10. Fair value measurement
Assets and liabilities measured at fair value
Included in the statement of financial position are certain financial assets and liabilities which are measured at fair value. The following table categorises these assets and liabilities by the valuation methodology applied in determining their fair value using the fair value hierarchy described on page 197 of the Annual Report and Accounts for the year ended 31 March 2023.
| | | | | | | | | | | | | | | | | | | | | | | | | | | | | |
| 30 September 2023 | | 31 March 2023 |
| Level 1
£m | Level 2
£m | Level 3
£m | Total
£m | | Level 1
£m | Level 2
£m | Level 3
£m | Total
£m |
| Assets | | | | | | | | | |
| Investments held at fair value through profit and loss | 1,007 | | — | | 483 | | 1,490 | | | 1,764 | | — | | 452 | | 2,216 | |
Investments held at fair value through other comprehensive income1 | — | | 388 | | — | | 388 | | | — | | 407 | | — | | 407 | |
| Financing derivatives | — | | 309 | | 20 | | 329 | | | — | | 341 | | 22 | | 363 | |
| Commodity contract derivatives | — | | 54 | | 2 | | 56 | | | — | | 62 | | 4 | | 66 | |
| 1,007 | | 751 | | 505 | | 2,263 | | | 1,764 | | 810 | | 478 | | 3,052 | |
| Liabilities | | | | | | | | | |
| Financing derivatives | — | | (1,219) | | (95) | | (1,314) | | | — | | (997) | | (122) | | (1,119) | |
| Commodity contract derivatives | — | | (78) | | (45) | | (123) | | | — | | (134) | | (40) | | (174) | |
| | | | | | | | | |
Contingent consideration2 | — | | — | | (10) | | (10) | | | — | | — | | (19) | | (19) | |
| — | | (1,297) | | (150) | | (1,447) | | | — | | (1,131) | | (181) | | (1,312) | |
| Total | 1,007 | | (546) | | 355 | | 816 | | | 1,764 | | (321) | | 297 | | 1,740 | |
1.Investments held include instruments which meet the criteria of IFRS 9 or IAS 19.
2.Contingent consideration relates to the acquisition of National Grid Renewables Development LLC.
The estimated fair value of total borrowings, excluding lease liabilities, using market values at 30 September 2023 is £38,354 million (31 March 2023: £38,219 million).
Our level 1 financial investments and liabilities held at fair value are valued using quoted prices from liquid markets and primarily comprise investments in short-term money market funds.
Our level 2 financial investments held at fair value primarily include bonds with a tenor greater than one year and are valued using quoted prices for similar instruments in active markets, or quoted prices for identical or similar instruments in inactive markets. Alternatively, they are valued using models where all significant inputs are based directly or indirectly on observable market data.
| | | | | |
| National Grid | 2023/24 Half Year Results Statement |
10. Fair value measurement (continued)
Our level 2 financing derivatives include cross-currency, interest rate and foreign exchange derivatives. We value these derivatives by discounting all future cash flows by externally sourced market yield curves at the reporting date, taking into account the credit quality of both parties. These derivatives can be priced using liquidly traded interest rate curves and foreign exchange rates, and therefore we classify our vanilla trades as level 2 under the IFRS 13 framework.
Our level 2 commodity derivatives include over-the-counter gas swaps and power swaps as well as forward physical gas deals. We value our contracts based on market data obtained from the New York Mercantile Exchange (NYMEX) and the Intercontinental Exchange (ICE) where forward monthly prices are available. We discount based on externally sourced market yield curves at the reporting date, taking into account the credit quality of both parties and liquidity in the market. Our commodity contracts can be priced using liquidly traded swaps. Therefore we classify our vanilla trades as level 2 under the IFRS 13 framework.
Our level 3 financing derivatives include inflation-linked swaps, where the market is illiquid. In valuing these instruments we use in-house valuation models and obtain external valuations to support each reported fair value.
Our level 3 commodity contract derivatives primarily consist of our forward purchases of electricity and gas that we value using proprietary models. Derivatives are classified as Level 3 where significant inputs into the valuation technique are neither directly nor indirectly observable (including our own data, which are adjusted, if necessary, to reflect the assumptions market participants would use in the circumstances).
Our level 3 investments include equity instruments accounted for at fair value through profit and loss. These equity holdings are part of our corporate venture capital portfolio held by National Grid Partners and comprise a series of relatively small, early-stage non-controlling minority interest unquoted investments where prices or valuation inputs are unobservable. Fifteen equity investments (out of thirty-three) are fair valued based on the latest transaction price (a price within the last 12 months), either being the price we paid for the investments, marked to a latest round of funding and adjusted for our preferential rights or based on an internal model. In addition, we have eighteen investments without a transaction in the last 12 months that underwent an internal valuation process using the Black-Scholes Murton Option Pricing Model (OPM Backsolve). Between 12 and 18 months a blend between OPM Backsolve and other techniques are utilised such as proxy group revenue multiples, discounted cash flow, comparable company analysis and probability weighted expected return approach in order to triangulate a valuation. After 18 months the valuation is based on these alternative methods as the last fundraising price is no longer a reliable basis for valuation.
Our level 3 investments also include our investment in Sunrun Neptune 2016 LLC, which is accounted for at fair value through profit and loss. The investment is fair valued by discounting expected cash flows using a weighted average cost of capital specific to Sunrun Neptune 2016 LLC.
| | | | | |
| National Grid | 2023/24 Half Year Results Statement |
10. Fair value measurement (continued)
The impacts on a post-tax basis of reasonably possible changes in significant assumptions used in valuing assets and liabilities classified within level 3 of the fair value hierarchy are as follows:
| | | | | | | | | | | | | | | | | | | | | | | | | | |
| Financing derivatives | | Commodity contract derivatives | | Other |
| Six months ended 30 September | 2023 | 2022 | | 2023 | 2022 | | 2023 | 2022 |
| £m | £m | | £m | £m | | £m | £m |
| 10% increase in commodity prices | — | | — | | | 15 | | 35 | | | — | | — | |
| 10% decrease in commodity prices | — | | — | | | (15) | | (36) | | | — | | — | |
| +10% market area price change | — | | — | | | 12 | | 7 | | | — | | — | |
| -10% market area price change | — | | — | | | (11) | | (7) | | | — | | — | |
+20 basis point increase in Limited Price Index
(LPI) market curve | (38) | | (51) | | | — | | — | | | — | | — | |
| -20 basis point decrease in LPI market curve | 38 | | 51 | | | — | | — | | | — | | — | |
| +20 basis point increase between Retail Price Index (RPI) and Consumer Price Index (CPI) | 36 | | 17 | | | — | | — | | | — | | — | |
| -20 basis point decrease between RPI and CPI market curves | (33) | | (16) | | | — | | — | | | — | | — | |
| +50 basis points change in discount rate | — | | — | | | — | | — | | | (8) | | (9) | |
| -50 basis points change in discount rate | — | | — | | | — | | — | | | 9 | | 10 | |
| +10% change in venture capital price | — | | — | | | — | | — | | | 30 | | — | |
| -10% change in venture capital price | — | | — | | | — | | — | | | (30) | | — | |
The impacts disclosed above were considered on a contract by contract basis with the most significant unobservable inputs identified. A reasonably possible change in assumptions for other level 3 assets and liabilities would not result in a material change in fair values.
The changes in fair value of our level 3 financial assets and liabilities in the six months to 30 September are presented below:
| | | | | | | | | | | | | | | | | | | | | | | | | | | | | | | | | | | |
| Financing derivatives | | Commodity contract derivatives | | Other1 | | Total |
| 2023 | 2022 | | 2023 | 2022 | | 2023 | 2022 | | 2023 | 2022 |
| £m | £m | | £m | £m | | £m | £m | | £m | £m |
| At 1 April | (100) | | (187) | | | (36) | | 44 | | | 433 | | 376 | | | 297 | | 233 | |
Net gains/(losses) through the consolidated income statement for the period2,3 | 25 | | 76 | | | (4) | | 44 | | | 26 | | 30 | | | 47 | | 150 | |
| Purchases | — | | (133) | | | (10) | | (56) | | | 11 | | 37 | | | 1 | | (152) | |
| Settlements | — | | — | | | 7 | | (4) | | | 3 | | (4) | | | 10 | | (8) | |
At 30 September4 | (75) | | (244) | | | (43) | | 28 | | | 473 | | 439 | | | 355 | | 223 | |
1.Other comprises our investments in Sunrun Neptune 2016 LLC and the investments made by National Grid Partners, which are accounted for at fair value through profit and loss and the contingent consideration arising from the acquisition of National Grid Renewables Development LLC. Net gains and loss are recognised within finance income and costs in the income statement.
2.Gains of £25 million (2022: gains of £93 million) are attributable to derivative financial instruments held at the end of the reporting period and have been recognised in finance costs in the income statement.
3.Losses of £15 million (2022: losses of £23 million) are attributable to the commodity contract derivative financial instruments held at the end of the reporting period and have been recognised in other operating costs in the consolidated income statement.
4.There were no reclassifications in or out of level 3 (2022: none).
The Group also has a number of financial instruments which are not measured at fair value in the balance sheet. The carrying value of current financial assets at amortised cost approximates their fair values, primarily due to short-dated maturities.
| | | | | |
| National Grid | 2023/24 Half Year Results Statement |
11. Net debt
Net debt is comprised as follows:
| | | | | | | | |
| 30 September 2023 | 31 March 2023 |
| £m | £m |
| Cash and cash equivalents | 227 | | 163 | |
| Current financial investments | 1,680 | | 2,605 | |
| Borrowings and bank overdrafts | (44,797) | | (42,985) | |
Financing derivatives1 | (985) | | (756) | |
| Net debt (net of related derivative financial instruments) | (43,875) | | (40,973) | |
1.Includes £4 million liability (31 March 2023: £4 million liability) in relation to the hedging of capital expenditure. The cash flows related to these derivatives are included within investing activities in the consolidated cash flow statement which is in the same manner as the transactions which are the subject of the hedges. The financing derivatives balance included in net debt exclude the commodity derivatives.
The following table splits out the total derivative balances on the face of the consolidated statement of financial position by category:
| | | | | | | | | | | | | | | | | | | | | | | |
| 30 September 2023 | | 31 March 2023 |
| Assets
£m | Liabilities
£m | Total
£m | | Assets
£m | Liabilities
£m | Total
£m |
| Financing derivatives | 329 | | (1,314) | | (985) | | | 363 | | (1,119) | | (756) | |
| Commodity contract derivatives | 56 | | (123) | | (67) | | | 66 | | (174) | | (108) | |
| Total derivative financial instruments | 385 | | (1,437) | | (1,052) | | | 429 | | (1,293) | | (864) | |
| | | | | |
| National Grid | 2023/24 Half Year Results Statement |
12. Pensions and other post-retirement benefit obligations
| | | | | | | | |
| 30 September 2023 | 31 March 2023 |
| £m | £m |
| Present value of funded obligations | (17,502) | | (18,934) | |
| Fair value of plan assets | 19,570 | | 21,246 | |
| 2,068 | | 2,312 | |
| Present value of unfunded obligations | (264) | | (292) | |
| Other post-employment liabilities | (67) | | (69) | |
| Net defined benefit asset | 1,737 | | 1,951 | |
| Presented in consolidated statement of financial position: | | |
| Assets | 2,352 | | 2,645 | |
| Liabilities | (615) | | (694) | |
| 1,737 | | 1,951 | |
| | | | | | | | |
| Key actuarial assumptions | 30 September 2023 | 31 March 2023 |
| Discount rate – UK past service | 5.55 | % | 4.80 | % |
| Discount rate – US | 5.70 | % | 4.85 | % |
| Rate of increase in RPI – UK past service | 3.19 | % | 3.17 | % |
The net pensions and other post-retirement benefit (OPEB) obligations position, as recorded under IAS 19, at 30 September 2023 was an asset of £1,737 million (31 March 2023: £1,951 million asset). The movement of £214 million primarily reflects asset performance being less than the discount rate at the start of the period, partially offset by increases in discount rates resulting in a decrease in liabilities.
Net actuarial losses of £263 million have been reflected within the consolidated statement of comprehensive income. There was a loss of £1,754 million (UK £1,155 million; US £599 million) relating to asset performance which reflects returns on assets, both in the UK and US, being less than the discount rate at the beginning of the year. Changes in actuarial assumptions led to a gain on liabilities of £1,491 million (UK £793 million; US £698 million). This primarily reflected movements in discount rates which resulted from large increases in corporate bond yields.
The pension and OPEB surpluses in both the UK and the US of £1,377 million and £975 million respectively (31 March 2023: £1,672 million and £973 million) continue to be recognised as assets under IFRIC 14 as explained on page 175 of the Annual Report and Accounts for the year ended 31 March 2023.
13. Commitments and contingencies
At 30 September 2023, there were commitments for future energy purchase agreements of £13,824 million (31 March 2023: £19,194 million) and future capital expenditure contracted but not provided for in relation to the acquisition of property, plant and equipment of £3,218 million (31 March 2023: £2,936 million).
We also have contingencies in the form of certain guarantees and letters of credit. These are described in further detail in note 30 to the Annual Report and Accounts for the year ended 31 March 2023.
Litigation and claims
Through the ordinary course of our operations, we are party to various litigation, claims and investigations. We do not expect the ultimate resolution of any proceedings to have a material adverse effect on our results of operations, cash flows or financial position.
| | | | | |
| National Grid | 2023/24 Half Year Results Statement |
14. Exchange rates
The consolidated results are affected by the exchange rates used to translate the results of our US operations and US dollar transactions. The US dollar to pound sterling exchange rates used were:
| | | | | | | | | | | |
| 30 September | 2023 | 2022 | Year ended 31 March 2023 |
| Closing rate applied at period end | 1.22 | 1.12 | 1.23 |
| Average rate applied for the period | 1.25 | 1.21 | 1.22 |
15. Related party transactions
Related party transactions in the six months ended 30 September 2023 were substantially the same in nature to those disclosed in note 31 of the Annual Report and Accounts for the year ended 31 March 2023. There were no other related party transactions in the period that have materially affected the financial position or performance of the Group.
| | | | | |
| National Grid | 2023/24 Half Year Results Statement |
16. Additional disclosures in respect of guaranteed securities
Niagara Mohawk Power Corporation, a wholly owned subsidiary of the Group, has issued preferred shares that are listed on a US national securities exchange and are guaranteed by National Grid plc. This guarantor commits to honour any liabilities should the company issuing the debt have any financial difficulties. In order to provide debt holders with information on the financial stability of the company providing the guarantee, we are required to disclose individual financial information for this company. We have chosen to include this information in the half year financial information.
The following summarised financial information is given in respect of Niagara Mohawk Power Corporation as a result of National Grid plc’s guarantee, dated 29 October 2007, of Niagara Mohawk Power Corporation’s 3.6% and 3.9% issued preferred shares, which amount to $23 million. National Grid plc’s guarantee of Niagara Mohawk Power Corporation’s preferred shares is full and unconditional. There are no restrictions on the payment of dividends by Niagara Mohawk Power Corporation or limitations on National Grid plc’s guarantee of the preferred shares, and there are no factors that may affect payments to holders of the guaranteed securities.
The following summarised financial information for National Grid plc and Niagara Mohawk Power Corporation is presented on a combined basis and is intended to provide investors with meaningful and comparable financial information, and is provided pursuant to the early adoption of Rule 13-01 of Regulation S-X in lieu of the separate financial statements of Niagara Mohawk Power Corporation.
Summarised financial information is presented, on a combined basis, as at 30 September 2023. The combined amounts are presented under IFRS measurement principles. Intercompany transactions between National Grid plc and Niagara Mohawk Power Corporation have been eliminated. Investments in other non-issuer and non-guarantor subsidiaries are included at cost, subject to impairment.
| | | | | |
| National Grid plc and Niagara Mohawk Power Corporation combined
£m |
| Combined statement of financial position | |
| Non-current loans to other subsidiaries | 126 | |
| Non-current assets | 12,033 | |
| Current loans to other subsidiaries | 15,557 | |
| Current assets | 1,526 | |
| Current loans from other subsidiaries | (6,893) | |
| Current liabilities | (1,263) | |
| Non-current loans from other subsidiaries | (2,080) | |
| Non-current liabilities | (13,703) | |
| Net assets¹ | 5,303 | |
| Equity | 5,303 | |
| |
| Combined income statement – continuing operations | |
| Revenue | 1,594 | |
| Operating costs | (1,330) | |
| Operating profit | 264 | |
| Other income from other subsidiaries | — | |
| Other income and costs, including taxation | (51) | |
| Profit after tax | 213 | |
1.Excluded from net assets above are investments in other consolidated subsidiaries with a carrying value of £14,480 million.
| | | | | |
| National Grid | 2023/24 Half Year Results Statement |
17. Post balance sheet events
At the end of October 2023, legislation required to enable the separation of the ESO and formation of the ISOP was passed through Parliament. The ISOP is expected to be established as a Public Corporation in 2024, with responsibilities across both the electricity and gas systems. As a result, the Group took the judgement to classify the associated assets and liabilities of the ESO as held for sale in the consolidated statement of financial position at the end of October 2023 and the ESO will be measured at the lower of its carrying amount or fair value less costs to sell, which will take into consideration the current over-collection of allowed revenues.
Principal risks and uncertainties When preparing the half year financial information the risks as reported in the Annual Report and Accounts for the year ended 31 March 2023 (principal risks on pages 20-24 and inherent risks on pages 225-228) were reviewed to ensure that the disclosures remained appropriate and adequate. Below is a summary of our key risks as at 30 September 2023: People risks ■ Failure to build capability and leadership capacity required to deliver our vision and strategy because of ineffective succession planning and recruitment into leadership roles. Financial risks ■ Failure to fund our business efficiently as a result of lack of access to a wide pool of investors, market volatility, unsatisfactory regulatory outcomes or unsatisfactory financial or operational performance of the business, leading to a lack of access to capital, impacting our ability to achieve our strategic objectives. Strategic risks ■ Failure to identify and/or deliver upon actions necessary to meet our climate change targets and enable the wider energy transition because of poor management of threats and opportunities associated with migrating climate change, leading to a reputational impact of not enabling us to meet our net zero commitments. ■ Failure to influence future energy policies and secure satisfactory regulatory agreements because of lack of insight or unsuccessful negotiations, leading to poor regulatory outcomes, energy policies that negatively impact our operations, impacts on market prices, reduced financial performance, fines/penalties, increased costs to remain compliant and/or reputational damage. ■ Failure to position ourselves appropriately to societal and political expectations because of a failure to proactively monitor the landscape or, to anticipate and respond to changes leading to reputational damage, political intervention, threats to the Group’s licences to operate, and our ability to achieve our objectives. Operational risks ■ Failure to adequately anticipate and manage disruptive forces on our systems because of a cyber-attack, poor recovery of critical systems or malicious external or internal parties, resulting in an inability to operate the network, damage to assets, loss of confidentiality and integrity and/or availability of systems. ■ Catastrophic asset failure or bulk system failure because failure of a critical asset or system, substandard operational performance or inadequate maintenance, over-pressurisation, leak-prone pipe, third-party damage and undetected system anomalies, leading to a significant public and employee safety and/or environmental event. ■ Failure to predict and respond to a significant disruption of energy supply because of climate change, asset failure, storms, attacks, market failure or other emergency events leading to significant customer harm, lasting reputational damage with customers, regulators, and politicians, material financial losses, loss of franchise, and damage to investor confidence. ■ Failure to effectively predict or respond to fluctuations in energy supply and inability to balance supply and customer demand, or appropriately respond to energy supply constraints, due to external, system or human factors leading to adverse impacts on customers and/or the public. ■ Failure to deliver on our major capital project programme within the required timeframes because of: a lack of a clearly defined regulatory and financial frameworks to incentivise investment; complex planning requirements; external impacts on supply chain; or a failure to demonstrate clear long-term economic benefits to communities, leading to increased costs, compromised quality and reputational damage and detrimentally impacting our ability to deliver our clean energy transition strategy. National Grid 2023/24 Half Year Results Statement 60

Statement of Directors’ Responsibilities The half year financial information is the responsibility of, and has been approved by, the Directors. The Directors are responsible for preparing the half year financial information in accordance with the Disclosure Guidance and Transparency Rules (DTR) of the United Kingdom’s Financial Conduct Authority. The Directors confirm that to the best of their knowledge: a) the condensed consolidated interim financial statements have been prepared in accordance with IAS 34 ‘Interim Financial Reporting’ as issued by the International Accounting Standards Board and as adopted by the United Kingdom; b) the half year management report includes a fair review of the information required by DTR 4.2.7R (indication of important events during the first six months and description of principal risks and uncertainties for the remaining six months of the year); and c) the half year management report includes a fair review of the information required by DTR 4.2.8R (disclosure of related parties’ transactions and changes therein). The Directors of National Grid plc are listed in the Annual Report and Accounts for the year ended 31 March 2023, with the exception of the changes in the period which are listed on page 13. By order of the Board …………………….. …………………….. John Pettigrew Andy Agg 8 November 2023 8 November 2023 Chief Executive Chief Financial Officer National Grid 2023/24 Half Year Results Statement 61

National Grid 2023/24 Half Year Results Statement 62 INTENTIONALLY LEFT BLANK
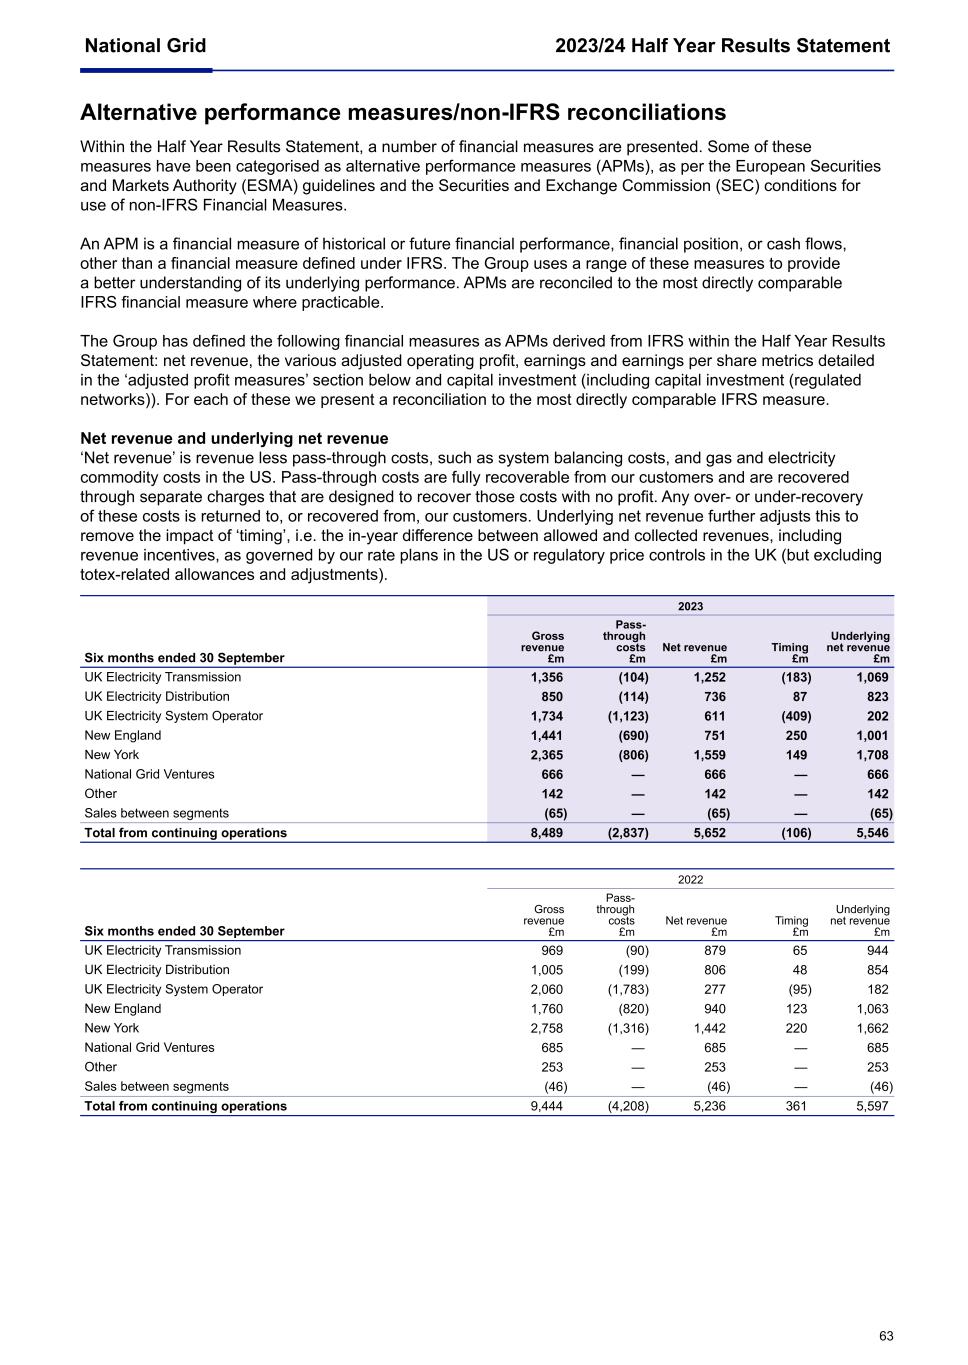
Alternative performance measures/non-IFRS reconciliations Within the Half Year Results Statement, a number of financial measures are presented. Some of these measures have been categorised as alternative performance measures (APMs), as per the European Securities and Markets Authority (ESMA) guidelines and the Securities and Exchange Commission (SEC) conditions for use of non-IFRS Financial Measures. An APM is a financial measure of historical or future financial performance, financial position, or cash flows, other than a financial measure defined under IFRS. The Group uses a range of these measures to provide a better understanding of its underlying performance. APMs are reconciled to the most directly comparable IFRS financial measure where practicable. The Group has defined the following financial measures as APMs derived from IFRS within the Half Year Results Statement: net revenue, the various adjusted operating profit, earnings and earnings per share metrics detailed in the ‘adjusted profit measures’ section below and capital investment (including capital investment (regulated networks)). For each of these we present a reconciliation to the most directly comparable IFRS measure. Net revenue and underlying net revenue ‘Net revenue’ is revenue less pass-through costs, such as system balancing costs, and gas and electricity commodity costs in the US. Pass-through costs are fully recoverable from our customers and are recovered through separate charges that are designed to recover those costs with no profit. Any over- or under-recovery of these costs is returned to, or recovered from, our customers. Underlying net revenue further adjusts this to remove the impact of ‘timing’, i.e. the in-year difference between allowed and collected revenues, including revenue incentives, as governed by our rate plans in the US or regulatory price controls in the UK (but excluding totex-related allowances and adjustments). 2023 Six months ended 30 September Gross revenue £m Pass- through costs £m Net revenue £m Timing £m Underlying net revenue £m UK Electricity Transmission 1,356 (104) 1,252 (183) 1,069 UK Electricity Distribution 850 (114) 736 87 823 UK Electricity System Operator 1,734 (1,123) 611 (409) 202 New England 1,441 (690) 751 250 1,001 New York 2,365 (806) 1,559 149 1,708 National Grid Ventures 666 — 666 — 666 Other 142 — 142 — 142 Sales between segments (65) — (65) — (65) Total from continuing operations 8,489 (2,837) 5,652 (106) 5,546 2022 Six months ended 30 September Gross revenue £m Pass- through costs £m Net revenue £m Timing £m Underlying net revenue £m UK Electricity Transmission 969 (90) 879 65 944 UK Electricity Distribution 1,005 (199) 806 48 854 UK Electricity System Operator 2,060 (1,783) 277 (95) 182 New England 1,760 (820) 940 123 1,063 New York 2,758 (1,316) 1,442 220 1,662 National Grid Ventures 685 — 685 — 685 Other 253 — 253 — 253 Sales between segments (46) — (46) — (46) Total from continuing operations 9,444 (4,208) 5,236 361 5,597 National Grid 2023/24 Half Year Results Statement 63
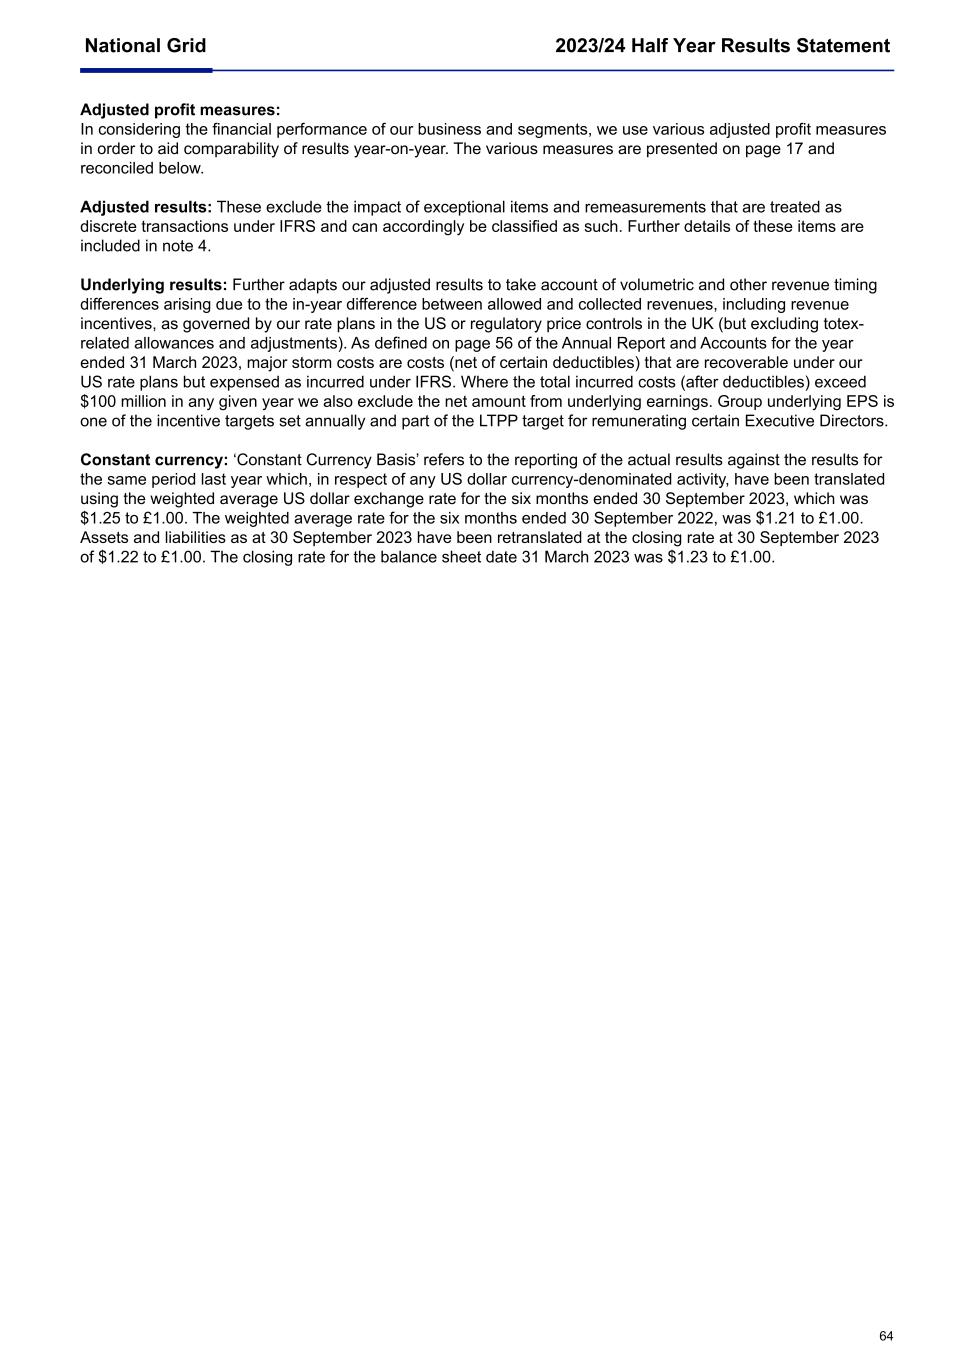
Adjusted profit measures: In considering the financial performance of our business and segments, we use various adjusted profit measures in order to aid comparability of results year-on-year. The various measures are presented on page 17 and reconciled below. Adjusted results: These exclude the impact of exceptional items and remeasurements that are treated as discrete transactions under IFRS and can accordingly be classified as such. Further details of these items are included in note 4. Underlying results: Further adapts our adjusted results to take account of volumetric and other revenue timing differences arising due to the in-year difference between allowed and collected revenues, including revenue incentives, as governed by our rate plans in the US or regulatory price controls in the UK (but excluding totex- related allowances and adjustments). As defined on page 56 of the Annual Report and Accounts for the year ended 31 March 2023, major storm costs are costs (net of certain deductibles) that are recoverable under our US rate plans but expensed as incurred under IFRS. Where the total incurred costs (after deductibles) exceed $100 million in any given year we also exclude the net amount from underlying earnings. Group underlying EPS is one of the incentive targets set annually and part of the LTPP target for remunerating certain Executive Directors. Constant currency: ‘Constant Currency Basis’ refers to the reporting of the actual results against the results for the same period last year which, in respect of any US dollar currency-denominated activity, have been translated using the weighted average US dollar exchange rate for the six months ended 30 September 2023, which was $1.25 to £1.00. The weighted average rate for the six months ended 30 September 2022, was $1.21 to £1.00. Assets and liabilities as at 30 September 2023 have been retranslated at the closing rate at 30 September 2023 of $1.22 to £1.00. The closing rate for the balance sheet date 31 March 2023 was $1.23 to £1.00. National Grid 2023/24 Half Year Results Statement 64
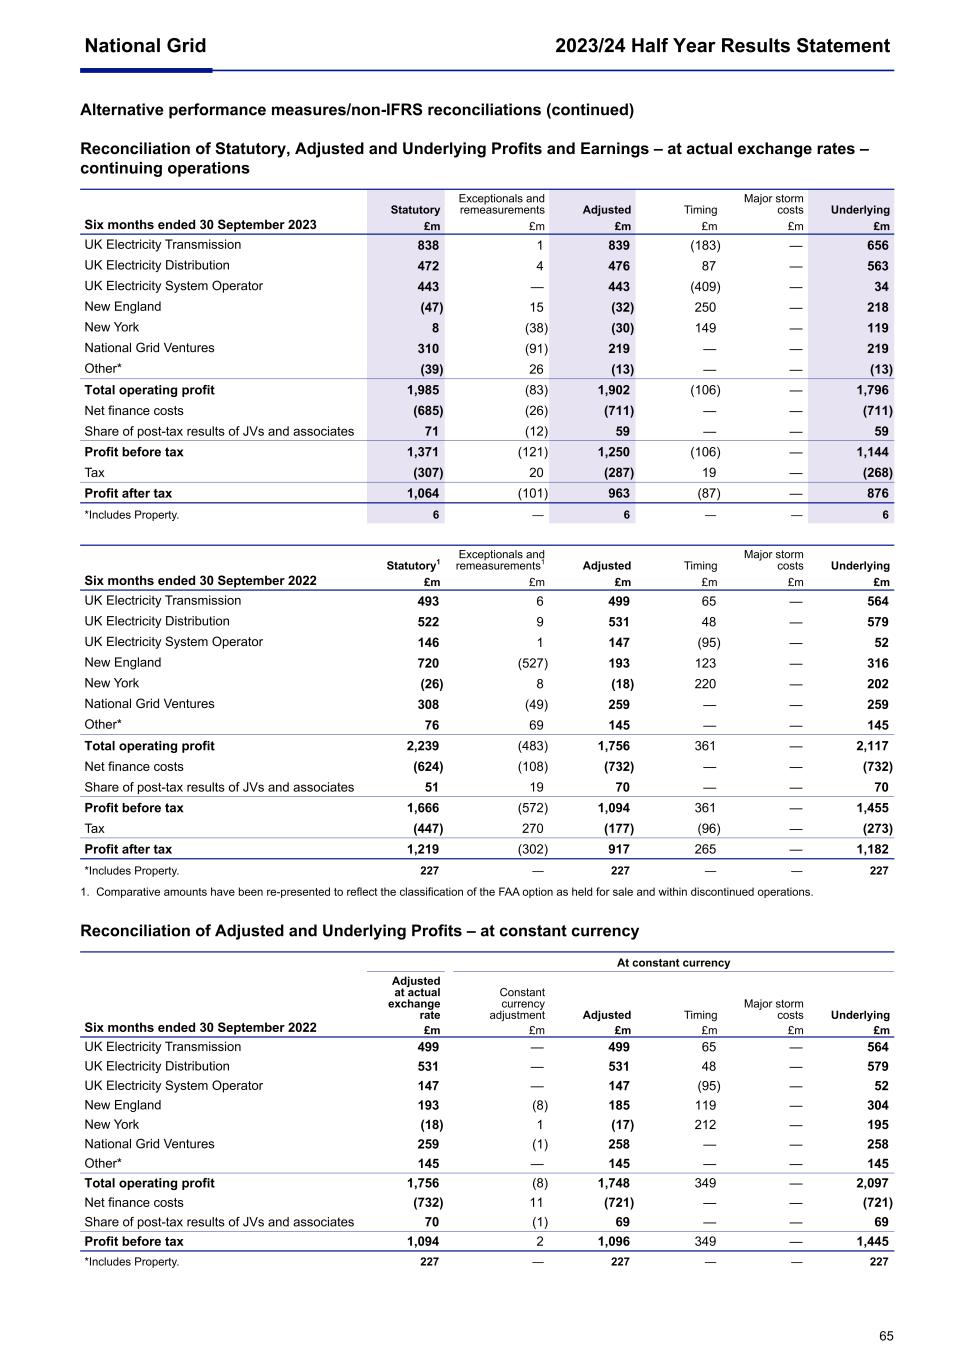
Alternative performance measures/non-IFRS reconciliations (continued) Reconciliation of Statutory, Adjusted and Underlying Profits and Earnings – at actual exchange rates – continuing operations Six months ended 30 September 2023 Statutory Exceptionals and remeasurements Adjusted Timing Major storm costs Underlying £m £m £m £m £m £m UK Electricity Transmission 838 1 839 (183) — 656 UK Electricity Distribution 472 4 476 87 — 563 UK Electricity System Operator 443 — 443 (409) — 34 New England (47) 15 (32) 250 — 218 New York 8 (38) (30) 149 — 119 National Grid Ventures 310 (91) 219 — — 219 Other* (39) 26 (13) — — (13) Total operating profit 1,985 (83) 1,902 (106) — 1,796 Net finance costs (685) (26) (711) — — (711) Share of post-tax results of JVs and associates 71 (12) 59 — — 59 Profit before tax 1,371 (121) 1,250 (106) — 1,144 Tax (307) 20 (287) 19 — (268) Profit after tax 1,064 (101) 963 (87) — 876 *Includes Property. 6 — 6 — — 6 Six months ended 30 September 2022 Statutory1 Exceptionals and remeasurements1 Adjusted Timing Major storm costs Underlying £m £m £m £m £m £m UK Electricity Transmission 493 6 499 65 — 564 UK Electricity Distribution 522 9 531 48 — 579 UK Electricity System Operator 146 1 147 (95) — 52 New England 720 (527) 193 123 — 316 New York (26) 8 (18) 220 — 202 National Grid Ventures 308 (49) 259 — — 259 Other* 76 69 145 — — 145 Total operating profit 2,239 (483) 1,756 361 — 2,117 Net finance costs (624) (108) (732) — — (732) Share of post-tax results of JVs and associates 51 19 70 — — 70 Profit before tax 1,666 (572) 1,094 361 — 1,455 Tax (447) 270 (177) (96) — (273) Profit after tax 1,219 (302) 917 265 — 1,182 *Includes Property. 227 — 227 — — 227 1. Comparative amounts have been re-presented to reflect the classification of the FAA option as held for sale and within discontinued operations. Reconciliation of Adjusted and Underlying Profits – at constant currency At constant currency Six months ended 30 September 2022 Adjusted at actual exchange rate Constant currency adjustment Adjusted Timing Major storm costs Underlying £m £m £m £m £m £m UK Electricity Transmission 499 — 499 65 — 564 UK Electricity Distribution 531 — 531 48 — 579 UK Electricity System Operator 147 — 147 (95) — 52 New England 193 (8) 185 119 — 304 New York (18) 1 (17) 212 — 195 National Grid Ventures 259 (1) 258 — — 258 Other* 145 — 145 — — 145 Total operating profit 1,756 (8) 1,748 349 — 2,097 Net finance costs (732) 11 (721) — — (721) Share of post-tax results of JVs and associates 70 (1) 69 — — 69 Profit before tax 1,094 2 1,096 349 — 1,445 *Includes Property. 227 — 227 — — 227 National Grid 2023/24 Half Year Results Statement 65
Alternative performance measures/non-IFRS reconciliations (continued) Earnings per share calculations from continuing operations – At actual exchange rates The table below reconciles the profit after tax from continuing operations per the previous tables back to the earnings per share from continuing operations for each of the adjusted profit measures. Earnings per share is only presented for those adjusted profit measures that are at actual exchange rates, and not for those at constant currency. Six months ended 30 September 2023 Profit after tax £m Non-controlling interest £m Profit after tax attributable to the parent £m Weighted average number of shares Millions Earnings per share pence Statutory 1,064 (1) 1,063 3,682 28.8 Adjusted (also referred to as Headline) 963 (1) 962 3,682 26.1 Underlying 876 (1) 875 3,682 23.8 Six months ended 30 September 2022 Profit after tax £m Non-controlling interest £m Profit after tax attributable to the parent £m Weighted average number of shares Millions Earnings per share pence Statutory1 1,219 — 1,219 3,651 33.4 Adjusted (also referred to as Headline) 917 — 917 3,651 25.1 Underlying 1,182 — 1,182 3,651 32.4 1. Comparative amounts have been re-presented to reflect the classification of the FAA option as held for sale and within discontinued operations. Timing impacts from continuing operations Under the Group’s regulatory frameworks, the majority of the revenues that National Grid is allowed to collect each year are governed by a regulatory price control or rate plan. If National Grid collects more than this allowed level of revenue, the balance must be returned to customers in subsequent years, and if it collects less than this level of revenue, it may recover the balance from customers in subsequent years. These variances between allowed and collected revenues give rise to ‘over and under-recoveries’. A number of costs in the UK and the US are pass-through costs (including commodity and energy efficiency costs in the US), and are fully recoverable from customers. Timing differences between costs of this type being incurred and their recovery through revenues are also included in over and under-recoveries. In the UK, timing differences include an estimation of the difference between revenues earned under revenue incentive mechanisms and associated revenues collected. UK timing balances and movements exclude adjustments associated with changes to controllable cost (totex) allowances or adjustments under the totex incentive mechanism. Opening balances of over and under-recoveries have been restated where appropriate to correspond with regulatory filings and calculations. UK Electricity Transmission £m UK Electricity Distribution £m UK Electricity System Operator £m New England1 £m New York1 £m Total £m 1 April 2023 opening balance2 (217) (119) 78 (394) 699 47 Over/(under)-recovery 183 (87) 409 (250) (149) 106 30 September 2023 closing balance to (recover)/return (34) (206) 487 (644) 550 153 UK Electricity Transmission £m UK Electricity Distribution £m UK Electricity System Operator £m New England1 £m New York1 £m Total £m 1 April 2022 opening balance (85) 25 (127) (332) 636 117 Over/(under)-recovery (65) (48) 95 (119) (212) (349) Disposal in the year3 — — — (17) — (17) 30 September 2022 closing balance to (recover)/return (150) (23) (32) (468) 424 (249) 1. New England and New York in-year over/(under)-recovery and all New England and New York balances have been translated using the average exchange rate for the half year ended 30 September 2023. 2. Opening balances have been restated to reflect the finalisation of calculated over/(under)-recoveries in the UK and the US. 3. Disposal of NECO (Rhode Island) in May 2022. National Grid 2023/24 Half Year Results Statement 66
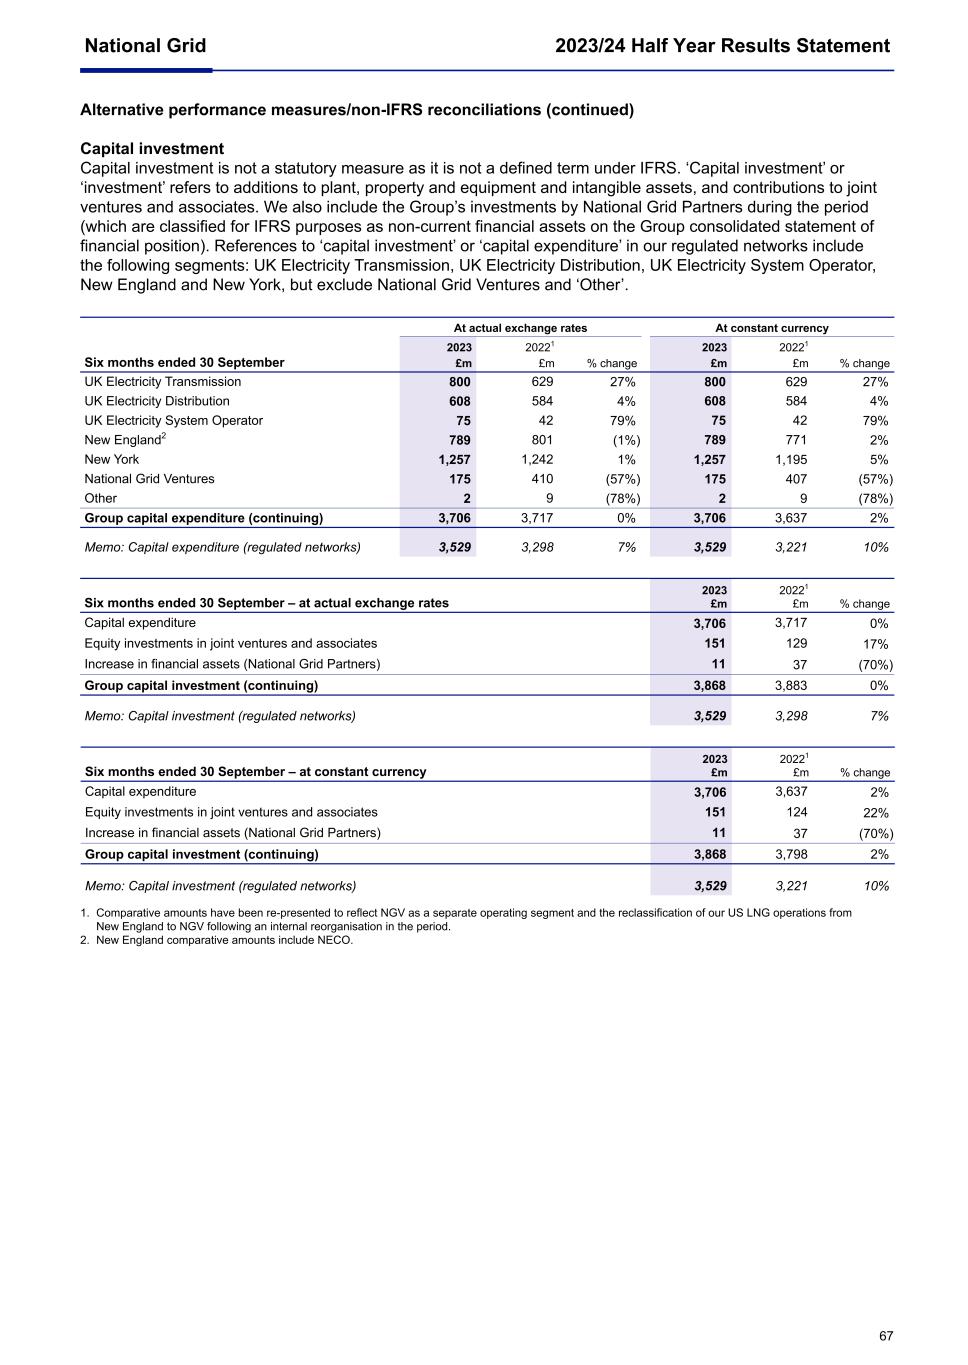
Alternative performance measures/non-IFRS reconciliations (continued) Capital investment Capital investment is not a statutory measure as it is not a defined term under IFRS. ‘Capital investment’ or ‘investment’ refers to additions to plant, property and equipment and intangible assets, and contributions to joint ventures and associates. We also include the Group’s investments by National Grid Partners during the period (which are classified for IFRS purposes as non-current financial assets on the Group consolidated statement of financial position). References to ‘capital investment’ or ‘capital expenditure’ in our regulated networks include the following segments: UK Electricity Transmission, UK Electricity Distribution, UK Electricity System Operator, New England and New York, but exclude National Grid Ventures and ‘Other’. At actual exchange rates At constant currency Six months ended 30 September 2023 20221 % change 2023 20221 % change£m £m £m £m UK Electricity Transmission 800 629 27% 800 629 27% UK Electricity Distribution 608 584 4% 608 584 4% UK Electricity System Operator 75 42 79% 75 42 79% New England2 789 801 (1%) 789 771 2% New York 1,257 1,242 1% 1,257 1,195 5% National Grid Ventures 175 410 (57%) 175 407 (57%) Other 2 9 (78%) 2 9 (78%) Group capital expenditure (continuing) 3,706 3,717 0% 3,706 3,637 2% Memo: Capital expenditure (regulated networks) 3,529 3,298 7% 3,529 3,221 10% Six months ended 30 September – at actual exchange rates 2023 20221 % change£m £m Capital expenditure 3,706 3,717 0% Equity investments in joint ventures and associates 151 129 17% Increase in financial assets (National Grid Partners) 11 37 (70%) Group capital investment (continuing) 3,868 3,883 0% Memo: Capital investment (regulated networks) 3,529 3,298 7% Six months ended 30 September – at constant currency 2023 20221 % change£m £m Capital expenditure 3,706 3,637 2% Equity investments in joint ventures and associates 151 124 22% Increase in financial assets (National Grid Partners) 11 37 (70%) Group capital investment (continuing) 3,868 3,798 2% Memo: Capital investment (regulated networks) 3,529 3,221 10% 1. Comparative amounts have been re-presented to reflect NGV as a separate operating segment and the reclassification of our US LNG operations from New England to NGV following an internal reorganisation in the period. 2. New England comparative amounts include NECO. National Grid 2023/24 Half Year Results Statement 67
v3.23.3
| X |
- DefinitionBoolean flag that is true when the XBRL content amends previously-filed or accepted submission.
| Name: |
dei_AmendmentFlag |
| Namespace Prefix: |
dei_ |
| Data Type: |
xbrli:booleanItemType |
| Balance Type: |
na |
| Period Type: |
duration |
|
| X |
- DefinitionEnd date of current fiscal year in the format --MM-DD.
| Name: |
dei_CurrentFiscalYearEndDate |
| Namespace Prefix: |
dei_ |
| Data Type: |
xbrli:gMonthDayItemType |
| Balance Type: |
na |
| Period Type: |
duration |
|
| X |
- DefinitionFiscal period values are FY, Q1, Q2, and Q3. 1st, 2nd and 3rd quarter 10-Q or 10-QT statements have value Q1, Q2, and Q3 respectively, with 10-K, 10-KT or other fiscal year statements having FY.
| Name: |
dei_DocumentFiscalPeriodFocus |
| Namespace Prefix: |
dei_ |
| Data Type: |
dei:fiscalPeriodItemType |
| Balance Type: |
na |
| Period Type: |
duration |
|
| X |
- DefinitionThis is focus fiscal year of the document report in YYYY format. For a 2006 annual report, which may also provide financial information from prior periods, fiscal 2006 should be given as the fiscal year focus. Example: 2006.
| Name: |
dei_DocumentFiscalYearFocus |
| Namespace Prefix: |
dei_ |
| Data Type: |
xbrli:gYearItemType |
| Balance Type: |
na |
| Period Type: |
duration |
|
| X |
- DefinitionFor the EDGAR submission types of Form 8-K: the date of the report, the date of the earliest event reported; for the EDGAR submission types of Form N-1A: the filing date; for all other submission types: the end of the reporting or transition period. The format of the date is YYYY-MM-DD.
| Name: |
dei_DocumentPeriodEndDate |
| Namespace Prefix: |
dei_ |
| Data Type: |
xbrli:dateItemType |
| Balance Type: |
na |
| Period Type: |
duration |
|
| X |
- DefinitionThe type of document being provided (such as 10-K, 10-Q, 485BPOS, etc). The document type is limited to the same value as the supporting SEC submission type, or the word 'Other'.
| Name: |
dei_DocumentType |
| Namespace Prefix: |
dei_ |
| Data Type: |
dei:submissionTypeItemType |
| Balance Type: |
na |
| Period Type: |
duration |
|
| X |
- DefinitionA unique 10-digit SEC-issued value to identify entities that have filed disclosures with the SEC. It is commonly abbreviated as CIK. Reference 1: http://www.xbrl.org/2003/role/presentationRef
-Publisher SEC
-Name Exchange Act
-Number 240
-Section 12
-Subsection b-2
| Name: |
dei_EntityCentralIndexKey |
| Namespace Prefix: |
dei_ |
| Data Type: |
dei:centralIndexKeyItemType |
| Balance Type: |
na |
| Period Type: |
duration |
|
| X |
- DefinitionThe exact name of the entity filing the report as specified in its charter, which is required by forms filed with the SEC. Reference 1: http://www.xbrl.org/2003/role/presentationRef
-Publisher SEC
-Name Exchange Act
-Number 240
-Section 12
-Subsection b-2
| Name: |
dei_EntityRegistrantName |
| Namespace Prefix: |
dei_ |
| Data Type: |
xbrli:normalizedStringItemType |
| Balance Type: |
na |
| Period Type: |
duration |
|
v3.23.3
Consolidated income statement - GBP (£)
£ in Millions |
6 Months Ended |
Sep. 30, 2023 |
Sep. 30, 2022 |
[1] |
| Profit or loss [abstract] |
|
|
|
| Revenue |
£ 8,489
|
£ 9,444
|
|
| Provision for bad and doubtful debts |
(91)
|
(52)
|
|
| Other operating costs |
(6,425)
|
(7,697)
|
|
| Other operating income |
12
|
544
|
|
| Operating profit |
1,985
|
2,239
|
|
| Finance income |
115
|
37
|
|
| Finance costs |
(800)
|
(661)
|
|
| Share of post-tax results of joint ventures and associates |
71
|
51
|
|
| Profit before tax |
1,371
|
1,666
|
|
| Tax |
(307)
|
(447)
|
|
| Profit after tax from continuing operations |
1,064
|
1,219
|
[2] |
| Profit after tax from discontinued operations |
65
|
37
|
[2] |
| Total profit for the period (continuing and discontinued) |
1,129
|
1,256
|
|
| Attributable to: |
|
|
|
| Equity shareholders of the parent |
1,128
|
1,256
|
|
| Non-controlling interests |
£ 1
|
£ 0
|
|
| Earnings per share (pence) |
|
|
|
| Basic earnings per share (continuing) (in GBP per share) |
£ 0.288
|
£ 0.334
|
|
| Diluted earnings per share (continuing) (in GBP per share) |
0.287
|
0.332
|
|
| Basic earnings per share (continuing and discontinued) (in GBP per share) |
0.306
|
0.344
|
|
| Diluted earnings per share (continuing and discontinued) (in GBP per share) |
£ 0.305
|
£ 0.342
|
|
|
|
| X |
- DefinitionThe amount of profit (loss) attributable to ordinary equity holders of the parent entity (the numerator) divided by the weighted average number of ordinary shares outstanding during the period (the denominator). Reference 1: http://www.xbrl.org/2003/role/disclosureRef
-Name IAS
-Number 33
-IssueDate 2022-03-24
-Paragraph 66
-URI https://taxonomy.ifrs.org/xifrs-link?type=IAS&num=33&code=ifrs-tx-2022-en-r&anchor=para_66&doctype=Standard
-URIDate 2022-03-24
Reference 2: http://www.xbrl.org/2003/role/disclosureRef
-Name IAS
-Number 33
-IssueDate 2022-03-24
-Paragraph 67
-URI https://taxonomy.ifrs.org/xifrs-link?type=IAS&num=33&code=ifrs-tx-2022-en-r&anchor=para_67&doctype=Standard
-URIDate 2022-03-24
| Name: |
ifrs-full_BasicEarningsLossPerShare |
| Namespace Prefix: |
ifrs-full_ |
| Data Type: |
dtr-types:perShareItemType |
| Balance Type: |
na |
| Period Type: |
duration |
|
| X |
- DefinitionBasic earnings (loss) per share from continuing operations. [Refer: Basic earnings (loss) per share; Continuing operations [member]] Reference 1: http://www.xbrl.org/2003/role/disclosureRef
-Name IAS
-Number 33
-IssueDate 2022-03-24
-Paragraph 66
-URI https://taxonomy.ifrs.org/xifrs-link?type=IAS&num=33&code=ifrs-tx-2022-en-r&anchor=para_66&doctype=Standard
-URIDate 2022-03-24
Reference 2: http://www.xbrl.org/2003/role/disclosureRef
-Name IAS
-Number 33
-IssueDate 2022-03-24
-Paragraph 67
-URI https://taxonomy.ifrs.org/xifrs-link?type=IAS&num=33&code=ifrs-tx-2022-en-r&anchor=para_67&doctype=Standard
-URIDate 2022-03-24
| Name: |
ifrs-full_BasicEarningsLossPerShareFromContinuingOperations |
| Namespace Prefix: |
ifrs-full_ |
| Data Type: |
dtr-types:perShareItemType |
| Balance Type: |
na |
| Period Type: |
duration |
|
| X |
- DefinitionThe amount of profit (loss) attributable to ordinary equity holders of the parent entity (the numerator), divided by the weighted average number of ordinary shares outstanding during the period (the denominator), both adjusted for the effects of all dilutive potential ordinary shares. [Refer: Ordinary shares [member]; Weighted average [member]] Reference 1: http://www.xbrl.org/2003/role/disclosureRef
-Name IAS
-Number 33
-IssueDate 2022-03-24
-Paragraph 66
-URI https://taxonomy.ifrs.org/xifrs-link?type=IAS&num=33&code=ifrs-tx-2022-en-r&anchor=para_66&doctype=Standard
-URIDate 2022-03-24
Reference 2: http://www.xbrl.org/2003/role/disclosureRef
-Name IAS
-Number 33
-IssueDate 2022-03-24
-Paragraph 67
-URI https://taxonomy.ifrs.org/xifrs-link?type=IAS&num=33&code=ifrs-tx-2022-en-r&anchor=para_67&doctype=Standard
-URIDate 2022-03-24
| Name: |
ifrs-full_DilutedEarningsLossPerShare |
| Namespace Prefix: |
ifrs-full_ |
| Data Type: |
dtr-types:perShareItemType |
| Balance Type: |
na |
| Period Type: |
duration |
|
| X |
- DefinitionDiluted earnings (loss) per share from continuing operations. [Refer: Continuing operations [member]; Diluted earnings (loss) per share] Reference 1: http://www.xbrl.org/2003/role/disclosureRef
-Name IAS
-Number 33
-IssueDate 2022-03-24
-Paragraph 66
-URI https://taxonomy.ifrs.org/xifrs-link?type=IAS&num=33&code=ifrs-tx-2022-en-r&anchor=para_66&doctype=Standard
-URIDate 2022-03-24
Reference 2: http://www.xbrl.org/2003/role/disclosureRef
-Name IAS
-Number 33
-IssueDate 2022-03-24
-Paragraph 67
-URI https://taxonomy.ifrs.org/xifrs-link?type=IAS&num=33&code=ifrs-tx-2022-en-r&anchor=para_67&doctype=Standard
-URIDate 2022-03-24
| Name: |
ifrs-full_DilutedEarningsLossPerShareFromContinuingOperations |
| Namespace Prefix: |
ifrs-full_ |
| Data Type: |
dtr-types:perShareItemType |
| Balance Type: |
na |
| Period Type: |
duration |
|
| X |
- References
+ Details
| Name: |
ifrs-full_EarningsPerShareAbstract |
| Namespace Prefix: |
ifrs-full_ |
| Data Type: |
xbrli:stringItemType |
| Balance Type: |
na |
| Period Type: |
duration |
|
| X |
- DefinitionThe amount of costs associated with financing activities of the entity. Reference 1: http://www.xbrl.org/2003/role/disclosureRef
-Name IAS
-Number 1
-IssueDate 2022-03-24
-Paragraph 82
-Subparagraph b
-URI https://taxonomy.ifrs.org/xifrs-link?type=IAS&num=1&code=ifrs-tx-2022-en-r&anchor=para_82_b&doctype=Standard
-URIDate 2022-03-24
| Name: |
ifrs-full_FinanceCosts |
| Namespace Prefix: |
ifrs-full_ |
| Data Type: |
xbrli:monetaryItemType |
| Balance Type: |
debit |
| Period Type: |
duration |
|
| X |
- DefinitionThe amount of income associated with interest and other financing activities of the entity. Reference 1: http://www.xbrl.org/2009/role/commonPracticeRef
-Name IAS
-Number 1
-IssueDate 2022-03-24
-Paragraph 85
-URI https://taxonomy.ifrs.org/xifrs-link?type=IAS&num=1&code=ifrs-tx-2022-en-r&anchor=para_85&doctype=Standard
-URIDate 2022-03-24
| Name: |
ifrs-full_FinanceIncome |
| Namespace Prefix: |
ifrs-full_ |
| Data Type: |
xbrli:monetaryItemType |
| Balance Type: |
credit |
| Period Type: |
duration |
|
| X |
- DefinitionThe amount of impairment loss recognised in profit or loss for trade receivables. [Refer: Impairment loss recognised in profit or loss; Trade receivables] Reference 1: http://www.xbrl.org/2009/role/commonPracticeRef
-Name IAS
-Number 1
-IssueDate 2022-03-24
-Paragraph 112
-Subparagraph c
-URI https://taxonomy.ifrs.org/xifrs-link?type=IAS&num=1&code=ifrs-tx-2022-en-r&anchor=para_112_c&doctype=Standard
-URIDate 2022-03-24
| Name: |
ifrs-full_ImpairmentLossRecognisedInProfitOrLossTradeReceivables |
| Namespace Prefix: |
ifrs-full_ |
| Data Type: |
xbrli:monetaryItemType |
| Balance Type: |
debit |
| Period Type: |
duration |
|
| X |
- References
+ Details
| Name: |
ifrs-full_IncomeStatementAbstract |
| Namespace Prefix: |
ifrs-full_ |
| Data Type: |
xbrli:stringItemType |
| Balance Type: |
na |
| Period Type: |
duration |
|
| X |
- DefinitionThe amount of miscellaneous other operating expenses. [Refer: Other operating income (expense)] Reference 1: http://www.xbrl.org/2009/role/commonPracticeRef
-Name IAS
-Number 1
-IssueDate 2022-03-24
-Paragraph 112
-Subparagraph c
-URI https://taxonomy.ifrs.org/xifrs-link?type=IAS&num=1&code=ifrs-tx-2022-en-r&anchor=para_112_c&doctype=Standard
-URIDate 2022-03-24
| Name: |
ifrs-full_MiscellaneousOtherOperatingExpense |
| Namespace Prefix: |
ifrs-full_ |
| Data Type: |
xbrli:monetaryItemType |
| Balance Type: |
debit |
| Period Type: |
duration |
|
| X |
- DefinitionThe amount of miscellaneous other operating income. [Refer: Other operating income (expense)] Reference 1: http://www.xbrl.org/2009/role/commonPracticeRef
-Name IAS
-Number 1
-IssueDate 2022-03-24
-Paragraph 112
-Subparagraph c
-URI https://taxonomy.ifrs.org/xifrs-link?type=IAS&num=1&code=ifrs-tx-2022-en-r&anchor=para_112_c&doctype=Standard
-URIDate 2022-03-24
| Name: |
ifrs-full_MiscellaneousOtherOperatingIncome |
| Namespace Prefix: |
ifrs-full_ |
| Data Type: |
xbrli:monetaryItemType |
| Balance Type: |
credit |
| Period Type: |
duration |
|
| X |
- DefinitionThe total of income less expenses from continuing and discontinued operations, excluding the components of other comprehensive income. [Refer: Other comprehensive income] Reference 1: http://www.xbrl.org/2003/role/disclosureRef
-Name IAS
-Number 7
-IssueDate 2022-03-24
-Paragraph 18
-Subparagraph b
-URI https://taxonomy.ifrs.org/xifrs-link?type=IAS&num=7&code=ifrs-tx-2022-en-r&anchor=para_18_b&doctype=Standard
-URIDate 2022-03-24
Reference 2: http://www.xbrl.org/2003/role/disclosureRef
-Name IFRS
-Number 1
-IssueDate 2022-03-24
-Paragraph 32
-Subparagraph a
-Clause ii
-URI https://taxonomy.ifrs.org/xifrs-link?type=IFRS&num=1&code=ifrs-tx-2022-en-r&anchor=para_32_a_ii&doctype=Standard
-URIDate 2022-03-24
Reference 3: http://www.xbrl.org/2003/role/disclosureRef
-Name IFRS
-Number 1
-IssueDate 2022-03-24
-Paragraph 24
-Subparagraph b
-URI https://taxonomy.ifrs.org/xifrs-link?type=IFRS&num=1&code=ifrs-tx-2022-en-r&anchor=para_24_b&doctype=Standard
-URIDate 2022-03-24
Reference 4: http://www.xbrl.org/2003/role/disclosureRef
-Name IFRS
-Number 8
-IssueDate 2022-03-24
-Paragraph 28
-Subparagraph b
-URI https://taxonomy.ifrs.org/xifrs-link?type=IFRS&num=8&code=ifrs-tx-2022-en-r&anchor=para_28_b&doctype=Standard
-URIDate 2022-03-24
Reference 5: http://www.xbrl.org/2003/role/exampleRef
-Note Effective on first application of IFRS 9
-Name IFRS
-Number 4
-IssueDate 2022-03-24
-Paragraph 39L
-Subparagraph e
-URI https://taxonomy.ifrs.org/xifrs-link?type=IFRS&num=4&code=ifrs-tx-2022-en-b&anchor=para_39L_e&doctype=Standard
-URIDate 2022-03-24
Reference 6: http://www.xbrl.org/2003/role/disclosureRef
-Name IFRS
-Number 8
-IssueDate 2022-03-24
-Paragraph 23
-URI https://taxonomy.ifrs.org/xifrs-link?type=IFRS&num=8&code=ifrs-tx-2022-en-r&anchor=para_23&doctype=Standard
-URIDate 2022-03-24
Reference 7: http://www.xbrl.org/2003/role/exampleRef
-Name IFRS
-Number 12
-IssueDate 2022-03-24
-Paragraph B10
-Subparagraph b
-URI https://taxonomy.ifrs.org/xifrs-link?type=IFRS&num=12&code=ifrs-tx-2022-en-r&anchor=para_B10_b&doctype=Appendix&subtype=B
-URIDate 2022-03-24
Reference 8: http://www.xbrl.org/2003/role/exampleRef
-Note Effective 2023-01-01
-Name IFRS
-Number 17
-IssueDate 2022-03-24
-Paragraph 113
-Subparagraph b
-URI https://taxonomy.ifrs.org/xifrs-link?type=IFRS&num=17&code=ifrs-tx-2022-en-r&anchor=para_113_b&doctype=Standard
-URIDate 2022-03-24
Reference 9: http://www.xbrl.org/2003/role/disclosureRef
-Name IAS
-Number 1
-IssueDate 2022-03-24
-Paragraph 81A
-Subparagraph a
-URI https://taxonomy.ifrs.org/xifrs-link?type=IAS&num=1&code=ifrs-tx-2022-en-r&anchor=para_81A_a&doctype=Standard
-URIDate 2022-03-24
Reference 10: http://www.xbrl.org/2003/role/disclosureRef
-Name IAS
-Number 1
-IssueDate 2022-03-24
-Paragraph 106
-Subparagraph d
-Clause i
-URI https://taxonomy.ifrs.org/xifrs-link?type=IAS&num=1&code=ifrs-tx-2022-en-r&anchor=para_106_d_i&doctype=Standard
-URIDate 2022-03-24
| Name: |
ifrs-full_ProfitLoss |
| Namespace Prefix: |
ifrs-full_ |
| Data Type: |
xbrli:monetaryItemType |
| Balance Type: |
credit |
| Period Type: |
duration |
|
| X |
- References
+ Details
| Name: |
ifrs-full_ProfitLossAttributableToAbstract |
| Namespace Prefix: |
ifrs-full_ |
| Data Type: |
xbrli:stringItemType |
| Balance Type: |
na |
| Period Type: |
duration |
|
| X |
- DefinitionThe profit (loss) from continuing and discontinued operations attributable to non-controlling interests. [Refer: Profit (loss); Non-controlling interests] Reference 1: http://www.xbrl.org/2003/role/disclosureRef
-Name IFRS
-Number 12
-IssueDate 2022-03-24
-Paragraph 12
-Subparagraph e
-URI https://taxonomy.ifrs.org/xifrs-link?type=IFRS&num=12&code=ifrs-tx-2022-en-r&anchor=para_12_e&doctype=Standard
-URIDate 2022-03-24
Reference 2: http://www.xbrl.org/2003/role/disclosureRef
-Name IAS
-Number 1
-IssueDate 2022-03-24
-Paragraph 81B
-Subparagraph a
-Clause i
-URI https://taxonomy.ifrs.org/xifrs-link?type=IAS&num=1&code=ifrs-tx-2022-en-r&anchor=para_81B_a_i&doctype=Standard
-URIDate 2022-03-24
| Name: |
ifrs-full_ProfitLossAttributableToNoncontrollingInterests |
| Namespace Prefix: |
ifrs-full_ |
| Data Type: |
xbrli:monetaryItemType |
| Balance Type: |
credit |
| Period Type: |
duration |
|
| X |
- DefinitionThe profit (loss) from continuing and discontinued operations attributable to owners of the parent. [Refer: Profit (loss)] Reference 1: http://www.xbrl.org/2003/role/disclosureRef
-Name IAS
-Number 1
-IssueDate 2022-03-24
-Paragraph 81B
-Subparagraph a
-Clause ii
-URI https://taxonomy.ifrs.org/xifrs-link?type=IAS&num=1&code=ifrs-tx-2022-en-r&anchor=para_81B_a_ii&doctype=Standard
-URIDate 2022-03-24
| Name: |
ifrs-full_ProfitLossAttributableToOwnersOfParent |
| Namespace Prefix: |
ifrs-full_ |
| Data Type: |
xbrli:monetaryItemType |
| Balance Type: |
credit |
| Period Type: |
duration |
|
| X |
- DefinitionThe profit (loss) before tax expense or income. [Refer: Profit (loss)] Reference 1: http://www.xbrl.org/2003/role/exampleRef
-Name IFRS
-Number 8
-IssueDate 2022-03-24
-Paragraph 28
-Subparagraph b
-URI https://taxonomy.ifrs.org/xifrs-link?type=IFRS&num=8&code=ifrs-tx-2022-en-r&anchor=para_28_b&doctype=Standard
-URIDate 2022-03-24
Reference 2: http://www.xbrl.org/2003/role/exampleRef
-Name IFRS
-Number 8
-IssueDate 2022-03-24
-Paragraph 23
-URI https://taxonomy.ifrs.org/xifrs-link?type=IFRS&num=8&code=ifrs-tx-2022-en-r&anchor=para_23&doctype=Standard
-URIDate 2022-03-24
Reference 3: http://www.xbrl.org/2003/role/disclosureRef
-Name IFRS
-Number 5
-IssueDate 2022-03-24
-Paragraph 33
-Subparagraph b
-Clause i
-URI https://taxonomy.ifrs.org/xifrs-link?type=IFRS&num=5&code=ifrs-tx-2022-en-r&anchor=para_33_b_i&doctype=Standard
-URIDate 2022-03-24
Reference 4: http://www.xbrl.org/2003/role/exampleRef
-Name IAS
-Number 1
-IssueDate 2022-03-24
-Paragraph 103
-URI https://taxonomy.ifrs.org/xifrs-link?type=IAS&num=1&code=ifrs-tx-2022-en-r&anchor=para_103&doctype=Standard
-URIDate 2022-03-24
Reference 5: http://www.xbrl.org/2003/role/exampleRef
-Name IAS
-Number 1
-IssueDate 2022-03-24
-Paragraph 102
-URI https://taxonomy.ifrs.org/xifrs-link?type=IAS&num=1&code=ifrs-tx-2022-en-r&anchor=para_102&doctype=Standard
-URIDate 2022-03-24
| Name: |
ifrs-full_ProfitLossBeforeTax |
| Namespace Prefix: |
ifrs-full_ |
| Data Type: |
xbrli:monetaryItemType |
| Balance Type: |
credit |
| Period Type: |
duration |
|
| X |
- DefinitionThe profit (loss) from continuing operations. [Refer: Continuing operations [member]; Profit (loss)] Reference 1: http://www.xbrl.org/2003/role/disclosureRef
-Name IFRS
-Number 8
-IssueDate 2022-03-24
-Paragraph 28
-Subparagraph b
-URI https://taxonomy.ifrs.org/xifrs-link?type=IFRS&num=8&code=ifrs-tx-2022-en-r&anchor=para_28_b&doctype=Standard
-URIDate 2022-03-24
Reference 2: http://www.xbrl.org/2003/role/disclosureRef
-Name IFRS
-Number 8
-IssueDate 2022-03-24
-Paragraph 23
-URI https://taxonomy.ifrs.org/xifrs-link?type=IFRS&num=8&code=ifrs-tx-2022-en-r&anchor=para_23&doctype=Standard
-URIDate 2022-03-24
Reference 3: http://www.xbrl.org/2003/role/disclosureRef
-Name IFRS
-Number 12
-IssueDate 2022-03-24
-Paragraph B12
-Subparagraph b
-Clause vi
-URI https://taxonomy.ifrs.org/xifrs-link?type=IFRS&num=12&code=ifrs-tx-2022-en-r&anchor=para_B12_b_vi&doctype=Appendix&subtype=B
-URIDate 2022-03-24
Reference 4: http://www.xbrl.org/2003/role/disclosureRef
-Name IAS
-Number 1
-IssueDate 2022-03-24
-Paragraph 81A
-Subparagraph a
-URI https://taxonomy.ifrs.org/xifrs-link?type=IAS&num=1&code=ifrs-tx-2022-en-r&anchor=para_81A_a&doctype=Standard
-URIDate 2022-03-24
| Name: |
ifrs-full_ProfitLossFromContinuingOperations |
| Namespace Prefix: |
ifrs-full_ |
| Data Type: |
xbrli:monetaryItemType |
| Balance Type: |
credit |
| Period Type: |
duration |
|
| X |
- DefinitionThe profit (loss) from discontinued operations. [Refer: Discontinued operations [member]; Profit (loss)] Reference 1: http://www.xbrl.org/2003/role/disclosureRef
-Name IFRS
-Number 5
-IssueDate 2022-03-24
-Paragraph 33
-Subparagraph a
-URI https://taxonomy.ifrs.org/xifrs-link?type=IFRS&num=5&code=ifrs-tx-2022-en-r&anchor=para_33_a&doctype=Standard
-URIDate 2022-03-24
Reference 2: http://www.xbrl.org/2003/role/disclosureRef
-Name IFRS
-Number 12
-IssueDate 2022-03-24
-Paragraph B12
-Subparagraph b
-Clause vii
-URI https://taxonomy.ifrs.org/xifrs-link?type=IFRS&num=12&code=ifrs-tx-2022-en-r&anchor=para_B12_b_vii&doctype=Appendix&subtype=B
-URIDate 2022-03-24
Reference 3: http://www.xbrl.org/2003/role/disclosureRef
-Name IAS
-Number 1
-IssueDate 2022-03-24
-Paragraph 82
-Subparagraph ea
-URI https://taxonomy.ifrs.org/xifrs-link?type=IAS&num=1&code=ifrs-tx-2022-en-r&anchor=para_82_ea&doctype=Standard
-URIDate 2022-03-24
Reference 4: http://www.xbrl.org/2003/role/disclosureRef
-Name IAS
-Number 1
-IssueDate 2022-03-24
-Paragraph 98
-Subparagraph e
-URI https://taxonomy.ifrs.org/xifrs-link?type=IAS&num=1&code=ifrs-tx-2022-en-r&anchor=para_98_e&doctype=Standard
-URIDate 2022-03-24
| Name: |
ifrs-full_ProfitLossFromDiscontinuedOperations |
| Namespace Prefix: |
ifrs-full_ |
| Data Type: |
xbrli:monetaryItemType |
| Balance Type: |
credit |
| Period Type: |
duration |
|
| X |
- DefinitionThe profit (loss) from operating activities of the entity. [Refer: Profit (loss)] Reference 1: http://www.xbrl.org/2003/role/exampleRef
-Name IAS
-Number 32
-IssueDate 2022-03-24
-Paragraph IE33
-URI https://taxonomy.ifrs.org/xifrs-link?type=IAS&num=32&code=ifrs-tx-2022-en-r&anchor=para_IE33&doctype=Illustrative%20Examples
-URIDate 2022-03-24
Reference 2: http://www.xbrl.org/2009/role/commonPracticeRef
-Name IAS
-Number 1
-IssueDate 2022-03-24
-Paragraph 85
-URI https://taxonomy.ifrs.org/xifrs-link?type=IAS&num=1&code=ifrs-tx-2022-en-r&anchor=para_85&doctype=Standard
-URIDate 2022-03-24
| Name: |
ifrs-full_ProfitLossFromOperatingActivities |
| Namespace Prefix: |
ifrs-full_ |
| Data Type: |
xbrli:monetaryItemType |
| Balance Type: |
credit |
| Period Type: |
duration |
|
| X |
- DefinitionThe income arising in the course of an entity's ordinary activities. Income is increases in assets, or decreases in liabilities, that result in increases in equity, other than those relating to contributions from holders of equity claims. Reference 1: http://www.xbrl.org/2003/role/disclosureRef
-Name IFRS
-Number 8
-IssueDate 2022-03-24
-Paragraph 28
-Subparagraph a
-URI https://taxonomy.ifrs.org/xifrs-link?type=IFRS&num=8&code=ifrs-tx-2022-en-r&anchor=para_28_a&doctype=Standard
-URIDate 2022-03-24
Reference 2: http://www.xbrl.org/2003/role/disclosureRef
-Name IFRS
-Number 8
-IssueDate 2022-03-24
-Paragraph 23
-Subparagraph a
-URI https://taxonomy.ifrs.org/xifrs-link?type=IFRS&num=8&code=ifrs-tx-2022-en-r&anchor=para_23_a&doctype=Standard
-URIDate 2022-03-24
Reference 3: http://www.xbrl.org/2003/role/disclosureRef
-Name IFRS
-Number 8
-IssueDate 2022-03-24
-Paragraph 32
-URI https://taxonomy.ifrs.org/xifrs-link?type=IFRS&num=8&code=ifrs-tx-2022-en-r&anchor=para_32&doctype=Standard
-URIDate 2022-03-24
Reference 4: http://www.xbrl.org/2003/role/disclosureRef
-Name IFRS
-Number 8
-IssueDate 2022-03-24
-Paragraph 33
-Subparagraph a
-URI https://taxonomy.ifrs.org/xifrs-link?type=IFRS&num=8&code=ifrs-tx-2022-en-r&anchor=para_33_a&doctype=Standard
-URIDate 2022-03-24
Reference 5: http://www.xbrl.org/2003/role/disclosureRef
-Name IFRS
-Number 8
-IssueDate 2022-03-24
-Paragraph 34
-URI https://taxonomy.ifrs.org/xifrs-link?type=IFRS&num=8&code=ifrs-tx-2022-en-r&anchor=para_34&doctype=Standard
-URIDate 2022-03-24
Reference 6: http://www.xbrl.org/2003/role/disclosureRef
-Name IFRS
-Number 5
-IssueDate 2022-03-24
-Paragraph 33
-Subparagraph b
-Clause i
-URI https://taxonomy.ifrs.org/xifrs-link?type=IFRS&num=5&code=ifrs-tx-2022-en-r&anchor=para_33_b_i&doctype=Standard
-URIDate 2022-03-24
Reference 7: http://www.xbrl.org/2003/role/disclosureRef
-Name IFRS
-Number 12
-IssueDate 2022-03-24
-Paragraph B12
-Subparagraph b
-Clause v
-URI https://taxonomy.ifrs.org/xifrs-link?type=IFRS&num=12&code=ifrs-tx-2022-en-r&anchor=para_B12_b_v&doctype=Appendix&subtype=B
-URIDate 2022-03-24
Reference 8: http://www.xbrl.org/2003/role/exampleRef
-Name IFRS
-Number 12
-IssueDate 2022-03-24
-Paragraph B10
-Subparagraph b
-URI https://taxonomy.ifrs.org/xifrs-link?type=IFRS&num=12&code=ifrs-tx-2022-en-r&anchor=para_B10_b&doctype=Appendix&subtype=B
-URIDate 2022-03-24
Reference 9: http://www.xbrl.org/2003/role/disclosureRef
-Name IAS
-Number 1
-IssueDate 2022-03-24
-Paragraph 82
-Subparagraph a
-URI https://taxonomy.ifrs.org/xifrs-link?type=IAS&num=1&code=ifrs-tx-2022-en-r&anchor=para_82_a&doctype=Standard
-URIDate 2022-03-24
Reference 10: http://www.xbrl.org/2003/role/exampleRef
-Name IAS
-Number 1
-IssueDate 2022-03-24
-Paragraph 103
-URI https://taxonomy.ifrs.org/xifrs-link?type=IAS&num=1&code=ifrs-tx-2022-en-r&anchor=para_103&doctype=Standard
-URIDate 2022-03-24
Reference 11: http://www.xbrl.org/2003/role/exampleRef
-Name IAS
-Number 1
-IssueDate 2022-03-24
-Paragraph 102
-URI https://taxonomy.ifrs.org/xifrs-link?type=IAS&num=1&code=ifrs-tx-2022-en-r&anchor=para_102&doctype=Standard
-URIDate 2022-03-24
| Name: |
ifrs-full_Revenue |
| Namespace Prefix: |
ifrs-full_ |
| Data Type: |
xbrli:monetaryItemType |
| Balance Type: |
credit |
| Period Type: |
duration |
|
| X |
- DefinitionThe entity's share of the profit (loss) of associates and joint ventures accounted for using the equity method. [Refer: Associates [member]; Investments accounted for using equity method; Joint ventures [member]; Profit (loss)] Reference 1: http://www.xbrl.org/2003/role/disclosureRef
-Name IFRS
-Number 8
-IssueDate 2022-03-24
-Paragraph 28
-Subparagraph e
-URI https://taxonomy.ifrs.org/xifrs-link?type=IFRS&num=8&code=ifrs-tx-2022-en-r&anchor=para_28_e&doctype=Standard
-URIDate 2022-03-24
Reference 2: http://www.xbrl.org/2003/role/disclosureRef
-Name IFRS
-Number 8
-IssueDate 2022-03-24
-Paragraph 23
-Subparagraph g
-URI https://taxonomy.ifrs.org/xifrs-link?type=IFRS&num=8&code=ifrs-tx-2022-en-r&anchor=para_23_g&doctype=Standard
-URIDate 2022-03-24
Reference 3: http://www.xbrl.org/2003/role/disclosureRef
-Note Effective on first application of IFRS 9
-Name IFRS
-Number 4
-IssueDate 2022-03-24
-Paragraph 39M
-Subparagraph b
-URI https://taxonomy.ifrs.org/xifrs-link?type=IFRS&num=4&code=ifrs-tx-2022-en-b&anchor=para_39M_b&doctype=Standard
-URIDate 2022-03-24
Reference 4: http://www.xbrl.org/2003/role/disclosureRef
-Name IAS
-Number 1
-IssueDate 2022-03-24
-Paragraph 82
-Subparagraph c
-URI https://taxonomy.ifrs.org/xifrs-link?type=IAS&num=1&code=ifrs-tx-2022-en-r&anchor=para_82_c&doctype=Standard
-URIDate 2022-03-24
| Name: |
ifrs-full_ShareOfProfitLossOfAssociatesAndJointVenturesAccountedForUsingEquityMethod |
| Namespace Prefix: |
ifrs-full_ |
| Data Type: |
xbrli:monetaryItemType |
| Balance Type: |
credit |
| Period Type: |
duration |
|
v3.23.3
Consolidated statement of comprehensive income - GBP (£)
£ in Millions |
6 Months Ended |
Sep. 30, 2023 |
Sep. 30, 2022 |
[1] |
| Statement of comprehensive income [abstract] |
|
|
|
| Profit after tax from continuing operations |
£ 1,064
|
£ 1,219
|
[2] |
| Profit after tax from discontinued operations |
65
|
37
|
[2] |
| Items from continuing operations that will never be reclassified to profit or loss: |
|
|
|
| Remeasurement losses on pension assets and post-retirement benefit obligations |
(263)
|
(631)
|
|
| Net (losses)/gains in respect of cash flow hedging of capital expenditure |
(2)
|
14
|
|
| Tax on items that will never be reclassified to profit or loss |
64
|
159
|
|
| Total items from continuing operations that will never be reclassified to profit or loss |
(201)
|
(458)
|
|
| Items from continuing operations that may be reclassified subsequently to profit or loss: |
|
|
|
| Retranslation of net assets offset by net investment hedge |
118
|
2,360
|
|
| Exchange differences reclassified to the consolidated income statement on disposal |
0
|
(145)
|
|
| Net gains in respect of cash flow hedges |
201
|
450
|
|
| Net gains/(losses) in respect of cost of hedging |
40
|
(64)
|
|
| Net losses on investments in debt instruments measured at fair value through other comprehensive income |
(16)
|
(47)
|
|
| Share of other comprehensive income of associates, net of tax |
0
|
1
|
|
| Tax on items that may be reclassified subsequently to profit or loss |
(59)
|
(86)
|
|
| Total items from continuing operations that may be reclassified subsequently to profit or loss |
284
|
2,469
|
|
| Other comprehensive income for the period, net of tax, from continuing operations |
83
|
2,011
|
|
| Other comprehensive loss for the period, net of tax, from discontinued operations |
(9)
|
(86)
|
|
| Other comprehensive income for the period, net of tax |
74
|
1,925
|
|
| Total comprehensive income for the period from continuing operations |
1,147
|
3,230
|
|
| Total comprehensive income/(loss) for the period from discontinued operations |
56
|
(49)
|
|
| Total comprehensive income for the period |
1,203
|
3,181
|
|
| Attributable to: |
|
|
|
| Equity shareholders of the parent from continuing operations |
1,146
|
3,227
|
|
| Equity shareholders of the parent from discontinued operations |
56
|
(49)
|
|
| Equity shareholders of the parent |
1,202
|
3,178
|
|
| Non-controlling interests |
£ 1
|
£ 3
|
|
|
|
| X |
- References
+ Details
| Name: |
ifrs-full_ComponentsOfOtherComprehensiveIncomeThatWillBeReclassifiedToProfitOrLossNetOfTaxAbstract |
| Namespace Prefix: |
ifrs-full_ |
| Data Type: |
xbrli:stringItemType |
| Balance Type: |
na |
| Period Type: |
duration |
|
| X |
- References
+ Details
| Name: |
ifrs-full_ComponentsOfOtherComprehensiveIncomeThatWillNotBeReclassifiedToProfitOrLossNetOfTaxAbstract |
| Namespace Prefix: |
ifrs-full_ |
| Data Type: |
xbrli:stringItemType |
| Balance Type: |
na |
| Period Type: |
duration |
|
| X |
- DefinitionThe amount of change in equity resulting from transactions and other events, other than those changes resulting from transactions with owners in their capacity as owners. Reference 1: http://www.xbrl.org/2003/role/disclosureRef
-Name IFRS
-Number 1
-IssueDate 2022-03-24
-Paragraph 32
-Subparagraph a
-Clause ii
-URI https://taxonomy.ifrs.org/xifrs-link?type=IFRS&num=1&code=ifrs-tx-2022-en-r&anchor=para_32_a_ii&doctype=Standard
-URIDate 2022-03-24
Reference 2: http://www.xbrl.org/2003/role/disclosureRef
-Name IFRS
-Number 1
-IssueDate 2022-03-24
-Paragraph 24
-Subparagraph b
-URI https://taxonomy.ifrs.org/xifrs-link?type=IFRS&num=1&code=ifrs-tx-2022-en-r&anchor=para_24_b&doctype=Standard
-URIDate 2022-03-24
Reference 3: http://www.xbrl.org/2003/role/disclosureRef
-Name IFRS
-Number 12
-IssueDate 2022-03-24
-Paragraph B12
-Subparagraph b
-Clause ix
-URI https://taxonomy.ifrs.org/xifrs-link?type=IFRS&num=12&code=ifrs-tx-2022-en-r&anchor=para_B12_b_ix&doctype=Appendix&subtype=B
-URIDate 2022-03-24
Reference 4: http://www.xbrl.org/2003/role/exampleRef
-Name IFRS
-Number 12
-IssueDate 2022-03-24
-Paragraph B10
-Subparagraph b
-URI https://taxonomy.ifrs.org/xifrs-link?type=IFRS&num=12&code=ifrs-tx-2022-en-r&anchor=para_B10_b&doctype=Appendix&subtype=B
-URIDate 2022-03-24
Reference 5: http://www.xbrl.org/2003/role/disclosureRef
-Name IAS
-Number 1
-IssueDate 2022-03-24
-Paragraph 81A
-Subparagraph c
-URI https://taxonomy.ifrs.org/xifrs-link?type=IAS&num=1&code=ifrs-tx-2022-en-r&anchor=para_81A_c&doctype=Standard
-URIDate 2022-03-24
Reference 6: http://www.xbrl.org/2003/role/disclosureRef
-Name IAS
-Number 1
-IssueDate 2022-03-24
-Paragraph 106
-Subparagraph a
-URI https://taxonomy.ifrs.org/xifrs-link?type=IAS&num=1&code=ifrs-tx-2022-en-r&anchor=para_106_a&doctype=Standard
-URIDate 2022-03-24
| Name: |
ifrs-full_ComprehensiveIncome |
| Namespace Prefix: |
ifrs-full_ |
| Data Type: |
xbrli:monetaryItemType |
| Balance Type: |
credit |
| Period Type: |
duration |
|
| X |
- References
+ Details
| Name: |
ifrs-full_ComprehensiveIncomeAttributableToAbstract |
| Namespace Prefix: |
ifrs-full_ |
| Data Type: |
xbrli:stringItemType |
| Balance Type: |
na |
| Period Type: |
duration |
|
| X |
- DefinitionThe amount of comprehensive income attributable to non-controlling interests. [Refer: Comprehensive income; Non-controlling interests] Reference 1: http://www.xbrl.org/2003/role/disclosureRef
-Name IAS
-Number 1
-IssueDate 2022-03-24
-Paragraph 81B
-Subparagraph b
-Clause i
-URI https://taxonomy.ifrs.org/xifrs-link?type=IAS&num=1&code=ifrs-tx-2022-en-r&anchor=para_81B_b_i&doctype=Standard
-URIDate 2022-03-24
Reference 2: http://www.xbrl.org/2003/role/disclosureRef
-Name IAS
-Number 1
-IssueDate 2022-03-24
-Paragraph 106
-Subparagraph a
-URI https://taxonomy.ifrs.org/xifrs-link?type=IAS&num=1&code=ifrs-tx-2022-en-r&anchor=para_106_a&doctype=Standard
-URIDate 2022-03-24
| Name: |
ifrs-full_ComprehensiveIncomeAttributableToNoncontrollingInterests |
| Namespace Prefix: |
ifrs-full_ |
| Data Type: |
xbrli:monetaryItemType |
| Balance Type: |
credit |
| Period Type: |
duration |
|
| X |
- DefinitionThe amount of comprehensive income attributable to owners of the parent. [Refer: Comprehensive income] Reference 1: http://www.xbrl.org/2003/role/disclosureRef
-Name IAS
-Number 1
-IssueDate 2022-03-24
-Paragraph 81B
-Subparagraph b
-Clause ii
-URI https://taxonomy.ifrs.org/xifrs-link?type=IAS&num=1&code=ifrs-tx-2022-en-r&anchor=para_81B_b_ii&doctype=Standard
-URIDate 2022-03-24
Reference 2: http://www.xbrl.org/2003/role/disclosureRef
-Name IAS
-Number 1
-IssueDate 2022-03-24
-Paragraph 106
-Subparagraph a
-URI https://taxonomy.ifrs.org/xifrs-link?type=IAS&num=1&code=ifrs-tx-2022-en-r&anchor=para_106_a&doctype=Standard
-URIDate 2022-03-24
| Name: |
ifrs-full_ComprehensiveIncomeAttributableToOwnersOfParent |
| Namespace Prefix: |
ifrs-full_ |
| Data Type: |
xbrli:monetaryItemType |
| Balance Type: |
credit |
| Period Type: |
duration |
|
| X |
- DefinitionThe comprehensive income from continuing operations. [Refer: Continuing operations [member]; Comprehensive income] Reference 1: http://www.xbrl.org/2009/role/commonPracticeRef
-Name IFRS
-Number 5
-IssueDate 2022-03-24
-Paragraph 33
-Subparagraph d
-URI https://taxonomy.ifrs.org/xifrs-link?type=IFRS&num=5&code=ifrs-tx-2022-en-r&anchor=para_33_d&doctype=Standard
-URIDate 2022-03-24
| Name: |
ifrs-full_ComprehensiveIncomeFromContinuingOperations |
| Namespace Prefix: |
ifrs-full_ |
| Data Type: |
xbrli:monetaryItemType |
| Balance Type: |
credit |
| Period Type: |
duration |
|
| X |
- DefinitionThe comprehensive income from continuing operations attributable to owners of the parent. [Refer: Comprehensive income from continuing operations] Reference 1: http://www.xbrl.org/2009/role/commonPracticeRef
-Name IFRS
-Number 5
-IssueDate 2022-03-24
-Paragraph 33
-Subparagraph d
-URI https://taxonomy.ifrs.org/xifrs-link?type=IFRS&num=5&code=ifrs-tx-2022-en-r&anchor=para_33_d&doctype=Standard
-URIDate 2022-03-24
| Name: |
ifrs-full_ComprehensiveIncomeFromContinuingOperationsAttributableToOwnersOfParent |
| Namespace Prefix: |
ifrs-full_ |
| Data Type: |
xbrli:monetaryItemType |
| Balance Type: |
credit |
| Period Type: |
duration |
|
| X |
- DefinitionThe comprehensive income from discontinued operations. [Refer: Discontinued operations [member]; Comprehensive income] Reference 1: http://www.xbrl.org/2009/role/commonPracticeRef
-Name IFRS
-Number 5
-IssueDate 2022-03-24
-Paragraph 33
-Subparagraph d
-URI https://taxonomy.ifrs.org/xifrs-link?type=IFRS&num=5&code=ifrs-tx-2022-en-r&anchor=para_33_d&doctype=Standard
-URIDate 2022-03-24
| Name: |
ifrs-full_ComprehensiveIncomeFromDiscontinuedOperations |
| Namespace Prefix: |
ifrs-full_ |
| Data Type: |
xbrli:monetaryItemType |
| Balance Type: |
credit |
| Period Type: |
duration |
|
| X |
- DefinitionThe comprehensive income from discontinued operations attributable to owners of the parent. [Refer: Comprehensive income from discontinued operations] Reference 1: http://www.xbrl.org/2009/role/commonPracticeRef
-Name IFRS
-Number 5
-IssueDate 2022-03-24
-Paragraph 33
-Subparagraph d
-URI https://taxonomy.ifrs.org/xifrs-link?type=IFRS&num=5&code=ifrs-tx-2022-en-r&anchor=para_33_d&doctype=Standard
-URIDate 2022-03-24
| Name: |
ifrs-full_ComprehensiveIncomeFromDiscontinuedOperationsAttributableToOwnersOfParent |
| Namespace Prefix: |
ifrs-full_ |
| Data Type: |
xbrli:monetaryItemType |
| Balance Type: |
credit |
| Period Type: |
duration |
|
| X |
- DefinitionThe gains (losses) recognised in other comprehensive income on cash flow hedges, before tax, before reclassification adjustments. [Refer: Cash flow hedges [member]] Reference 1: http://www.xbrl.org/2003/role/disclosureRef
-Name IAS
-Number 1
-IssueDate 2022-03-24
-Paragraph 91
-Subparagraph b
-URI https://taxonomy.ifrs.org/xifrs-link?type=IAS&num=1&code=ifrs-tx-2022-en-r&anchor=para_91_b&doctype=Standard
-URIDate 2022-03-24
Reference 2: http://www.xbrl.org/2003/role/disclosureRef
-Note Expiry date 2023-01-01
-Name IFRS
-Number 7
-IssueDate 2022-03-24
-Paragraph 23
-Subparagraph c
-URI https://taxonomy.ifrs.org/xifrs-link?type=IFRS&num=7&code=ifrs-tx-2017-en-b&anchor=para_23_c&doctype=Standard&book=b
-URIDate 2022-03-24
| Name: |
ifrs-full_GainsLossesOnCashFlowHedgesBeforeTax |
| Namespace Prefix: |
ifrs-full_ |
| Data Type: |
xbrli:monetaryItemType |
| Balance Type: |
credit |
| Period Type: |
duration |
|
| X |
- DefinitionThe gains (losses) recognised in other comprehensive income on exchange differences on the translation of financial statements of foreign operations, before tax, before reclassification adjustments. [Refer: Other comprehensive income] Reference 1: http://www.xbrl.org/2003/role/disclosureRef
-Name IAS
-Number 1
-IssueDate 2022-03-24
-Paragraph 91
-Subparagraph b
-URI https://taxonomy.ifrs.org/xifrs-link?type=IAS&num=1&code=ifrs-tx-2022-en-r&anchor=para_91_b&doctype=Standard
-URIDate 2022-03-24
| Name: |
ifrs-full_GainsLossesOnExchangeDifferencesOnTranslationBeforeTax |
| Namespace Prefix: |
ifrs-full_ |
| Data Type: |
xbrli:monetaryItemType |
| Balance Type: |
credit |
| Period Type: |
duration |
|
| X |
- DefinitionThe amount of income and expense (including reclassification adjustments) that is not recognised in profit or loss as required or permitted by IFRSs. [Refer: IFRSs [member]] Reference 1: http://www.xbrl.org/2003/role/disclosureRef
-Name IFRS
-Number 12
-IssueDate 2022-03-24
-Paragraph B12
-Subparagraph b
-Clause viii
-URI https://taxonomy.ifrs.org/xifrs-link?type=IFRS&num=12&code=ifrs-tx-2022-en-r&anchor=para_B12_b_viii&doctype=Appendix&subtype=B
-URIDate 2022-03-24
Reference 2: http://www.xbrl.org/2003/role/disclosureRef
-Name IAS
-Number 1
-IssueDate 2022-03-24
-Paragraph 81A
-Subparagraph b
-URI https://taxonomy.ifrs.org/xifrs-link?type=IAS&num=1&code=ifrs-tx-2022-en-r&anchor=para_81A_b&doctype=Standard
-URIDate 2022-03-24
Reference 3: http://www.xbrl.org/2003/role/disclosureRef
-Name IAS
-Number 1
-IssueDate 2022-03-24
-Paragraph 91
-Subparagraph a
-URI https://taxonomy.ifrs.org/xifrs-link?type=IAS&num=1&code=ifrs-tx-2022-en-r&anchor=para_91_a&doctype=Standard
-URIDate 2022-03-24
Reference 4: http://www.xbrl.org/2003/role/disclosureRef
-Name IAS
-Number 1
-IssueDate 2022-03-24
-Paragraph 106
-Subparagraph d
-Clause ii
-URI https://taxonomy.ifrs.org/xifrs-link?type=IAS&num=1&code=ifrs-tx-2022-en-r&anchor=para_106_d_ii&doctype=Standard
-URIDate 2022-03-24
| Name: |
ifrs-full_OtherComprehensiveIncome |
| Namespace Prefix: |
ifrs-full_ |
| Data Type: |
xbrli:monetaryItemType |
| Balance Type: |
credit |
| Period Type: |
duration |
|
| X |
- DefinitionThe amount of other comprehensive income, before tax, related to gains (losses) on remeasurements of defined benefit plans, which comprise actuarial gains and losses; the return on plan assets, excluding amounts included in net interest on the net defined benefit liability (asset); and any change in the effect of the asset ceiling, excluding amounts included in net interest on the net defined benefit liability (asset). [Refer: Other comprehensive income; Defined benefit plans [member]; Plan assets [member]; Net defined benefit liability (asset)] [Contrast: Decrease (increase) in net defined benefit liability (asset) resulting from gain (loss) on remeasurement in other comprehensive income] Reference 1: http://www.xbrl.org/2009/role/commonPracticeRef
-Name IAS
-Number 19
-IssueDate 2022-03-24
-Paragraph 135
-Subparagraph b
-URI https://taxonomy.ifrs.org/xifrs-link?type=IAS&num=19&code=ifrs-tx-2022-en-r&anchor=para_135_b&doctype=Standard
-URIDate 2022-03-24
Reference 2: http://www.xbrl.org/2003/role/disclosureRef
-Name IAS
-Number 1
-IssueDate 2022-03-24
-Paragraph 91
-Subparagraph b
-URI https://taxonomy.ifrs.org/xifrs-link?type=IAS&num=1&code=ifrs-tx-2022-en-r&anchor=para_91_b&doctype=Standard
-URIDate 2022-03-24
Reference 3: http://www.xbrl.org/2003/role/disclosureRef
-Name IAS
-Number 1
-IssueDate 2022-03-24
-Paragraph 7
-URI https://taxonomy.ifrs.org/xifrs-link?type=IAS&num=1&code=ifrs-tx-2022-en-r&anchor=para_7&doctype=Standard
-URIDate 2022-03-24
| Name: |
ifrs-full_OtherComprehensiveIncomeBeforeTaxGainsLossesOnRemeasurementsOfDefinedBenefitPlans |
| Namespace Prefix: |
ifrs-full_ |
| Data Type: |
xbrli:monetaryItemType |
| Balance Type: |
credit |
| Period Type: |
duration |
|
| X |
- DefinitionThe amount of other comprehensive income that will be reclassified to profit or loss, net of tax. [Refer: Other comprehensive income] Reference 1: http://www.xbrl.org/2003/role/exampleRef
-Name IAS
-Number 1
-IssueDate 2022-03-24
-Paragraph IG6
-URI https://taxonomy.ifrs.org/xifrs-link?type=IAS&num=1&code=ifrs-tx-2022-en-r&anchor=para_IG6&doctype=Implementation%20Guidance
-URIDate 2022-03-24
Reference 2: http://www.xbrl.org/2003/role/exampleRef
-Name IAS
-Number 1
-IssueDate 2022-03-24
-Paragraph 82A
-URI https://taxonomy.ifrs.org/xifrs-link?type=IAS&num=1&code=ifrs-tx-2022-en-r&anchor=para_82A&doctype=Standard
-URIDate 2022-03-24
| Name: |
ifrs-full_OtherComprehensiveIncomeThatWillBeReclassifiedToProfitOrLossNetOfTax |
| Namespace Prefix: |
ifrs-full_ |
| Data Type: |
xbrli:monetaryItemType |
| Balance Type: |
credit |
| Period Type: |
duration |
|
| X |
- DefinitionThe amount of other comprehensive income that will not be reclassified to profit or loss, net of tax. [Refer: Other comprehensive income] Reference 1: http://www.xbrl.org/2003/role/exampleRef
-Name IAS
-Number 1
-IssueDate 2022-03-24
-Paragraph IG6
-URI https://taxonomy.ifrs.org/xifrs-link?type=IAS&num=1&code=ifrs-tx-2022-en-r&anchor=para_IG6&doctype=Implementation%20Guidance
-URIDate 2022-03-24
Reference 2: http://www.xbrl.org/2003/role/exampleRef
-Name IAS
-Number 1
-IssueDate 2022-03-24
-Paragraph 82A
-URI https://taxonomy.ifrs.org/xifrs-link?type=IAS&num=1&code=ifrs-tx-2022-en-r&anchor=para_82A&doctype=Standard
-URIDate 2022-03-24
| Name: |
ifrs-full_OtherComprehensiveIncomeThatWillNotBeReclassifiedToProfitOrLossNetOfTax |
| Namespace Prefix: |
ifrs-full_ |
| Data Type: |
xbrli:monetaryItemType |
| Balance Type: |
credit |
| Period Type: |
duration |
|
| X |
- DefinitionThe profit (loss) from continuing operations. [Refer: Continuing operations [member]; Profit (loss)] Reference 1: http://www.xbrl.org/2003/role/disclosureRef
-Name IFRS
-Number 8
-IssueDate 2022-03-24
-Paragraph 28
-Subparagraph b
-URI https://taxonomy.ifrs.org/xifrs-link?type=IFRS&num=8&code=ifrs-tx-2022-en-r&anchor=para_28_b&doctype=Standard
-URIDate 2022-03-24
Reference 2: http://www.xbrl.org/2003/role/disclosureRef
-Name IFRS
-Number 8
-IssueDate 2022-03-24
-Paragraph 23
-URI https://taxonomy.ifrs.org/xifrs-link?type=IFRS&num=8&code=ifrs-tx-2022-en-r&anchor=para_23&doctype=Standard
-URIDate 2022-03-24
Reference 3: http://www.xbrl.org/2003/role/disclosureRef
-Name IFRS
-Number 12
-IssueDate 2022-03-24
-Paragraph B12
-Subparagraph b
-Clause vi
-URI https://taxonomy.ifrs.org/xifrs-link?type=IFRS&num=12&code=ifrs-tx-2022-en-r&anchor=para_B12_b_vi&doctype=Appendix&subtype=B
-URIDate 2022-03-24
Reference 4: http://www.xbrl.org/2003/role/disclosureRef
-Name IAS
-Number 1
-IssueDate 2022-03-24
-Paragraph 81A
-Subparagraph a
-URI https://taxonomy.ifrs.org/xifrs-link?type=IAS&num=1&code=ifrs-tx-2022-en-r&anchor=para_81A_a&doctype=Standard
-URIDate 2022-03-24
| Name: |
ifrs-full_ProfitLossFromContinuingOperations |
| Namespace Prefix: |
ifrs-full_ |
| Data Type: |
xbrli:monetaryItemType |
| Balance Type: |
credit |
| Period Type: |
duration |
|
| X |
- DefinitionThe profit (loss) from discontinued operations. [Refer: Discontinued operations [member]; Profit (loss)] Reference 1: http://www.xbrl.org/2003/role/disclosureRef
-Name IFRS
-Number 5
-IssueDate 2022-03-24
-Paragraph 33
-Subparagraph a
-URI https://taxonomy.ifrs.org/xifrs-link?type=IFRS&num=5&code=ifrs-tx-2022-en-r&anchor=para_33_a&doctype=Standard
-URIDate 2022-03-24
Reference 2: http://www.xbrl.org/2003/role/disclosureRef
-Name IFRS
-Number 12
-IssueDate 2022-03-24
-Paragraph B12
-Subparagraph b
-Clause vii
-URI https://taxonomy.ifrs.org/xifrs-link?type=IFRS&num=12&code=ifrs-tx-2022-en-r&anchor=para_B12_b_vii&doctype=Appendix&subtype=B
-URIDate 2022-03-24
Reference 3: http://www.xbrl.org/2003/role/disclosureRef
-Name IAS
-Number 1
-IssueDate 2022-03-24
-Paragraph 82
-Subparagraph ea
-URI https://taxonomy.ifrs.org/xifrs-link?type=IAS&num=1&code=ifrs-tx-2022-en-r&anchor=para_82_ea&doctype=Standard
-URIDate 2022-03-24
Reference 4: http://www.xbrl.org/2003/role/disclosureRef
-Name IAS
-Number 1
-IssueDate 2022-03-24
-Paragraph 98
-Subparagraph e
-URI https://taxonomy.ifrs.org/xifrs-link?type=IAS&num=1&code=ifrs-tx-2022-en-r&anchor=para_98_e&doctype=Standard
-URIDate 2022-03-24
| Name: |
ifrs-full_ProfitLossFromDiscontinuedOperations |
| Namespace Prefix: |
ifrs-full_ |
| Data Type: |
xbrli:monetaryItemType |
| Balance Type: |
credit |
| Period Type: |
duration |
|
| X |
- DefinitionThe amount of reclassification adjustments related to exchange differences when the financial statements of foreign operations are translated, before tax. Reclassification adjustments are amounts reclassified to profit (loss) in the current period that were recognised in other comprehensive income in the current or previous periods. [Refer: Other comprehensive income] Reference 1: http://www.xbrl.org/2003/role/disclosureRef
-Name IAS
-Number 21
-IssueDate 2022-03-24
-Paragraph 48
-URI https://taxonomy.ifrs.org/xifrs-link?type=IAS&num=21&code=ifrs-tx-2022-en-r&anchor=para_48&doctype=Standard
-URIDate 2022-03-24
Reference 2: http://www.xbrl.org/2003/role/disclosureRef
-Name IAS
-Number 1
-IssueDate 2022-03-24
-Paragraph 92
-URI https://taxonomy.ifrs.org/xifrs-link?type=IAS&num=1&code=ifrs-tx-2022-en-r&anchor=para_92&doctype=Standard
-URIDate 2022-03-24
| Name: |
ifrs-full_ReclassificationAdjustmentsOnExchangeDifferencesOnTranslationBeforeTax |
| Namespace Prefix: |
ifrs-full_ |
| Data Type: |
xbrli:monetaryItemType |
| Balance Type: |
debit |
| Period Type: |
duration |
|
| X |
- DefinitionShare of the other comprehensive income of associates and joint ventures accounted for using the equity method that will be reclassified to profit or loss, net of tax. Reference 1: http://www.xbrl.org/2003/role/disclosureRef
-Name IAS
-Number 1
-IssueDate 2022-03-24
-Paragraph 82A
-URI https://taxonomy.ifrs.org/xifrs-link?type=IAS&num=1&code=ifrs-tx-2022-en-r&anchor=para_82A&doctype=Standard
-URIDate 2022-03-24
| Name: |
ifrs-full_ShareOfOtherComprehensiveIncomeOfAssociatesAndJointVenturesAccountedForUsingEquityMethodThatWillBeReclassifiedToProfitOrLossNetOfTax |
| Namespace Prefix: |
ifrs-full_ |
| Data Type: |
xbrli:monetaryItemType |
| Balance Type: |
credit |
| Period Type: |
duration |
|
| X |
- References
+ Details
| Name: |
ifrs-full_StatementOfComprehensiveIncomeAbstract |
| Namespace Prefix: |
ifrs-full_ |
| Data Type: |
xbrli:stringItemType |
| Balance Type: |
na |
| Period Type: |
duration |
|
| X |
- DefinitionGains (Losses) On Cost Of Hedging, Before Tax
| Name: |
nggtf_GainsLossesOnCostOfHedgingBeforeTax |
| Namespace Prefix: |
nggtf_ |
| Data Type: |
xbrli:monetaryItemType |
| Balance Type: |
credit |
| Period Type: |
duration |
|
| X |
- DefinitionGains (Losses) On Investments In Debt Instruments Measured At Fair Value Through Other Comprehensive Income
| Name: |
nggtf_GainsLossesOnInvestmentsInDebtInstrumentsMeasuredAtFairValueThroughOtherComprehensiveIncome |
| Namespace Prefix: |
nggtf_ |
| Data Type: |
xbrli:monetaryItemType |
| Balance Type: |
credit |
| Period Type: |
duration |
|
| X |
- DefinitionOther Comprehensive Income, Before Tax, Gains (Losses) In Respect Of Cash Flow Hedging Of Capital Expenditure
| Name: |
nggtf_OtherComprehensiveIncomeBeforeTaxGainsLossesInRespectOfCashFlowHedgingOfCapitalExpenditure |
| Namespace Prefix: |
nggtf_ |
| Data Type: |
xbrli:monetaryItemType |
| Balance Type: |
credit |
| Period Type: |
duration |
|
| X |
- DefinitionOther Comprehensive Income, From Continuing Operations
| Name: |
nggtf_OtherComprehensiveIncomeFromContinuingOperations |
| Namespace Prefix: |
nggtf_ |
| Data Type: |
xbrli:monetaryItemType |
| Balance Type: |
credit |
| Period Type: |
duration |
|
| X |
- DefinitionOther Comprehensive Income, From Discontinued Operations
| Name: |
nggtf_OtherComprehensiveIncomeFromDiscontinuedOperations |
| Namespace Prefix: |
nggtf_ |
| Data Type: |
xbrli:monetaryItemType |
| Balance Type: |
credit |
| Period Type: |
duration |
|
v3.23.3
Consolidated statement of changes in equity - GBP (£)
£ in Millions |
Total |
Total share-holders’ equity |
Share capital |
Share premium account |
Retained earnings |
Other equity reserves |
Non-controlling interests |
| Equity, beginning balance at Mar. 31, 2022 |
£ 23,856
|
|
£ 23,833
|
£ 485
|
£ 1,300
|
£ 26,611
|
£ (4,563)
|
£ 23
|
| Profit for the period |
1,256
|
[1] |
1,256
|
|
|
1,256
|
|
|
| Other comprehensive (loss)/income for the period |
1,925
|
[2] |
1,922
|
|
|
(564)
|
2,486
|
3
|
| Total comprehensive income for the period |
3,181
|
[2] |
3,178
|
|
|
692
|
2,486
|
3
|
| Equity dividends |
(1,119)
|
|
(1,119)
|
|
|
(1,119)
|
|
|
| Scrip dividend-related share issue |
0
|
|
0
|
1
|
(1)
|
|
|
|
| Issue of treasury shares |
14
|
|
14
|
|
|
14
|
|
|
| Transactions in own shares |
2
|
|
2
|
|
5
|
(3)
|
|
|
| Share-based payments |
20
|
|
20
|
|
|
20
|
|
|
| Cash flow hedges transferred to the statement of financial position, net of tax |
3
|
|
3
|
|
|
|
3
|
|
| Equity, ending balance at Sep. 30, 2022 |
25,957
|
|
25,931
|
486
|
1,304
|
26,215
|
(2,074)
|
26
|
| Equity, beginning balance at Mar. 31, 2023 |
29,562
|
|
29,538
|
488
|
1,302
|
31,608
|
(3,860)
|
24
|
| Profit for the period |
1,129
|
|
1,128
|
|
|
1,128
|
|
1
|
| Other comprehensive (loss)/income for the period |
74
|
|
74
|
|
|
(199)
|
273
|
|
| Total comprehensive income for the period |
1,203
|
|
1,202
|
|
|
929
|
273
|
1
|
| Equity dividends |
(1,325)
|
|
(1,325)
|
|
|
(1,325)
|
|
|
| Scrip dividend-related share issue |
0
|
|
0
|
1
|
(1)
|
|
|
|
| Issue of treasury shares |
20
|
|
20
|
|
|
20
|
|
|
| Transactions in own shares |
(1)
|
|
(1)
|
|
|
(1)
|
|
|
| Share-based payments |
19
|
|
19
|
|
|
19
|
|
|
| Cash flow hedges transferred to the statement of financial position, net of tax |
2
|
|
2
|
|
|
|
2
|
|
| Equity, ending balance at Sep. 30, 2023 |
£ 29,480
|
|
£ 29,455
|
£ 489
|
£ 1,301
|
£ 31,250
|
£ (3,585)
|
£ 25
|
|
|
| X |
- DefinitionThe amount of change in equity resulting from transactions and other events, other than those changes resulting from transactions with owners in their capacity as owners. Reference 1: http://www.xbrl.org/2003/role/disclosureRef
-Name IFRS
-Number 1
-IssueDate 2022-03-24
-Paragraph 32
-Subparagraph a
-Clause ii
-URI https://taxonomy.ifrs.org/xifrs-link?type=IFRS&num=1&code=ifrs-tx-2022-en-r&anchor=para_32_a_ii&doctype=Standard
-URIDate 2022-03-24
Reference 2: http://www.xbrl.org/2003/role/disclosureRef
-Name IFRS
-Number 1
-IssueDate 2022-03-24
-Paragraph 24
-Subparagraph b
-URI https://taxonomy.ifrs.org/xifrs-link?type=IFRS&num=1&code=ifrs-tx-2022-en-r&anchor=para_24_b&doctype=Standard
-URIDate 2022-03-24
Reference 3: http://www.xbrl.org/2003/role/disclosureRef
-Name IFRS
-Number 12
-IssueDate 2022-03-24
-Paragraph B12
-Subparagraph b
-Clause ix
-URI https://taxonomy.ifrs.org/xifrs-link?type=IFRS&num=12&code=ifrs-tx-2022-en-r&anchor=para_B12_b_ix&doctype=Appendix&subtype=B
-URIDate 2022-03-24
Reference 4: http://www.xbrl.org/2003/role/exampleRef
-Name IFRS
-Number 12
-IssueDate 2022-03-24
-Paragraph B10
-Subparagraph b
-URI https://taxonomy.ifrs.org/xifrs-link?type=IFRS&num=12&code=ifrs-tx-2022-en-r&anchor=para_B10_b&doctype=Appendix&subtype=B
-URIDate 2022-03-24
Reference 5: http://www.xbrl.org/2003/role/disclosureRef
-Name IAS
-Number 1
-IssueDate 2022-03-24
-Paragraph 81A
-Subparagraph c
-URI https://taxonomy.ifrs.org/xifrs-link?type=IAS&num=1&code=ifrs-tx-2022-en-r&anchor=para_81A_c&doctype=Standard
-URIDate 2022-03-24
Reference 6: http://www.xbrl.org/2003/role/disclosureRef
-Name IAS
-Number 1
-IssueDate 2022-03-24
-Paragraph 106
-Subparagraph a
-URI https://taxonomy.ifrs.org/xifrs-link?type=IAS&num=1&code=ifrs-tx-2022-en-r&anchor=para_106_a&doctype=Standard
-URIDate 2022-03-24
| Name: |
ifrs-full_ComprehensiveIncome |
| Namespace Prefix: |
ifrs-full_ |
| Data Type: |
xbrli:monetaryItemType |
| Balance Type: |
credit |
| Period Type: |
duration |
|
| X |
- DefinitionThe amount of dividends recognised as distributions to owners. Reference 1: http://www.xbrl.org/2003/role/disclosureRef
-Name IAS
-Number 1
-IssueDate 2022-03-24
-Paragraph 107
-URI https://taxonomy.ifrs.org/xifrs-link?type=IAS&num=1&code=ifrs-tx-2022-en-r&anchor=para_107&doctype=Standard
-URIDate 2022-03-24
| Name: |
ifrs-full_DividendsPaid |
| Namespace Prefix: |
ifrs-full_ |
| Data Type: |
xbrli:monetaryItemType |
| Balance Type: |
debit |
| Period Type: |
duration |
|
| X |
- DefinitionThe amount of residual interest in the assets of the entity after deducting all its liabilities. Reference 1: http://www.xbrl.org/2003/role/disclosureRef
-Name IFRS
-Number 1
-IssueDate 2022-03-24
-Paragraph 24
-Subparagraph a
-URI https://taxonomy.ifrs.org/xifrs-link?type=IFRS&num=1&code=ifrs-tx-2022-en-r&anchor=para_24_a&doctype=Standard
-URIDate 2022-03-24
Reference 2: http://www.xbrl.org/2003/role/disclosureRef
-Name IFRS
-Number 1
-IssueDate 2022-03-24
-Paragraph 32
-Subparagraph a
-Clause i
-URI https://taxonomy.ifrs.org/xifrs-link?type=IFRS&num=1&code=ifrs-tx-2022-en-r&anchor=para_32_a_i&doctype=Standard
-URIDate 2022-03-24
Reference 3: http://www.xbrl.org/2003/role/disclosureRef
-Name IFRS
-Number 13
-IssueDate 2022-03-24
-Paragraph 93
-Subparagraph a
-URI https://taxonomy.ifrs.org/xifrs-link?type=IFRS&num=13&code=ifrs-tx-2022-en-r&anchor=para_93_a&doctype=Standard
-URIDate 2022-03-24
Reference 4: http://www.xbrl.org/2003/role/disclosureRef
-Name IFRS
-Number 13
-IssueDate 2022-03-24
-Paragraph 93
-Subparagraph b
-URI https://taxonomy.ifrs.org/xifrs-link?type=IFRS&num=13&code=ifrs-tx-2022-en-r&anchor=para_93_b&doctype=Standard
-URIDate 2022-03-24
Reference 5: http://www.xbrl.org/2003/role/disclosureRef
-Name IFRS
-Number 13
-IssueDate 2022-03-24
-Paragraph 93
-Subparagraph e
-URI https://taxonomy.ifrs.org/xifrs-link?type=IFRS&num=13&code=ifrs-tx-2022-en-r&anchor=para_93_e&doctype=Standard
-URIDate 2022-03-24
Reference 6: http://www.xbrl.org/2003/role/disclosureRef
-Name IAS
-Number 1
-IssueDate 2022-03-24
-Paragraph 55
-URI https://taxonomy.ifrs.org/xifrs-link?type=IAS&num=1&code=ifrs-tx-2022-en-r&anchor=para_55&doctype=Standard
-URIDate 2022-03-24
Reference 7: http://www.xbrl.org/2003/role/disclosureRef
-Name IAS
-Number 1
-IssueDate 2022-03-24
-Paragraph 78
-Subparagraph e
-URI https://taxonomy.ifrs.org/xifrs-link?type=IAS&num=1&code=ifrs-tx-2022-en-r&anchor=para_78_e&doctype=Standard
-URIDate 2022-03-24
| Name: |
ifrs-full_Equity |
| Namespace Prefix: |
ifrs-full_ |
| Data Type: |
xbrli:monetaryItemType |
| Balance Type: |
credit |
| Period Type: |
instant |
|
| X |
- DefinitionThe increase (decrease) in equity resulting from share-based payment transactions. [Refer: Equity] Reference 1: http://www.xbrl.org/2003/role/disclosureRef
-Name IAS
-Number 1
-IssueDate 2022-03-24
-Paragraph 106
-Subparagraph d
-Clause iii
-URI https://taxonomy.ifrs.org/xifrs-link?type=IAS&num=1&code=ifrs-tx-2022-en-r&anchor=para_106_d_iii&doctype=Standard
-URIDate 2022-03-24
| Name: |
ifrs-full_IncreaseDecreaseThroughSharebasedPaymentTransactions |
| Namespace Prefix: |
ifrs-full_ |
| Data Type: |
xbrli:monetaryItemType |
| Balance Type: |
credit |
| Period Type: |
duration |
|
| X |
- DefinitionThe increase (decrease) in equity resulting from treasury share transactions. [Refer: Equity; Treasury shares] Reference 1: http://www.xbrl.org/2003/role/disclosureRef
-Name IAS
-Number 1
-IssueDate 2022-03-24
-Paragraph 106
-Subparagraph d
-URI https://taxonomy.ifrs.org/xifrs-link?type=IAS&num=1&code=ifrs-tx-2022-en-r&anchor=para_106_d&doctype=Standard
-URIDate 2022-03-24
| Name: |
ifrs-full_IncreaseDecreaseThroughTreasuryShareTransactions |
| Namespace Prefix: |
ifrs-full_ |
| Data Type: |
xbrli:monetaryItemType |
| Balance Type: |
credit |
| Period Type: |
duration |
|
| X |
- DefinitionThe amount of income and expense (including reclassification adjustments) that is not recognised in profit or loss as required or permitted by IFRSs. [Refer: IFRSs [member]] Reference 1: http://www.xbrl.org/2003/role/disclosureRef
-Name IFRS
-Number 12
-IssueDate 2022-03-24
-Paragraph B12
-Subparagraph b
-Clause viii
-URI https://taxonomy.ifrs.org/xifrs-link?type=IFRS&num=12&code=ifrs-tx-2022-en-r&anchor=para_B12_b_viii&doctype=Appendix&subtype=B
-URIDate 2022-03-24
Reference 2: http://www.xbrl.org/2003/role/disclosureRef
-Name IAS
-Number 1
-IssueDate 2022-03-24
-Paragraph 81A
-Subparagraph b
-URI https://taxonomy.ifrs.org/xifrs-link?type=IAS&num=1&code=ifrs-tx-2022-en-r&anchor=para_81A_b&doctype=Standard
-URIDate 2022-03-24
Reference 3: http://www.xbrl.org/2003/role/disclosureRef
-Name IAS
-Number 1
-IssueDate 2022-03-24
-Paragraph 91
-Subparagraph a
-URI https://taxonomy.ifrs.org/xifrs-link?type=IAS&num=1&code=ifrs-tx-2022-en-r&anchor=para_91_a&doctype=Standard
-URIDate 2022-03-24
Reference 4: http://www.xbrl.org/2003/role/disclosureRef
-Name IAS
-Number 1
-IssueDate 2022-03-24
-Paragraph 106
-Subparagraph d
-Clause ii
-URI https://taxonomy.ifrs.org/xifrs-link?type=IAS&num=1&code=ifrs-tx-2022-en-r&anchor=para_106_d_ii&doctype=Standard
-URIDate 2022-03-24
| Name: |
ifrs-full_OtherComprehensiveIncome |
| Namespace Prefix: |
ifrs-full_ |
| Data Type: |
xbrli:monetaryItemType |
| Balance Type: |
credit |
| Period Type: |
duration |
|
| X |
- DefinitionThe total of income less expenses from continuing and discontinued operations, excluding the components of other comprehensive income. [Refer: Other comprehensive income] Reference 1: http://www.xbrl.org/2003/role/disclosureRef
-Name IAS
-Number 7
-IssueDate 2022-03-24
-Paragraph 18
-Subparagraph b
-URI https://taxonomy.ifrs.org/xifrs-link?type=IAS&num=7&code=ifrs-tx-2022-en-r&anchor=para_18_b&doctype=Standard
-URIDate 2022-03-24
Reference 2: http://www.xbrl.org/2003/role/disclosureRef
-Name IFRS
-Number 1
-IssueDate 2022-03-24
-Paragraph 32
-Subparagraph a
-Clause ii
-URI https://taxonomy.ifrs.org/xifrs-link?type=IFRS&num=1&code=ifrs-tx-2022-en-r&anchor=para_32_a_ii&doctype=Standard
-URIDate 2022-03-24
Reference 3: http://www.xbrl.org/2003/role/disclosureRef
-Name IFRS
-Number 1
-IssueDate 2022-03-24
-Paragraph 24
-Subparagraph b
-URI https://taxonomy.ifrs.org/xifrs-link?type=IFRS&num=1&code=ifrs-tx-2022-en-r&anchor=para_24_b&doctype=Standard
-URIDate 2022-03-24
Reference 4: http://www.xbrl.org/2003/role/disclosureRef
-Name IFRS
-Number 8
-IssueDate 2022-03-24
-Paragraph 28
-Subparagraph b
-URI https://taxonomy.ifrs.org/xifrs-link?type=IFRS&num=8&code=ifrs-tx-2022-en-r&anchor=para_28_b&doctype=Standard
-URIDate 2022-03-24
Reference 5: http://www.xbrl.org/2003/role/exampleRef
-Note Effective on first application of IFRS 9
-Name IFRS
-Number 4
-IssueDate 2022-03-24
-Paragraph 39L
-Subparagraph e
-URI https://taxonomy.ifrs.org/xifrs-link?type=IFRS&num=4&code=ifrs-tx-2022-en-b&anchor=para_39L_e&doctype=Standard
-URIDate 2022-03-24
Reference 6: http://www.xbrl.org/2003/role/disclosureRef
-Name IFRS
-Number 8
-IssueDate 2022-03-24
-Paragraph 23
-URI https://taxonomy.ifrs.org/xifrs-link?type=IFRS&num=8&code=ifrs-tx-2022-en-r&anchor=para_23&doctype=Standard
-URIDate 2022-03-24
Reference 7: http://www.xbrl.org/2003/role/exampleRef
-Name IFRS
-Number 12
-IssueDate 2022-03-24
-Paragraph B10
-Subparagraph b
-URI https://taxonomy.ifrs.org/xifrs-link?type=IFRS&num=12&code=ifrs-tx-2022-en-r&anchor=para_B10_b&doctype=Appendix&subtype=B
-URIDate 2022-03-24
Reference 8: http://www.xbrl.org/2003/role/exampleRef
-Note Effective 2023-01-01
-Name IFRS
-Number 17
-IssueDate 2022-03-24
-Paragraph 113
-Subparagraph b
-URI https://taxonomy.ifrs.org/xifrs-link?type=IFRS&num=17&code=ifrs-tx-2022-en-r&anchor=para_113_b&doctype=Standard
-URIDate 2022-03-24
Reference 9: http://www.xbrl.org/2003/role/disclosureRef
-Name IAS
-Number 1
-IssueDate 2022-03-24
-Paragraph 81A
-Subparagraph a
-URI https://taxonomy.ifrs.org/xifrs-link?type=IAS&num=1&code=ifrs-tx-2022-en-r&anchor=para_81A_a&doctype=Standard
-URIDate 2022-03-24
Reference 10: http://www.xbrl.org/2003/role/disclosureRef
-Name IAS
-Number 1
-IssueDate 2022-03-24
-Paragraph 106
-Subparagraph d
-Clause i
-URI https://taxonomy.ifrs.org/xifrs-link?type=IAS&num=1&code=ifrs-tx-2022-en-r&anchor=para_106_d_i&doctype=Standard
-URIDate 2022-03-24
| Name: |
ifrs-full_ProfitLoss |
| Namespace Prefix: |
ifrs-full_ |
| Data Type: |
xbrli:monetaryItemType |
| Balance Type: |
credit |
| Period Type: |
duration |
|
| X |
- DefinitionThe increase in equity resulting from the sale or issue of treasury shares. [Refer: Treasury shares] Reference 1: http://www.xbrl.org/2009/role/commonPracticeRef
-Name IAS
-Number 1
-IssueDate 2022-03-24
-Paragraph 106
-Subparagraph d
-URI https://taxonomy.ifrs.org/xifrs-link?type=IAS&num=1&code=ifrs-tx-2022-en-r&anchor=para_106_d&doctype=Standard
-URIDate 2022-03-24
| Name: |
ifrs-full_SaleOrIssueOfTreasuryShares |
| Namespace Prefix: |
ifrs-full_ |
| Data Type: |
xbrli:monetaryItemType |
| Balance Type: |
credit |
| Period Type: |
duration |
|
| X |
- DefinitionIncrease (Decrease) Through Cash Flow Hedges Transferred To The Statement Of Financial Position, After Tax, Equity
| Name: |
nggtf_IncreaseDecreaseThroughCashFlowHedgesTransferredToTheStatementOfFinancialPositionAfterTaxEquity |
| Namespace Prefix: |
nggtf_ |
| Data Type: |
xbrli:monetaryItemType |
| Balance Type: |
credit |
| Period Type: |
duration |
|
v3.23.3
Consolidated statement of financial position - GBP (£)
£ in Millions |
Sep. 30, 2023 |
Mar. 31, 2023 |
| Non-current assets |
|
|
| Goodwill |
£ 9,905
|
£ 9,847
|
| Other intangible assets |
3,717
|
3,604
|
| Property, plant and equipment |
67,396
|
64,433
|
| Other non-current assets |
570
|
567
|
| Pension assets |
2,352
|
2,645
|
| Financial and other investments |
871
|
859
|
| Investments in joint ventures and associates |
1,414
|
1,300
|
| Derivative financial assets |
325
|
276
|
| Total non-current assets |
86,550
|
83,531
|
| Current assets |
|
|
| Inventories and current intangible assets |
931
|
876
|
| Trade and other receivables |
3,340
|
3,883
|
| Current tax assets |
18
|
43
|
| Financial and other investments |
1,680
|
2,605
|
| Derivative financial assets |
60
|
153
|
| Cash and cash equivalents |
227
|
163
|
| Assets held for sale |
1,441
|
1,443
|
| Total current assets |
7,697
|
9,166
|
| Total assets |
94,247
|
92,697
|
| Current liabilities |
|
|
| Borrowings |
(2,691)
|
(2,955)
|
| Derivative financial liabilities |
(321)
|
(222)
|
| Trade and other payables |
(4,465)
|
(5,068)
|
| Contract liabilities |
(159)
|
(252)
|
| Current tax liabilities |
(231)
|
(236)
|
| Provisions |
(361)
|
(288)
|
| Liabilities held for sale |
(51)
|
(109)
|
| Total current liabilities |
(8,279)
|
(9,130)
|
| Non-current liabilities |
|
|
| Borrowings |
(42,106)
|
(40,030)
|
| Derivative financial liabilities |
(1,116)
|
(1,071)
|
| Other non-current liabilities |
(1,004)
|
(921)
|
| Contract liabilities |
(1,904)
|
(1,754)
|
| Deferred tax liabilities |
(7,318)
|
(7,181)
|
| Pensions and other post-retirement benefit obligations |
(615)
|
(694)
|
| Provisions |
(2,425)
|
(2,354)
|
| Total non-current liabilities |
(56,488)
|
(54,005)
|
| Total liabilities |
(64,767)
|
(63,135)
|
| Net assets |
29,480
|
29,562
|
| Equity |
|
|
| Share capital |
489
|
488
|
| Share premium account |
1,301
|
1,302
|
| Retained earnings |
31,250
|
31,608
|
| Other equity reserves |
(3,585)
|
(3,860)
|
| Total shareholders’ equity |
29,455
|
29,538
|
| Non-controlling interests |
25
|
24
|
| Total equity |
£ 29,480
|
£ 29,562
|
| X |
- DefinitionThe amount of a present economic resource controlled by the entity as a result of past events. Economic resource is a right that has the potential to produce economic benefits. Reference 1: http://www.xbrl.org/2003/role/disclosureRef
-Name IFRS
-Number 13
-IssueDate 2022-03-24
-Paragraph 93
-Subparagraph a
-URI https://taxonomy.ifrs.org/xifrs-link?type=IFRS&num=13&code=ifrs-tx-2022-en-r&anchor=para_93_a&doctype=Standard
-URIDate 2022-03-24
Reference 2: http://www.xbrl.org/2003/role/disclosureRef
-Name IFRS
-Number 8
-IssueDate 2022-03-24
-Paragraph 28
-Subparagraph c
-URI https://taxonomy.ifrs.org/xifrs-link?type=IFRS&num=8&code=ifrs-tx-2022-en-r&anchor=para_28_c&doctype=Standard
-URIDate 2022-03-24
Reference 3: http://www.xbrl.org/2003/role/disclosureRef
-Name IFRS
-Number 13
-IssueDate 2022-03-24
-Paragraph 93
-Subparagraph b
-URI https://taxonomy.ifrs.org/xifrs-link?type=IFRS&num=13&code=ifrs-tx-2022-en-r&anchor=para_93_b&doctype=Standard
-URIDate 2022-03-24
Reference 4: http://www.xbrl.org/2003/role/disclosureRef
-Name IFRS
-Number 13
-IssueDate 2022-03-24
-Paragraph 93
-Subparagraph e
-URI https://taxonomy.ifrs.org/xifrs-link?type=IFRS&num=13&code=ifrs-tx-2022-en-r&anchor=para_93_e&doctype=Standard
-URIDate 2022-03-24
Reference 5: http://www.xbrl.org/2003/role/disclosureRef
-Name IFRS
-Number 8
-IssueDate 2022-03-24
-Paragraph 23
-URI https://taxonomy.ifrs.org/xifrs-link?type=IFRS&num=8&code=ifrs-tx-2022-en-r&anchor=para_23&doctype=Standard
-URIDate 2022-03-24
Reference 6: http://www.xbrl.org/2003/role/disclosureRef
-Name IAS
-Number 1
-IssueDate 2022-03-24
-Paragraph 55
-URI https://taxonomy.ifrs.org/xifrs-link?type=IAS&num=1&code=ifrs-tx-2022-en-r&anchor=para_55&doctype=Standard
-URIDate 2022-03-24
| Name: |
ifrs-full_Assets |
| Namespace Prefix: |
ifrs-full_ |
| Data Type: |
xbrli:monetaryItemType |
| Balance Type: |
debit |
| Period Type: |
instant |
|
| X |
- DefinitionThe amount of cash on hand and demand deposits, along with short-term, highly liquid investments that are readily convertible to known amounts of cash and that are subject to an insignificant risk of changes in value. [Refer: Cash; Cash equivalents] Reference 1: http://www.xbrl.org/2003/role/disclosureRef
-Name IAS
-Number 7
-IssueDate 2022-03-24
-Paragraph 45
-URI https://taxonomy.ifrs.org/xifrs-link?type=IAS&num=7&code=ifrs-tx-2022-en-r&anchor=para_45&doctype=Standard
-URIDate 2022-03-24
Reference 2: http://www.xbrl.org/2003/role/disclosureRef
-Name IFRS
-Number 12
-IssueDate 2022-03-24
-Paragraph B13
-Subparagraph a
-URI https://taxonomy.ifrs.org/xifrs-link?type=IFRS&num=12&code=ifrs-tx-2022-en-r&anchor=para_B13_a&doctype=Appendix&subtype=B
-URIDate 2022-03-24
Reference 3: http://www.xbrl.org/2003/role/disclosureRef
-Name IAS
-Number 1
-IssueDate 2022-03-24
-Paragraph 54
-Subparagraph i
-URI https://taxonomy.ifrs.org/xifrs-link?type=IAS&num=1&code=ifrs-tx-2022-en-r&anchor=para_54_i&doctype=Standard
-URIDate 2022-03-24
| Name: |
ifrs-full_CashAndCashEquivalents |
| Namespace Prefix: |
ifrs-full_ |
| Data Type: |
xbrli:monetaryItemType |
| Balance Type: |
debit |
| Period Type: |
instant |
|
| X |
- DefinitionThe amount of assets that the entity (a) expects to realise or intends to sell or consume in its normal operating cycle; (b) holds primarily for the purpose of trading; (c) expects to realise within twelve months after the reporting period; or (d) classifies as cash or cash equivalents (as defined in IAS 7) unless the asset is restricted from being exchanged or used to settle a liability for at least twelve months after the reporting period. [Refer: Assets] Reference 1: http://www.xbrl.org/2003/role/disclosureRef
-Name IFRS
-Number 12
-IssueDate 2022-03-24
-Paragraph B12
-Subparagraph b
-Clause i
-URI https://taxonomy.ifrs.org/xifrs-link?type=IFRS&num=12&code=ifrs-tx-2022-en-r&anchor=para_B12_b_i&doctype=Appendix&subtype=B
-URIDate 2022-03-24
Reference 2: http://www.xbrl.org/2003/role/exampleRef
-Name IFRS
-Number 12
-IssueDate 2022-03-24
-Paragraph B10
-Subparagraph b
-URI https://taxonomy.ifrs.org/xifrs-link?type=IFRS&num=12&code=ifrs-tx-2022-en-r&anchor=para_B10_b&doctype=Appendix&subtype=B
-URIDate 2022-03-24
Reference 3: http://www.xbrl.org/2003/role/disclosureRef
-Name IAS
-Number 1
-IssueDate 2022-03-24
-Paragraph 66
-URI https://taxonomy.ifrs.org/xifrs-link?type=IAS&num=1&code=ifrs-tx-2022-en-r&anchor=para_66&doctype=Standard
-URIDate 2022-03-24
| Name: |
ifrs-full_CurrentAssets |
| Namespace Prefix: |
ifrs-full_ |
| Data Type: |
xbrli:monetaryItemType |
| Balance Type: |
debit |
| Period Type: |
instant |
|
| X |
- References
+ Details
| Name: |
ifrs-full_CurrentAssetsAbstract |
| Namespace Prefix: |
ifrs-full_ |
| Data Type: |
xbrli:stringItemType |
| Balance Type: |
na |
| Period Type: |
duration |
|
| X |
- DefinitionThe amount of current borrowings and current portion of non-current borrowings. [Refer: Borrowings] Reference 1: http://www.xbrl.org/2009/role/commonPracticeRef
-Name IAS
-Number 1
-IssueDate 2022-03-24
-Paragraph 55
-URI https://taxonomy.ifrs.org/xifrs-link?type=IAS&num=1&code=ifrs-tx-2022-en-r&anchor=para_55&doctype=Standard
-URIDate 2022-03-24
| Name: |
ifrs-full_CurrentBorrowingsAndCurrentPortionOfNoncurrentBorrowings |
| Namespace Prefix: |
ifrs-full_ |
| Data Type: |
xbrli:monetaryItemType |
| Balance Type: |
credit |
| Period Type: |
instant |
|
| X |
- DefinitionThe amount of current contract liabilities. [Refer: Contract liabilities] Reference 1: http://www.xbrl.org/2003/role/disclosureRef
-Name IFRS
-Number 15
-IssueDate 2022-03-24
-Paragraph 105
-URI https://taxonomy.ifrs.org/xifrs-link?type=IFRS&num=15&code=ifrs-tx-2022-en-r&anchor=para_105&doctype=Standard
-URIDate 2022-03-24
| Name: |
ifrs-full_CurrentContractLiabilities |
| Namespace Prefix: |
ifrs-full_ |
| Data Type: |
xbrli:monetaryItemType |
| Balance Type: |
credit |
| Period Type: |
instant |
|
| X |
- DefinitionThe amount of current derivative financial assets. [Refer: Derivative financial assets] Reference 1: http://www.xbrl.org/2009/role/commonPracticeRef
-Name IAS
-Number 1
-IssueDate 2022-03-24
-Paragraph 55
-URI https://taxonomy.ifrs.org/xifrs-link?type=IAS&num=1&code=ifrs-tx-2022-en-r&anchor=para_55&doctype=Standard
-URIDate 2022-03-24
| Name: |
ifrs-full_CurrentDerivativeFinancialAssets |
| Namespace Prefix: |
ifrs-full_ |
| Data Type: |
xbrli:monetaryItemType |
| Balance Type: |
debit |
| Period Type: |
instant |
|
| X |
- DefinitionThe amount of current derivative financial liabilities. [Refer: Derivative financial liabilities] Reference 1: http://www.xbrl.org/2009/role/commonPracticeRef
-Name IAS
-Number 1
-IssueDate 2022-03-24
-Paragraph 55
-URI https://taxonomy.ifrs.org/xifrs-link?type=IAS&num=1&code=ifrs-tx-2022-en-r&anchor=para_55&doctype=Standard
-URIDate 2022-03-24
| Name: |
ifrs-full_CurrentDerivativeFinancialLiabilities |
| Namespace Prefix: |
ifrs-full_ |
| Data Type: |
xbrli:monetaryItemType |
| Balance Type: |
credit |
| Period Type: |
instant |
|
| X |
- DefinitionExpiry date 2023-01-01: The amount of liabilities that: (a) the entity expects to settle in its normal operating cycle; (b) the entity holds primarily for the purpose of trading; (c) are due to be settled within twelve months after the reporting period; or (d) the entity does not have an unconditional right to defer settlement for at least twelve months after the reporting period.
Effective 2023-01-01: The amount of liabilities that: (a) the entity expects to settle in its normal operating cycle; (b) the entity holds primarily for the purpose of trading; (c) are due to be settled within twelve months after the reporting period; or (d) the entity does not have the right at the end of the reporting period to defer settlement for at least twelve months after the reporting period. Reference 1: http://www.xbrl.org/2003/role/disclosureRef
-Name IFRS
-Number 12
-IssueDate 2022-03-24
-Paragraph B12
-Subparagraph b
-Clause iii
-URI https://taxonomy.ifrs.org/xifrs-link?type=IFRS&num=12&code=ifrs-tx-2022-en-r&anchor=para_B12_b_iii&doctype=Appendix&subtype=B
-URIDate 2022-03-24
Reference 2: http://www.xbrl.org/2003/role/exampleRef
-Name IFRS
-Number 12
-IssueDate 2022-03-24
-Paragraph B10
-Subparagraph b
-URI https://taxonomy.ifrs.org/xifrs-link?type=IFRS&num=12&code=ifrs-tx-2022-en-r&anchor=para_B10_b&doctype=Appendix&subtype=B
-URIDate 2022-03-24
Reference 3: http://www.xbrl.org/2003/role/disclosureRef
-Name IAS
-Number 1
-IssueDate 2022-03-24
-Paragraph 69
-URI https://taxonomy.ifrs.org/xifrs-link?type=IAS&num=1&code=ifrs-tx-2022-en-r&anchor=para_69&doctype=Standard
-URIDate 2022-03-24
| Name: |
ifrs-full_CurrentLiabilities |
| Namespace Prefix: |
ifrs-full_ |
| Data Type: |
xbrli:monetaryItemType |
| Balance Type: |
credit |
| Period Type: |
instant |
|
| X |
- References
+ Details
| Name: |
ifrs-full_CurrentLiabilitiesAbstract |
| Namespace Prefix: |
ifrs-full_ |
| Data Type: |
xbrli:stringItemType |
| Balance Type: |
na |
| Period Type: |
duration |
|
| X |
- DefinitionThe current amount of current tax assets. [Refer: Current tax assets] Reference 1: http://www.xbrl.org/2003/role/disclosureRef
-Name IAS
-Number 1
-IssueDate 2022-03-24
-Paragraph 54
-Subparagraph n
-URI https://taxonomy.ifrs.org/xifrs-link?type=IAS&num=1&code=ifrs-tx-2022-en-r&anchor=para_54_n&doctype=Standard
-URIDate 2022-03-24
| Name: |
ifrs-full_CurrentTaxAssetsCurrent |
| Namespace Prefix: |
ifrs-full_ |
| Data Type: |
xbrli:monetaryItemType |
| Balance Type: |
debit |
| Period Type: |
instant |
|
| X |
- DefinitionThe current amount of current tax liabilities. [Refer: Current tax liabilities] Reference 1: http://www.xbrl.org/2003/role/disclosureRef
-Name IAS
-Number 1
-IssueDate 2022-03-24
-Paragraph 54
-Subparagraph n
-URI https://taxonomy.ifrs.org/xifrs-link?type=IAS&num=1&code=ifrs-tx-2022-en-r&anchor=para_54_n&doctype=Standard
-URIDate 2022-03-24
| Name: |
ifrs-full_CurrentTaxLiabilitiesCurrent |
| Namespace Prefix: |
ifrs-full_ |
| Data Type: |
xbrli:monetaryItemType |
| Balance Type: |
credit |
| Period Type: |
instant |
|
| X |
- DefinitionThe amounts of income taxes payable in future periods in respect of taxable temporary differences. [Refer: Temporary differences [member]] Reference 1: http://www.xbrl.org/2003/role/disclosureRef
-Name IAS
-Number 12
-IssueDate 2022-03-24
-Paragraph 81
-Subparagraph g
-Clause i
-URI https://taxonomy.ifrs.org/xifrs-link?type=IAS&num=12&code=ifrs-tx-2022-en-r&anchor=para_81_g_i&doctype=Standard
-URIDate 2022-03-24
Reference 2: http://www.xbrl.org/2003/role/disclosureRef
-Name IAS
-Number 1
-IssueDate 2022-03-24
-Paragraph 54
-Subparagraph o
-URI https://taxonomy.ifrs.org/xifrs-link?type=IAS&num=1&code=ifrs-tx-2022-en-r&anchor=para_54_o&doctype=Standard
-URIDate 2022-03-24
Reference 3: http://www.xbrl.org/2003/role/disclosureRef
-Name IAS
-Number 1
-IssueDate 2022-03-24
-Paragraph 56
-URI https://taxonomy.ifrs.org/xifrs-link?type=IAS&num=1&code=ifrs-tx-2022-en-r&anchor=para_56&doctype=Standard
-URIDate 2022-03-24
| Name: |
ifrs-full_DeferredTaxLiabilities |
| Namespace Prefix: |
ifrs-full_ |
| Data Type: |
xbrli:monetaryItemType |
| Balance Type: |
credit |
| Period Type: |
instant |
|
| X |
- DefinitionThe amount of residual interest in the assets of the entity after deducting all its liabilities. Reference 1: http://www.xbrl.org/2003/role/disclosureRef
-Name IFRS
-Number 1
-IssueDate 2022-03-24
-Paragraph 24
-Subparagraph a
-URI https://taxonomy.ifrs.org/xifrs-link?type=IFRS&num=1&code=ifrs-tx-2022-en-r&anchor=para_24_a&doctype=Standard
-URIDate 2022-03-24
Reference 2: http://www.xbrl.org/2003/role/disclosureRef
-Name IFRS
-Number 1
-IssueDate 2022-03-24
-Paragraph 32
-Subparagraph a
-Clause i
-URI https://taxonomy.ifrs.org/xifrs-link?type=IFRS&num=1&code=ifrs-tx-2022-en-r&anchor=para_32_a_i&doctype=Standard
-URIDate 2022-03-24
Reference 3: http://www.xbrl.org/2003/role/disclosureRef
-Name IFRS
-Number 13
-IssueDate 2022-03-24
-Paragraph 93
-Subparagraph a
-URI https://taxonomy.ifrs.org/xifrs-link?type=IFRS&num=13&code=ifrs-tx-2022-en-r&anchor=para_93_a&doctype=Standard
-URIDate 2022-03-24
Reference 4: http://www.xbrl.org/2003/role/disclosureRef
-Name IFRS
-Number 13
-IssueDate 2022-03-24
-Paragraph 93
-Subparagraph b
-URI https://taxonomy.ifrs.org/xifrs-link?type=IFRS&num=13&code=ifrs-tx-2022-en-r&anchor=para_93_b&doctype=Standard
-URIDate 2022-03-24
Reference 5: http://www.xbrl.org/2003/role/disclosureRef
-Name IFRS
-Number 13
-IssueDate 2022-03-24
-Paragraph 93
-Subparagraph e
-URI https://taxonomy.ifrs.org/xifrs-link?type=IFRS&num=13&code=ifrs-tx-2022-en-r&anchor=para_93_e&doctype=Standard
-URIDate 2022-03-24
Reference 6: http://www.xbrl.org/2003/role/disclosureRef
-Name IAS
-Number 1
-IssueDate 2022-03-24
-Paragraph 55
-URI https://taxonomy.ifrs.org/xifrs-link?type=IAS&num=1&code=ifrs-tx-2022-en-r&anchor=para_55&doctype=Standard
-URIDate 2022-03-24
Reference 7: http://www.xbrl.org/2003/role/disclosureRef
-Name IAS
-Number 1
-IssueDate 2022-03-24
-Paragraph 78
-Subparagraph e
-URI https://taxonomy.ifrs.org/xifrs-link?type=IAS&num=1&code=ifrs-tx-2022-en-r&anchor=para_78_e&doctype=Standard
-URIDate 2022-03-24
| Name: |
ifrs-full_Equity |
| Namespace Prefix: |
ifrs-full_ |
| Data Type: |
xbrli:monetaryItemType |
| Balance Type: |
credit |
| Period Type: |
instant |
|
| X |
- References
+ Details
| Name: |
ifrs-full_EquityAbstract |
| Namespace Prefix: |
ifrs-full_ |
| Data Type: |
xbrli:stringItemType |
| Balance Type: |
na |
| Period Type: |
duration |
|
| X |
- DefinitionThe amount of equity attributable to the owners of the parent. This specifically excludes non-controlling interest. Reference 1: http://www.xbrl.org/2003/role/disclosureRef
-Name IAS
-Number 1
-IssueDate 2022-03-24
-Paragraph 54
-Subparagraph r
-URI https://taxonomy.ifrs.org/xifrs-link?type=IAS&num=1&code=ifrs-tx-2022-en-r&anchor=para_54_r&doctype=Standard
-URIDate 2022-03-24
| Name: |
ifrs-full_EquityAttributableToOwnersOfParent |
| Namespace Prefix: |
ifrs-full_ |
| Data Type: |
xbrli:monetaryItemType |
| Balance Type: |
credit |
| Period Type: |
instant |
|
| X |
- DefinitionThe amount of assets representing the future economic benefits arising from other assets acquired in a business combination that are not individually identified and separately recognised. [Refer: Business combinations [member]] Reference 1: http://www.xbrl.org/2003/role/disclosureRef
-Name IAS
-Number 36
-IssueDate 2022-03-24
-Paragraph 134
-Subparagraph a
-URI https://taxonomy.ifrs.org/xifrs-link?type=IAS&num=36&code=ifrs-tx-2022-en-r&anchor=para_134_a&doctype=Standard
-URIDate 2022-03-24
Reference 2: http://www.xbrl.org/2003/role/disclosureRef
-Name IAS
-Number 36
-IssueDate 2022-03-24
-Paragraph 135
-Subparagraph a
-URI https://taxonomy.ifrs.org/xifrs-link?type=IAS&num=36&code=ifrs-tx-2022-en-r&anchor=para_135_a&doctype=Standard
-URIDate 2022-03-24
Reference 3: http://www.xbrl.org/2003/role/disclosureRef
-Name IFRS
-Number 3
-IssueDate 2022-03-24
-Paragraph B67
-Subparagraph d
-URI https://taxonomy.ifrs.org/xifrs-link?type=IFRS&num=3&code=ifrs-tx-2022-en-r&anchor=para_B67_d&doctype=Appendix&subtype=B
-URIDate 2022-03-24
Reference 4: http://www.xbrl.org/2003/role/disclosureRef
-Name IAS
-Number 1
-IssueDate 2022-03-24
-Paragraph 54
-Subparagraph c
-URI https://taxonomy.ifrs.org/xifrs-link?type=IAS&num=1&code=ifrs-tx-2022-en-r&anchor=para_54_c&doctype=Standard
-URIDate 2022-03-24
| Name: |
ifrs-full_Goodwill |
| Namespace Prefix: |
ifrs-full_ |
| Data Type: |
xbrli:monetaryItemType |
| Balance Type: |
debit |
| Period Type: |
instant |
|
| X |
- DefinitionThe amount of identifiable non-monetary assets without physical substance. This amount does not include goodwill. [Refer: Goodwill] Reference 1: http://www.xbrl.org/2003/role/disclosureRef
-Name IAS
-Number 38
-IssueDate 2022-03-24
-Paragraph 118
-Subparagraph e
-URI https://taxonomy.ifrs.org/xifrs-link?type=IAS&num=38&code=ifrs-tx-2022-en-r&anchor=para_118_e&doctype=Standard
-URIDate 2022-03-24
Reference 2: http://www.xbrl.org/2003/role/disclosureRef
-Name IAS
-Number 1
-IssueDate 2022-03-24
-Paragraph 54
-Subparagraph c
-URI https://taxonomy.ifrs.org/xifrs-link?type=IAS&num=1&code=ifrs-tx-2022-en-r&anchor=para_54_c&doctype=Standard
-URIDate 2022-03-24
| Name: |
ifrs-full_IntangibleAssetsOtherThanGoodwill |
| Namespace Prefix: |
ifrs-full_ |
| Data Type: |
xbrli:monetaryItemType |
| Balance Type: |
debit |
| Period Type: |
instant |
|
| X |
- DefinitionThe amount of current inventories. [Refer: Inventories] Reference 1: http://www.xbrl.org/2003/role/disclosureRef
-Name IAS
-Number 2
-IssueDate 2022-03-24
-Paragraph 36
-Subparagraph b
-URI https://taxonomy.ifrs.org/xifrs-link?type=IAS&num=2&code=ifrs-tx-2022-en-r&anchor=para_36_b&doctype=Standard
-URIDate 2022-03-24
Reference 2: http://www.xbrl.org/2003/role/disclosureRef
-Name IAS
-Number 1
-IssueDate 2022-03-24
-Paragraph 54
-Subparagraph g
-URI https://taxonomy.ifrs.org/xifrs-link?type=IAS&num=1&code=ifrs-tx-2022-en-r&anchor=para_54_g&doctype=Standard
-URIDate 2022-03-24
Reference 3: http://www.xbrl.org/2003/role/exampleRef
-Name IAS
-Number 1
-IssueDate 2022-03-24
-Paragraph 68
-URI https://taxonomy.ifrs.org/xifrs-link?type=IAS&num=1&code=ifrs-tx-2022-en-r&anchor=para_68&doctype=Standard
-URIDate 2022-03-24
| Name: |
ifrs-full_Inventories |
| Namespace Prefix: |
ifrs-full_ |
| Data Type: |
xbrli:monetaryItemType |
| Balance Type: |
debit |
| Period Type: |
instant |
|
| X |
- DefinitionThe amount of investments accounted for using the equity method. The equity method is a method of accounting whereby the investment is initially recognised at cost and adjusted thereafter for the post-acquisition change in the investor's share of net assets of the investee. The investor's profit or loss includes its share of the profit or loss of the investee. The investor's other comprehensive income includes its share of the other comprehensive income of the investee. [Refer: At cost [member]] Reference 1: http://www.xbrl.org/2003/role/disclosureRef
-Name IFRS
-Number 8
-IssueDate 2022-03-24
-Paragraph 24
-Subparagraph a
-URI https://taxonomy.ifrs.org/xifrs-link?type=IFRS&num=8&code=ifrs-tx-2022-en-r&anchor=para_24_a&doctype=Standard
-URIDate 2022-03-24
Reference 2: http://www.xbrl.org/2003/role/disclosureRef
-Name IAS
-Number 1
-IssueDate 2022-03-24
-Paragraph 54
-Subparagraph e
-URI https://taxonomy.ifrs.org/xifrs-link?type=IAS&num=1&code=ifrs-tx-2022-en-r&anchor=para_54_e&doctype=Standard
-URIDate 2022-03-24
Reference 3: http://www.xbrl.org/2003/role/disclosureRef
-Name IFRS
-Number 12
-IssueDate 2022-03-24
-Paragraph B16
-URI https://taxonomy.ifrs.org/xifrs-link?type=IFRS&num=12&code=ifrs-tx-2022-en-r&anchor=para_B16&doctype=Appendix&subtype=B
-URIDate 2022-03-24
| Name: |
ifrs-full_InvestmentAccountedForUsingEquityMethod |
| Namespace Prefix: |
ifrs-full_ |
| Data Type: |
xbrli:monetaryItemType |
| Balance Type: |
debit |
| Period Type: |
instant |
|
| X |
- DefinitionThe nominal value of capital issued. Reference 1: http://www.xbrl.org/2003/role/exampleRef
-Name IAS
-Number 1
-IssueDate 2022-03-24
-Paragraph 78
-Subparagraph e
-URI https://taxonomy.ifrs.org/xifrs-link?type=IAS&num=1&code=ifrs-tx-2022-en-r&anchor=para_78_e&doctype=Standard
-URIDate 2022-03-24
| Name: |
ifrs-full_IssuedCapital |
| Namespace Prefix: |
ifrs-full_ |
| Data Type: |
xbrli:monetaryItemType |
| Balance Type: |
credit |
| Period Type: |
instant |
|
| X |
- DefinitionThe amount of a present obligation of the entity to transfer an economic resource as a result of past events. Economic resource is a right that has the potential to produce economic benefits. Reference 1: http://www.xbrl.org/2003/role/disclosureRef
-Name IFRS
-Number 13
-IssueDate 2022-03-24
-Paragraph 93
-Subparagraph a
-URI https://taxonomy.ifrs.org/xifrs-link?type=IFRS&num=13&code=ifrs-tx-2022-en-r&anchor=para_93_a&doctype=Standard
-URIDate 2022-03-24
Reference 2: http://www.xbrl.org/2003/role/disclosureRef
-Name IFRS
-Number 13
-IssueDate 2022-03-24
-Paragraph 93
-Subparagraph b
-URI https://taxonomy.ifrs.org/xifrs-link?type=IFRS&num=13&code=ifrs-tx-2022-en-r&anchor=para_93_b&doctype=Standard
-URIDate 2022-03-24
Reference 3: http://www.xbrl.org/2003/role/disclosureRef
-Name IFRS
-Number 13
-IssueDate 2022-03-24
-Paragraph 93
-Subparagraph e
-URI https://taxonomy.ifrs.org/xifrs-link?type=IFRS&num=13&code=ifrs-tx-2022-en-r&anchor=para_93_e&doctype=Standard
-URIDate 2022-03-24
Reference 4: http://www.xbrl.org/2003/role/disclosureRef
-Name IFRS
-Number 8
-IssueDate 2022-03-24
-Paragraph 28
-Subparagraph d
-URI https://taxonomy.ifrs.org/xifrs-link?type=IFRS&num=8&code=ifrs-tx-2022-en-r&anchor=para_28_d&doctype=Standard
-URIDate 2022-03-24
Reference 5: http://www.xbrl.org/2003/role/disclosureRef
-Name IFRS
-Number 8
-IssueDate 2022-03-24
-Paragraph 23
-URI https://taxonomy.ifrs.org/xifrs-link?type=IFRS&num=8&code=ifrs-tx-2022-en-r&anchor=para_23&doctype=Standard
-URIDate 2022-03-24
Reference 6: http://www.xbrl.org/2003/role/disclosureRef
-Name IAS
-Number 1
-IssueDate 2022-03-24
-Paragraph 55
-URI https://taxonomy.ifrs.org/xifrs-link?type=IAS&num=1&code=ifrs-tx-2022-en-r&anchor=para_55&doctype=Standard
-URIDate 2022-03-24
| Name: |
ifrs-full_Liabilities |
| Namespace Prefix: |
ifrs-full_ |
| Data Type: |
xbrli:monetaryItemType |
| Balance Type: |
credit |
| Period Type: |
instant |
|
| X |
- DefinitionThe amount of liabilities included in disposal groups classified as held for sale. [Refer: Liabilities; Disposal groups classified as held for sale [member]] Reference 1: http://www.xbrl.org/2003/role/disclosureRef
-Name IFRS
-Number 5
-IssueDate 2022-03-24
-Paragraph 38
-URI https://taxonomy.ifrs.org/xifrs-link?type=IFRS&num=5&code=ifrs-tx-2022-en-r&anchor=para_38&doctype=Standard
-URIDate 2022-03-24
Reference 2: http://www.xbrl.org/2003/role/disclosureRef
-Name IAS
-Number 1
-IssueDate 2022-03-24
-Paragraph 54
-Subparagraph p
-URI https://taxonomy.ifrs.org/xifrs-link?type=IAS&num=1&code=ifrs-tx-2022-en-r&anchor=para_54_p&doctype=Standard
-URIDate 2022-03-24
| Name: |
ifrs-full_LiabilitiesIncludedInDisposalGroupsClassifiedAsHeldForSale |
| Namespace Prefix: |
ifrs-full_ |
| Data Type: |
xbrli:monetaryItemType |
| Balance Type: |
credit |
| Period Type: |
instant |
|
| X |
- DefinitionThe non-current portion of non-current borrowings. [Refer: Borrowings] Reference 1: http://www.xbrl.org/2009/role/commonPracticeRef
-Name IAS
-Number 1
-IssueDate 2022-03-24
-Paragraph 55
-URI https://taxonomy.ifrs.org/xifrs-link?type=IAS&num=1&code=ifrs-tx-2022-en-r&anchor=para_55&doctype=Standard
-URIDate 2022-03-24
| Name: |
ifrs-full_LongtermBorrowings |
| Namespace Prefix: |
ifrs-full_ |
| Data Type: |
xbrli:monetaryItemType |
| Balance Type: |
credit |
| Period Type: |
instant |
|
| X |
- DefinitionThe amount of assets less the amount of liabilities. Reference 1: http://www.xbrl.org/2003/role/exampleRef
-Name IFRS
-Number 1
-IssueDate 2022-03-24
-Paragraph IG63
-URI https://taxonomy.ifrs.org/xifrs-link?type=IFRS&num=1&code=ifrs-tx-2022-en-r&anchor=para_IG63&doctype=Implementation%20Guidance
-URIDate 2022-03-24
Reference 2: http://www.xbrl.org/2009/role/commonPracticeRef
-Name IAS
-Number 1
-IssueDate 2022-03-24
-Paragraph 112
-Subparagraph c
-URI https://taxonomy.ifrs.org/xifrs-link?type=IAS&num=1&code=ifrs-tx-2022-en-r&anchor=para_112_c&doctype=Standard
-URIDate 2022-03-24
| Name: |
ifrs-full_NetAssetsLiabilities |
| Namespace Prefix: |
ifrs-full_ |
| Data Type: |
xbrli:monetaryItemType |
| Balance Type: |
debit |
| Period Type: |
instant |
|
| X |
- DefinitionThe amount of equity in a subsidiary not attributable, directly or indirectly, to a parent. [Refer: Subsidiaries [member]] Reference 1: http://www.xbrl.org/2003/role/disclosureRef
-Name IFRS
-Number 12
-IssueDate 2022-03-24
-Paragraph 12
-Subparagraph f
-URI https://taxonomy.ifrs.org/xifrs-link?type=IFRS&num=12&code=ifrs-tx-2022-en-r&anchor=para_12_f&doctype=Standard
-URIDate 2022-03-24
Reference 2: http://www.xbrl.org/2003/role/disclosureRef
-Name IFRS
-Number 10
-IssueDate 2022-03-24
-Paragraph 22
-URI https://taxonomy.ifrs.org/xifrs-link?type=IFRS&num=10&code=ifrs-tx-2022-en-r&anchor=para_22&doctype=Standard
-URIDate 2022-03-24
Reference 3: http://www.xbrl.org/2003/role/disclosureRef
-Name IAS
-Number 1
-IssueDate 2022-03-24
-Paragraph 54
-Subparagraph q
-URI https://taxonomy.ifrs.org/xifrs-link?type=IAS&num=1&code=ifrs-tx-2022-en-r&anchor=para_54_q&doctype=Standard
-URIDate 2022-03-24
| Name: |
ifrs-full_NoncontrollingInterests |
| Namespace Prefix: |
ifrs-full_ |
| Data Type: |
xbrli:monetaryItemType |
| Balance Type: |
credit |
| Period Type: |
instant |
|
| X |
- DefinitionThe amount of assets that do not meet the definition of current assets. [Refer: Current assets] Reference 1: http://www.xbrl.org/2003/role/disclosureRef
-Name IFRS
-Number 12
-IssueDate 2022-03-24
-Paragraph B12
-Subparagraph b
-Clause ii
-URI https://taxonomy.ifrs.org/xifrs-link?type=IFRS&num=12&code=ifrs-tx-2022-en-r&anchor=para_B12_b_ii&doctype=Appendix&subtype=B
-URIDate 2022-03-24
Reference 2: http://www.xbrl.org/2003/role/exampleRef
-Name IFRS
-Number 12
-IssueDate 2022-03-24
-Paragraph B10
-Subparagraph b
-URI https://taxonomy.ifrs.org/xifrs-link?type=IFRS&num=12&code=ifrs-tx-2022-en-r&anchor=para_B10_b&doctype=Appendix&subtype=B
-URIDate 2022-03-24
Reference 3: http://www.xbrl.org/2003/role/disclosureRef
-Name IAS
-Number 1
-IssueDate 2022-03-24
-Paragraph 66
-URI https://taxonomy.ifrs.org/xifrs-link?type=IAS&num=1&code=ifrs-tx-2022-en-r&anchor=para_66&doctype=Standard
-URIDate 2022-03-24
| Name: |
ifrs-full_NoncurrentAssets |
| Namespace Prefix: |
ifrs-full_ |
| Data Type: |
xbrli:monetaryItemType |
| Balance Type: |
debit |
| Period Type: |
instant |
|
| X |
- References
+ Details
| Name: |
ifrs-full_NoncurrentAssetsAbstract |
| Namespace Prefix: |
ifrs-full_ |
| Data Type: |
xbrli:stringItemType |
| Balance Type: |
na |
| Period Type: |
duration |
|
| X |
- DefinitionThe amount of non-current assets or disposal groups classified as held for sale. [Refer: Disposal groups classified as held for sale [member]] Reference 1: http://www.xbrl.org/2003/role/disclosureRef
-Name IFRS
-Number 5
-IssueDate 2022-03-24
-Paragraph 38
-URI https://taxonomy.ifrs.org/xifrs-link?type=IFRS&num=5&code=ifrs-tx-2022-en-r&anchor=para_38&doctype=Standard
-URIDate 2022-03-24
| Name: |
ifrs-full_NoncurrentAssetsOrDisposalGroupsClassifiedAsHeldForSale |
| Namespace Prefix: |
ifrs-full_ |
| Data Type: |
xbrli:monetaryItemType |
| Balance Type: |
debit |
| Period Type: |
instant |
|
| X |
- DefinitionThe amount of non-current contract liabilities. [Refer: Contract liabilities] Reference 1: http://www.xbrl.org/2003/role/disclosureRef
-Name IFRS
-Number 15
-IssueDate 2022-03-24
-Paragraph 105
-URI https://taxonomy.ifrs.org/xifrs-link?type=IFRS&num=15&code=ifrs-tx-2022-en-r&anchor=para_105&doctype=Standard
-URIDate 2022-03-24
| Name: |
ifrs-full_NoncurrentContractLiabilities |
| Namespace Prefix: |
ifrs-full_ |
| Data Type: |
xbrli:monetaryItemType |
| Balance Type: |
credit |
| Period Type: |
instant |
|
| X |
- DefinitionThe amount of non-current derivative financial assets. [Refer: Derivative financial assets] Reference 1: http://www.xbrl.org/2009/role/commonPracticeRef
-Name IAS
-Number 1
-IssueDate 2022-03-24
-Paragraph 55
-URI https://taxonomy.ifrs.org/xifrs-link?type=IAS&num=1&code=ifrs-tx-2022-en-r&anchor=para_55&doctype=Standard
-URIDate 2022-03-24
| Name: |
ifrs-full_NoncurrentDerivativeFinancialAssets |
| Namespace Prefix: |
ifrs-full_ |
| Data Type: |
xbrli:monetaryItemType |
| Balance Type: |
debit |
| Period Type: |
instant |
|
| X |
- DefinitionThe amount of non-current derivative financial liabilities. [Refer: Derivative financial liabilities] Reference 1: http://www.xbrl.org/2009/role/commonPracticeRef
-Name IAS
-Number 1
-IssueDate 2022-03-24
-Paragraph 55
-URI https://taxonomy.ifrs.org/xifrs-link?type=IAS&num=1&code=ifrs-tx-2022-en-r&anchor=para_55&doctype=Standard
-URIDate 2022-03-24
| Name: |
ifrs-full_NoncurrentDerivativeFinancialLiabilities |
| Namespace Prefix: |
ifrs-full_ |
| Data Type: |
xbrli:monetaryItemType |
| Balance Type: |
credit |
| Period Type: |
instant |
|
| X |
- DefinitionThe amount of liabilities that do not meet the definition of current liabilities. [Refer: Current liabilities] Reference 1: http://www.xbrl.org/2003/role/disclosureRef
-Name IFRS
-Number 12
-IssueDate 2022-03-24
-Paragraph B12
-Subparagraph b
-Clause iv
-URI https://taxonomy.ifrs.org/xifrs-link?type=IFRS&num=12&code=ifrs-tx-2022-en-r&anchor=para_B12_b_iv&doctype=Appendix&subtype=B
-URIDate 2022-03-24
Reference 2: http://www.xbrl.org/2003/role/exampleRef
-Name IFRS
-Number 12
-IssueDate 2022-03-24
-Paragraph B10
-Subparagraph b
-URI https://taxonomy.ifrs.org/xifrs-link?type=IFRS&num=12&code=ifrs-tx-2022-en-r&anchor=para_B10_b&doctype=Appendix&subtype=B
-URIDate 2022-03-24
Reference 3: http://www.xbrl.org/2003/role/disclosureRef
-Name IAS
-Number 1
-IssueDate 2022-03-24
-Paragraph 69
-URI https://taxonomy.ifrs.org/xifrs-link?type=IAS&num=1&code=ifrs-tx-2022-en-r&anchor=para_69&doctype=Standard
-URIDate 2022-03-24
| Name: |
ifrs-full_NoncurrentLiabilities |
| Namespace Prefix: |
ifrs-full_ |
| Data Type: |
xbrli:monetaryItemType |
| Balance Type: |
credit |
| Period Type: |
instant |
|
| X |
- References
+ Details
| Name: |
ifrs-full_NoncurrentLiabilitiesAbstract |
| Namespace Prefix: |
ifrs-full_ |
| Data Type: |
xbrli:stringItemType |
| Balance Type: |
na |
| Period Type: |
duration |
|
| X |
- DefinitionThe amount of non-current provisions for employee benefits. [Refer: Provisions for employee benefits] Reference 1: http://www.xbrl.org/2003/role/disclosureRef
-Name IAS
-Number 1
-IssueDate 2022-03-24
-Paragraph 78
-Subparagraph d
-URI https://taxonomy.ifrs.org/xifrs-link?type=IAS&num=1&code=ifrs-tx-2022-en-r&anchor=para_78_d&doctype=Standard
-URIDate 2022-03-24
| Name: |
ifrs-full_NoncurrentProvisionsForEmployeeBenefits |
| Namespace Prefix: |
ifrs-full_ |
| Data Type: |
xbrli:monetaryItemType |
| Balance Type: |
credit |
| Period Type: |
instant |
|
| X |
- DefinitionThe amount of non-current net defined benefit asset. [Refer: Net defined benefit asset] Reference 1: http://www.xbrl.org/2009/role/commonPracticeRef
-Name IAS
-Number 1
-IssueDate 2022-03-24
-Paragraph 55
-URI https://taxonomy.ifrs.org/xifrs-link?type=IAS&num=1&code=ifrs-tx-2022-en-r&anchor=para_55&doctype=Standard
-URIDate 2022-03-24
| Name: |
ifrs-full_NoncurrentRecognisedAssetsDefinedBenefitPlan |
| Namespace Prefix: |
ifrs-full_ |
| Data Type: |
xbrli:monetaryItemType |
| Balance Type: |
debit |
| Period Type: |
instant |
|
| X |
- DefinitionThe amount of current financial assets that the entity does not separately disclose in the same statement or note. [Refer: Other financial assets; Current financial assets] Reference 1: http://www.xbrl.org/2003/role/disclosureRef
-Name IAS
-Number 1
-IssueDate 2022-03-24
-Paragraph 54
-Subparagraph d
-URI https://taxonomy.ifrs.org/xifrs-link?type=IAS&num=1&code=ifrs-tx-2022-en-r&anchor=para_54_d&doctype=Standard
-URIDate 2022-03-24
| Name: |
ifrs-full_OtherCurrentFinancialAssets |
| Namespace Prefix: |
ifrs-full_ |
| Data Type: |
xbrli:monetaryItemType |
| Balance Type: |
debit |
| Period Type: |
instant |
|
| X |
- DefinitionThe amount of non-current provisions other than provisions for employee benefits. [Refer: Non-current provisions] Reference 1: http://www.xbrl.org/2003/role/disclosureRef
-Name IAS
-Number 1
-IssueDate 2022-03-24
-Paragraph 78
-Subparagraph d
-URI https://taxonomy.ifrs.org/xifrs-link?type=IAS&num=1&code=ifrs-tx-2022-en-r&anchor=para_78_d&doctype=Standard
-URIDate 2022-03-24
| Name: |
ifrs-full_OtherLongtermProvisions |
| Namespace Prefix: |
ifrs-full_ |
| Data Type: |
xbrli:monetaryItemType |
| Balance Type: |
credit |
| Period Type: |
instant |
|
| X |
- DefinitionThe amount of non-current assets that the entity does not separately disclose in the same statement or note. [Refer: Non-current assets] Reference 1: http://www.xbrl.org/2009/role/commonPracticeRef
-Name IAS
-Number 1
-IssueDate 2022-03-24
-Paragraph 55
-URI https://taxonomy.ifrs.org/xifrs-link?type=IAS&num=1&code=ifrs-tx-2022-en-r&anchor=para_55&doctype=Standard
-URIDate 2022-03-24
| Name: |
ifrs-full_OtherNoncurrentAssets |
| Namespace Prefix: |
ifrs-full_ |
| Data Type: |
xbrli:monetaryItemType |
| Balance Type: |
debit |
| Period Type: |
instant |
|
| X |
- DefinitionThe amount of non-current financial assets that the entity does not separately disclose in the same statement or note. [Refer: Other financial assets] Reference 1: http://www.xbrl.org/2003/role/disclosureRef
-Name IAS
-Number 1
-IssueDate 2022-03-24
-Paragraph 54
-Subparagraph d
-URI https://taxonomy.ifrs.org/xifrs-link?type=IAS&num=1&code=ifrs-tx-2022-en-r&anchor=para_54_d&doctype=Standard
-URIDate 2022-03-24
| Name: |
ifrs-full_OtherNoncurrentFinancialAssets |
| Namespace Prefix: |
ifrs-full_ |
| Data Type: |
xbrli:monetaryItemType |
| Balance Type: |
debit |
| Period Type: |
instant |
|
| X |
- DefinitionThe amount of non-current liabilities that the entity does not separately disclose in the same statement or note. [Refer: Non-current liabilities] Reference 1: http://www.xbrl.org/2009/role/commonPracticeRef
-Name IAS
-Number 1
-IssueDate 2022-03-24
-Paragraph 55
-URI https://taxonomy.ifrs.org/xifrs-link?type=IAS&num=1&code=ifrs-tx-2022-en-r&anchor=para_55&doctype=Standard
-URIDate 2022-03-24
| Name: |
ifrs-full_OtherNoncurrentLiabilities |
| Namespace Prefix: |
ifrs-full_ |
| Data Type: |
xbrli:monetaryItemType |
| Balance Type: |
credit |
| Period Type: |
instant |
|
| X |
- DefinitionA component of equity representing reserves within equity, not including retained earnings. [Refer: Retained earnings] Reference 1: http://www.xbrl.org/2003/role/exampleRef
-Name IAS
-Number 1
-IssueDate 2022-03-24
-Paragraph 78
-Subparagraph e
-URI https://taxonomy.ifrs.org/xifrs-link?type=IAS&num=1&code=ifrs-tx-2022-en-r&anchor=para_78_e&doctype=Standard
-URIDate 2022-03-24
| Name: |
ifrs-full_OtherReserves |
| Namespace Prefix: |
ifrs-full_ |
| Data Type: |
xbrli:monetaryItemType |
| Balance Type: |
credit |
| Period Type: |
instant |
|
| X |
- DefinitionThe amount of current provisions other than provisions for employee benefits. [Refer: Provisions] Reference 1: http://www.xbrl.org/2003/role/disclosureRef
-Name IAS
-Number 1
-IssueDate 2022-03-24
-Paragraph 78
-Subparagraph d
-URI https://taxonomy.ifrs.org/xifrs-link?type=IAS&num=1&code=ifrs-tx-2022-en-r&anchor=para_78_d&doctype=Standard
-URIDate 2022-03-24
| Name: |
ifrs-full_OtherShorttermProvisions |
| Namespace Prefix: |
ifrs-full_ |
| Data Type: |
xbrli:monetaryItemType |
| Balance Type: |
credit |
| Period Type: |
instant |
|
| X |
- DefinitionThe amount of tangible assets that: (a) are held for use in the production or supply of goods or services, for rental to others, or for administrative purposes; and (b) are expected to be used during more than one period. Reference 1: http://www.xbrl.org/2003/role/disclosureRef
-Name IAS
-Number 16
-IssueDate 2022-03-24
-Paragraph 73
-Subparagraph e
-URI https://taxonomy.ifrs.org/xifrs-link?type=IAS&num=16&code=ifrs-tx-2022-en-r&anchor=para_73_e&doctype=Standard
-URIDate 2022-03-24
Reference 2: http://www.xbrl.org/2003/role/disclosureRef
-Name IAS
-Number 1
-IssueDate 2022-03-24
-Paragraph 54
-Subparagraph a
-URI https://taxonomy.ifrs.org/xifrs-link?type=IAS&num=1&code=ifrs-tx-2022-en-r&anchor=para_54_a&doctype=Standard
-URIDate 2022-03-24
| Name: |
ifrs-full_PropertyPlantAndEquipment |
| Namespace Prefix: |
ifrs-full_ |
| Data Type: |
xbrli:monetaryItemType |
| Balance Type: |
debit |
| Period Type: |
instant |
|
| X |
- DefinitionA component of equity representing the entity's cumulative undistributed earnings or deficit. Reference 1: http://www.xbrl.org/2003/role/exampleRef
-Name IAS
-Number 1
-IssueDate 2022-03-24
-Paragraph IG6
-URI https://taxonomy.ifrs.org/xifrs-link?type=IAS&num=1&code=ifrs-tx-2022-en-r&anchor=para_IG6&doctype=Implementation%20Guidance
-URIDate 2022-03-24
Reference 2: http://www.xbrl.org/2003/role/exampleRef
-Name IAS
-Number 1
-IssueDate 2022-03-24
-Paragraph 78
-Subparagraph e
-URI https://taxonomy.ifrs.org/xifrs-link?type=IAS&num=1&code=ifrs-tx-2022-en-r&anchor=para_78_e&doctype=Standard
-URIDate 2022-03-24
| Name: |
ifrs-full_RetainedEarnings |
| Namespace Prefix: |
ifrs-full_ |
| Data Type: |
xbrli:monetaryItemType |
| Balance Type: |
credit |
| Period Type: |
instant |
|
| X |
- DefinitionThe amount received or receivable from the issuance of the entity's shares in excess of nominal value. Reference 1: http://www.xbrl.org/2003/role/exampleRef
-Name IAS
-Number 1
-IssueDate 2022-03-24
-Paragraph 78
-Subparagraph e
-URI https://taxonomy.ifrs.org/xifrs-link?type=IAS&num=1&code=ifrs-tx-2022-en-r&anchor=para_78_e&doctype=Standard
-URIDate 2022-03-24
| Name: |
ifrs-full_SharePremium |
| Namespace Prefix: |
ifrs-full_ |
| Data Type: |
xbrli:monetaryItemType |
| Balance Type: |
credit |
| Period Type: |
instant |
|
| X |
- DefinitionThe amount of current trade payables and current other payables. [Refer: Current trade payables; Other current payables] Reference 1: http://www.xbrl.org/2003/role/disclosureRef
-Name IAS
-Number 1
-IssueDate 2022-03-24
-Paragraph 54
-Subparagraph k
-URI https://taxonomy.ifrs.org/xifrs-link?type=IAS&num=1&code=ifrs-tx-2022-en-r&anchor=para_54_k&doctype=Standard
-URIDate 2022-03-24
| Name: |
ifrs-full_TradeAndOtherCurrentPayables |
| Namespace Prefix: |
ifrs-full_ |
| Data Type: |
xbrli:monetaryItemType |
| Balance Type: |
credit |
| Period Type: |
instant |
|
| X |
- DefinitionThe amount of current trade receivables and current other receivables. [Refer: Current trade receivables; Other current receivables] Reference 1: http://www.xbrl.org/2003/role/disclosureRef
-Name IAS
-Number 1
-IssueDate 2022-03-24
-Paragraph 54
-Subparagraph h
-URI https://taxonomy.ifrs.org/xifrs-link?type=IAS&num=1&code=ifrs-tx-2022-en-r&anchor=para_54_h&doctype=Standard
-URIDate 2022-03-24
Reference 2: http://www.xbrl.org/2003/role/disclosureRef
-Name IAS
-Number 1
-IssueDate 2022-03-24
-Paragraph 78
-Subparagraph b
-URI https://taxonomy.ifrs.org/xifrs-link?type=IAS&num=1&code=ifrs-tx-2022-en-r&anchor=para_78_b&doctype=Standard
-URIDate 2022-03-24
| Name: |
ifrs-full_TradeAndOtherCurrentReceivables |
| Namespace Prefix: |
ifrs-full_ |
| Data Type: |
xbrli:monetaryItemType |
| Balance Type: |
debit |
| Period Type: |
instant |
|
v3.23.3
Consolidated cash flow statement - GBP (£)
£ in Millions |
6 Months Ended |
Sep. 30, 2023 |
Sep. 30, 2022 |
| Cash flows from operating activities |
|
|
|
|
| Operating profit from continuing operations |
|
£ 1,985
|
£ 2,239
|
[1] |
| Adjustments for: |
|
|
|
|
| Gain on sale of investments |
|
0
|
(511)
|
|
| Other fair value movements |
|
(19)
|
31
|
|
| Depreciation, amortisation and impairment |
|
1,021
|
932
|
|
| Share-based payments |
|
19
|
20
|
|
| Changes in working capital |
|
(10)
|
(378)
|
|
| Changes in provisions |
|
39
|
81
|
|
| Changes in pensions and other post-retirement benefit obligations |
|
27
|
(54)
|
|
| Cash generated from operations – continuing operations |
|
3,062
|
2,360
|
|
| Tax paid |
|
(201)
|
(88)
|
|
| Net cash flow from operating activities – continuing operations |
|
2,861
|
2,272
|
|
| Net cash flow from operating activities – discontinued operations |
|
0
|
256
|
|
| Cash flows from investing activities |
|
|
|
|
| Purchases of intangible assets |
|
(269)
|
(224)
|
|
| Purchases of property, plant and equipment |
|
(3,210)
|
(3,258)
|
|
| Disposals of property, plant and equipment |
|
18
|
63
|
|
| Investments in joint ventures and associates |
|
(151)
|
(376)
|
|
| Dividends received from joint ventures and associates |
|
121
|
107
|
|
| Disposal of financial and other investments |
|
65
|
70
|
|
| Acquisition of financial investments |
|
(32)
|
(62)
|
|
| Net movements in short-term financial investments |
|
885
|
599
|
|
| Interest received |
|
69
|
20
|
|
| Cash inflows on derivatives |
|
103
|
0
|
|
| Cash outflows on derivatives |
|
(4)
|
(377)
|
|
| Insurance claim from loss of property, plant and equipment |
|
0
|
33
|
|
| Net cash flow used in investing activities – continuing operations |
|
(2,410)
|
(445)
|
|
| Net cash flow used in investing activities – discontinued operations |
|
0
|
(181)
|
|
| Cash flows from financing activities |
|
|
|
|
| Proceeds from issue of treasury shares |
|
20
|
14
|
|
| Transactions in own shares |
|
(1)
|
2
|
|
| Proceeds received from loans |
|
3,033
|
9,047
|
|
| Repayments of loans |
|
(839)
|
(9,049)
|
|
| Payments of lease liabilities |
|
(61)
|
(78)
|
|
| Net movements in short-term borrowings |
|
(444)
|
380
|
|
| Cash inflows on derivatives |
|
68
|
201
|
|
| Cash outflows on derivatives |
|
(60)
|
(230)
|
|
| Interest paid |
|
(779)
|
(669)
|
|
| Dividends paid to shareholders |
|
(1,325)
|
(1,119)
|
|
| Net cash flow used in financing activities – continuing operations |
|
(388)
|
(1,501)
|
|
| Net cash flow used in financing activities – discontinued operations |
|
0
|
(334)
|
|
| Net increase in cash and cash equivalents |
|
63
|
67
|
|
| Reclassification to held for sale |
|
0
|
(5)
|
|
| Exchange movements |
|
1
|
15
|
|
| Net cash and cash equivalents at start of period |
|
163
|
182
|
|
| Net cash and cash equivalents at end of period |
|
227
|
259
|
|
| The Narragansett Electric Company |
|
|
|
|
| Cash flows from investing activities |
|
|
|
|
| Disposal of interest in The Narragansett Electric Company |
[2] |
0
|
2,968
|
|
| National Grid Renewables and Emerald Energy Venture LLC |
|
|
|
|
| Cash flows from investing activities |
|
|
|
|
| Contributions to National Grid Renewables and Emerald Energy Venture LLC |
|
£ (5)
|
£ (8)
|
|
|
|
| X |
- DefinitionAdjustments for depreciation and amortisation expense and impairment loss (reversal of impairment loss) to reconcile profit (loss) to net cash flow from (used in) operating activities. [Refer: Impairment loss; Depreciation and amortisation expense; Impairment loss (reversal of impairment loss) recognised in profit or loss; Profit (loss)] Reference 1: http://www.xbrl.org/2009/role/commonPracticeRef
-Name IAS
-Number 7
-IssueDate 2022-03-24
-Paragraph 20
-URI https://taxonomy.ifrs.org/xifrs-link?type=IAS&num=7&code=ifrs-tx-2022-en-r&anchor=para_20&doctype=Standard
-URIDate 2022-03-24
| Name: |
ifrs-full_AdjustmentsForDepreciationAndAmortisationExpenseAndImpairmentLossReversalOfImpairmentLossRecognisedInProfitOrLoss |
| Namespace Prefix: |
ifrs-full_ |
| Data Type: |
xbrli:monetaryItemType |
| Balance Type: |
debit |
| Period Type: |
duration |
|
| X |
- DefinitionAdjustments for fair value losses (gains) to reconcile profit (loss) to net cash flow from (used in) operating activities. [Refer: Profit (loss)] Reference 1: http://www.xbrl.org/2009/role/commonPracticeRef
-Name IAS
-Number 7
-IssueDate 2022-03-24
-Paragraph 20
-Subparagraph b
-URI https://taxonomy.ifrs.org/xifrs-link?type=IAS&num=7&code=ifrs-tx-2022-en-r&anchor=para_20_b&doctype=Standard
-URIDate 2022-03-24
| Name: |
ifrs-full_AdjustmentsForFairValueGainsLosses |
| Namespace Prefix: |
ifrs-full_ |
| Data Type: |
xbrli:monetaryItemType |
| Balance Type: |
debit |
| Period Type: |
duration |
|
| X |
- DefinitionAdjustments for gain (loss) on disposals investments in subsidiaries, joint ventures and associates to reconcile profit (loss) to net cash flow from (used in) operating activities. [Refer: Associates [member]; Joint ventures [member]; Subsidiaries [member]; Investments in subsidiaries, joint ventures and associates reported in separate financial statements; Profit (loss)] Reference 1: http://www.xbrl.org/2009/role/commonPracticeRef
-Name IAS
-Number 7
-IssueDate 2022-03-24
-Paragraph 20
-URI https://taxonomy.ifrs.org/xifrs-link?type=IAS&num=7&code=ifrs-tx-2022-en-r&anchor=para_20&doctype=Standard
-URIDate 2022-03-24
| Name: |
ifrs-full_AdjustmentsForGainLossOnDisposalOfInvestmentsInSubsidiariesJointVenturesAndAssociates |
| Namespace Prefix: |
ifrs-full_ |
| Data Type: |
xbrli:monetaryItemType |
| Balance Type: |
credit |
| Period Type: |
duration |
|
| X |
- DefinitionAdjustments for increase (decrease) in employee benefit liabilities to reconcile profit (loss) to net cash flow from (used in) operating activities. [Refer: Profit (loss)] Reference 1: http://www.xbrl.org/2009/role/commonPracticeRef
-Name IAS
-Number 7
-IssueDate 2022-03-24
-Paragraph 20
-URI https://taxonomy.ifrs.org/xifrs-link?type=IAS&num=7&code=ifrs-tx-2022-en-r&anchor=para_20&doctype=Standard
-URIDate 2022-03-24
| Name: |
ifrs-full_AdjustmentsForIncreaseDecreaseInEmployeeBenefitLiabilities |
| Namespace Prefix: |
ifrs-full_ |
| Data Type: |
xbrli:monetaryItemType |
| Balance Type: |
debit |
| Period Type: |
duration |
|
| X |
- DefinitionAdjustments for provisions to reconcile profit (loss) to net cash flow from (used in) operating activities. [Refer: Provisions; Profit (loss)] Reference 1: http://www.xbrl.org/2009/role/commonPracticeRef
-Name IAS
-Number 7
-IssueDate 2022-03-24
-Paragraph 20
-Subparagraph b
-URI https://taxonomy.ifrs.org/xifrs-link?type=IAS&num=7&code=ifrs-tx-2022-en-r&anchor=para_20_b&doctype=Standard
-URIDate 2022-03-24
| Name: |
ifrs-full_AdjustmentsForProvisions |
| Namespace Prefix: |
ifrs-full_ |
| Data Type: |
xbrli:monetaryItemType |
| Balance Type: |
debit |
| Period Type: |
duration |
|
| X |
- References
+ Details
| Name: |
ifrs-full_AdjustmentsForReconcileProfitLossAbstract |
| Namespace Prefix: |
ifrs-full_ |
| Data Type: |
xbrli:stringItemType |
| Balance Type: |
na |
| Period Type: |
duration |
|
| X |
- DefinitionAdjustments for share-based payments to reconcile profit (loss) to net cash flow from (used in) operating activities. [Refer: Profit (loss)] Reference 1: http://www.xbrl.org/2009/role/commonPracticeRef
-Name IAS
-Number 7
-IssueDate 2022-03-24
-Paragraph 20
-Subparagraph b
-URI https://taxonomy.ifrs.org/xifrs-link?type=IAS&num=7&code=ifrs-tx-2022-en-r&anchor=para_20_b&doctype=Standard
-URIDate 2022-03-24
| Name: |
ifrs-full_AdjustmentsForSharebasedPayments |
| Namespace Prefix: |
ifrs-full_ |
| Data Type: |
xbrli:monetaryItemType |
| Balance Type: |
debit |
| Period Type: |
duration |
|
| X |
- DefinitionThe amount of cash and cash equivalents that are classified as a part of a disposal group held for sale. [Refer: Cash and cash equivalents; Disposal groups classified as held for sale [member]] Reference 1: http://www.xbrl.org/2009/role/commonPracticeRef
-Name IAS
-Number 7
-IssueDate 2022-03-24
-Paragraph 45
-URI https://taxonomy.ifrs.org/xifrs-link?type=IAS&num=7&code=ifrs-tx-2022-en-r&anchor=para_45&doctype=Standard
-URIDate 2022-03-24
| Name: |
ifrs-full_CashAndCashEquivalentsClassifiedAsPartOfDisposalGroupHeldForSale |
| Namespace Prefix: |
ifrs-full_ |
| Data Type: |
xbrli:monetaryItemType |
| Balance Type: |
debit |
| Period Type: |
instant |
|
| X |
- DefinitionThe amount of cash and cash equivalents in the statement of cash flows when different from the amount of cash and cash equivalents in the statement of financial position. [Refer: Cash and cash equivalents] Reference 1: http://www.xbrl.org/2009/role/commonPracticeRef
-Name IAS
-Number 7
-IssueDate 2022-03-24
-Paragraph 45
-URI https://taxonomy.ifrs.org/xifrs-link?type=IAS&num=7&code=ifrs-tx-2022-en-r&anchor=para_45&doctype=Standard
-URIDate 2022-03-24
| Name: |
ifrs-full_CashAndCashEquivalentsIfDifferentFromStatementOfFinancialPosition |
| Namespace Prefix: |
ifrs-full_ |
| Data Type: |
xbrli:monetaryItemType |
| Balance Type: |
debit |
| Period Type: |
instant |
|
| X |
- DefinitionThe aggregate cash flows arising from losing control of subsidiaries or other businesses, classified as investing activities. [Refer: Subsidiaries [member]] Reference 1: http://www.xbrl.org/2003/role/disclosureRef
-Name IAS
-Number 7
-IssueDate 2022-03-24
-Paragraph 39
-URI https://taxonomy.ifrs.org/xifrs-link?type=IAS&num=7&code=ifrs-tx-2022-en-r&anchor=para_39&doctype=Standard
-URIDate 2022-03-24
| Name: |
ifrs-full_CashFlowsFromLosingControlOfSubsidiariesOrOtherBusinessesClassifiedAsInvestingActivities |
| Namespace Prefix: |
ifrs-full_ |
| Data Type: |
xbrli:monetaryItemType |
| Balance Type: |
debit |
| Period Type: |
duration |
|
| X |
- DefinitionThe cash inflow (outflow) due to a decrease (increase) in short-term deposits and investments. Reference 1: http://www.xbrl.org/2009/role/commonPracticeRef
-Name IAS
-Number 7
-IssueDate 2022-03-24
-Paragraph 16
-URI https://taxonomy.ifrs.org/xifrs-link?type=IAS&num=7&code=ifrs-tx-2022-en-r&anchor=para_16&doctype=Standard
-URIDate 2022-03-24
| Name: |
ifrs-full_CashFlowsFromUsedInDecreaseIncreaseInShorttermDepositsAndInvestments |
| Namespace Prefix: |
ifrs-full_ |
| Data Type: |
xbrli:monetaryItemType |
| Balance Type: |
debit |
| Period Type: |
duration |
|
| X |
- References
+ Details
| Name: |
ifrs-full_CashFlowsFromUsedInFinancingActivitiesAbstract |
| Namespace Prefix: |
ifrs-full_ |
| Data Type: |
xbrli:stringItemType |
| Balance Type: |
na |
| Period Type: |
duration |
|
| X |
- DefinitionThe cash flows from (used in) the entity's financing activities, related to continuing operations. [Refer: Continuing operations [member]; Cash flows from (used in) financing activities] Reference 1: http://www.xbrl.org/2003/role/disclosureRef
-Name IFRS
-Number 5
-IssueDate 2022-03-24
-Paragraph 33
-Subparagraph c
-URI https://taxonomy.ifrs.org/xifrs-link?type=IFRS&num=5&code=ifrs-tx-2022-en-r&anchor=para_33_c&doctype=Standard
-URIDate 2022-03-24
| Name: |
ifrs-full_CashFlowsFromUsedInFinancingActivitiesContinuingOperations |
| Namespace Prefix: |
ifrs-full_ |
| Data Type: |
xbrli:monetaryItemType |
| Balance Type: |
debit |
| Period Type: |
duration |
|
| X |
- DefinitionThe cash flows from (used in) the entity's financing activities, related to discontinued operations. [Refer: Discontinued operations [member]; Cash flows from (used in) financing activities] Reference 1: http://www.xbrl.org/2003/role/disclosureRef
-Name IFRS
-Number 5
-IssueDate 2022-03-24
-Paragraph 33
-Subparagraph c
-URI https://taxonomy.ifrs.org/xifrs-link?type=IFRS&num=5&code=ifrs-tx-2022-en-r&anchor=para_33_c&doctype=Standard
-URIDate 2022-03-24
| Name: |
ifrs-full_CashFlowsFromUsedInFinancingActivitiesDiscontinuedOperations |
| Namespace Prefix: |
ifrs-full_ |
| Data Type: |
xbrli:monetaryItemType |
| Balance Type: |
debit |
| Period Type: |
duration |
|
| X |
- DefinitionThe cash inflow (outflow) due to an increase (decrease) in current borrowings. [Refer: Current borrowings] Reference 1: http://www.xbrl.org/2009/role/commonPracticeRef
-Name IAS
-Number 7
-IssueDate 2022-03-24
-Paragraph 17
-URI https://taxonomy.ifrs.org/xifrs-link?type=IAS&num=7&code=ifrs-tx-2022-en-r&anchor=para_17&doctype=Standard
-URIDate 2022-03-24
| Name: |
ifrs-full_CashFlowsFromUsedInIncreaseDecreaseInCurrentBorrowings |
| Namespace Prefix: |
ifrs-full_ |
| Data Type: |
xbrli:monetaryItemType |
| Balance Type: |
debit |
| Period Type: |
duration |
|
| X |
- References
+ Details
| Name: |
ifrs-full_CashFlowsFromUsedInInvestingActivitiesAbstract |
| Namespace Prefix: |
ifrs-full_ |
| Data Type: |
xbrli:stringItemType |
| Balance Type: |
na |
| Period Type: |
duration |
|
| X |
- DefinitionThe cash flows from (used in) the entity's investing activities, related to continuing operations. [Refer: Continuing operations [member]; Cash flows from (used in) investing activities] Reference 1: http://www.xbrl.org/2003/role/disclosureRef
-Name IFRS
-Number 5
-IssueDate 2022-03-24
-Paragraph 33
-Subparagraph c
-URI https://taxonomy.ifrs.org/xifrs-link?type=IFRS&num=5&code=ifrs-tx-2022-en-r&anchor=para_33_c&doctype=Standard
-URIDate 2022-03-24
| Name: |
ifrs-full_CashFlowsFromUsedInInvestingActivitiesContinuingOperations |
| Namespace Prefix: |
ifrs-full_ |
| Data Type: |
xbrli:monetaryItemType |
| Balance Type: |
debit |
| Period Type: |
duration |
|
| X |
- DefinitionThe cash flows from (used in) the entity's investing activities, related to discontinued operations. [Refer: Discontinued operations [member]; Cash flows from (used in) investing activities] Reference 1: http://www.xbrl.org/2003/role/disclosureRef
-Name IFRS
-Number 5
-IssueDate 2022-03-24
-Paragraph 33
-Subparagraph c
-URI https://taxonomy.ifrs.org/xifrs-link?type=IFRS&num=5&code=ifrs-tx-2022-en-r&anchor=para_33_c&doctype=Standard
-URIDate 2022-03-24
| Name: |
ifrs-full_CashFlowsFromUsedInInvestingActivitiesDiscontinuedOperations |
| Namespace Prefix: |
ifrs-full_ |
| Data Type: |
xbrli:monetaryItemType |
| Balance Type: |
debit |
| Period Type: |
duration |
|
| X |
- References
+ Details
| Name: |
ifrs-full_CashFlowsFromUsedInOperatingActivitiesAbstract |
| Namespace Prefix: |
ifrs-full_ |
| Data Type: |
xbrli:stringItemType |
| Balance Type: |
na |
| Period Type: |
duration |
|
| X |
- DefinitionThe cash flows from (used in) the entity's operating activities, related to continuing operations. [Refer: Continuing operations [member]; Cash flows from (used in) operating activities] Reference 1: http://www.xbrl.org/2003/role/disclosureRef
-Name IFRS
-Number 5
-IssueDate 2022-03-24
-Paragraph 33
-Subparagraph c
-URI https://taxonomy.ifrs.org/xifrs-link?type=IFRS&num=5&code=ifrs-tx-2022-en-r&anchor=para_33_c&doctype=Standard
-URIDate 2022-03-24
| Name: |
ifrs-full_CashFlowsFromUsedInOperatingActivitiesContinuingOperations |
| Namespace Prefix: |
ifrs-full_ |
| Data Type: |
xbrli:monetaryItemType |
| Balance Type: |
na |
| Period Type: |
duration |
|
| X |
- DefinitionThe cash flows from (used in) the entity's operating activities, related to discontinued operations. [Refer: Discontinued operations [member]; Cash flows from (used in) operating activities] Reference 1: http://www.xbrl.org/2003/role/disclosureRef
-Name IFRS
-Number 5
-IssueDate 2022-03-24
-Paragraph 33
-Subparagraph c
-URI https://taxonomy.ifrs.org/xifrs-link?type=IFRS&num=5&code=ifrs-tx-2022-en-r&anchor=para_33_c&doctype=Standard
-URIDate 2022-03-24
| Name: |
ifrs-full_CashFlowsFromUsedInOperatingActivitiesDiscontinuedOperations |
| Namespace Prefix: |
ifrs-full_ |
| Data Type: |
xbrli:monetaryItemType |
| Balance Type: |
na |
| Period Type: |
duration |
|
| X |
- DefinitionThe cash from (used in) the entity's operations. Reference 1: http://www.xbrl.org/2003/role/exampleRef
-Name IAS
-Number 7
-IssueDate 2022-03-24
-Section A Statement of cash flows for an entity other than a financial institution
-URI https://taxonomy.ifrs.org/xifrs-link?type=IAS&num=7&code=ifrs-tx-2022-en-r&doctype=Illustrative%20Examples&dita_xref=IAS07_IE_A__IAS07_IE_A_TI
-URIDate 2022-03-24
Reference 2: http://www.xbrl.org/2003/role/exampleRef
-Name IAS
-Number 7
-IssueDate 2022-03-24
-Paragraph 20
-URI https://taxonomy.ifrs.org/xifrs-link?type=IAS&num=7&code=ifrs-tx-2022-en-r&anchor=para_20&doctype=Standard
-URIDate 2022-03-24
| Name: |
ifrs-full_CashFlowsFromUsedInOperations |
| Namespace Prefix: |
ifrs-full_ |
| Data Type: |
xbrli:monetaryItemType |
| Balance Type: |
na |
| Period Type: |
duration |
|
| X |
- DefinitionThe aggregate cash flows used in obtaining control of subsidiaries or other businesses, classified as investing activities. [Refer: Subsidiaries [member]] Reference 1: http://www.xbrl.org/2003/role/disclosureRef
-Name IAS
-Number 7
-IssueDate 2022-03-24
-Paragraph 39
-URI https://taxonomy.ifrs.org/xifrs-link?type=IAS&num=7&code=ifrs-tx-2022-en-r&anchor=para_39&doctype=Standard
-URIDate 2022-03-24
| Name: |
ifrs-full_CashFlowsUsedInObtainingControlOfSubsidiariesOrOtherBusinessesClassifiedAsInvestingActivities |
| Namespace Prefix: |
ifrs-full_ |
| Data Type: |
xbrli:monetaryItemType |
| Balance Type: |
credit |
| Period Type: |
duration |
|
| X |
- DefinitionThe cash outflow for futures contracts, forward contracts, option contracts and swap contracts except when the contracts are held for dealing or trading purposes or the payments are classified as financing activities. Reference 1: http://www.xbrl.org/2003/role/exampleRef
-Name IAS
-Number 7
-IssueDate 2022-03-24
-Paragraph 16
-Subparagraph g
-URI https://taxonomy.ifrs.org/xifrs-link?type=IAS&num=7&code=ifrs-tx-2022-en-r&anchor=para_16_g&doctype=Standard
-URIDate 2022-03-24
| Name: |
ifrs-full_CashPaymentsForFutureContractsForwardContractsOptionContractsAndSwapContractsClassifiedAsInvestingActivities |
| Namespace Prefix: |
ifrs-full_ |
| Data Type: |
xbrli:monetaryItemType |
| Balance Type: |
credit |
| Period Type: |
duration |
|
| X |
- DefinitionThe cash inflow from futures contracts, forward contracts, option contracts and swap contracts except when the contracts are held for dealing or trading purposes or the receipts are classified as financing activities. Reference 1: http://www.xbrl.org/2003/role/exampleRef
-Name IAS
-Number 7
-IssueDate 2022-03-24
-Paragraph 16
-Subparagraph h
-URI https://taxonomy.ifrs.org/xifrs-link?type=IAS&num=7&code=ifrs-tx-2022-en-r&anchor=para_16_h&doctype=Standard
-URIDate 2022-03-24
| Name: |
ifrs-full_CashReceiptsFromFutureContractsForwardContractsOptionContractsAndSwapContractsClassifiedAsInvestingActivities |
| Namespace Prefix: |
ifrs-full_ |
| Data Type: |
xbrli:monetaryItemType |
| Balance Type: |
debit |
| Period Type: |
duration |
|
| X |
- DefinitionThe cash outflow for dividends paid by the entity, classified as financing activities. Reference 1: http://www.xbrl.org/2003/role/disclosureRef
-Name IAS
-Number 7
-IssueDate 2022-03-24
-Paragraph 31
-URI https://taxonomy.ifrs.org/xifrs-link?type=IAS&num=7&code=ifrs-tx-2022-en-r&anchor=para_31&doctype=Standard
-URIDate 2022-03-24
| Name: |
ifrs-full_DividendsPaidClassifiedAsFinancingActivities |
| Namespace Prefix: |
ifrs-full_ |
| Data Type: |
xbrli:monetaryItemType |
| Balance Type: |
credit |
| Period Type: |
duration |
|
| X |
- DefinitionThe cash inflow representing dividends received from investments that are accounted for using the equity method, classified as investing activities. [Refer: Investments accounted for using equity method; Dividends received] Reference 1: http://www.xbrl.org/2009/role/commonPracticeRef
-Name IAS
-Number 7
-IssueDate 2022-03-24
-Paragraph 16
-URI https://taxonomy.ifrs.org/xifrs-link?type=IAS&num=7&code=ifrs-tx-2022-en-r&anchor=para_16&doctype=Standard
-URIDate 2022-03-24
| Name: |
ifrs-full_DividendsReceivedFromInvestmentsAccountedForUsingEquityMethodClassifiedAsInvestingActivities |
| Namespace Prefix: |
ifrs-full_ |
| Data Type: |
xbrli:monetaryItemType |
| Balance Type: |
debit |
| Period Type: |
duration |
|
| X |
- DefinitionThe effect of exchange rate changes on cash and cash equivalents held or due in a foreign currency. [Refer: Cash and cash equivalents] Reference 1: http://www.xbrl.org/2003/role/disclosureRef
-Name IAS
-Number 7
-IssueDate 2022-03-24
-Paragraph 25
-URI https://taxonomy.ifrs.org/xifrs-link?type=IAS&num=7&code=ifrs-tx-2022-en-r&anchor=para_25&doctype=Standard
-URIDate 2022-03-24
Reference 2: http://www.xbrl.org/2003/role/disclosureRef
-Name IAS
-Number 7
-IssueDate 2022-03-24
-Paragraph 28
-URI https://taxonomy.ifrs.org/xifrs-link?type=IAS&num=7&code=ifrs-tx-2022-en-r&anchor=para_28&doctype=Standard
-URIDate 2022-03-24
| Name: |
ifrs-full_EffectOfExchangeRateChangesOnCashAndCashEquivalents |
| Namespace Prefix: |
ifrs-full_ |
| Data Type: |
xbrli:monetaryItemType |
| Balance Type: |
debit |
| Period Type: |
duration |
|
| X |
- DefinitionThe increase (decrease) in cash and cash equivalents before the effect of exchange rate changes on cash and cash equivalents held in foreign currencies. [Refer: Cash and cash equivalents; Effect of exchange rate changes on cash and cash equivalents] Reference 1: http://www.xbrl.org/2003/role/disclosureRef
-Name IAS
-Number 7
-IssueDate 2022-03-24
-Paragraph 45
-URI https://taxonomy.ifrs.org/xifrs-link?type=IAS&num=7&code=ifrs-tx-2022-en-r&anchor=para_45&doctype=Standard
-URIDate 2022-03-24
| Name: |
ifrs-full_IncreaseDecreaseInCashAndCashEquivalentsBeforeEffectOfExchangeRateChanges |
| Namespace Prefix: |
ifrs-full_ |
| Data Type: |
xbrli:monetaryItemType |
| Balance Type: |
debit |
| Period Type: |
duration |
|
| X |
- DefinitionThe increase (decrease) in working capital. Reference 1: http://www.xbrl.org/2009/role/commonPracticeRef
-Name IAS
-Number 7
-IssueDate 2022-03-24
-Paragraph 20
-URI https://taxonomy.ifrs.org/xifrs-link?type=IAS&num=7&code=ifrs-tx-2022-en-r&anchor=para_20&doctype=Standard
-URIDate 2022-03-24
| Name: |
ifrs-full_IncreaseDecreaseInWorkingCapital |
| Namespace Prefix: |
ifrs-full_ |
| Data Type: |
xbrli:monetaryItemType |
| Balance Type: |
credit |
| Period Type: |
duration |
|
| X |
- DefinitionThe cash outflow for interest paid, classified as financing activities. Reference 1: http://www.xbrl.org/2003/role/disclosureRef
-Name IAS
-Number 7
-IssueDate 2022-03-24
-Paragraph 31
-URI https://taxonomy.ifrs.org/xifrs-link?type=IAS&num=7&code=ifrs-tx-2022-en-r&anchor=para_31&doctype=Standard
-URIDate 2022-03-24
| Name: |
ifrs-full_InterestPaidClassifiedAsFinancingActivities |
| Namespace Prefix: |
ifrs-full_ |
| Data Type: |
xbrli:monetaryItemType |
| Balance Type: |
credit |
| Period Type: |
duration |
|
| X |
- DefinitionThe cash inflow from interest received, classified as investing activities. Reference 1: http://www.xbrl.org/2003/role/disclosureRef
-Name IAS
-Number 7
-IssueDate 2022-03-24
-Paragraph 31
-URI https://taxonomy.ifrs.org/xifrs-link?type=IAS&num=7&code=ifrs-tx-2022-en-r&anchor=para_31&doctype=Standard
-URIDate 2022-03-24
| Name: |
ifrs-full_InterestReceivedClassifiedAsInvestingActivities |
| Namespace Prefix: |
ifrs-full_ |
| Data Type: |
xbrli:monetaryItemType |
| Balance Type: |
debit |
| Period Type: |
duration |
|
| X |
- DefinitionThe cash outflow for payment of lease liabilities, classified as financing activities. [Refer: Lease liabilities] Reference 1: http://www.xbrl.org/2003/role/exampleRef
-Name IAS
-Number 7
-IssueDate 2022-03-24
-Paragraph 17
-Subparagraph e
-URI https://taxonomy.ifrs.org/xifrs-link?type=IAS&num=7&code=ifrs-tx-2022-en-r&anchor=para_17_e&doctype=Standard
-URIDate 2022-03-24
| Name: |
ifrs-full_PaymentsOfLeaseLiabilitiesClassifiedAsFinancingActivities |
| Namespace Prefix: |
ifrs-full_ |
| Data Type: |
xbrli:monetaryItemType |
| Balance Type: |
credit |
| Period Type: |
duration |
|
| X |
- DefinitionThe cash inflow from borrowings obtained. [Refer: Borrowings] Reference 1: http://www.xbrl.org/2003/role/exampleRef
-Name IAS
-Number 7
-IssueDate 2022-03-24
-Paragraph 17
-Subparagraph c
-URI https://taxonomy.ifrs.org/xifrs-link?type=IAS&num=7&code=ifrs-tx-2022-en-r&anchor=para_17_c&doctype=Standard
-URIDate 2022-03-24
| Name: |
ifrs-full_ProceedsFromBorrowingsClassifiedAsFinancingActivities |
| Namespace Prefix: |
ifrs-full_ |
| Data Type: |
xbrli:monetaryItemType |
| Balance Type: |
debit |
| Period Type: |
duration |
|
| X |
- DefinitionThe cash inflow from the sale or issuing of treasury shares. [Refer: Sale or issue of treasury shares; Treasury shares] Reference 1: http://www.xbrl.org/2009/role/commonPracticeRef
-Name IAS
-Number 7
-IssueDate 2022-03-24
-Paragraph 17
-URI https://taxonomy.ifrs.org/xifrs-link?type=IAS&num=7&code=ifrs-tx-2022-en-r&anchor=para_17&doctype=Standard
-URIDate 2022-03-24
| Name: |
ifrs-full_ProceedsFromSaleOrIssueOfTreasuryShares |
| Namespace Prefix: |
ifrs-full_ |
| Data Type: |
xbrli:monetaryItemType |
| Balance Type: |
debit |
| Period Type: |
duration |
|
| X |
- DefinitionThe cash inflow from sales of investments other than investments accounted for using the equity method. [Refer: Investments accounted for using equity method; Investments other than investments accounted for using equity method] Reference 1: http://www.xbrl.org/2009/role/commonPracticeRef
-Name IAS
-Number 7
-IssueDate 2022-03-24
-Paragraph 16
-URI https://taxonomy.ifrs.org/xifrs-link?type=IAS&num=7&code=ifrs-tx-2022-en-r&anchor=para_16&doctype=Standard
-URIDate 2022-03-24
| Name: |
ifrs-full_ProceedsFromSalesOfInvestmentsOtherThanInvestmentsAccountedForUsingEquityMethod |
| Namespace Prefix: |
ifrs-full_ |
| Data Type: |
xbrli:monetaryItemType |
| Balance Type: |
debit |
| Period Type: |
duration |
|
| X |
- DefinitionThe cash inflow from sales of property, plant and equipment, classified as investing activities. [Refer: Property, plant and equipment] Reference 1: http://www.xbrl.org/2003/role/exampleRef
-Name IAS
-Number 7
-IssueDate 2022-03-24
-Paragraph 16
-Subparagraph b
-URI https://taxonomy.ifrs.org/xifrs-link?type=IAS&num=7&code=ifrs-tx-2022-en-r&anchor=para_16_b&doctype=Standard
-URIDate 2022-03-24
| Name: |
ifrs-full_ProceedsFromSalesOfPropertyPlantAndEquipmentClassifiedAsInvestingActivities |
| Namespace Prefix: |
ifrs-full_ |
| Data Type: |
xbrli:monetaryItemType |
| Balance Type: |
debit |
| Period Type: |
duration |
|
| X |
- DefinitionThe profit (loss) from operating activities of the entity. [Refer: Profit (loss)] Reference 1: http://www.xbrl.org/2003/role/exampleRef
-Name IAS
-Number 32
-IssueDate 2022-03-24
-Paragraph IE33
-URI https://taxonomy.ifrs.org/xifrs-link?type=IAS&num=32&code=ifrs-tx-2022-en-r&anchor=para_IE33&doctype=Illustrative%20Examples
-URIDate 2022-03-24
Reference 2: http://www.xbrl.org/2009/role/commonPracticeRef
-Name IAS
-Number 1
-IssueDate 2022-03-24
-Paragraph 85
-URI https://taxonomy.ifrs.org/xifrs-link?type=IAS&num=1&code=ifrs-tx-2022-en-r&anchor=para_85&doctype=Standard
-URIDate 2022-03-24
| Name: |
ifrs-full_ProfitLossFromOperatingActivities |
| Namespace Prefix: |
ifrs-full_ |
| Data Type: |
xbrli:monetaryItemType |
| Balance Type: |
credit |
| Period Type: |
duration |
|
| X |
- DefinitionThe cash outflow for the purchases of intangible assets, classified as investing activities. [Refer: Intangible assets other than goodwill] Reference 1: http://www.xbrl.org/2003/role/exampleRef
-Name IAS
-Number 7
-IssueDate 2022-03-24
-Paragraph 16
-Subparagraph a
-URI https://taxonomy.ifrs.org/xifrs-link?type=IAS&num=7&code=ifrs-tx-2022-en-r&anchor=para_16_a&doctype=Standard
-URIDate 2022-03-24
| Name: |
ifrs-full_PurchaseOfIntangibleAssetsClassifiedAsInvestingActivities |
| Namespace Prefix: |
ifrs-full_ |
| Data Type: |
xbrli:monetaryItemType |
| Balance Type: |
credit |
| Period Type: |
duration |
|
| X |
- DefinitionThe cash outflow for the purchase of interests in investments accounted for using the equity method. [Refer: Investments accounted for using equity method] Reference 1: http://www.xbrl.org/2009/role/commonPracticeRef
-Name IAS
-Number 7
-IssueDate 2022-03-24
-Paragraph 16
-URI https://taxonomy.ifrs.org/xifrs-link?type=IAS&num=7&code=ifrs-tx-2022-en-r&anchor=para_16&doctype=Standard
-URIDate 2022-03-24
| Name: |
ifrs-full_PurchaseOfInterestsInInvestmentsAccountedForUsingEquityMethod |
| Namespace Prefix: |
ifrs-full_ |
| Data Type: |
xbrli:monetaryItemType |
| Balance Type: |
credit |
| Period Type: |
duration |
|
| X |
- DefinitionThe cash outflow for the purchase of investments other than investments accounted for using equity method. [Refer: Investments accounted for using equity method; Investments other than investments accounted for using equity method] Reference 1: http://www.xbrl.org/2009/role/commonPracticeRef
-Name IAS
-Number 7
-IssueDate 2022-03-24
-Paragraph 16
-URI https://taxonomy.ifrs.org/xifrs-link?type=IAS&num=7&code=ifrs-tx-2022-en-r&anchor=para_16&doctype=Standard
-URIDate 2022-03-24
| Name: |
ifrs-full_PurchaseOfInvestmentsOtherThanInvestmentsAccountedForUsingEquityMethod |
| Namespace Prefix: |
ifrs-full_ |
| Data Type: |
xbrli:monetaryItemType |
| Balance Type: |
credit |
| Period Type: |
duration |
|
| X |
- DefinitionThe cash outflow for the purchases of property, plant and equipment, classified as investing activities. [Refer: Property, plant and equipment] Reference 1: http://www.xbrl.org/2003/role/exampleRef
-Name IAS
-Number 7
-IssueDate 2022-03-24
-Paragraph 16
-Subparagraph a
-URI https://taxonomy.ifrs.org/xifrs-link?type=IAS&num=7&code=ifrs-tx-2022-en-r&anchor=para_16_a&doctype=Standard
-URIDate 2022-03-24
| Name: |
ifrs-full_PurchaseOfPropertyPlantAndEquipmentClassifiedAsInvestingActivities |
| Namespace Prefix: |
ifrs-full_ |
| Data Type: |
xbrli:monetaryItemType |
| Balance Type: |
credit |
| Period Type: |
duration |
|
| X |
- DefinitionThe cash outflow to settle borrowings, classified as financing activities. [Refer: Borrowings] Reference 1: http://www.xbrl.org/2003/role/exampleRef
-Name IAS
-Number 7
-IssueDate 2022-03-24
-Paragraph 17
-Subparagraph d
-URI https://taxonomy.ifrs.org/xifrs-link?type=IAS&num=7&code=ifrs-tx-2022-en-r&anchor=para_17_d&doctype=Standard
-URIDate 2022-03-24
| Name: |
ifrs-full_RepaymentsOfBorrowingsClassifiedAsFinancingActivities |
| Namespace Prefix: |
ifrs-full_ |
| Data Type: |
xbrli:monetaryItemType |
| Balance Type: |
credit |
| Period Type: |
duration |
|
| X |
- DefinitionCash Inflows Relating To Insurance Proceeds From Loss Of PPE, InvestingActivities
| Name: |
nggtf_CashInflowsRelatingToInsuranceProceedsFromLossOfPPEInvestingActivities |
| Namespace Prefix: |
nggtf_ |
| Data Type: |
xbrli:monetaryItemType |
| Balance Type: |
debit |
| Period Type: |
duration |
|
| X |
- DefinitionPayments For Derivatives Contracts, Classified As Financing Activities
| Name: |
nggtf_PaymentsForDerivativesContractsClassifiedAsFinancingActivities |
| Namespace Prefix: |
nggtf_ |
| Data Type: |
xbrli:monetaryItemType |
| Balance Type: |
credit |
| Period Type: |
duration |
|
| X |
- DefinitionProceeds From Derivatives Contracts, Classified As Financing Activities
| Name: |
nggtf_ProceedsFromDerivativesContractsClassifiedAsFinancingActivities |
| Namespace Prefix: |
nggtf_ |
| Data Type: |
xbrli:monetaryItemType |
| Balance Type: |
debit |
| Period Type: |
duration |
|
| X |
- DefinitionTransactions In Own Shares
| Name: |
nggtf_TransactionsInOwnShares |
| Namespace Prefix: |
nggtf_ |
| Data Type: |
xbrli:monetaryItemType |
| Balance Type: |
debit |
| Period Type: |
duration |
|
| X |
- Details
| Name: |
ifrs-full_CounterpartiesAxis=nggtf_TheNarragansettElectricCompanyMember |
| Namespace Prefix: |
|
| Data Type: |
na |
| Balance Type: |
|
| Period Type: |
|
|
| X |
- Details
| Name: |
ifrs-full_CounterpartiesAxis=nggtf_NationalGridRenewablesAndEmeraldEnergyVentureLLCMember |
| Namespace Prefix: |
|
| Data Type: |
na |
| Balance Type: |
|
| Period Type: |
|
|
v3.23.3
Basis of preparation and new accounting standards, interpretations and amendments
|
6 Months Ended |
Sep. 30, 2023 |
|---|
| Accounting Policies, Changes In Accounting Estimates And Errors [Abstract] |
|
| Basis of preparation |
1. Basis of preparation and new accounting standards, interpretations and amendments
The half year financial information covers the six month periods ended 30 September 2023 and 30 September 2022 and has been prepared in accordance with IAS 34 ‘Interim Financial Reporting’ as issued by the International Accounting Standards Board (IASB). This condensed set of financial statements comprises the unaudited financial information for the half years ended 30 September 2023 and 2022, together with the audited consolidated statement of financial position as at 31 March 2023. The half year financial information has been prepared applying consistent accounting policies to those applied by the Group for the year ended 31 March 2023. The notes to the unaudited financial information are prepared on a continuing basis unless otherwise stated.
The financial information for the six months ended 30 September 2023 does not constitute statutory accounts as defined in Section 434 of the Companies Act 2006. It should be read in conjunction with the statutory accounts for the year ended 31 March 2023, which were prepared in accordance with International Financial Reporting Standards (IFRS) as issued by the IASB.
The key sources of estimation uncertainty and areas of judgement for the period ended 30 September 2023 are aligned to those disclosed in the Annual Report and Accounts for year ended 31 March 2023, with the following amendments: •whilst the entirety of the UK Electricity System Operator (ESO) is expected to transfer out of the Group to become part of an independent system operator public body, the Independent System Operator and Planner (ISOP), we have concluded that the held for sale criteria were not met as at 30 September 2023 due to the ESO not being available for sale in its present condition given the formation of the ISOP at the half year remained subject to legislative approval. The Group has identified this as an additional area of judgement in the period. The ESO was subsequently classified as held for sale at the end of October 2023 (see note 17); and •the value attributable to GasT TopCo Limited in determining the fair value of the options over the Group’s 40% interests (see note 6) is no longer considered to represent a key source of estimation uncertainty. 1. Basis of preparation and new accounting standards, interpretations and amendments (continued)
Going concern As part of the Directors’ consideration of the appropriateness of adopting the going concern basis of accounting in preparing the half year financial information, the Directors have considered the Group’s principal risks (discussed on page 60) alongside potential downside business cash flow scenarios impacting the Group’s operations. The Directors specifically considered both a base case and a reasonable worst-case scenario for business cash flows. The assessment is prepared on the conservative assumption that the Group has no access to the debt capital markets.
The main additional cash flow impacts identified in the reasonable worst-case scenario are: •the timing of the sale of assets classified as held for sale; •adverse impacts of inflation and incremental spend on our capital expenditure programme; •adverse impact from timing across the Group (i.e. a net under-recovery of allowed revenues or reductions in over-collections) and slower collections of outstanding receivables; •higher operating and financing costs than expected; including non-delivery of planned efficiencies across the Group; and •the potential impact of further significant storm costs in the US.
As part of their analysis, the Board also considered the following potential levers at their discretion to improve the position identified by the analysis if the debt capital markets are not accessible: •the payment of dividends to shareholders; •significant changes in the phasing of the Group’s capital expenditure programme, with elements of non-essential works and programmes delayed; and •a number of further reductions in operating expenditure across the Group.
As at 30 September 2023, the Group had undrawn committed facilities available for general corporate purposes amounting to £8.0 billion. Based on these available liquidity resources and having considered the reasonable worst-case scenario, and the further levers at the Board’s discretion, the Group has not identified any material uncertainties relating to events or conditions that, individually or collectively, may cast significant doubt on its ability to continue as a going concern for the foreseeable future, a period not less than 12 months from the date of this report.
In addition to the above, the ability to raise new and extend existing financing was separately included in the analysis, and the Directors noted the c.£3.0 billion of new long-term senior debt issued in the period from 1 April to 30 September 2023 as evidence of the Group’s ability to continue to have access to the debt capital markets if needed.
Based on the above, the Directors have concluded the Group is well placed to manage its financing and other business risks satisfactorily, and have a reasonable expectation that the Group will have adequate resources to continue in operation for at least 12 months from the signing date of these consolidated interim financial statements. They therefore consider it appropriate to adopt the going concern basis of accounting in preparing the half year financial information.
New IFRS accounting standards, interpretations and amendments adopted in the period There are no new standards, interpretations or amendments, issued by the IASB or by the IFRS Interpretations Committee (IFRIC), that are applicable for the period commencing on 1 April 2023 and have had a material impact on the Group’s results.
New IFRS accounting standards, interpretations and amendments not yet adopted There are no new accounting standards and amendments to existing standards that have been issued, but are not yet effective that were not disclosed in our Annual Report and Accounts. The Group has not early adopted any standard, amendment or interpretation that has been issued but is not yet effective.
|
| New accounting standards, interpretations and amendments |
1. Basis of preparation and new accounting standards, interpretations and amendments
The half year financial information covers the six month periods ended 30 September 2023 and 30 September 2022 and has been prepared in accordance with IAS 34 ‘Interim Financial Reporting’ as issued by the International Accounting Standards Board (IASB). This condensed set of financial statements comprises the unaudited financial information for the half years ended 30 September 2023 and 2022, together with the audited consolidated statement of financial position as at 31 March 2023. The half year financial information has been prepared applying consistent accounting policies to those applied by the Group for the year ended 31 March 2023. The notes to the unaudited financial information are prepared on a continuing basis unless otherwise stated.
The financial information for the six months ended 30 September 2023 does not constitute statutory accounts as defined in Section 434 of the Companies Act 2006. It should be read in conjunction with the statutory accounts for the year ended 31 March 2023, which were prepared in accordance with International Financial Reporting Standards (IFRS) as issued by the IASB.
The key sources of estimation uncertainty and areas of judgement for the period ended 30 September 2023 are aligned to those disclosed in the Annual Report and Accounts for year ended 31 March 2023, with the following amendments: •whilst the entirety of the UK Electricity System Operator (ESO) is expected to transfer out of the Group to become part of an independent system operator public body, the Independent System Operator and Planner (ISOP), we have concluded that the held for sale criteria were not met as at 30 September 2023 due to the ESO not being available for sale in its present condition given the formation of the ISOP at the half year remained subject to legislative approval. The Group has identified this as an additional area of judgement in the period. The ESO was subsequently classified as held for sale at the end of October 2023 (see note 17); and •the value attributable to GasT TopCo Limited in determining the fair value of the options over the Group’s 40% interests (see note 6) is no longer considered to represent a key source of estimation uncertainty. 1. Basis of preparation and new accounting standards, interpretations and amendments (continued)
Going concern As part of the Directors’ consideration of the appropriateness of adopting the going concern basis of accounting in preparing the half year financial information, the Directors have considered the Group’s principal risks (discussed on page 60) alongside potential downside business cash flow scenarios impacting the Group’s operations. The Directors specifically considered both a base case and a reasonable worst-case scenario for business cash flows. The assessment is prepared on the conservative assumption that the Group has no access to the debt capital markets.
The main additional cash flow impacts identified in the reasonable worst-case scenario are: •the timing of the sale of assets classified as held for sale; •adverse impacts of inflation and incremental spend on our capital expenditure programme; •adverse impact from timing across the Group (i.e. a net under-recovery of allowed revenues or reductions in over-collections) and slower collections of outstanding receivables; •higher operating and financing costs than expected; including non-delivery of planned efficiencies across the Group; and •the potential impact of further significant storm costs in the US.
As part of their analysis, the Board also considered the following potential levers at their discretion to improve the position identified by the analysis if the debt capital markets are not accessible: •the payment of dividends to shareholders; •significant changes in the phasing of the Group’s capital expenditure programme, with elements of non-essential works and programmes delayed; and •a number of further reductions in operating expenditure across the Group.
As at 30 September 2023, the Group had undrawn committed facilities available for general corporate purposes amounting to £8.0 billion. Based on these available liquidity resources and having considered the reasonable worst-case scenario, and the further levers at the Board’s discretion, the Group has not identified any material uncertainties relating to events or conditions that, individually or collectively, may cast significant doubt on its ability to continue as a going concern for the foreseeable future, a period not less than 12 months from the date of this report.
In addition to the above, the ability to raise new and extend existing financing was separately included in the analysis, and the Directors noted the c.£3.0 billion of new long-term senior debt issued in the period from 1 April to 30 September 2023 as evidence of the Group’s ability to continue to have access to the debt capital markets if needed.
Based on the above, the Directors have concluded the Group is well placed to manage its financing and other business risks satisfactorily, and have a reasonable expectation that the Group will have adequate resources to continue in operation for at least 12 months from the signing date of these consolidated interim financial statements. They therefore consider it appropriate to adopt the going concern basis of accounting in preparing the half year financial information.
New IFRS accounting standards, interpretations and amendments adopted in the period There are no new standards, interpretations or amendments, issued by the IASB or by the IFRS Interpretations Committee (IFRIC), that are applicable for the period commencing on 1 April 2023 and have had a material impact on the Group’s results.
New IFRS accounting standards, interpretations and amendments not yet adopted There are no new accounting standards and amendments to existing standards that have been issued, but are not yet effective that were not disclosed in our Annual Report and Accounts. The Group has not early adopted any standard, amendment or interpretation that has been issued but is not yet effective.
|
| X |
- DefinitionThe disclosure of the basis used for the preparation of the financial statements. Reference 1: http://www.xbrl.org/2009/role/commonPracticeRef
-Name IAS
-Number 1
-IssueDate 2022-03-24
-Paragraph 10
-Subparagraph e
-URI https://taxonomy.ifrs.org/xifrs-link?type=IAS&num=1&code=ifrs-tx-2022-en-r&anchor=para_10_e&doctype=Standard
-URIDate 2022-03-24
| Name: |
ifrs-full_DisclosureOfBasisOfPreparationOfFinancialStatementsExplanatory |
| Namespace Prefix: |
ifrs-full_ |
| Data Type: |
dtr-types:textBlockItemType |
| Balance Type: |
na |
| Period Type: |
duration |
|
| X |
- DefinitionThe entire disclosure for significant accounting policies applied by the entity. Reference 1: http://www.xbrl.org/2003/role/disclosureRef
-Note Expiry date 2023-01-01
-Name IAS
-Number 1
-IssueDate 2022-03-24
-Paragraph 117
-URI https://taxonomy.ifrs.org/xifrs-link?type=IAS&num=1&code=ifrs-tx-2022-en-r&anchor=para_117&doctype=Standard
-URIDate 2022-03-24
| Name: |
ifrs-full_DisclosureOfSummaryOfSignificantAccountingPoliciesExplanatory |
| Namespace Prefix: |
ifrs-full_ |
| Data Type: |
dtr-types:textBlockItemType |
| Balance Type: |
na |
| Period Type: |
duration |
|
| X |
- DefinitionAccounting Policies, Changes In Accounting Estimates And Errors [Abstract]
| Name: |
nggtf_AccountingPoliciesChangesInAccountingEstimatesAndErrorsAbstract |
| Namespace Prefix: |
nggtf_ |
| Data Type: |
xbrli:stringItemType |
| Balance Type: |
na |
| Period Type: |
duration |
|
v3.23.3
Segmental analysis
|
6 Months Ended |
Sep. 30, 2023 |
|---|
| Disclosure of operating segments [abstract] |
|
| Segmental analysis |
2. Segmental analysis
Revenue and the results of the business are analysed by operating segment, based on the information the Board use internally for the purposes of evaluating the performance of each operating segment and determining resource allocation between them. The Board is National Grid’s chief operating decision maker (as defined by IFRS 8 ‘Operating Segments’) and assesses the profitability of a profit measure that excludes certain income and expenses. We call that measure ‘adjusted profit’. Adjusted profit excludes exceptional items and remeasurements (as defined in note 4) and is used by management to monitor financial performance as it is considered that it aids the comparability of our reported financial performance from year to year. As a matter of course, the Board also considers profitability by segment, excluding the effect of major storms and timing adjustments relating to revenue and certain pass-through costs. However, the measure of profit disclosed in this note is operating profit before exceptional items and remeasurements, as this is the measure that is most consistent with the IFRS results reported within these financial statements. In the year ended 31 March 2023, the National Grid Ventures (NGV) operating segment met the quantitative thresholds set out in IFRS 8 to be identified as the Group’s sixth separate reportable segment. Accordingly, the Group’s operating segments were modified and the data relating to previous periods has been restated to reflect this change. The results of our six principal businesses are reported to the Board and are accordingly treated as reportable operating segments. All other operating segments are either reported to the Board on an aggregated basis or do not meet the quantitative threshold in order to be considered a separate operating segment. The following table describes the main activities for each reportable operating segment: | | | | | | | UK Electricity Transmission | The high-voltage electricity transmission networks in England and Wales. This includes our Accelerated Strategic Transmission Investment projects to connect more clean, low-carbon power to the transmission network in England and Wales. | | UK Electricity Distribution | The electricity distribution networks of NGED in the East Midlands, West Midlands and South West of England and South Wales. | | UK Electricity System Operator | The Great Britain system operator. The ESO has not met the criteria to be classified as held for sale as at 30 September 2023. | | New England | Gas distribution networks, electricity distribution networks and high-voltage electricity transmission networks in New England. | | New York | Gas distribution networks, electricity distribution networks and high-voltage electricity transmission networks in New York. | | National Grid Ventures | Comprises all commercial operations in LNG at the Isle of Grain in the UK and Providence, Rhode Island in the US, our electricity generation business in the US, our electricity interconnectors in the UK and our investment in National Grid Renewables Development LLC, our renewables business in the US. NGV operates outside our regulated core business. Our US LNG operations were reclassified from the New England segment following an internal reorganisation in the period. |
The New England and New York segments typically experience seasonal fluctuations in revenue and operating profit due to higher delivery volumes during the second half of the financial year, for example as a result of colder weather over the winter months driving increased heating demand. These seasonal fluctuations have a consequential impact on the working capital balances (primarily trade debtors and accrued income) in the consolidated statement of financial position at 30 September 2023 when compared to 31 March 2023. The majority of UK revenues are derived from the supply of network capacity rather than the supply of commodities and therefore are not subject to the same seasonal fluctuations as in New York and New England.
Other activities that do not form part of any of the segments in the above table primarily relate to our UK property business together with insurance and corporate activities in the UK and US and the Group’s investments in technology and innovation companies through National Grid Partners. 2. Segmental analysis (continued)
(a)Revenue | | | | | | | | | | | | | | | | | | | | | | | | | Six months ended 30 September | 2023 | | 2022² | | Total sales | Sales between segments1 | Sales to third parties | | Total sales | Sales between segments1 | Sales to third
parties | | £m | £m | £m | | £m | £m | £m | | Operating segments – continuing operations: | | | | | | | | | UK Electricity Transmission | 1,356 | | (19) | | 1,337 | | | 969 | | (14) | | 955 | | | UK Electricity Distribution | 850 | | (2) | | 848 | | | 1,005 | | (8) | | 997 | | | UK Electricity System Operator | 1,734 | | (17) | | 1,717 | | | 2,060 | | (15) | | 2,045 | | | New England | 1,441 | | — | | 1,441 | | | 1,760 | | — | | 1,760 | | | New York | 2,365 | | — | | 2,365 | | | 2,758 | | — | | 2,758 | | | National Grid Ventures | 666 | | (27) | | 639 | | | 685 | | (9) | | 676 | | | Other | 142 | | — | | 142 | | | 253 | | — | | 253 | | | Total revenue from continuing operations | 8,554 | | (65) | | 8,489 | | | 9,490 | | (46) | | 9,444 | | | | | | | | | | | Geographical areas: | | | | | | | | | UK | | | 4,309 | | | | | 4,589 | | | US | | | 4,180 | | | | | 4,855 | | | Total revenue from continuing operations | | | 8,489 | | | | | 9,444 | |
1.Sales between operating segments are priced having regard to the regulatory and legal requirements to which the businesses are subject. The analysis of revenue by geographical area is on the basis of destination. There are no material sales between the UK and US geographical areas. 2.Comparative amounts have been re-presented to reflect NGV as a separate operating segment.
(b)Operating profit/(loss) | | | | | | | | | | | | | | | | | | | | | | | | | | | | Before exceptional items and remeasurements | | Exceptional items and remeasurements (see note 4) | | After exceptional items and remeasurements | | Six months ended 30 September | 2023 | 2022¹ | | 2023 | 2022¹ | | 2023 | 2022¹ | | £m | £m | | £m | £m | | £m | £m | | Operating segments – continuing operations: | | | | | | | | | | UK Electricity Transmission | 839 | | 499 | | (1) | | (6) | | | 838 | | 493 | | | UK Electricity Distribution | 476 | | 531 | | | (4) | | (9) | | | 472 | | 522 | | | UK Electricity System Operator | 443 | | 147 | | | — | | (1) | | | 443 | | 146 | | | New England | (32) | | 193 | | | (15) | | 527 | | | (47) | | 720 | | | New York | (30) | | (18) | | | 38 | | (8) | | | 8 | | (26) | | | National Grid Ventures | 219 | | 259 | | | 91 | | 49 | | | 310 | | 308 | | | Other | (13) | | 145 | | | (26) | | (69) | | | (39) | | 76 | | | Total operating profit from continuing operations | 1,902 | | 1,756 | | | 83 | | 483 | | | 1,985 | | 2,239 | | | | | | | | | | | | Geographical areas: | | | | | | | | | | UK | 1,956 | | 1,550 | | | 60 | | (32) | | | 2,016 | | 1,518 | | | US | (54) | | 206 | | | 23 | | 515 | | | (31) | | 721 | | | Total operating profit from continuing operations | 1,902 | | 1,756 | | | 83 | | 483 | | | 1,985 | | 2,239 | |
1.Comparative amounts have been re-presented to reflect NGV as a separate operating segment. | | | | | | | | | | | | | | | | | | | | | | | | | | | | Before exceptional items and remeasurements | | Exceptional items and remeasurements (see note 4) | | After exceptional items and remeasurements | | Six months ended 30 September | 2023 | 2022¹ | | 2023 | 2022¹ | | 2023 | 2022¹ | | £m | £m | | £m | £m | | £m | £m | | Reconciliation to profit before tax: | | | | | | | | | | Operating profit from continuing operations | 1,902 | | 1,756 | | | 83 | | 483 | | | 1,985 | | 2,239 | | | Share of post-tax results of joint ventures and associates | 59 | | 70 | | | 12 | | (19) | | | 71 | | 51 | | | Finance income | 123 | | 69 | | | (8) | | (32) | | | 115 | | 37 | | | Finance costs | (834) | | (801) | | | 34 | | 140 | | | (800) | | (661) | | | Total profit before tax from continuing operations | 1,250 | | 1,094 | | | 121 | | 572 | | | 1,371 | | 1,666 | |
1.Comparative amounts have been re-presented to reflect the classification of the FAA option as held for sale and within discontinued operations. 2. Segmental analysis (continued)
(c)Capital expenditure Capital expenditure represents additions to property, plant and equipment and other intangible assets but excludes additional investments in and loans to joint ventures and associates.
| | | | | | | | | | | | | | | | | | | | | | | | | | | | Net book value of property, plant and equipment and other intangible assets | | Capital expenditure | | Depreciation, amortisation
and impairment | | 30 September 2023 | 31 March 2023¹ | | 30 September 2023 | 30 September 2022¹ | | 30 September 2023 | 30 September 2022¹ | | £m | £m | | £m | £m | | £m | £m | | Operating segments: | | | | | | | | | | UK Electricity Transmission | 16,030 | | 15,483 | | | 800 | | 629 | | | (250) | | (235) | | | UK Electricity Distribution | 13,940 | | 13,462 | | | 608 | | 584 | | | (105) | | (104) | | | UK Electricity System Operator | 434 | | 411 | | | 75 | | 42 | | | (52) | | (40) | | | New England | 13,781 | | 13,033 | | | 789 | | 801 | | | (204) | | (184) | | | New York | 22,937 | | 21,730 | | | 1,257 | | 1,242 | | | (321) | | (292) | | | National Grid Ventures | 3,956 | | 3,880 | | | 175 | | 410 | | | (84) | | (73) | | | Other | 35 | | 38 | | | 2 | | 9 | | | (5) | | (4) | | | Total | 71,113 | | 68,037 | | | 3,706 | | 3,717 | | | (1,021) | | (932) | | | | | | | | | | | | Geographical areas: | | | | | | | | | | UK | 33,475 | | 32,343 | | | 1,649 | | 1,594 | | | (464) | | (432) | | | US | 37,638 | | 35,694 | | | 2,057 | | 2,123 | | | (557) | | (500) | | | Total | 71,113 | | 68,037 | | | 3,706 | | 3,717 | | | (1,021) | | (932) | | | | | | | | | | | | By asset type: | | | | | | | | | | Property, plant and equipment | 67,396 | | 64,433 | | | 3,449 | | 3,490 | | | (868) | | (829) | | | Other intangible assets | 3,717 | | 3,604 | | | 257 | | 227 | | | (153) | | (103) | | | Total | 71,113 | | 68,037 | | | 3,706 | | 3,717 | | | (1,021) | | (932) | |
1.Comparative amounts have been re-presented to reflect NGV as a separate operating segment and the reclassification of our US LNG operations from New England to NGV following an internal reorganisation in the period.
|
| X |
- DefinitionThe entire disclosure for operating segments. Reference 1: http://www.xbrl.org/2003/role/disclosureRef
-Name IFRS
-Number 8
-IssueDate 2022-03-24
-Section Disclosure
-URI https://taxonomy.ifrs.org/xifrs-link?type=IFRS&num=8&code=ifrs-tx-2022-en-r&doctype=Standard&dita_xref=IFRS08_g20-24__IFRS08_g20-24_TI
-URIDate 2022-03-24
| Name: |
ifrs-full_DisclosureOfEntitysReportableSegmentsExplanatory |
| Namespace Prefix: |
ifrs-full_ |
| Data Type: |
dtr-types:textBlockItemType |
| Balance Type: |
na |
| Period Type: |
duration |
|
| X |
- References
+ Details
| Name: |
ifrs-full_DisclosureOfOperatingSegmentsAbstract |
| Namespace Prefix: |
ifrs-full_ |
| Data Type: |
xbrli:stringItemType |
| Balance Type: |
na |
| Period Type: |
duration |
|
v3.23.3
Revenue
|
6 Months Ended |
Sep. 30, 2023 |
|---|
| Revenue [abstract] |
|
| Revenue |
3. Revenue
Under IFRS 15 ‘Revenue from Contracts with Customers’, revenue is recorded as or when the Group satisfies a performance obligation by transferring a promised good or service to a customer. A good or service is transferred when the customer obtains control of that good or service.
The transfer of control of our distribution or transmission services coincides with the use of our network, as electricity and gas pass through our network and reach our customers. The Group principally satisfies its performance obligations over time and the amount of revenue recorded corresponds to the amounts billed and accrued for volumes of gas and electricity delivered/transferred to/from our customers. | | | | | | | | | | | | | | | | | | | | | | | | | | | Revenue for the six months ended 30 September 2023 | UK Electricity Transmission
£m | UK Electricity Distribution
£m | UK Electricity System Operator
£m | New
England
£m | New
York
£m | National Grid Ventures
£m | Other
£m | Total
£m | | Revenue under IFRS 15 | | | | | | | | | | Transmission | 1,299 | | — | | 5 | | 43 | | 283 | | 426 | | — | | 2,056 | | | Distribution | — | | 810 | | — | | 1,329 | | 2,047 | | — | | — | | 4,186 | | | System Operator | — | | — | | 1,712 | | — | | — | | — | | — | | 1,712 | | Other1 | 9 | | 36 | | — | | 4 | | 7 | | 75 | | — | | 131 | | | Total IFRS 15 revenue | 1,308 | | 846 | | 1,717 | | 1,376 | | 2,337 | | 501 | | — | | 8,085 | | | Other revenue | | | | | | | | | | Generation | — | | — | | — | | — | | — | | 181 | | — | | 181 | | Other2 | 29 | | 2 | | — | | 65 | | 28 | | (43) | | 142 | | 223 | | | Total other revenue | 29 | | 2 | | — | | 65 | | 28 | | 138 | | 142 | | 404 | | | Total revenue from continuing operations | 1,337 | | 848 | | 1,717 | | 1,441 | | 2,365 | | 639 | | 142 | | 8,489 | |
| | | | | | | | | | | | | | | | | | | | | | | | | | | Geographic split of revenue for the six months ended 30 September 2023 | UK Electricity Transmission
£m | UK Electricity Distribution
£m | UK Electricity System Operator
£m | New England
£m | New
York
£m | National Grid Ventures
£m | Other
£m | Total
£m | | Revenue under IFRS 15 | | | | | | | | | | UK | 1,308 | | 846 | | 1,717 | | — | | — | | 430 | | — | | 4,301 | | | US | — | | — | | — | | 1,376 | | 2,337 | | 71 | | — | | 3,784 | | | Total IFRS 15 revenue | 1,308 | | 846 | | 1,717 | | 1,376 | | 2,337 | | 501 | | — | | 8,085 | | | Other revenue | | | | | | | | | | UK | 29 | | 2 | | — | | — | | — | | (50) | | 27 | | 8 | | | US | — | | — | | — | | 65 | | 28 | | 188 | | 115 | | 396 | | | Total other revenue | 29 | | 2 | | — | | 65 | | 28 | | 138 | | 142 | | 404 | | | Total revenue from continuing operations | 1,337 | | 848 | | 1,717 | | 1,441 | | 2,365 | | 639 | | 142 | | 8,489 | |
1.The UK Electricity Transmission and UK Electricity Distribution other IFRS 15 revenue principally relates to engineering recharges, which are the recovery of costs incurred for construction work requested by customers, such as the re-routing of existing network assets. Within NGV, the other IFRS 15 revenue principally relates to revenue generated from our NG Renewables business. 2.Other revenue, recognised in accordance with accounting standards other than IFRS 15, includes property sales by our UK commercial property business, rental income, income arising in connection with the Transition Services Agreements in place following the sales of The Narragansett Electric Company (NECO) and the UK Gas Transmission business, and an adjustment to NGV revenue in respect of the interconnector cap and floor and Use of Revenue regimes constructed by Ofgem. 3. Revenue (continued)
| | | | | | | | | | | | | | | | | | | | | | | | | | | Revenue for the six months ended 30 September 2022 | UK Electricity Transmission
£m | UK Electricity Distribution
£m | UK Electricity System Operator
£m | New England
£m | New York
£m | National Grid Ventures¹ £m | Other¹ £m | Total
£m | | Revenue under IFRS 15 | | | | | | | | | | Transmission | 931 | | — | | 77 | | 53 | | 117 | | 306 | | — | | 1,484 | | | Distribution | — | | 940 | | — | | 1,675 | | 2,617 | | — | | — | | 5,232 | | | System Operator | — | | — | | 1,968 | | — | | — | | — | | — | | 1,968 | | Other2 | 16 | | 43 | | — | | 4 | | 6 | | 69 | | — | | 138 | | | Total IFRS 15 revenue | 947 | | 983 | | 2,045 | | 1,732 | | 2,740 | | 375 | | — | | 8,822 | | | Other revenue | | | | | | | | | | Generation | — | | — | | — | | — | | — | | 224 | | — | | 224 | | Other3 | 8 | | 14 | | — | | 28 | | 18 | | 77 | | 253 | | 398 | | | Total other revenue | 8 | | 14 | | — | | 28 | | 18 | | 301 | | 253 | | 622 | | | Total revenue from continuing operations | 955 | | 997 | | 2,045 | | 1,760 | | 2,758 | | 676 | | 253 | | 9,444 | |
| | | | | | | | | | | | | | | | | | | | | | | | | | | Geographic split of revenue for the six months ended 30 September 2022 | UK Electricity Transmission
£m | UK Electricity Distribution
£m | UK Electricity System Operator
£m | New England
£m | New York
£m | National Grid Ventures¹ £m | Other¹ £m | Total
£m | | Revenue under IFRS 15 | | | | | | | | | | UK | 947 | | 983 | | 2,045 | | — | | — | | 310 | | — | | 4,285 | | | US | — | | — | | — | | 1,732 | | 2,740 | | 65 | | — | | 4,537 | | | Total IFRS 15 revenue | 947 | | 983 | | 2,045 | | 1,732 | | 2,740 | | 375 | | — | | 8,822 | | | Other revenue | | | | | | | | | | UK | 8 | | 14 | | — | | — | | — | | 83 | | 199 | | 304 | | | US | — | | — | | — | | 28 | | 18 | | 218 | | 54 | | 318 | | | Total other revenue | 8 | | 14 | | — | | 28 | | 18 | | 301 | | 253 | | 622 | | | Total revenue from continuing operations | 955 | | 997 | | 2,045 | | 1,760 | | 2,758 | | 676 | | 253 | | 9,444 | |
1.Comparative amounts have been re-presented to reflect NGV as a separate operating segment. 2.The UK Electricity Transmission and UK Electricity Distribution other IFRS 15 revenue principally relates to engineering recharges, which are the recovery of costs incurred for construction work requested by customers, such as the re-routing of existing network assets. Within NGV, the other IFRS 15 revenue principally relates to revenue generated from our NG Renewables business. 3.Other revenue, recognised in accordance with accounting standards other than IFRS 15, includes property sales by our UK commercial property business, rental income and income arising in connection with the Transition Services Agreement with PPL Rhode Island Holdings, LLC following the sale of NECO. In the period ended 30 September 2022 the Group also recognised other income relating to an insurance claim.
|
| X |
- DefinitionThe entire disclosure for revenue from contracts with customers. Reference 1: http://www.xbrl.org/2003/role/disclosureRef
-Name IFRS
-Number 15
-IssueDate 2022-03-24
-Section Presentation
-URI https://taxonomy.ifrs.org/xifrs-link?type=IFRS&num=15&code=ifrs-tx-2022-en-r&doctype=Standard&dita_xref=IFRS15_g105-109__IFRS15_g105-109_TI
-URIDate 2022-03-24
Reference 2: http://www.xbrl.org/2003/role/disclosureRef
-Name IFRS
-Number 15
-IssueDate 2022-03-24
-Section Disclosure
-URI https://taxonomy.ifrs.org/xifrs-link?type=IFRS&num=15&code=ifrs-tx-2022-en-r&doctype=Standard&dita_xref=IFR15_g110-129_IFRS15_g110-129_TI
-URIDate 2022-03-24
| Name: |
ifrs-full_DisclosureOfRevenueFromContractsWithCustomersExplanatory |
| Namespace Prefix: |
ifrs-full_ |
| Data Type: |
dtr-types:textBlockItemType |
| Balance Type: |
na |
| Period Type: |
duration |
|
| X |
- References
+ Details
| Name: |
ifrs-full_RevenueAbstract |
| Namespace Prefix: |
ifrs-full_ |
| Data Type: |
xbrli:stringItemType |
| Balance Type: |
na |
| Period Type: |
duration |
|
v3.23.3
Exceptional items and remeasurements
|
6 Months Ended |
Sep. 30, 2023 |
|---|
| Exceptional Items And Remeasurements [Abstract] |
|
| Exceptional items and remeasurements |
4. Exceptional items and remeasurements
To monitor our segmental financial performance, we use an adjusted consolidated profit measure that excludes certain income and expenses. We exclude items from adjusted profit because, if included, these items could distort understanding of our performance in the period and the comparability between periods. With respect to restructuring costs, these represent additional expenses incurred that are not related to normal business and day‑to-day activities. These can take place over multiple reporting periods given the scale of the Group, the nature and complexity of the transformation initiatives and due to the impact of strategic transactions.
Remeasurements comprise unrealised gains or losses recorded in the consolidated income statement arising from changes in the fair value of certain financial assets and liabilities categorised as held at fair value through profit and loss (FVTPL). Once the fair value movements are realised (for example, when the derivative matures), the previously recognised fair value movements are then reversed through remeasurements and recognised within earnings before exceptional items and remeasurements. These assets and liabilities include commodity contracts and derivative financial instruments to the extent that hedge accounting is either not achieved or is not effective. We have also classified the unrealised gains or losses reported in profit and loss on certain additional assets treated as FVTPL within remeasurements. These relate to financial assets (which fail the ‘solely payments of principal and interest test’ under IFRS 9), the money market fund investments used by Group Treasury for cash management purposes and the net foreign exchange gains and losses on borrowing activities. These are offset by foreign exchange losses and gains on financing derivatives measured at fair value. In all cases, these fair values increase or decrease because of changes in foreign exchange, commodity or other financial indices over which we have no control.
| | | | | | | | | | | | | Six months ended 30 September 2023 | Exceptional items
£m | Remeasurements
£m | Total
£m | | Included within operating profit from continuing operations | | | | | Cost efficiency programme | (39) | | — | | (39) | | | Transaction, separation and integration costs¹ | (11) | | — | | (11) | | | IFA1 fire insurance proceeds | 92 | | — | | 92 | | | Net gains on commodity contract derivatives | — | | 41 | | 41 | | | 42 | | 41 | | 83 | | | | | | | | | | | | | | | | | | | | | | | | | | | | | | | | | | | | | | | | | | | | | |
| | | | | | | | | | | | | Six months ended 30 September 2022² | Exceptional items
£m | Remeasurements
£m | Total
£m | | Included within operating profit from continuing operations | | | | | Net gain on disposal of NECO | 511 | | — | | 511 | | | Cost efficiency programme | (61) | | — | | (61) | | Transaction, separation and integration costs1 | (65) | | — | | (65) | | | IFA1 fire insurance proceeds | 33 | | — | | 33 | | | Net gains on commodity contract derivatives | — | | 65 | | 65 | | | 418 | | 65 | | 483 | | | | | | | | | | | | | | | | | | | | | | | | | | | | | | | | | | | | | | | | | | | | | |
1.Transaction, separation and integration costs represent the aggregate of distinct activities undertaken by the Group in the periods presented. 2.Comparative amounts have been re-presented to reflect the classification of the FAA option as held for sale and within discontinued operations.
Cost efficiency programme: During the period, the Group incurred a further £39 million (2022: £61 million) of costs in relation to the major cost efficiency programme announced in November 2021, that targeted at least £400 million savings per annum across the Group by the end of three years. The costs recognised in the period primarily relate to redundancy provisions, employee costs and professional fees incurred in delivering the programme. Whilst the costs incurred during the period do not meet the quantitative threshold to be classified as exceptional on a standalone basis, when taken in aggregate with the £142 million of costs incurred since the announcement of the programme, the costs qualify for exceptional treatment in line with our exceptional items policy. Estimated costs expected to be incurred over the remainder of the programme to 31 March 2024 remain consistent with those disclosed in the Annual Report and Accounts for year the ended 31 March 2023. The total cash outflow for the period in relation to these costs was £28 million (2022: £38 million).
Transaction, separation and integration costs: During the period, £11 million (2022: £65 million) of transaction and separation costs were incurred in relation to the disposals of NECO and the UK Gas Transmission business (see note 6) and the integration of NGED. The costs incurred primarily relate to legal fees, professional fees, and employee costs. The costs have been classified as exceptional, consistent with similar costs for the year ended 31 March 2023 and past precedent. The total cash outflow for the period in relation to these costs was £9 million (2022: £59 million). 4. Exceptional items and remeasurements (continued)
IFA1 interconnector insurance recovery: In September 2021, a fire at the IFA1 converter station in Sellindge, Kent caused significant damage to infrastructure on-site. In the period, the Group recognised net insurance claims of £92 million (2022: £33 million) which were recognised as exceptional in line with our exceptional items policy and consistent with related claims in the prior year. The total cash inflow in the period in relation to the property damage insurance proceeds was £nil (2022: £33 million).
Net gain on disposal of NECO: During the prior period, the Group recognised a gain of £511 million on the disposal of 100% of the share capital of NECO to PPL Rhode Island Holdings, LLC for cash consideration of £3.1 billion ($3.9 billion). The receipt of cash was recognised within net cash used in investing activities within the consolidated cash flow statement.
Details of remeasurements, tax exceptional items and the tax effect of exceptional items and remeasurements are also provided in this note.
| | | | | | | | | | | | | Six months ended 30 September 2023 | Exceptional items
£m | Remeasurements
£m | Total
£m | | Included within operating profit from continuing operations | 42 | | 41 | | 83 | | | | | | | | | | | | | | | | | | | | | | Included within net finance costs (note 5) | | | | | Net gains on derivative financial instruments | — | | 34 | | 34 | | | Net losses on financial assets at fair value through profit and loss | — | | (8) | | (8) | | | — | | 26 | | 26 | | | Included within share of post-tax results of joint ventures and associates | | | | | Net gains on financial instruments | — | | 12 | | 12 | | | — | | 12 | | 12 | | | | | | | Total included within profit before tax from continuing operations | 42 | | 79 | | 121 | | | Tax on exceptional items and remeasurements | 1 | | (21) | | (20) | | Total exceptional items and remeasurements after tax from
continuing operations | 43 | | 58 | | 101 | |
| | | | | | | | | | | | | Six months ended 30 September 2022¹ | Exceptional items
£m | Remeasurements
£m | Total
£m | | Included within operating profit from continuing operations | 418 | | 65 | | 483 | | | | | | | | | | | | | | | | | | | | | | | | | | Included within net finance costs (note 5) | | | | | Net gains on derivative financial instruments | — | | 140 | | 140 | | | Net losses on financial assets at fair value through profit and loss | — | | (32) | | (32) | | | — | | 108 | | 108 | | | Included within share of post-tax results of joint ventures and associates | | | | | Net losses on financial instruments | — | | (19) | | (19) | | | — | | (19) | | (19) | | | | | | | Total included within profit before tax from continuing operations | 418 | | 154 | | 572 | | | Tax on exceptional items and remeasurements | (221) | | (49) | | (270) | | Total exceptional items and remeasurements after tax from
continuing operations | 197 | | 105 | | 302 | |
1.Comparative amounts have been re-presented to reflect the classification of the FAA option as held for sale and within discontinued operations.
|
| X |
- DefinitionDisclosure Of Exceptional items And Remeasurements [Text Block]
| Name: |
nggtf_DisclosureOfExceptionalItemsAndRemeasurementsTextBlock |
| Namespace Prefix: |
nggtf_ |
| Data Type: |
dtr-types:textBlockItemType |
| Balance Type: |
na |
| Period Type: |
duration |
|
| X |
- DefinitionExceptional Items And Remeasurements [Abstract]
| Name: |
nggtf_ExceptionalItemsAndRemeasurementsAbstract |
| Namespace Prefix: |
nggtf_ |
| Data Type: |
xbrli:stringItemType |
| Balance Type: |
na |
| Period Type: |
duration |
|
v3.23.3
Finance income and costs
|
6 Months Ended |
Sep. 30, 2023 |
|---|
| Analysis of income and expense [abstract] |
|
| Finance income and costs |
5. Finance income and costs | | | | | | | | | | | | | | | | | | 2023 | 2022¹ | | Six months ended 30 September | Notes | | £m | £m | | Finance income | | | | | | Interest income from financing activities | | | 52 | | 14 | | | Net interest on pensions and other post-retirement benefit obligations | | | 51 | | 41 | | | Net losses on financial assets at fair value through profit and loss | | | (8) | | (32) | | | Other interest income | | | 20 | | 14 | | | | | 115 | | 37 | | | Finance costs | | | | | Interest expense on financial instruments2 | | | (903) | | (878) | | | Unwinding of discount on provisions | | | (50) | | (42) | | | Other interest | | | (8) | | 8 | | Net gains on derivative financial instruments3 | | | 34 | | 140 | | Less: interest capitalised4 | | | 127 | | 111 | | | | | (800) | | (661) | | | | | | | | Net finance costs | | | (685) | | (624) | |
1.Comparative amounts have been re-presented to reflect the classification of the FAA option as held for sale and within discontinued operations. 2.Finance costs include principal accretion on inflation-linked debt of £149 million (2022: £240 million) and income related to principal accretion on inflation-linked swaps of £18 million (2022: £5 million expense). 3.Includes a net foreign exchange gain on borrowing activities, offset by foreign exchange losses and gains on financing derivatives measured at fair value. 4.Interest on funding attributable to assets in the course of construction in the current period was capitalised at a rate of 4.7% (2022: 4.3%). In the UK, capitalised interest qualifies for a current year tax deduction with tax relief claimed of £21 million (2022: £13 million). In the US, capitalised interest is added to the cost of property, plant and equipment and qualifies for tax depreciation allowances
|
| X |
- References
+ Details
| Name: |
ifrs-full_AnalysisOfIncomeAndExpenseAbstract |
| Namespace Prefix: |
ifrs-full_ |
| Data Type: |
xbrli:stringItemType |
| Balance Type: |
na |
| Period Type: |
duration |
|
| X |
- DefinitionThe disclosure of finance income (cost). [Refer: Finance income (cost)] Reference 1: http://www.xbrl.org/2009/role/commonPracticeRef
-Name IAS
-Number 1
-IssueDate 2022-03-24
-Paragraph 10
-Subparagraph e
-URI https://taxonomy.ifrs.org/xifrs-link?type=IAS&num=1&code=ifrs-tx-2022-en-r&anchor=para_10_e&doctype=Standard
-URIDate 2022-03-24
| Name: |
ifrs-full_DisclosureOfFinanceIncomeExpenseExplanatory |
| Namespace Prefix: |
ifrs-full_ |
| Data Type: |
dtr-types:textBlockItemType |
| Balance Type: |
na |
| Period Type: |
duration |
|
v3.23.3
Assets held for sale and discontinued operations
|
6 Months Ended |
Sep. 30, 2023 |
|---|
| Non-current assets or disposal groups classified as held for sale or as held for distribution to owners [abstract] |
|
| Assets held for sale and discontinued operations |
6. Assets held for sale and discontinued operations
Assets and businesses are classified as held for sale when their carrying amounts are recovered through sale rather than through continuing use. They only meet the held for sale condition when the assets are ready for immediate sale in their present condition, management is committed to the sale and it is highly probable that the sale will complete within one year. Depreciation ceases on assets and businesses when they are classified as held for sale and the assets and businesses are impaired if their carrying value exceeds their fair value less expected costs to sell.
The results and cash flows of assets or businesses classified as held for sale or sold during the year, that meet the criteria of being a major separate line of business or geographical area of operation, are shown separately from our continuing operations, and presented within discontinued operations in the income statement and cash flow statement.
The following assets and liabilities were classified as held for sale:
| | | | | | | | | | | | | | | | | | | | | | | | | 30 September 2023 | | 31 March 2023 | | Total assets
held for sale
£m | Total liabilities held for sale
£m | Net assets held for sale
£m | | Total assets
held for sale
£m | Total liabilities held for sale
£m | Net assets held for sale
£m | Investment in GasT TopCo Limited | 1,441 | | — | | 1,441 | | | 1,443 | | — | | 1,443 | | | FAA option | — | | — | | — | | | — | | (109) | | (109) | | | FAA forward | — | | (7) | | (7) | | | — | | — | | — | | | RAA option | — | | (44) | | (44) | | | — | | — | | — | | | Net assets held for sale | 1,441 | | (51) | | 1,390 | | | 1,443 | | (109) | | 1,334 | |
On 31 January 2023, the Group disposed of 100% of the UK Gas Transmission business for cash consideration of £4.0 billion and a 40% interest in a newly incorporated UK limited company, GasT TopCo Limited. The other 60% was purchased by Macquarie Infrastructure and Real Assets (MIRA) and British Columbia Investment Management Corporation (BCI) (together, the ‘Consortium’). The Group also entered into a Further Acquisition Agreement (the FAA option) with the Consortium over its remaining 40% interest. The Group’s interest in GasT TopCo Limited was immediately classified as held for sale with effect from 31 January 2023 together with the FAA option, as detailed in note 10 of the Annual Report and Accounts for the year ended 31 March 2023. The Group has not applied equity accounting in relation to its investment in GasT TopCo Limited.
On 19 July 2023, following the partial exercise of the FAA option by the Consortium, the Group agreed to sell a further 20% out of the remaining 40% interests in GasT TopCo Limited (the FAA forward). Completion is expected in the second half of calendar year 2023, subject to regulatory approval. As part of the transaction, the Group entered into a new option agreement with the Consortium, the Remaining Acquisition Agreement (the RAA option), to replace the FAA option for the potential sale of all or part of the remaining 20% equity interest in GasT TopCo Limited. The RAA option is exercisable, at the Consortium’s option, between 1 May 2024 and 31 July 2024. If the RAA option is partially exercised by the Consortium, the Group will have the right to put the remainder of its interests in GasT TopCo Limited to the Consortium, which can be exercised by the Group between 1 December 2024 and 31 December 2024.
The FAA forward to complete the sale of 20% of GasT TopCo Limited is a Level 3 derivative and some of the assumptions which are used to determine the fair value are specific to the contract and not readily observable in active markets. The most significant unobservable input is the valuation of GasT TopCo Limited’s unlisted equity.
The RAA option is also a Level 3 derivative. Significant unobservable inputs include the valuation and volatility of GasT TopCo Limited’s unlisted equity. These inputs are used as part of a Black-Scholes option pricing model to provide the reported fair values.
The disposal of the Group’s interests in GasT TopCo Limited is considered to be the final stage of the plan to dispose of the UK Transmission business first announced in 2021. As a result, the results of the business prior to the recognition of the associate and any remeasurements pertaining to the financial derivatives noted above are shown separately from the continuing business for all periods presented on the face of the income statement as a discontinued operation. This is also reflected in the statement of comprehensive income, as well as earnings per share (EPS) being shown split between continuing and discontinued operations. 6. Assets held for sale and discontinued operations (continued)
The summary income statements for the periods ended 30 September 2023 and 2022 are as follows: | | | | | | | | | | | | | | | | | | | | | | | | | | | | | | 2023 | 2022¹ | | | | | | | | £m | £m | | Discontinued operations | | | | | | | | | | Revenue | | | | | | | — | | 805 | | | Other operating costs | | | | | | | — | | (459) | | | Operating profit | | | | | | | — | | 346 | | | Finance income | | | | | | | 9 | | 9 | | | Finance costs² | | | | | | | 61 | | (261) | | | Profit/(loss) before tax | | | | | | | 70 | | 94 | | | Tax | | | | | | | (5) | | (57) | | | Profit/(loss) after tax from discontinued operations | | | | | | | 65 | | 37 | |
1.Comparative amounts have been re-presented to reflect the classification of the FAA option as held for sale and within discontinued operations. 2.Finance costs include the remeasurement of the FAA option, the FAA forward and the RAA option.
The summary statements of comprehensive income are as follows: | | | | | | | | | | 2023 | 2022¹ | | £m | £m | | Profit after tax from discontinued operations | 65 | | 37 | | | Other comprehensive (loss)/income from discontinued operations | | | | Items from discontinued operations that will never be reclassified to profit or loss: | | | | Remeasurement losses on pension assets and post-retirement benefit obligations | — | | (126) | | | Tax on items that will never be reclassified to profit or loss | — | | 31 | | | Total losses from discontinued operations that will never be reclassified to profit or loss | — | | (95) | | | Items from discontinued operations that may be reclassified subsequently to profit or loss: | | | | Net gains in respect of cash flow hedges | — | | 8 | | | Net gains in respect of cost of hedging | — | | 4 | | Net losses on investments in debt instruments measured at fair value through other
comprehensive income | (12) | | — | | | Tax on items that may be reclassified subsequently to profit or loss | 3 | | (3) | | | Total (losses)/gains from discontinued operations that may be reclassified subsequently to profit or loss | (9) | | 9 | | | Other comprehensive loss for the period, net of tax, from discontinued operations | (9) | | (86) | | | Total comprehensive income/(loss) for the period from discontinued operations | 56 | | (49) | |
1.Comparative amounts have been re-presented to reflect the classification of the FAA option as held for sale and within discontinued operations.
|
| X |
- DefinitionThe entire disclosure for non-current assets held for sale and discontinued operations. Reference 1: http://www.xbrl.org/2003/role/disclosureRef
-Name IFRS
-Number 5
-IssueDate 2022-03-24
-Section Presentation and disclosure
-URI https://taxonomy.ifrs.org/xifrs-link?type=IFRS&num=5&code=ifrs-tx-2022-en-r&doctype=Standard&dita_xref=IFRS05_g30-42__IFRS05_g30-42_TI
-URIDate 2022-03-24
| Name: |
ifrs-full_DisclosureOfNoncurrentAssetsHeldForSaleAndDiscontinuedOperationsExplanatory |
| Namespace Prefix: |
ifrs-full_ |
| Data Type: |
dtr-types:textBlockItemType |
| Balance Type: |
na |
| Period Type: |
duration |
|
| X |
- References
+ Details
| Name: |
ifrs-full_NoncurrentAssetsOrDisposalGroupsClassifiedAsHeldForSaleOrAsHeldForDistributionToOwnersAbstract |
| Namespace Prefix: |
ifrs-full_ |
| Data Type: |
xbrli:stringItemType |
| Balance Type: |
na |
| Period Type: |
duration |
|
v3.23.3
Tax from continuing operations
|
6 Months Ended |
Sep. 30, 2023 |
|---|
| Income taxes paid (refund) [abstract] |
|
| Tax from continuing operations |
7. Tax from continuing operations
The tax charge from continuing operations for the six month period ended 30 September 2023 is £307 million (2022: £447 million). It is based on management’s estimate of the weighted average effective tax rate by jurisdiction expected for the full year. The effective tax rate is 22.4% (2022: 26.8%), which includes the impact of our share of post-tax results of joint ventures and associates.
The effective tax rate for the year ended 31 March 2023 was 24.4% including the impact of our share of post-tax results of joint ventures and associates.
The legislation implementing the Organisation for Economic Co-operation and Development’s (OECD) proposals for a global minimum corporation tax rate (‘Pillar 2’) was enacted into UK law on 11 July 2023. The legislation includes an income inclusion rule and a domestic minimum tax, which together are designed to ensure a minimum effective tax rate of 15% in each country in which the Group operates. Similar legislation is being enacted by other governments around the world. The legislation is effective for National Grid from 1 April 2024 and therefore the rules do not impact the Group’s consolidated financial statements for year ended 31 March 2024. We have applied the mandatory exception in the UK to recognising and disclosing information about the deferred tax assets and liabilities related to Pillar 2 income taxes in accordance with the amendments to IAS 12 published by the IASB on 23 May 2023. The Group’s work is ongoing to assess the potential impact in the financial statements for year ended 31 March 2025.
|
v3.23.3
Earnings per share
|
6 Months Ended |
Sep. 30, 2023 |
|---|
| Earnings per share [abstract] |
|
| Earnings per share |
8. Earnings per share
The earnings per share (EPS) calculations are based on profit after tax attributable to equity shareholders of the parent company which excludes non-controlling interests. (a)Basic earnings per share | | | | | | | | | | | | | | | | Earnings | EPS | Earnings | EPS | | Six months ended 30 September | 2023 | 2023 | 2022¹ | 2022¹ | | £m | pence | £m | pence | | | | | | | | | | | | Profit after tax from continuing operations attributable to the parent | 1,063 | | 28.8 | | 1,219 | | 33.4 | | | | | | | | | | | | | Profit after tax from discontinued operations attributable to the parent | 65 | | 1.8 | | 37 | | 1 | | | | | | | | | | | | | Total profit after tax attributable to the parent | 1,128 | | 30.6 | | 1,256 | | 34.4 | | | | | | | | | 2023 | | 2022 | | | millions | | millions | | Weighted average number of shares – basic | | 3,682 | | | 3,651 | |
1.Comparative amounts have been re-presented to reflect the classification of the FAA option as held for sale and within discontinued operations.
(b)Diluted earnings per share | | | | | | | | | | | | | | | | Earnings | EPS | Earnings | EPS | | Six months ended 30 September | 2023 | 2023 | 2022¹ | 2022¹ | | £m | pence | £m | pence | | | | | | | | | | | | Profit after tax from continuing operations attributable to the parent | 1,063 | | 28.7 | | 1,219 | | 33.2 | | | | | | | | | | | | | Profit after tax from discontinued operations attributable to the parent | 65 | | 1.8 | | 37 | | 1 | | | | | | | | | | | | | Total profit after tax attributable to the parent | 1,128 | | 30.5 | | 1,256 | | 34.2 | | | | | | | | | 2023 | | 2022 | | | millions | | millions | | Weighted average number of shares – diluted | | 3,700 | | | 3,668 | |
1.Comparative amounts have been re-presented to reflect the classification of the FAA option as held for sale and within discontinued operations.
|
| X |
- DefinitionThe entire disclosure for earnings per share. Reference 1: http://www.xbrl.org/2003/role/disclosureRef
-Name IAS
-Number 33
-IssueDate 2022-03-24
-Section Disclosure
-URI https://taxonomy.ifrs.org/xifrs-link?type=IAS&num=33&code=ifrs-tx-2022-en-r&doctype=Standard&dita_xref=IAS33_g70-73A__IAS33_g70-73A_TI
-URIDate 2022-03-24
| Name: |
ifrs-full_DisclosureOfEarningsPerShareExplanatory |
| Namespace Prefix: |
ifrs-full_ |
| Data Type: |
dtr-types:textBlockItemType |
| Balance Type: |
na |
| Period Type: |
duration |
|
| X |
- References
+ Details
| Name: |
ifrs-full_EarningsPerShareAbstract |
| Namespace Prefix: |
ifrs-full_ |
| Data Type: |
xbrli:stringItemType |
| Balance Type: |
na |
| Period Type: |
duration |
|
v3.23.3
Dividends
|
6 Months Ended |
Sep. 30, 2023 |
|---|
| Subclassifications of assets, liabilities and equities [abstract] |
|
| Dividends |
9. Dividends | | | | | | | | | | | | | Pence
per share | Cash
dividend
paid
£m | Scrip
dividend
£m | | Ordinary dividends | | | | Final dividend in respect of the year ended 31 March 2023 | 37.60 | | 1,325 | | 56 | | Interim dividend in respect of the year ended 31 March 2023 | 17.84 | | 488 | | 163 | | Final dividend in respect of the year ended 31 March 2022 | 33.76 | | 1,119 | | 114 | |
The Directors are proposing an interim dividend of 19.40 pence per share to be paid in respect of the year ending 31 March 2024. This would absorb £716 million of shareholders’ equity. A final dividend for the year ended 31 March 2023 of 37.60 pence per share was paid in August 2023. The cash dividend paid was £1,325 million with an additional £56 million settled via a scrip issue.
|
| X |
- DefinitionThe disclosure of dividends. Dividends are distributions of profits to holders of equity investments in proportion to their holdings of a particular class of capital. Reference 1: http://www.xbrl.org/2009/role/commonPracticeRef
-Name IAS
-Number 1
-IssueDate 2022-03-24
-Paragraph 10
-Subparagraph e
-URI https://taxonomy.ifrs.org/xifrs-link?type=IAS&num=1&code=ifrs-tx-2022-en-r&anchor=para_10_e&doctype=Standard
-URIDate 2022-03-24
| Name: |
ifrs-full_DisclosureOfDividendsExplanatory |
| Namespace Prefix: |
ifrs-full_ |
| Data Type: |
dtr-types:textBlockItemType |
| Balance Type: |
na |
| Period Type: |
duration |
|
| X |
- References
+ Details
| Name: |
ifrs-full_SubclassificationsOfAssetsLiabilitiesAndEquitiesAbstract |
| Namespace Prefix: |
ifrs-full_ |
| Data Type: |
xbrli:stringItemType |
| Balance Type: |
na |
| Period Type: |
duration |
|
v3.23.3
Fair value measurement
|
6 Months Ended |
Sep. 30, 2023 |
|---|
| Fair Value Measurement [Abstract] |
|
| Fair value measurement |
10. Fair value measurement
Assets and liabilities measured at fair value Included in the statement of financial position are certain financial assets and liabilities which are measured at fair value. The following table categorises these assets and liabilities by the valuation methodology applied in determining their fair value using the fair value hierarchy described on page 197 of the Annual Report and Accounts for the year ended 31 March 2023. | | | | | | | | | | | | | | | | | | | | | | | | | | | | | | | 30 September 2023 | | 31 March 2023 | | Level 1
£m | Level 2
£m | Level 3
£m | Total
£m | | Level 1
£m | Level 2
£m | Level 3
£m | Total
£m | | Assets | | | | | | | | | | | Investments held at fair value through profit and loss | 1,007 | | — | | 483 | | 1,490 | | | 1,764 | | — | | 452 | | 2,216 | | Investments held at fair value through other comprehensive income1 | — | | 388 | | — | | 388 | | | — | | 407 | | — | | 407 | | | Financing derivatives | — | | 309 | | 20 | | 329 | | | — | | 341 | | 22 | | 363 | | | Commodity contract derivatives | — | | 54 | | 2 | | 56 | | | — | | 62 | | 4 | | 66 | | | 1,007 | | 751 | | 505 | | 2,263 | | | 1,764 | | 810 | | 478 | | 3,052 | | | Liabilities | | | | | | | | | | | Financing derivatives | — | | (1,219) | | (95) | | (1,314) | | | — | | (997) | | (122) | | (1,119) | | | Commodity contract derivatives | — | | (78) | | (45) | | (123) | | | — | | (134) | | (40) | | (174) | | | | | | | | | | | | Contingent consideration2 | — | | — | | (10) | | (10) | | | — | | — | | (19) | | (19) | | | — | | (1,297) | | (150) | | (1,447) | | | — | | (1,131) | | (181) | | (1,312) | | | Total | 1,007 | | (546) | | 355 | | 816 | | | 1,764 | | (321) | | 297 | | 1,740 | |
1.Investments held include instruments which meet the criteria of IFRS 9 or IAS 19. 2.Contingent consideration relates to the acquisition of National Grid Renewables Development LLC.
The estimated fair value of total borrowings, excluding lease liabilities, using market values at 30 September 2023 is £38,354 million (31 March 2023: £38,219 million).
Our level 1 financial investments and liabilities held at fair value are valued using quoted prices from liquid markets and primarily comprise investments in short-term money market funds.
Our level 2 financial investments held at fair value primarily include bonds with a tenor greater than one year and are valued using quoted prices for similar instruments in active markets, or quoted prices for identical or similar instruments in inactive markets. Alternatively, they are valued using models where all significant inputs are based directly or indirectly on observable market data. 10. Fair value measurement (continued)
Our level 2 financing derivatives include cross-currency, interest rate and foreign exchange derivatives. We value these derivatives by discounting all future cash flows by externally sourced market yield curves at the reporting date, taking into account the credit quality of both parties. These derivatives can be priced using liquidly traded interest rate curves and foreign exchange rates, and therefore we classify our vanilla trades as level 2 under the IFRS 13 framework.
Our level 2 commodity derivatives include over-the-counter gas swaps and power swaps as well as forward physical gas deals. We value our contracts based on market data obtained from the New York Mercantile Exchange (NYMEX) and the Intercontinental Exchange (ICE) where forward monthly prices are available. We discount based on externally sourced market yield curves at the reporting date, taking into account the credit quality of both parties and liquidity in the market. Our commodity contracts can be priced using liquidly traded swaps. Therefore we classify our vanilla trades as level 2 under the IFRS 13 framework.
Our level 3 financing derivatives include inflation-linked swaps, where the market is illiquid. In valuing these instruments we use in-house valuation models and obtain external valuations to support each reported fair value.
Our level 3 commodity contract derivatives primarily consist of our forward purchases of electricity and gas that we value using proprietary models. Derivatives are classified as Level 3 where significant inputs into the valuation technique are neither directly nor indirectly observable (including our own data, which are adjusted, if necessary, to reflect the assumptions market participants would use in the circumstances).
Our level 3 investments include equity instruments accounted for at fair value through profit and loss. These equity holdings are part of our corporate venture capital portfolio held by National Grid Partners and comprise a series of relatively small, early-stage non-controlling minority interest unquoted investments where prices or valuation inputs are unobservable. Fifteen equity investments (out of thirty-three) are fair valued based on the latest transaction price (a price within the last 12 months), either being the price we paid for the investments, marked to a latest round of funding and adjusted for our preferential rights or based on an internal model. In addition, we have eighteen investments without a transaction in the last 12 months that underwent an internal valuation process using the Black-Scholes Murton Option Pricing Model (OPM Backsolve). Between 12 and 18 months a blend between OPM Backsolve and other techniques are utilised such as proxy group revenue multiples, discounted cash flow, comparable company analysis and probability weighted expected return approach in order to triangulate a valuation. After 18 months the valuation is based on these alternative methods as the last fundraising price is no longer a reliable basis for valuation.
Our level 3 investments also include our investment in Sunrun Neptune 2016 LLC, which is accounted for at fair value through profit and loss. The investment is fair valued by discounting expected cash flows using a weighted average cost of capital specific to Sunrun Neptune 2016 LLC. 10. Fair value measurement (continued) The impacts on a post-tax basis of reasonably possible changes in significant assumptions used in valuing assets and liabilities classified within level 3 of the fair value hierarchy are as follows: | | | | | | | | | | | | | | | | | | | | | | | | | | | | Financing derivatives | | Commodity contract derivatives | | Other | | Six months ended 30 September | 2023 | 2022 | | 2023 | 2022 | | 2023 | 2022 | | £m | £m | | £m | £m | | £m | £m | | 10% increase in commodity prices | — | | — | | | 15 | | 35 | | | — | | — | | | 10% decrease in commodity prices | — | | — | | | (15) | | (36) | | | — | | — | | | +10% market area price change | — | | — | | | 12 | | 7 | | | — | | — | | | -10% market area price change | — | | — | | | (11) | | (7) | | | — | | — | | +20 basis point increase in Limited Price Index
(LPI) market curve | (38) | | (51) | | | — | | — | | | — | | — | | | -20 basis point decrease in LPI market curve | 38 | | 51 | | | — | | — | | | — | | — | | | +20 basis point increase between Retail Price Index (RPI) and Consumer Price Index (CPI) | 36 | | 17 | | | — | | — | | | — | | — | | | -20 basis point decrease between RPI and CPI market curves | (33) | | (16) | | | — | | — | | | — | | — | | | +50 basis points change in discount rate | — | | — | | | — | | — | | | (8) | | (9) | | | -50 basis points change in discount rate | — | | — | | | — | | — | | | 9 | | 10 | | | +10% change in venture capital price | — | | — | | | — | | — | | | 30 | | — | | | -10% change in venture capital price | — | | — | | | — | | — | | | (30) | | — | |
The impacts disclosed above were considered on a contract by contract basis with the most significant unobservable inputs identified. A reasonably possible change in assumptions for other level 3 assets and liabilities would not result in a material change in fair values. The changes in fair value of our level 3 financial assets and liabilities in the six months to 30 September are presented below: | | | | | | | | | | | | | | | | | | | | | | | | | | | | | | | | | | | | | Financing derivatives | | Commodity contract derivatives | | Other1 | | Total | | 2023 | 2022 | | 2023 | 2022 | | 2023 | 2022 | | 2023 | 2022 | | £m | £m | | £m | £m | | £m | £m | | £m | £m | | At 1 April | (100) | | (187) | | | (36) | | 44 | | | 433 | | 376 | | | 297 | | 233 | | Net gains/(losses) through the consolidated income statement for the period2,3 | 25 | | 76 | | | (4) | | 44 | | | 26 | | 30 | | | 47 | | 150 | | | Purchases | — | | (133) | | | (10) | | (56) | | | 11 | | 37 | | | 1 | | (152) | | | Settlements | — | | — | | | 7 | | (4) | | | 3 | | (4) | | | 10 | | (8) | | At 30 September4 | (75) | | (244) | | | (43) | | 28 | | | 473 | | 439 | | | 355 | | 223 | |
1.Other comprises our investments in Sunrun Neptune 2016 LLC and the investments made by National Grid Partners, which are accounted for at fair value through profit and loss and the contingent consideration arising from the acquisition of National Grid Renewables Development LLC. Net gains and loss are recognised within finance income and costs in the income statement. 2.Gains of £25 million (2022: gains of £93 million) are attributable to derivative financial instruments held at the end of the reporting period and have been recognised in finance costs in the income statement. 3.Losses of £15 million (2022: losses of £23 million) are attributable to the commodity contract derivative financial instruments held at the end of the reporting period and have been recognised in other operating costs in the consolidated income statement. 4.There were no reclassifications in or out of level 3 (2022: none).
The Group also has a number of financial instruments which are not measured at fair value in the balance sheet. The carrying value of current financial assets at amortised cost approximates their fair values, primarily due to short-dated maturities.
|
| X |
- DefinitionThe entire disclosure for fair value measurement. Reference 1: http://www.xbrl.org/2003/role/disclosureRef
-Name IFRS
-Number 13
-IssueDate 2022-03-24
-Section Disclosure
-URI https://taxonomy.ifrs.org/xifrs-link?type=IFRS&num=13&code=ifrs-tx-2022-en-r&doctype=Standard&dita_xref=IFRS13_g91-99__IFRS13_g91-99_TI
-URIDate 2022-03-24
| Name: |
ifrs-full_DisclosureOfFairValueMeasurementExplanatory |
| Namespace Prefix: |
ifrs-full_ |
| Data Type: |
dtr-types:textBlockItemType |
| Balance Type: |
na |
| Period Type: |
duration |
|
| X |
- DefinitionFair Value Measurement [Abstract]
| Name: |
nggtf_FairValueMeasurementAbstract |
| Namespace Prefix: |
nggtf_ |
| Data Type: |
xbrli:stringItemType |
| Balance Type: |
na |
| Period Type: |
duration |
|
v3.23.3
Net debt
|
6 Months Ended |
Sep. 30, 2023 |
|---|
| Subclassifications of assets, liabilities and equities [abstract] |
|
| Net debt |
11. Net debt
Net debt is comprised as follows: | | | | | | | | | | 30 September 2023 | 31 March 2023 | | £m | £m | | Cash and cash equivalents | 227 | | 163 | | | Current financial investments | 1,680 | | 2,605 | | | Borrowings and bank overdrafts | (44,797) | | (42,985) | | Financing derivatives1 | (985) | | (756) | | | Net debt (net of related derivative financial instruments) | (43,875) | | (40,973) | |
1.Includes £4 million liability (31 March 2023: £4 million liability) in relation to the hedging of capital expenditure. The cash flows related to these derivatives are included within investing activities in the consolidated cash flow statement which is in the same manner as the transactions which are the subject of the hedges. The financing derivatives balance included in net debt exclude the commodity derivatives.
The following table splits out the total derivative balances on the face of the consolidated statement of financial position by category: | | | | | | | | | | | | | | | | | | | | | | | | | 30 September 2023 | | 31 March 2023 | | Assets
£m | Liabilities
£m | Total
£m | | Assets
£m | Liabilities
£m | Total
£m | | Financing derivatives | 329 | | (1,314) | | (985) | | | 363 | | (1,119) | | (756) | | | Commodity contract derivatives | 56 | | (123) | | (67) | | | 66 | | (174) | | (108) | | | Total derivative financial instruments | 385 | | (1,437) | | (1,052) | | | 429 | | (1,293) | | (864) | |
|
| X |
- References
+ Details
| Name: |
ifrs-full_SubclassificationsOfAssetsLiabilitiesAndEquitiesAbstract |
| Namespace Prefix: |
ifrs-full_ |
| Data Type: |
xbrli:stringItemType |
| Balance Type: |
na |
| Period Type: |
duration |
|
| X |
- DefinitionDisclosure Of Net Debt [Text Block]
| Name: |
nggtf_DisclosureOfNetDebtTextBlock |
| Namespace Prefix: |
nggtf_ |
| Data Type: |
dtr-types:textBlockItemType |
| Balance Type: |
na |
| Period Type: |
duration |
|
v3.23.3
Pensions and other post-retirement benefit obligations
|
6 Months Ended |
Sep. 30, 2023 |
|---|
| Employee Benefits [Abstract] |
|
| Pensions and other post-retirement benefit obligations |
12. Pensions and other post-retirement benefit obligations
| | | | | | | | | | 30 September 2023 | 31 March 2023 | | £m | £m | | Present value of funded obligations | (17,502) | | (18,934) | | | Fair value of plan assets | 19,570 | | 21,246 | | | 2,068 | | 2,312 | | | Present value of unfunded obligations | (264) | | (292) | | | Other post-employment liabilities | (67) | | (69) | | | Net defined benefit asset | 1,737 | | 1,951 | | | Presented in consolidated statement of financial position: | | | | Assets | 2,352 | | 2,645 | | | Liabilities | (615) | | (694) | | | 1,737 | | 1,951 | |
| | | | | | | | | | Key actuarial assumptions | 30 September 2023 | 31 March 2023 | | Discount rate – UK past service | 5.55 | % | 4.80 | % | | Discount rate – US | 5.70 | % | 4.85 | % | | Rate of increase in RPI – UK past service | 3.19 | % | 3.17 | % |
The net pensions and other post-retirement benefit (OPEB) obligations position, as recorded under IAS 19, at 30 September 2023 was an asset of £1,737 million (31 March 2023: £1,951 million asset). The movement of £214 million primarily reflects asset performance being less than the discount rate at the start of the period, partially offset by increases in discount rates resulting in a decrease in liabilities.
Net actuarial losses of £263 million have been reflected within the consolidated statement of comprehensive income. There was a loss of £1,754 million (UK £1,155 million; US £599 million) relating to asset performance which reflects returns on assets, both in the UK and US, being less than the discount rate at the beginning of the year. Changes in actuarial assumptions led to a gain on liabilities of £1,491 million (UK £793 million; US £698 million). This primarily reflected movements in discount rates which resulted from large increases in corporate bond yields.
The pension and OPEB surpluses in both the UK and the US of £1,377 million and £975 million respectively (31 March 2023: £1,672 million and £973 million) continue to be recognised as assets under IFRIC 14 as explained on page 175 of the Annual Report and Accounts for the year ended 31 March 2023.
|
| X |
- DefinitionThe entire disclosure for employee benefits. Reference 1: http://www.xbrl.org/2003/role/disclosureRef
-Name IAS
-Number 19
-IssueDate 2022-03-24
-Section Scope
-URI https://taxonomy.ifrs.org/xifrs-link?type=IAS&num=19&code=ifrs-tx-2022-en-r&doctype=Standard&dita_xref=IAS19_g2-7__IAS19_g2-7_TI
-URIDate 2022-03-24
| Name: |
ifrs-full_DisclosureOfEmployeeBenefitsExplanatory |
| Namespace Prefix: |
ifrs-full_ |
| Data Type: |
dtr-types:textBlockItemType |
| Balance Type: |
na |
| Period Type: |
duration |
|
| X |
- DefinitionEmployee Benefits [Abstract]
| Name: |
nggtf_EmployeeBenefitsAbstract |
| Namespace Prefix: |
nggtf_ |
| Data Type: |
xbrli:stringItemType |
| Balance Type: |
na |
| Period Type: |
duration |
|
v3.23.3
Commitments and contingencies
|
6 Months Ended |
Sep. 30, 2023 |
|---|
| Subclassifications of assets, liabilities and equities [abstract] |
|
| Commitments and contingencies |
13. Commitments and contingencies
At 30 September 2023, there were commitments for future energy purchase agreements of £13,824 million (31 March 2023: £19,194 million) and future capital expenditure contracted but not provided for in relation to the acquisition of property, plant and equipment of £3,218 million (31 March 2023: £2,936 million).
We also have contingencies in the form of certain guarantees and letters of credit. These are described in further detail in note 30 to the Annual Report and Accounts for the year ended 31 March 2023.
Litigation and claims Through the ordinary course of our operations, we are party to various litigation, claims and investigations. We do not expect the ultimate resolution of any proceedings to have a material adverse effect on our results of operations, cash flows or financial position.
|
| X |
- DefinitionThe disclosure of commitments and contingent liabilities. [Refer: Contingent liabilities [member]] Reference 1: http://www.xbrl.org/2009/role/commonPracticeRef
-Name IAS
-Number 1
-IssueDate 2022-03-24
-Paragraph 10
-Subparagraph e
-URI https://taxonomy.ifrs.org/xifrs-link?type=IAS&num=1&code=ifrs-tx-2022-en-r&anchor=para_10_e&doctype=Standard
-URIDate 2022-03-24
| Name: |
ifrs-full_DisclosureOfCommitmentsAndContingentLiabilitiesExplanatory |
| Namespace Prefix: |
ifrs-full_ |
| Data Type: |
dtr-types:textBlockItemType |
| Balance Type: |
na |
| Period Type: |
duration |
|
| X |
- References
+ Details
| Name: |
ifrs-full_SubclassificationsOfAssetsLiabilitiesAndEquitiesAbstract |
| Namespace Prefix: |
ifrs-full_ |
| Data Type: |
xbrli:stringItemType |
| Balance Type: |
na |
| Period Type: |
duration |
|
v3.23.3
Exchange rates
|
6 Months Ended |
Sep. 30, 2023 |
|---|
| Foreign exchange rates [abstract] |
|
| Exchange rates |
14. Exchange rates
The consolidated results are affected by the exchange rates used to translate the results of our US operations and US dollar transactions. The US dollar to pound sterling exchange rates used were:
| | | | | | | | | | | | | 30 September | 2023 | 2022 | Year ended 31 March 2023 | | Closing rate applied at period end | 1.22 | 1.12 | 1.23 | | Average rate applied for the period | 1.25 | 1.21 | 1.22 |
|
| X |
- DefinitionThe entire disclosure for the effect of changes in foreign exchange rates. Reference 1: http://www.xbrl.org/2003/role/disclosureRef
-Name IAS
-Number 21
-IssueDate 2022-03-24
-Section Disclosure
-URI https://taxonomy.ifrs.org/xifrs-link?type=IAS&num=21&code=ifrs-tx-2022-en-r&doctype=Standard&dita_xref=IAS21_g51-57__IAS21_g51-57_TI
-URIDate 2022-03-24
| Name: |
ifrs-full_DisclosureOfEffectOfChangesInForeignExchangeRatesExplanatory |
| Namespace Prefix: |
ifrs-full_ |
| Data Type: |
dtr-types:textBlockItemType |
| Balance Type: |
na |
| Period Type: |
duration |
|
| X |
- References
+ Details
| Name: |
ifrs-full_ForeignExchangeRatesAbstract |
| Namespace Prefix: |
ifrs-full_ |
| Data Type: |
xbrli:stringItemType |
| Balance Type: |
na |
| Period Type: |
duration |
|
v3.23.3
Related party transactions
|
6 Months Ended |
Sep. 30, 2023 |
|---|
| Related party transactions [abstract] |
|
| Related party transactions |
15. Related party transactionsRelated party transactions in the six months ended 30 September 2023 were substantially the same in nature to those disclosed in note 31 of the Annual Report and Accounts for the year ended 31 March 2023. There were no other related party transactions in the period that have materially affected the financial position or performance of the Group.
|
v3.23.3
Additional disclosures in respect of guaranteed securities
|
6 Months Ended |
Sep. 30, 2023 |
|---|
| Separate Financial Statements [Abstract] |
|
| Additional disclosures in respect of guaranteed securities |
16. Additional disclosures in respect of guaranteed securities
Niagara Mohawk Power Corporation, a wholly owned subsidiary of the Group, has issued preferred shares that are listed on a US national securities exchange and are guaranteed by National Grid plc. This guarantor commits to honour any liabilities should the company issuing the debt have any financial difficulties. In order to provide debt holders with information on the financial stability of the company providing the guarantee, we are required to disclose individual financial information for this company. We have chosen to include this information in the half year financial information.
The following summarised financial information is given in respect of Niagara Mohawk Power Corporation as a result of National Grid plc’s guarantee, dated 29 October 2007, of Niagara Mohawk Power Corporation’s 3.6% and 3.9% issued preferred shares, which amount to $23 million. National Grid plc’s guarantee of Niagara Mohawk Power Corporation’s preferred shares is full and unconditional. There are no restrictions on the payment of dividends by Niagara Mohawk Power Corporation or limitations on National Grid plc’s guarantee of the preferred shares, and there are no factors that may affect payments to holders of the guaranteed securities.
The following summarised financial information for National Grid plc and Niagara Mohawk Power Corporation is presented on a combined basis and is intended to provide investors with meaningful and comparable financial information, and is provided pursuant to the early adoption of Rule 13-01 of Regulation S-X in lieu of the separate financial statements of Niagara Mohawk Power Corporation.
Summarised financial information is presented, on a combined basis, as at 30 September 2023. The combined amounts are presented under IFRS measurement principles. Intercompany transactions between National Grid plc and Niagara Mohawk Power Corporation have been eliminated. Investments in other non-issuer and non-guarantor subsidiaries are included at cost, subject to impairment.
| | | | | | | National Grid plc and Niagara Mohawk Power Corporation combined
£m | | Combined statement of financial position | | | Non-current loans to other subsidiaries | 126 | | | Non-current assets | 12,033 | | | Current loans to other subsidiaries | 15,557 | | | Current assets | 1,526 | | | Current loans from other subsidiaries | (6,893) | | | Current liabilities | (1,263) | | | Non-current loans from other subsidiaries | (2,080) | | | Non-current liabilities | (13,703) | | | Net assets¹ | 5,303 | | | Equity | 5,303 | | | | | Combined income statement – continuing operations | | | Revenue | 1,594 | | | Operating costs | (1,330) | | | Operating profit | 264 | | | Other income from other subsidiaries | — | | | Other income and costs, including taxation | (51) | | | Profit after tax | 213 | |
1.Excluded from net assets above are investments in other consolidated subsidiaries with a carrying value of £14,480 million.
|
| X |
- DefinitionThe entire disclosure for separate financial statements. Reference 1: http://www.xbrl.org/2003/role/disclosureRef
-Name IAS
-Number 27
-IssueDate 2022-03-24
-Section Disclosure
-URI https://taxonomy.ifrs.org/xifrs-link?type=IAS&num=27&code=ifrs-tx-2022-en-r&doctype=Standard&dita_xref=IAS27_g15-17__IAS27_g15-17_TI
-URIDate 2022-03-24
Reference 2: http://www.xbrl.org/2003/role/disclosureRef
-Name IFRS
-Number 12
-IssueDate 2022-03-24
-Section Objective
-URI https://taxonomy.ifrs.org/xifrs-link?type=IFRS&num=12&code=ifrs-tx-2022-en-r&doctype=Standard&dita_xref=IFRS12_g1-4__IFRS12_g1-4_TI
-URIDate 2022-03-24
| Name: |
ifrs-full_DisclosureOfConsolidatedAndSeparateFinancialStatementsExplanatory |
| Namespace Prefix: |
ifrs-full_ |
| Data Type: |
dtr-types:textBlockItemType |
| Balance Type: |
na |
| Period Type: |
duration |
|
| X |
- DefinitionSeparate Financial Statements [Abstract]
| Name: |
nggtf_SeparateFinancialStatementsAbstract |
| Namespace Prefix: |
nggtf_ |
| Data Type: |
xbrli:stringItemType |
| Balance Type: |
na |
| Period Type: |
duration |
|
v3.23.3
Post balance sheet events
|
6 Months Ended |
Sep. 30, 2023 |
|---|
| Disclosure of non-adjusting events after reporting period [abstract] |
|
| Post balance sheet events |
17. Post balance sheet events
At the end of October 2023, legislation required to enable the separation of the ESO and formation of the ISOP was passed through Parliament. The ISOP is expected to be established as a Public Corporation in 2024, with responsibilities across both the electricity and gas systems. As a result, the Group took the judgement to classify the associated assets and liabilities of the ESO as held for sale in the consolidated statement of financial position at the end of October 2023 and the ESO will be measured at the lower of its carrying amount or fair value less costs to sell, which will take into consideration the current over-collection of allowed revenues.
|
| X |
- DefinitionThe entire disclosure for events after the reporting period. Reference 1: http://www.xbrl.org/2003/role/disclosureRef
-Name IAS
-Number 10
-IssueDate 2022-03-24
-Section Disclosure
-URI https://taxonomy.ifrs.org/xifrs-link?type=IAS&num=10&code=ifrs-tx-2022-en-r&doctype=Standard&dita_xref=IAS10_g17-22_IAS10_g17-22_TI
-URIDate 2022-03-24
| Name: |
ifrs-full_DisclosureOfEventsAfterReportingPeriodExplanatory |
| Namespace Prefix: |
ifrs-full_ |
| Data Type: |
dtr-types:textBlockItemType |
| Balance Type: |
na |
| Period Type: |
duration |
|
| X |
- References
+ Details
| Name: |
ifrs-full_DisclosureOfNonadjustingEventsAfterReportingPeriodAbstract |
| Namespace Prefix: |
ifrs-full_ |
| Data Type: |
xbrli:stringItemType |
| Balance Type: |
na |
| Period Type: |
duration |
|
v3.23.3
Basis of preparation and new accounting standards, interpretations and amendments (Policies)
|
6 Months Ended |
Sep. 30, 2023 |
|---|
| Accounting Policies, Changes In Accounting Estimates And Errors [Abstract] |
|
| Going concern |
Going concern As part of the Directors’ consideration of the appropriateness of adopting the going concern basis of accounting in preparing the half year financial information, the Directors have considered the Group’s principal risks (discussed on page 60) alongside potential downside business cash flow scenarios impacting the Group’s operations. The Directors specifically considered both a base case and a reasonable worst-case scenario for business cash flows. The assessment is prepared on the conservative assumption that the Group has no access to the debt capital markets.
The main additional cash flow impacts identified in the reasonable worst-case scenario are: •the timing of the sale of assets classified as held for sale; •adverse impacts of inflation and incremental spend on our capital expenditure programme; •adverse impact from timing across the Group (i.e. a net under-recovery of allowed revenues or reductions in over-collections) and slower collections of outstanding receivables; •higher operating and financing costs than expected; including non-delivery of planned efficiencies across the Group; and •the potential impact of further significant storm costs in the US.
As part of their analysis, the Board also considered the following potential levers at their discretion to improve the position identified by the analysis if the debt capital markets are not accessible: •the payment of dividends to shareholders; •significant changes in the phasing of the Group’s capital expenditure programme, with elements of non-essential works and programmes delayed; and •a number of further reductions in operating expenditure across the Group.
As at 30 September 2023, the Group had undrawn committed facilities available for general corporate purposes amounting to £8.0 billion. Based on these available liquidity resources and having considered the reasonable worst-case scenario, and the further levers at the Board’s discretion, the Group has not identified any material uncertainties relating to events or conditions that, individually or collectively, may cast significant doubt on its ability to continue as a going concern for the foreseeable future, a period not less than 12 months from the date of this report.
In addition to the above, the ability to raise new and extend existing financing was separately included in the analysis, and the Directors noted the c.£3.0 billion of new long-term senior debt issued in the period from 1 April to 30 September 2023 as evidence of the Group’s ability to continue to have access to the debt capital markets if needed.
Based on the above, the Directors have concluded the Group is well placed to manage its financing and other business risks satisfactorily, and have a reasonable expectation that the Group will have adequate resources to continue in operation for at least 12 months from the signing date of these consolidated interim financial statements. They therefore consider it appropriate to adopt the going concern basis of accounting in preparing the half year financial information.
|
| New IFRS accounting standards, interpretations and amendments adopted in the period |
New IFRS accounting standards, interpretations and amendments adopted in the periodThere are no new standards, interpretations or amendments, issued by the IASB or by the IFRS Interpretations Committee (IFRIC), that are applicable for the period commencing on 1 April 2023 and have had a material impact on the Group’s results.
|
| New IFRS accounting standards, interpretations and amendments not yet adopted |
New IFRS accounting standards, interpretations and amendments not yet adopted There are no new accounting standards and amendments to existing standards that have been issued, but are not yet effective that were not disclosed in our Annual Report and Accounts. The Group has not early adopted any standard, amendment or interpretation that has been issued but is not yet effective.
|
| Segment analysis |
Revenue and the results of the business are analysed by operating segment, based on the information the Board use internally for the purposes of evaluating the performance of each operating segment and determining resource allocation between them. The Board is National Grid’s chief operating decision maker (as defined by IFRS 8 ‘Operating Segments’) and assesses the profitability of a profit measure that excludes certain income and expenses. We call that measure ‘adjusted profit’. Adjusted profit excludes exceptional items and remeasurements (as defined in note 4) and is used by management to monitor financial performance as it is considered that it aids the comparability of our reported financial performance from year to year. As a matter of course, the Board also considers profitability by segment, excluding the effect of major storms and timing adjustments relating to revenue and certain pass-through costs. However, the measure of profit disclosed in this note is operating profit before exceptional items and remeasurements, as this is the measure that is most consistent with the IFRS results reported within these financial statements.
|
| Revenue |
Under IFRS 15 ‘Revenue from Contracts with Customers’, revenue is recorded as or when the Group satisfies a performance obligation by transferring a promised good or service to a customer. A good or service is transferred when the customer obtains control of that good or service. The transfer of control of our distribution or transmission services coincides with the use of our network, as electricity and gas pass through our network and reach our customers. The Group principally satisfies its performance obligations over time and the amount of revenue recorded corresponds to the amounts billed and accrued for volumes of gas and electricity delivered/transferred to/from our customers.
|
| Exceptional items and remeasurements |
To monitor our segmental financial performance, we use an adjusted consolidated profit measure that excludes certain income and expenses. We exclude items from adjusted profit because, if included, these items could distort understanding of our performance in the period and the comparability between periods. With respect to restructuring costs, these represent additional expenses incurred that are not related to normal business and day‑to-day activities. These can take place over multiple reporting periods given the scale of the Group, the nature and complexity of the transformation initiatives and due to the impact of strategic transactions.
Remeasurements comprise unrealised gains or losses recorded in the consolidated income statement arising from changes in the fair value of certain financial assets and liabilities categorised as held at fair value through profit and loss (FVTPL). Once the fair value movements are realised (for example, when the derivative matures), the previously recognised fair value movements are then reversed through remeasurements and recognised within earnings before exceptional items and remeasurements. These assets and liabilities include commodity contracts and derivative financial instruments to the extent that hedge accounting is either not achieved or is not effective. We have also classified the unrealised gains or losses reported in profit and loss on certain additional assets treated as FVTPL within remeasurements. These relate to financial assets (which fail the ‘solely payments of principal and interest test’ under IFRS 9), the money market fund investments used by Group Treasury for cash management purposes and the net foreign exchange gains and losses on borrowing activities. These are offset by foreign exchange losses and gains on financing derivatives measured at fair value. In all cases, these fair values increase or decrease because of changes in foreign exchange, commodity or other financial indices over which we have no control.
|
| Assets held for sale and discontinued operations |
Assets and businesses are classified as held for sale when their carrying amounts are recovered through sale rather than through continuing use. They only meet the held for sale condition when the assets are ready for immediate sale in their present condition, management is committed to the sale and it is highly probable that the sale will complete within one year. Depreciation ceases on assets and businesses when they are classified as held for sale and the assets and businesses are impaired if their carrying value exceeds their fair value less expected costs to sell.The results and cash flows of assets or businesses classified as held for sale or sold during the year, that meet the criteria of being a major separate line of business or geographical area of operation, are shown separately from our continuing operations, and presented within discontinued operations in the income statement and cash flow statement.
|
| Earnings per share |
The earnings per share (EPS) calculations are based on profit after tax attributable to equity shareholders of the parent company which excludes non-controlling interests.
|
| Guaranteed securities |
Niagara Mohawk Power Corporation, a wholly owned subsidiary of the Group, has issued preferred shares that are listed on a US national securities exchange and are guaranteed by National Grid plc. This guarantor commits to honour any liabilities should the company issuing the debt have any financial difficulties. In order to provide debt holders with information on the financial stability of the company providing the guarantee, we are required to disclose individual financial information for this company. We have chosen to include this information in the half year financial information.
|
| X |
- DefinitionExpiry date 2023-01-01: The description of the entity's accounting policy for earnings per share.
Effective 2023-01-01: The description of the entity's material accounting policy information for earnings per share. Reference 1: http://www.xbrl.org/2009/role/commonPracticeRef
-Note Effective 2023-01-01
-Name IAS
-Number 1
-IssueDate 2022-03-24
-Paragraph 117
-URI https://taxonomy.ifrs.org/xifrs-link?type=IAS&num=1&code=ifrs-tx-2022-en-r&anchor=para_117&doctype=Standard
-URIDate 2022-03-24
Reference 2: http://www.xbrl.org/2009/role/commonPracticeRef
-Note Expiry date 2023-01-01
-Name IAS
-Number 1
-IssueDate 2022-03-24
-Paragraph 117
-Subparagraph b
-URI https://taxonomy.ifrs.org/xifrs-link?type=IAS&num=1&code=ifrs-tx-2022-en-b&anchor=para_117_b&doctype=Standard&forcepdf=true
-URIDate 2022-03-24
| Name: |
ifrs-full_DescriptionOfAccountingPolicyForEarningsPerShareExplanatory |
| Namespace Prefix: |
ifrs-full_ |
| Data Type: |
dtr-types:textBlockItemType |
| Balance Type: |
na |
| Period Type: |
duration |
|
| X |
- DefinitionExpiry date 2023-01-01: The description of the entity's accounting policy for exceptional items.
Effective 2023-01-01: The description of the entity's material accounting policy information for exceptional items. Reference 1: http://www.xbrl.org/2009/role/commonPracticeRef
-Note Effective 2023-01-01
-Name IAS
-Number 1
-IssueDate 2022-03-24
-Paragraph 117
-URI https://taxonomy.ifrs.org/xifrs-link?type=IAS&num=1&code=ifrs-tx-2022-en-r&anchor=para_117&doctype=Standard
-URIDate 2022-03-24
Reference 2: http://www.xbrl.org/2009/role/commonPracticeRef
-Note Expiry date 2023-01-01
-Name IAS
-Number 1
-IssueDate 2022-03-24
-Paragraph 117
-Subparagraph b
-URI https://taxonomy.ifrs.org/xifrs-link?type=IAS&num=1&code=ifrs-tx-2022-en-b&anchor=para_117_b&doctype=Standard&forcepdf=true
-URIDate 2022-03-24
| Name: |
ifrs-full_DescriptionOfAccountingPolicyForExceptionalItemsExplanatory |
| Namespace Prefix: |
ifrs-full_ |
| Data Type: |
dtr-types:textBlockItemType |
| Balance Type: |
na |
| Period Type: |
duration |
|
| X |
- DefinitionExpiry date 2023-01-01: The description of the entity's accounting policy for non-current assets or disposal groups classified as held for sale and discontinued operations. [Refer: Discontinued operations [member]; Non-current assets or disposal groups classified as held for sale]
Effective 2023-01-01: The description of the entity's material accounting policy information for non-current assets or disposal groups classified as held for sale and discontinued operations. [Refer: Discontinued operations [member]; Non-current assets or disposal groups classified as held for sale] Reference 1: http://www.xbrl.org/2009/role/commonPracticeRef
-Note Effective 2023-01-01
-Name IAS
-Number 1
-IssueDate 2022-03-24
-Paragraph 117
-URI https://taxonomy.ifrs.org/xifrs-link?type=IAS&num=1&code=ifrs-tx-2022-en-r&anchor=para_117&doctype=Standard
-URIDate 2022-03-24
Reference 2: http://www.xbrl.org/2009/role/commonPracticeRef
-Note Expiry date 2023-01-01
-Name IAS
-Number 1
-IssueDate 2022-03-24
-Paragraph 117
-Subparagraph b
-URI https://taxonomy.ifrs.org/xifrs-link?type=IAS&num=1&code=ifrs-tx-2022-en-b&anchor=para_117_b&doctype=Standard&forcepdf=true
-URIDate 2022-03-24
| Name: |
ifrs-full_DescriptionOfAccountingPolicyForNoncurrentAssetsOrDisposalGroupsClassifiedAsHeldForSaleAndDiscontinuedOperationsExplanatory |
| Namespace Prefix: |
ifrs-full_ |
| Data Type: |
dtr-types:textBlockItemType |
| Balance Type: |
na |
| Period Type: |
duration |
|
| X |
- DefinitionExpiry date 2023-01-01: The description of the entity's accounting policy for recognising revenue. [Refer: Revenue]
Effective 2023-01-01: The description of the entity's material accounting policy information for recognising revenue. [Refer: Revenue] Reference 1: http://www.xbrl.org/2009/role/commonPracticeRef
-Note Effective 2023-01-01
-Name IAS
-Number 1
-IssueDate 2022-03-24
-Paragraph 117
-URI https://taxonomy.ifrs.org/xifrs-link?type=IAS&num=1&code=ifrs-tx-2022-en-r&anchor=para_117&doctype=Standard
-URIDate 2022-03-24
Reference 2: http://www.xbrl.org/2009/role/commonPracticeRef
-Note Expiry date 2023-01-01
-Name IAS
-Number 1
-IssueDate 2022-03-24
-Paragraph 117
-Subparagraph b
-URI https://taxonomy.ifrs.org/xifrs-link?type=IAS&num=1&code=ifrs-tx-2022-en-b&anchor=para_117_b&doctype=Standard&forcepdf=true
-URIDate 2022-03-24
| Name: |
ifrs-full_DescriptionOfAccountingPolicyForRecognitionOfRevenue |
| Namespace Prefix: |
ifrs-full_ |
| Data Type: |
dtr-types:textBlockItemType |
| Balance Type: |
na |
| Period Type: |
duration |
|
| X |
- DefinitionExpiry date 2023-01-01: The description of the entity's accounting policy for segment reporting.
Effective 2023-01-01: The description of the entity's material accounting policy information for segment reporting. Reference 1: http://www.xbrl.org/2009/role/commonPracticeRef
-Note Effective 2023-01-01
-Name IAS
-Number 1
-IssueDate 2022-03-24
-Paragraph 117
-URI https://taxonomy.ifrs.org/xifrs-link?type=IAS&num=1&code=ifrs-tx-2022-en-r&anchor=para_117&doctype=Standard
-URIDate 2022-03-24
Reference 2: http://www.xbrl.org/2009/role/commonPracticeRef
-Note Expiry date 2023-01-01
-Name IAS
-Number 1
-IssueDate 2022-03-24
-Paragraph 117
-Subparagraph b
-URI https://taxonomy.ifrs.org/xifrs-link?type=IAS&num=1&code=ifrs-tx-2022-en-b&anchor=para_117_b&doctype=Standard&forcepdf=true
-URIDate 2022-03-24
| Name: |
ifrs-full_DescriptionOfAccountingPolicyForSegmentReportingExplanatory |
| Namespace Prefix: |
ifrs-full_ |
| Data Type: |
dtr-types:textBlockItemType |
| Balance Type: |
na |
| Period Type: |
duration |
|
| X |
- DefinitionThe disclosure of the known or reasonably estimable information relevant to assessing the possible impact that the application of a new IFRS, that has been issued but is not yet effective, will have. Reference 1: http://www.xbrl.org/2003/role/disclosureRef
-Name IAS
-Number 8
-IssueDate 2022-03-24
-Paragraph 30
-Subparagraph b
-URI https://taxonomy.ifrs.org/xifrs-link?type=IAS&num=8&code=ifrs-tx-2022-en-r&anchor=para_30_b&doctype=Standard
-URIDate 2022-03-24
| Name: |
ifrs-full_DescriptionOfExpectedImpactOfInitialApplicationOfNewStandardsOrInterpretations |
| Namespace Prefix: |
ifrs-full_ |
| Data Type: |
dtr-types:textBlockItemType |
| Balance Type: |
na |
| Period Type: |
duration |
|
| X |
- DefinitionThe disclosure of the initial application of an IFRS. [Refer: IFRSs [member]] Reference 1: http://www.xbrl.org/2003/role/disclosureRef
-Name IAS
-Number 8
-IssueDate 2022-03-24
-Paragraph 28
-URI https://taxonomy.ifrs.org/xifrs-link?type=IAS&num=8&code=ifrs-tx-2022-en-r&anchor=para_28&doctype=Standard
-URIDate 2022-03-24
| Name: |
ifrs-full_DescriptionOfInitialApplicationOfStandardsOrInterpretations |
| Namespace Prefix: |
ifrs-full_ |
| Data Type: |
dtr-types:textBlockItemType |
| Balance Type: |
na |
| Period Type: |
duration |
|
| X |
- DefinitionThe disclosure of the entity's ability to continue as a going concern. Reference 1: http://www.xbrl.org/2009/role/commonPracticeRef
-Name IAS
-Number 1
-IssueDate 2022-03-24
-Paragraph 10
-Subparagraph e
-URI https://taxonomy.ifrs.org/xifrs-link?type=IAS&num=1&code=ifrs-tx-2022-en-r&anchor=para_10_e&doctype=Standard
-URIDate 2022-03-24
| Name: |
ifrs-full_DisclosureOfGoingConcernExplanatory |
| Namespace Prefix: |
ifrs-full_ |
| Data Type: |
dtr-types:textBlockItemType |
| Balance Type: |
na |
| Period Type: |
duration |
|
| X |
- DefinitionAccounting Policies, Changes In Accounting Estimates And Errors [Abstract]
| Name: |
nggtf_AccountingPoliciesChangesInAccountingEstimatesAndErrorsAbstract |
| Namespace Prefix: |
nggtf_ |
| Data Type: |
xbrli:stringItemType |
| Balance Type: |
na |
| Period Type: |
duration |
|
| X |
- DefinitionDisclosure of Accounting Policy for Guaranteed Securities [Policy Text Block]
| Name: |
nggtf_DisclosureOfAccountingPolicyForGuaranteedSecuritiesPolicyTextBlock |
| Namespace Prefix: |
nggtf_ |
| Data Type: |
dtr-types:textBlockItemType |
| Balance Type: |
na |
| Period Type: |
duration |
|
v3.23.3
Segmental analysis (Tables)
|
6 Months Ended |
Sep. 30, 2023 |
|---|
| Disclosure of operating segments [abstract] |
|
| Schedule of information by operating segments |
The following table describes the main activities for each reportable operating segment: | | | | | | | UK Electricity Transmission | The high-voltage electricity transmission networks in England and Wales. This includes our Accelerated Strategic Transmission Investment projects to connect more clean, low-carbon power to the transmission network in England and Wales. | | UK Electricity Distribution | The electricity distribution networks of NGED in the East Midlands, West Midlands and South West of England and South Wales. | | UK Electricity System Operator | The Great Britain system operator. The ESO has not met the criteria to be classified as held for sale as at 30 September 2023. | | New England | Gas distribution networks, electricity distribution networks and high-voltage electricity transmission networks in New England. | | New York | Gas distribution networks, electricity distribution networks and high-voltage electricity transmission networks in New York. | | National Grid Ventures | Comprises all commercial operations in LNG at the Isle of Grain in the UK and Providence, Rhode Island in the US, our electricity generation business in the US, our electricity interconnectors in the UK and our investment in National Grid Renewables Development LLC, our renewables business in the US. NGV operates outside our regulated core business. Our US LNG operations were reclassified from the New England segment following an internal reorganisation in the period. |
Revenue | | | | | | | | | | | | | | | | | | | | | | | | | Six months ended 30 September | 2023 | | 2022² | | Total sales | Sales between segments1 | Sales to third parties | | Total sales | Sales between segments1 | Sales to third
parties | | £m | £m | £m | | £m | £m | £m | | Operating segments – continuing operations: | | | | | | | | | UK Electricity Transmission | 1,356 | | (19) | | 1,337 | | | 969 | | (14) | | 955 | | | UK Electricity Distribution | 850 | | (2) | | 848 | | | 1,005 | | (8) | | 997 | | | UK Electricity System Operator | 1,734 | | (17) | | 1,717 | | | 2,060 | | (15) | | 2,045 | | | New England | 1,441 | | — | | 1,441 | | | 1,760 | | — | | 1,760 | | | New York | 2,365 | | — | | 2,365 | | | 2,758 | | — | | 2,758 | | | National Grid Ventures | 666 | | (27) | | 639 | | | 685 | | (9) | | 676 | | | Other | 142 | | — | | 142 | | | 253 | | — | | 253 | | | Total revenue from continuing operations | 8,554 | | (65) | | 8,489 | | | 9,490 | | (46) | | 9,444 | | | | | | | | | | | Geographical areas: | | | | | | | | | UK | | | 4,309 | | | | | 4,589 | | | US | | | 4,180 | | | | | 4,855 | | | Total revenue from continuing operations | | | 8,489 | | | | | 9,444 | |
1.Sales between operating segments are priced having regard to the regulatory and legal requirements to which the businesses are subject. The analysis of revenue by geographical area is on the basis of destination. There are no material sales between the UK and US geographical areas. 2.Comparative amounts have been re-presented to reflect NGV as a separate operating segment. Operating profit/(loss) | | | | | | | | | | | | | | | | | | | | | | | | | | | | Before exceptional items and remeasurements | | Exceptional items and remeasurements (see note 4) | | After exceptional items and remeasurements | | Six months ended 30 September | 2023 | 2022¹ | | 2023 | 2022¹ | | 2023 | 2022¹ | | £m | £m | | £m | £m | | £m | £m | | Operating segments – continuing operations: | | | | | | | | | | UK Electricity Transmission | 839 | | 499 | | (1) | | (6) | | | 838 | | 493 | | | UK Electricity Distribution | 476 | | 531 | | | (4) | | (9) | | | 472 | | 522 | | | UK Electricity System Operator | 443 | | 147 | | | — | | (1) | | | 443 | | 146 | | | New England | (32) | | 193 | | | (15) | | 527 | | | (47) | | 720 | | | New York | (30) | | (18) | | | 38 | | (8) | | | 8 | | (26) | | | National Grid Ventures | 219 | | 259 | | | 91 | | 49 | | | 310 | | 308 | | | Other | (13) | | 145 | | | (26) | | (69) | | | (39) | | 76 | | | Total operating profit from continuing operations | 1,902 | | 1,756 | | | 83 | | 483 | | | 1,985 | | 2,239 | | | | | | | | | | | | Geographical areas: | | | | | | | | | | UK | 1,956 | | 1,550 | | | 60 | | (32) | | | 2,016 | | 1,518 | | | US | (54) | | 206 | | | 23 | | 515 | | | (31) | | 721 | | | Total operating profit from continuing operations | 1,902 | | 1,756 | | | 83 | | 483 | | | 1,985 | | 2,239 | |
1.Comparative amounts have been re-presented to reflect NGV as a separate operating segment. | | | | | | | | | | | | | | | | | | | | | | | | | | | | Before exceptional items and remeasurements | | Exceptional items and remeasurements (see note 4) | | After exceptional items and remeasurements | | Six months ended 30 September | 2023 | 2022¹ | | 2023 | 2022¹ | | 2023 | 2022¹ | | £m | £m | | £m | £m | | £m | £m | | Reconciliation to profit before tax: | | | | | | | | | | Operating profit from continuing operations | 1,902 | | 1,756 | | | 83 | | 483 | | | 1,985 | | 2,239 | | | Share of post-tax results of joint ventures and associates | 59 | | 70 | | | 12 | | (19) | | | 71 | | 51 | | | Finance income | 123 | | 69 | | | (8) | | (32) | | | 115 | | 37 | | | Finance costs | (834) | | (801) | | | 34 | | 140 | | | (800) | | (661) | | | Total profit before tax from continuing operations | 1,250 | | 1,094 | | | 121 | | 572 | | | 1,371 | | 1,666 | |
1.Comparative amounts have been re-presented to reflect the classification of the FAA option as held for sale and within discontinued operations. Capital expenditureCapital expenditure represents additions to property, plant and equipment and other intangible assets but excludes additional investments in and loans to joint ventures and associates.
| | | | | | | | | | | | | | | | | | | | | | | | | | | | Net book value of property, plant and equipment and other intangible assets | | Capital expenditure | | Depreciation, amortisation
and impairment | | 30 September 2023 | 31 March 2023¹ | | 30 September 2023 | 30 September 2022¹ | | 30 September 2023 | 30 September 2022¹ | | £m | £m | | £m | £m | | £m | £m | | Operating segments: | | | | | | | | | | UK Electricity Transmission | 16,030 | | 15,483 | | | 800 | | 629 | | | (250) | | (235) | | | UK Electricity Distribution | 13,940 | | 13,462 | | | 608 | | 584 | | | (105) | | (104) | | | UK Electricity System Operator | 434 | | 411 | | | 75 | | 42 | | | (52) | | (40) | | | New England | 13,781 | | 13,033 | | | 789 | | 801 | | | (204) | | (184) | | | New York | 22,937 | | 21,730 | | | 1,257 | | 1,242 | | | (321) | | (292) | | | National Grid Ventures | 3,956 | | 3,880 | | | 175 | | 410 | | | (84) | | (73) | | | Other | 35 | | 38 | | | 2 | | 9 | | | (5) | | (4) | | | Total | 71,113 | | 68,037 | | | 3,706 | | 3,717 | | | (1,021) | | (932) | | | | | | | | | | | | Geographical areas: | | | | | | | | | | UK | 33,475 | | 32,343 | | | 1,649 | | 1,594 | | | (464) | | (432) | | | US | 37,638 | | 35,694 | | | 2,057 | | 2,123 | | | (557) | | (500) | | | Total | 71,113 | | 68,037 | | | 3,706 | | 3,717 | | | (1,021) | | (932) | | | | | | | | | | | | By asset type: | | | | | | | | | | Property, plant and equipment | 67,396 | | 64,433 | | | 3,449 | | 3,490 | | | (868) | | (829) | | | Other intangible assets | 3,717 | | 3,604 | | | 257 | | 227 | | | (153) | | (103) | | | Total | 71,113 | | 68,037 | | | 3,706 | | 3,717 | | | (1,021) | | (932) | |
1.Comparative amounts have been re-presented to reflect NGV as a separate operating segment and the reclassification of our US LNG operations from New England to NGV following an internal reorganisation in the period.
|
| X |
- References
+ Details
| Name: |
ifrs-full_DisclosureOfOperatingSegmentsAbstract |
| Namespace Prefix: |
ifrs-full_ |
| Data Type: |
xbrli:stringItemType |
| Balance Type: |
na |
| Period Type: |
duration |
|
| X |
- DefinitionThe disclosure of operating segments. [Refer: Operating segments [member]] Reference 1: http://www.xbrl.org/2003/role/disclosureRef
-Name IFRS
-Number 8
-IssueDate 2022-03-24
-Paragraph 23
-URI https://taxonomy.ifrs.org/xifrs-link?type=IFRS&num=8&code=ifrs-tx-2022-en-r&anchor=para_23&doctype=Standard
-URIDate 2022-03-24
| Name: |
ifrs-full_DisclosureOfOperatingSegmentsExplanatory |
| Namespace Prefix: |
ifrs-full_ |
| Data Type: |
dtr-types:textBlockItemType |
| Balance Type: |
na |
| Period Type: |
duration |
|
v3.23.3
Revenue (Tables)
|
6 Months Ended |
Sep. 30, 2023 |
|---|
| Revenue [abstract] |
|
| Schedule of disaggregation of revenue from contracts with customers |
| | | | | | | | | | | | | | | | | | | | | | | | | | | Revenue for the six months ended 30 September 2023 | UK Electricity Transmission
£m | UK Electricity Distribution
£m | UK Electricity System Operator
£m | New
England
£m | New
York
£m | National Grid Ventures
£m | Other
£m | Total
£m | | Revenue under IFRS 15 | | | | | | | | | | Transmission | 1,299 | | — | | 5 | | 43 | | 283 | | 426 | | — | | 2,056 | | | Distribution | — | | 810 | | — | | 1,329 | | 2,047 | | — | | — | | 4,186 | | | System Operator | — | | — | | 1,712 | | — | | — | | — | | — | | 1,712 | | Other1 | 9 | | 36 | | — | | 4 | | 7 | | 75 | | — | | 131 | | | Total IFRS 15 revenue | 1,308 | | 846 | | 1,717 | | 1,376 | | 2,337 | | 501 | | — | | 8,085 | | | Other revenue | | | | | | | | | | Generation | — | | — | | — | | — | | — | | 181 | | — | | 181 | | Other2 | 29 | | 2 | | — | | 65 | | 28 | | (43) | | 142 | | 223 | | | Total other revenue | 29 | | 2 | | — | | 65 | | 28 | | 138 | | 142 | | 404 | | | Total revenue from continuing operations | 1,337 | | 848 | | 1,717 | | 1,441 | | 2,365 | | 639 | | 142 | | 8,489 | |
| | | | | | | | | | | | | | | | | | | | | | | | | | | Geographic split of revenue for the six months ended 30 September 2023 | UK Electricity Transmission
£m | UK Electricity Distribution
£m | UK Electricity System Operator
£m | New England
£m | New
York
£m | National Grid Ventures
£m | Other
£m | Total
£m | | Revenue under IFRS 15 | | | | | | | | | | UK | 1,308 | | 846 | | 1,717 | | — | | — | | 430 | | — | | 4,301 | | | US | — | | — | | — | | 1,376 | | 2,337 | | 71 | | — | | 3,784 | | | Total IFRS 15 revenue | 1,308 | | 846 | | 1,717 | | 1,376 | | 2,337 | | 501 | | — | | 8,085 | | | Other revenue | | | | | | | | | | UK | 29 | | 2 | | — | | — | | — | | (50) | | 27 | | 8 | | | US | — | | — | | — | | 65 | | 28 | | 188 | | 115 | | 396 | | | Total other revenue | 29 | | 2 | | — | | 65 | | 28 | | 138 | | 142 | | 404 | | | Total revenue from continuing operations | 1,337 | | 848 | | 1,717 | | 1,441 | | 2,365 | | 639 | | 142 | | 8,489 | |
1.The UK Electricity Transmission and UK Electricity Distribution other IFRS 15 revenue principally relates to engineering recharges, which are the recovery of costs incurred for construction work requested by customers, such as the re-routing of existing network assets. Within NGV, the other IFRS 15 revenue principally relates to revenue generated from our NG Renewables business. 2.Other revenue, recognised in accordance with accounting standards other than IFRS 15, includes property sales by our UK commercial property business, rental income, income arising in connection with the Transition Services Agreements in place following the sales of The Narragansett Electric Company (NECO) and the UK Gas Transmission business, and an adjustment to NGV revenue in respect of the interconnector cap and floor and Use of Revenue regimes constructed by Ofgem. | | | | | | | | | | | | | | | | | | | | | | | | | | | Revenue for the six months ended 30 September 2022 | UK Electricity Transmission
£m | UK Electricity Distribution
£m | UK Electricity System Operator
£m | New England
£m | New York
£m | National Grid Ventures¹ £m | Other¹ £m | Total
£m | | Revenue under IFRS 15 | | | | | | | | | | Transmission | 931 | | — | | 77 | | 53 | | 117 | | 306 | | — | | 1,484 | | | Distribution | — | | 940 | | — | | 1,675 | | 2,617 | | — | | — | | 5,232 | | | System Operator | — | | — | | 1,968 | | — | | — | | — | | — | | 1,968 | | Other2 | 16 | | 43 | | — | | 4 | | 6 | | 69 | | — | | 138 | | | Total IFRS 15 revenue | 947 | | 983 | | 2,045 | | 1,732 | | 2,740 | | 375 | | — | | 8,822 | | | Other revenue | | | | | | | | | | Generation | — | | — | | — | | — | | — | | 224 | | — | | 224 | | Other3 | 8 | | 14 | | — | | 28 | | 18 | | 77 | | 253 | | 398 | | | Total other revenue | 8 | | 14 | | — | | 28 | | 18 | | 301 | | 253 | | 622 | | | Total revenue from continuing operations | 955 | | 997 | | 2,045 | | 1,760 | | 2,758 | | 676 | | 253 | | 9,444 | |
| | | | | | | | | | | | | | | | | | | | | | | | | | | Geographic split of revenue for the six months ended 30 September 2022 | UK Electricity Transmission
£m | UK Electricity Distribution
£m | UK Electricity System Operator
£m | New England
£m | New York
£m | National Grid Ventures¹ £m | Other¹ £m | Total
£m | | Revenue under IFRS 15 | | | | | | | | | | UK | 947 | | 983 | | 2,045 | | — | | — | | 310 | | — | | 4,285 | | | US | — | | — | | — | | 1,732 | | 2,740 | | 65 | | — | | 4,537 | | | Total IFRS 15 revenue | 947 | | 983 | | 2,045 | | 1,732 | | 2,740 | | 375 | | — | | 8,822 | | | Other revenue | | | | | | | | | | UK | 8 | | 14 | | — | | — | | — | | 83 | | 199 | | 304 | | | US | — | | — | | — | | 28 | | 18 | | 218 | | 54 | | 318 | | | Total other revenue | 8 | | 14 | | — | | 28 | | 18 | | 301 | | 253 | | 622 | | | Total revenue from continuing operations | 955 | | 997 | | 2,045 | | 1,760 | | 2,758 | | 676 | | 253 | | 9,444 | |
1.Comparative amounts have been re-presented to reflect NGV as a separate operating segment. 2.The UK Electricity Transmission and UK Electricity Distribution other IFRS 15 revenue principally relates to engineering recharges, which are the recovery of costs incurred for construction work requested by customers, such as the re-routing of existing network assets. Within NGV, the other IFRS 15 revenue principally relates to revenue generated from our NG Renewables business. 3.Other revenue, recognised in accordance with accounting standards other than IFRS 15, includes property sales by our UK commercial property business, rental income and income arising in connection with the Transition Services Agreement with PPL Rhode Island Holdings, LLC following the sale of NECO. In the period ended 30 September 2022 the Group also recognised other income relating to an insurance claim.
|
| X |
- DefinitionThe disclosure of the disaggregation of revenue from contracts with customers. [Refer: Revenue from contracts with customers] Reference 1: http://www.xbrl.org/2003/role/disclosureRef
-Name IFRS
-Number 15
-IssueDate 2022-03-24
-Paragraph 114
-URI https://taxonomy.ifrs.org/xifrs-link?type=IFRS&num=15&code=ifrs-tx-2022-en-r&anchor=para_114&doctype=Standard
-URIDate 2022-03-24
| Name: |
ifrs-full_DisclosureOfDisaggregationOfRevenueFromContractsWithCustomersExplanatory |
| Namespace Prefix: |
ifrs-full_ |
| Data Type: |
dtr-types:textBlockItemType |
| Balance Type: |
na |
| Period Type: |
duration |
|
| X |
- References
+ Details
| Name: |
ifrs-full_RevenueAbstract |
| Namespace Prefix: |
ifrs-full_ |
| Data Type: |
xbrli:stringItemType |
| Balance Type: |
na |
| Period Type: |
duration |
|
v3.23.3
Exceptional items and remeasurements (Tables)
|
6 Months Ended |
Sep. 30, 2023 |
|---|
| Exceptional Items And Remeasurements [Abstract] |
|
| Schedule of exceptional items and remeasurements from continuing operations |
| | | | | | | | | | | | | Six months ended 30 September 2023 | Exceptional items
£m | Remeasurements
£m | Total
£m | | Included within operating profit from continuing operations | | | | | Cost efficiency programme | (39) | | — | | (39) | | | Transaction, separation and integration costs¹ | (11) | | — | | (11) | | | IFA1 fire insurance proceeds | 92 | | — | | 92 | | | Net gains on commodity contract derivatives | — | | 41 | | 41 | | | 42 | | 41 | | 83 | | | | | | | | | | | | | | | | | | | | | | | | | | | | | | | | | | | | | | | | | | | | | |
| | | | | | | | | | | | | Six months ended 30 September 2022² | Exceptional items
£m | Remeasurements
£m | Total
£m | | Included within operating profit from continuing operations | | | | | Net gain on disposal of NECO | 511 | | — | | 511 | | | Cost efficiency programme | (61) | | — | | (61) | | Transaction, separation and integration costs1 | (65) | | — | | (65) | | | IFA1 fire insurance proceeds | 33 | | — | | 33 | | | Net gains on commodity contract derivatives | — | | 65 | | 65 | | | 418 | | 65 | | 483 | | | | | | | | | | | | | | | | | | | | | | | | | | | | | | | | | | | | | | | | | | | | | |
1.Transaction, separation and integration costs represent the aggregate of distinct activities undertaken by the Group in the periods presented. 2.Comparative amounts have been re-presented to reflect the classification of the FAA option as held for sale and within discontinued operations. Details of remeasurements, tax exceptional items and the tax effect of exceptional items and remeasurements are also provided in this note.
| | | | | | | | | | | | | Six months ended 30 September 2023 | Exceptional items
£m | Remeasurements
£m | Total
£m | | Included within operating profit from continuing operations | 42 | | 41 | | 83 | | | | | | | | | | | | | | | | | | | | | | Included within net finance costs (note 5) | | | | | Net gains on derivative financial instruments | — | | 34 | | 34 | | | Net losses on financial assets at fair value through profit and loss | — | | (8) | | (8) | | | — | | 26 | | 26 | | | Included within share of post-tax results of joint ventures and associates | | | | | Net gains on financial instruments | — | | 12 | | 12 | | | — | | 12 | | 12 | | | | | | | Total included within profit before tax from continuing operations | 42 | | 79 | | 121 | | | Tax on exceptional items and remeasurements | 1 | | (21) | | (20) | | Total exceptional items and remeasurements after tax from
continuing operations | 43 | | 58 | | 101 | |
| | | | | | | | | | | | | Six months ended 30 September 2022¹ | Exceptional items
£m | Remeasurements
£m | Total
£m | | Included within operating profit from continuing operations | 418 | | 65 | | 483 | | | | | | | | | | | | | | | | | | | | | | | | | | Included within net finance costs (note 5) | | | | | Net gains on derivative financial instruments | — | | 140 | | 140 | | | Net losses on financial assets at fair value through profit and loss | — | | (32) | | (32) | | | — | | 108 | | 108 | | | Included within share of post-tax results of joint ventures and associates | | | | | Net losses on financial instruments | — | | (19) | | (19) | | | — | | (19) | | (19) | | | | | | | Total included within profit before tax from continuing operations | 418 | | 154 | | 572 | | | Tax on exceptional items and remeasurements | (221) | | (49) | | (270) | | Total exceptional items and remeasurements after tax from
continuing operations | 197 | | 105 | | 302 | |
1.Comparative amounts have been re-presented to reflect the classification of the FAA option as held for sale and within discontinued operations.
|
| X |
- DefinitionDisclsoure Of Exceptional Items And Remeasurements From Continuing Operations Explanatory [Table Text Block]
| Name: |
nggtf_DisclsoureOfExceptionalItemsAndRemeasurementsFromContinuingOperationsExplanatoryTableTextBlock |
| Namespace Prefix: |
nggtf_ |
| Data Type: |
dtr-types:textBlockItemType |
| Balance Type: |
na |
| Period Type: |
duration |
|
| X |
- DefinitionExceptional Items And Remeasurements [Abstract]
| Name: |
nggtf_ExceptionalItemsAndRemeasurementsAbstract |
| Namespace Prefix: |
nggtf_ |
| Data Type: |
xbrli:stringItemType |
| Balance Type: |
na |
| Period Type: |
duration |
|
v3.23.3
Finance income and costs (Tables)
|
6 Months Ended |
Sep. 30, 2023 |
|---|
| Analysis of income and expense [abstract] |
|
| Schedule of finance income and costs |
| | | | | | | | | | | | | | | | | | 2023 | 2022¹ | | Six months ended 30 September | Notes | | £m | £m | | Finance income | | | | | | Interest income from financing activities | | | 52 | | 14 | | | Net interest on pensions and other post-retirement benefit obligations | | | 51 | | 41 | | | Net losses on financial assets at fair value through profit and loss | | | (8) | | (32) | | | Other interest income | | | 20 | | 14 | | | | | 115 | | 37 | | | Finance costs | | | | | Interest expense on financial instruments2 | | | (903) | | (878) | | | Unwinding of discount on provisions | | | (50) | | (42) | | | Other interest | | | (8) | | 8 | | Net gains on derivative financial instruments3 | | | 34 | | 140 | | Less: interest capitalised4 | | | 127 | | 111 | | | | | (800) | | (661) | | | | | | | | Net finance costs | | | (685) | | (624) | |
1.Comparative amounts have been re-presented to reflect the classification of the FAA option as held for sale and within discontinued operations. 2.Finance costs include principal accretion on inflation-linked debt of £149 million (2022: £240 million) and income related to principal accretion on inflation-linked swaps of £18 million (2022: £5 million expense). 3.Includes a net foreign exchange gain on borrowing activities, offset by foreign exchange losses and gains on financing derivatives measured at fair value. 4.Interest on funding attributable to assets in the course of construction in the current period was capitalised at a rate of 4.7% (2022: 4.3%). In the UK, capitalised interest qualifies for a current year tax deduction with tax relief claimed of £21 million (2022: £13 million). In the US, capitalised interest is added to the cost of property, plant and equipment and qualifies for tax depreciation allowances
|
| X |
- References
+ Details
| Name: |
ifrs-full_AnalysisOfIncomeAndExpenseAbstract |
| Namespace Prefix: |
ifrs-full_ |
| Data Type: |
xbrli:stringItemType |
| Balance Type: |
na |
| Period Type: |
duration |
|
| X |
- DefinitionDisclosure Of Finance Income And Costs Explanatory [Table Text Block]
| Name: |
nggtf_DisclosureOfFinanceIncomeAndCostsExplanatoryTableTextBlock |
| Namespace Prefix: |
nggtf_ |
| Data Type: |
dtr-types:textBlockItemType |
| Balance Type: |
na |
| Period Type: |
duration |
|
v3.23.3
Assets held for sale and discontinued operations (Tables)
|
6 Months Ended |
Sep. 30, 2023 |
|---|
| Non-current assets or disposal groups classified as held for sale or as held for distribution to owners [abstract] |
|
| Schedule of assets and liabilities classified as held for sale |
The following assets and liabilities were classified as held for sale:
| | | | | | | | | | | | | | | | | | | | | | | | | 30 September 2023 | | 31 March 2023 | | Total assets
held for sale
£m | Total liabilities held for sale
£m | Net assets held for sale
£m | | Total assets
held for sale
£m | Total liabilities held for sale
£m | Net assets held for sale
£m | Investment in GasT TopCo Limited | 1,441 | | — | | 1,441 | | | 1,443 | | — | | 1,443 | | | FAA option | — | | — | | — | | | — | | (109) | | (109) | | | FAA forward | — | | (7) | | (7) | | | — | | — | | — | | | RAA option | — | | (44) | | (44) | | | — | | — | | — | | | Net assets held for sale | 1,441 | | (51) | | 1,390 | | | 1,443 | | (109) | | 1,334 | |
|
| Summary of discontinued operations |
The summary income statements for the periods ended 30 September 2023 and 2022 are as follows: | | | | | | | | | | | | | | | | | | | | | | | | | | | | | | 2023 | 2022¹ | | | | | | | | £m | £m | | Discontinued operations | | | | | | | | | | Revenue | | | | | | | — | | 805 | | | Other operating costs | | | | | | | — | | (459) | | | Operating profit | | | | | | | — | | 346 | | | Finance income | | | | | | | 9 | | 9 | | | Finance costs² | | | | | | | 61 | | (261) | | | Profit/(loss) before tax | | | | | | | 70 | | 94 | | | Tax | | | | | | | (5) | | (57) | | | Profit/(loss) after tax from discontinued operations | | | | | | | 65 | | 37 | |
1.Comparative amounts have been re-presented to reflect the classification of the FAA option as held for sale and within discontinued operations. 2.Finance costs include the remeasurement of the FAA option, the FAA forward and the RAA option.
The summary statements of comprehensive income are as follows: | | | | | | | | | | 2023 | 2022¹ | | £m | £m | | Profit after tax from discontinued operations | 65 | | 37 | | | Other comprehensive (loss)/income from discontinued operations | | | | Items from discontinued operations that will never be reclassified to profit or loss: | | | | Remeasurement losses on pension assets and post-retirement benefit obligations | — | | (126) | | | Tax on items that will never be reclassified to profit or loss | — | | 31 | | | Total losses from discontinued operations that will never be reclassified to profit or loss | — | | (95) | | | Items from discontinued operations that may be reclassified subsequently to profit or loss: | | | | Net gains in respect of cash flow hedges | — | | 8 | | | Net gains in respect of cost of hedging | — | | 4 | | Net losses on investments in debt instruments measured at fair value through other
comprehensive income | (12) | | — | | | Tax on items that may be reclassified subsequently to profit or loss | 3 | | (3) | | | Total (losses)/gains from discontinued operations that may be reclassified subsequently to profit or loss | (9) | | 9 | | | Other comprehensive loss for the period, net of tax, from discontinued operations | (9) | | (86) | | | Total comprehensive income/(loss) for the period from discontinued operations | 56 | | (49) | |
1.Comparative amounts have been re-presented to reflect the classification of the FAA option as held for sale and within discontinued operations.
|
| X |
- DefinitionThe disclosure of the analysis of the single amount of discontinued operations. [Refer: Discontinued operations [member]] Reference 1: http://www.xbrl.org/2003/role/disclosureRef
-Name IFRS
-Number 5
-IssueDate 2022-03-24
-Paragraph 33
-Subparagraph b
-URI https://taxonomy.ifrs.org/xifrs-link?type=IFRS&num=5&code=ifrs-tx-2022-en-r&anchor=para_33_b&doctype=Standard
-URIDate 2022-03-24
| Name: |
ifrs-full_DisclosureOfAnalysisOfSingleAmountOfDiscontinuedOperationsExplanatory |
| Namespace Prefix: |
ifrs-full_ |
| Data Type: |
dtr-types:textBlockItemType |
| Balance Type: |
na |
| Period Type: |
duration |
|
| X |
- References
+ Details
| Name: |
ifrs-full_NoncurrentAssetsOrDisposalGroupsClassifiedAsHeldForSaleOrAsHeldForDistributionToOwnersAbstract |
| Namespace Prefix: |
ifrs-full_ |
| Data Type: |
xbrli:stringItemType |
| Balance Type: |
na |
| Period Type: |
duration |
|
| X |
- DefinitionDisclosure Of Assets And Liabilities Classified As Held For Sale Explanatory
| Name: |
nggtf_DisclosureOfAssetsAndLiabilitiesClassifiedAsHeldForSaleExplanatoryTableTextBlock |
| Namespace Prefix: |
nggtf_ |
| Data Type: |
dtr-types:textBlockItemType |
| Balance Type: |
na |
| Period Type: |
duration |
|
v3.23.3
Earnings per share (Tables)
|
6 Months Ended |
Sep. 30, 2023 |
|---|
| Earnings per share [abstract] |
|
| Schedule of basic and diluted earnings per share |
Basic earnings per share | | | | | | | | | | | | | | | | Earnings | EPS | Earnings | EPS | | Six months ended 30 September | 2023 | 2023 | 2022¹ | 2022¹ | | £m | pence | £m | pence | | | | | | | | | | | | Profit after tax from continuing operations attributable to the parent | 1,063 | | 28.8 | | 1,219 | | 33.4 | | | | | | | | | | | | | Profit after tax from discontinued operations attributable to the parent | 65 | | 1.8 | | 37 | | 1 | | | | | | | | | | | | | Total profit after tax attributable to the parent | 1,128 | | 30.6 | | 1,256 | | 34.4 | | | | | | | | | 2023 | | 2022 | | | millions | | millions | | Weighted average number of shares – basic | | 3,682 | | | 3,651 | |
1.Comparative amounts have been re-presented to reflect the classification of the FAA option as held for sale and within discontinued operations.
(b)Diluted earnings per share | | | | | | | | | | | | | | | | Earnings | EPS | Earnings | EPS | | Six months ended 30 September | 2023 | 2023 | 2022¹ | 2022¹ | | £m | pence | £m | pence | | | | | | | | | | | | Profit after tax from continuing operations attributable to the parent | 1,063 | | 28.7 | | 1,219 | | 33.2 | | | | | | | | | | | | | Profit after tax from discontinued operations attributable to the parent | 65 | | 1.8 | | 37 | | 1 | | | | | | | | | | | | | Total profit after tax attributable to the parent | 1,128 | | 30.5 | | 1,256 | | 34.2 | | | | | | | | | 2023 | | 2022 | | | millions | | millions | | Weighted average number of shares – diluted | | 3,700 | | | 3,668 | |
1.Comparative amounts have been re-presented to reflect the classification of the FAA option as held for sale and within discontinued operations.
|
| X |
- References
+ Details
| Name: |
ifrs-full_EarningsPerShareAbstract |
| Namespace Prefix: |
ifrs-full_ |
| Data Type: |
xbrli:stringItemType |
| Balance Type: |
na |
| Period Type: |
duration |
|
| X |
- DefinitionThe disclosure of earnings per share. Reference 1: http://www.xbrl.org/2003/role/disclosureRef
-Name IAS
-Number 33
-IssueDate 2022-03-24
-Paragraph 66
-URI https://taxonomy.ifrs.org/xifrs-link?type=IAS&num=33&code=ifrs-tx-2022-en-r&anchor=para_66&doctype=Standard
-URIDate 2022-03-24
| Name: |
ifrs-full_EarningsPerShareExplanatory |
| Namespace Prefix: |
ifrs-full_ |
| Data Type: |
dtr-types:textBlockItemType |
| Balance Type: |
na |
| Period Type: |
duration |
|
v3.23.3
| X |
- References
+ Details
| Name: |
ifrs-full_SubclassificationsOfAssetsLiabilitiesAndEquitiesAbstract |
| Namespace Prefix: |
ifrs-full_ |
| Data Type: |
xbrli:stringItemType |
| Balance Type: |
na |
| Period Type: |
duration |
|
| X |
- DefinitionDisclosure Of Dividends To Shareholders [Table Text Block]
| Name: |
nggtf_DisclosureOfDividendsToShareholdersTableTextBlock |
| Namespace Prefix: |
nggtf_ |
| Data Type: |
dtr-types:textBlockItemType |
| Balance Type: |
na |
| Period Type: |
duration |
|
v3.23.3
Fair value measurement (Tables)
|
6 Months Ended |
Sep. 30, 2023 |
|---|
| Fair Value Measurement [Abstract] |
|
| Schedule of fair value measurement of assets |
The following table categorises these assets and liabilities by the valuation methodology applied in determining their fair value using the fair value hierarchy described on page 197 of the Annual Report and Accounts for the year ended 31 March 2023. | | | | | | | | | | | | | | | | | | | | | | | | | | | | | | | 30 September 2023 | | 31 March 2023 | | Level 1
£m | Level 2
£m | Level 3
£m | Total
£m | | Level 1
£m | Level 2
£m | Level 3
£m | Total
£m | | Assets | | | | | | | | | | | Investments held at fair value through profit and loss | 1,007 | | — | | 483 | | 1,490 | | | 1,764 | | — | | 452 | | 2,216 | | Investments held at fair value through other comprehensive income1 | — | | 388 | | — | | 388 | | | — | | 407 | | — | | 407 | | | Financing derivatives | — | | 309 | | 20 | | 329 | | | — | | 341 | | 22 | | 363 | | | Commodity contract derivatives | — | | 54 | | 2 | | 56 | | | — | | 62 | | 4 | | 66 | | | 1,007 | | 751 | | 505 | | 2,263 | | | 1,764 | | 810 | | 478 | | 3,052 | | | Liabilities | | | | | | | | | | | Financing derivatives | — | | (1,219) | | (95) | | (1,314) | | | — | | (997) | | (122) | | (1,119) | | | Commodity contract derivatives | — | | (78) | | (45) | | (123) | | | — | | (134) | | (40) | | (174) | | | | | | | | | | | | Contingent consideration2 | — | | — | | (10) | | (10) | | | — | | — | | (19) | | (19) | | | — | | (1,297) | | (150) | | (1,447) | | | — | | (1,131) | | (181) | | (1,312) | | | Total | 1,007 | | (546) | | 355 | | 816 | | | 1,764 | | (321) | | 297 | | 1,740 | |
1.Investments held include instruments which meet the criteria of IFRS 9 or IAS 19. 2.Contingent consideration relates to the acquisition of National Grid Renewables Development LLC. The changes in fair value of our level 3 financial assets and liabilities in the six months to 30 September are presented below: | | | | | | | | | | | | | | | | | | | | | | | | | | | | | | | | | | | | | Financing derivatives | | Commodity contract derivatives | | Other1 | | Total | | 2023 | 2022 | | 2023 | 2022 | | 2023 | 2022 | | 2023 | 2022 | | £m | £m | | £m | £m | | £m | £m | | £m | £m | | At 1 April | (100) | | (187) | | | (36) | | 44 | | | 433 | | 376 | | | 297 | | 233 | | Net gains/(losses) through the consolidated income statement for the period2,3 | 25 | | 76 | | | (4) | | 44 | | | 26 | | 30 | | | 47 | | 150 | | | Purchases | — | | (133) | | | (10) | | (56) | | | 11 | | 37 | | | 1 | | (152) | | | Settlements | — | | — | | | 7 | | (4) | | | 3 | | (4) | | | 10 | | (8) | | At 30 September4 | (75) | | (244) | | | (43) | | 28 | | | 473 | | 439 | | | 355 | | 223 | |
1.Other comprises our investments in Sunrun Neptune 2016 LLC and the investments made by National Grid Partners, which are accounted for at fair value through profit and loss and the contingent consideration arising from the acquisition of National Grid Renewables Development LLC. Net gains and loss are recognised within finance income and costs in the income statement. 2.Gains of £25 million (2022: gains of £93 million) are attributable to derivative financial instruments held at the end of the reporting period and have been recognised in finance costs in the income statement. 3.Losses of £15 million (2022: losses of £23 million) are attributable to the commodity contract derivative financial instruments held at the end of the reporting period and have been recognised in other operating costs in the consolidated income statement. 4.There were no reclassifications in or out of level 3 (2022: none).
|
| Schedule of fair value measurement of liabilities |
The following table categorises these assets and liabilities by the valuation methodology applied in determining their fair value using the fair value hierarchy described on page 197 of the Annual Report and Accounts for the year ended 31 March 2023. | | | | | | | | | | | | | | | | | | | | | | | | | | | | | | | 30 September 2023 | | 31 March 2023 | | Level 1
£m | Level 2
£m | Level 3
£m | Total
£m | | Level 1
£m | Level 2
£m | Level 3
£m | Total
£m | | Assets | | | | | | | | | | | Investments held at fair value through profit and loss | 1,007 | | — | | 483 | | 1,490 | | | 1,764 | | — | | 452 | | 2,216 | | Investments held at fair value through other comprehensive income1 | — | | 388 | | — | | 388 | | | — | | 407 | | — | | 407 | | | Financing derivatives | — | | 309 | | 20 | | 329 | | | — | | 341 | | 22 | | 363 | | | Commodity contract derivatives | — | | 54 | | 2 | | 56 | | | — | | 62 | | 4 | | 66 | | | 1,007 | | 751 | | 505 | | 2,263 | | | 1,764 | | 810 | | 478 | | 3,052 | | | Liabilities | | | | | | | | | | | Financing derivatives | — | | (1,219) | | (95) | | (1,314) | | | — | | (997) | | (122) | | (1,119) | | | Commodity contract derivatives | — | | (78) | | (45) | | (123) | | | — | | (134) | | (40) | | (174) | | | | | | | | | | | | Contingent consideration2 | — | | — | | (10) | | (10) | | | — | | — | | (19) | | (19) | | | — | | (1,297) | | (150) | | (1,447) | | | — | | (1,131) | | (181) | | (1,312) | | | Total | 1,007 | | (546) | | 355 | | 816 | | | 1,764 | | (321) | | 297 | | 1,740 | |
1.Investments held include instruments which meet the criteria of IFRS 9 or IAS 19. 2.Contingent consideration relates to the acquisition of National Grid Renewables Development LLC. The changes in fair value of our level 3 financial assets and liabilities in the six months to 30 September are presented below: | | | | | | | | | | | | | | | | | | | | | | | | | | | | | | | | | | | | | Financing derivatives | | Commodity contract derivatives | | Other1 | | Total | | 2023 | 2022 | | 2023 | 2022 | | 2023 | 2022 | | 2023 | 2022 | | £m | £m | | £m | £m | | £m | £m | | £m | £m | | At 1 April | (100) | | (187) | | | (36) | | 44 | | | 433 | | 376 | | | 297 | | 233 | | Net gains/(losses) through the consolidated income statement for the period2,3 | 25 | | 76 | | | (4) | | 44 | | | 26 | | 30 | | | 47 | | 150 | | | Purchases | — | | (133) | | | (10) | | (56) | | | 11 | | 37 | | | 1 | | (152) | | | Settlements | — | | — | | | 7 | | (4) | | | 3 | | (4) | | | 10 | | (8) | | At 30 September4 | (75) | | (244) | | | (43) | | 28 | | | 473 | | 439 | | | 355 | | 223 | |
1.Other comprises our investments in Sunrun Neptune 2016 LLC and the investments made by National Grid Partners, which are accounted for at fair value through profit and loss and the contingent consideration arising from the acquisition of National Grid Renewables Development LLC. Net gains and loss are recognised within finance income and costs in the income statement. 2.Gains of £25 million (2022: gains of £93 million) are attributable to derivative financial instruments held at the end of the reporting period and have been recognised in finance costs in the income statement. 3.Losses of £15 million (2022: losses of £23 million) are attributable to the commodity contract derivative financial instruments held at the end of the reporting period and have been recognised in other operating costs in the consolidated income statement. 4.There were no reclassifications in or out of level 3 (2022: none).
|
| Schedule of impacts of reasonably possible changes in significant Level 3 assumptions |
The impacts on a post-tax basis of reasonably possible changes in significant assumptions used in valuing assets and liabilities classified within level 3 of the fair value hierarchy are as follows: | | | | | | | | | | | | | | | | | | | | | | | | | | | | Financing derivatives | | Commodity contract derivatives | | Other | | Six months ended 30 September | 2023 | 2022 | | 2023 | 2022 | | 2023 | 2022 | | £m | £m | | £m | £m | | £m | £m | | 10% increase in commodity prices | — | | — | | | 15 | | 35 | | | — | | — | | | 10% decrease in commodity prices | — | | — | | | (15) | | (36) | | | — | | — | | | +10% market area price change | — | | — | | | 12 | | 7 | | | — | | — | | | -10% market area price change | — | | — | | | (11) | | (7) | | | — | | — | | +20 basis point increase in Limited Price Index
(LPI) market curve | (38) | | (51) | | | — | | — | | | — | | — | | | -20 basis point decrease in LPI market curve | 38 | | 51 | | | — | | — | | | — | | — | | | +20 basis point increase between Retail Price Index (RPI) and Consumer Price Index (CPI) | 36 | | 17 | | | — | | — | | | — | | — | | | -20 basis point decrease between RPI and CPI market curves | (33) | | (16) | | | — | | — | | | — | | — | | | +50 basis points change in discount rate | — | | — | | | — | | — | | | (8) | | (9) | | | -50 basis points change in discount rate | — | | — | | | — | | — | | | 9 | | 10 | | | +10% change in venture capital price | — | | — | | | — | | — | | | 30 | | — | | | -10% change in venture capital price | — | | — | | | — | | — | | | (30) | | — | |
|
| X |
- DefinitionThe disclosure of the fair value measurement of assets. Reference 1: http://www.xbrl.org/2003/role/disclosureRef
-Name IFRS
-Number 13
-IssueDate 2022-03-24
-Paragraph 93
-URI https://taxonomy.ifrs.org/xifrs-link?type=IFRS&num=13&code=ifrs-tx-2022-en-r&anchor=para_93&doctype=Standard
-URIDate 2022-03-24
| Name: |
ifrs-full_DisclosureOfFairValueMeasurementOfAssetsExplanatory |
| Namespace Prefix: |
ifrs-full_ |
| Data Type: |
dtr-types:textBlockItemType |
| Balance Type: |
na |
| Period Type: |
duration |
|
| X |
- DefinitionThe disclosure of the fair value measurement of liabilities. Reference 1: http://www.xbrl.org/2003/role/disclosureRef
-Name IFRS
-Number 13
-IssueDate 2022-03-24
-Paragraph 93
-URI https://taxonomy.ifrs.org/xifrs-link?type=IFRS&num=13&code=ifrs-tx-2022-en-r&anchor=para_93&doctype=Standard
-URIDate 2022-03-24
| Name: |
ifrs-full_DisclosureOfFairValueMeasurementOfLiabilitiesExplanatory |
| Namespace Prefix: |
ifrs-full_ |
| Data Type: |
dtr-types:textBlockItemType |
| Balance Type: |
na |
| Period Type: |
duration |
|
| X |
- DefinitionThe disclosure of the sensitivity analysis for types of market risk to which the entity is exposed, showing how profit or loss and equity would have been affected by changes in the relevant risk variable that were reasonably possible at that date. [Refer: Market risk [member]] Reference 1: http://www.xbrl.org/2003/role/disclosureRef
-Name IFRS
-Number 7
-IssueDate 2022-03-24
-Paragraph 40
-Subparagraph a
-URI https://taxonomy.ifrs.org/xifrs-link?type=IFRS&num=7&code=ifrs-tx-2022-en-r&anchor=para_40_a&doctype=Standard
-URIDate 2022-03-24
| Name: |
ifrs-full_SensitivityAnalysisForEachTypeOfMarketRisk |
| Namespace Prefix: |
ifrs-full_ |
| Data Type: |
dtr-types:textBlockItemType |
| Balance Type: |
na |
| Period Type: |
duration |
|
| X |
- DefinitionFair Value Measurement [Abstract]
| Name: |
nggtf_FairValueMeasurementAbstract |
| Namespace Prefix: |
nggtf_ |
| Data Type: |
xbrli:stringItemType |
| Balance Type: |
na |
| Period Type: |
duration |
|
v3.23.3
Net debt (Tables)
|
6 Months Ended |
Sep. 30, 2023 |
|---|
| Subclassifications of assets, liabilities and equities [abstract] |
|
| Schedule of components of net debt |
Net debt is comprised as follows: | | | | | | | | | | 30 September 2023 | 31 March 2023 | | £m | £m | | Cash and cash equivalents | 227 | | 163 | | | Current financial investments | 1,680 | | 2,605 | | | Borrowings and bank overdrafts | (44,797) | | (42,985) | | Financing derivatives1 | (985) | | (756) | | | Net debt (net of related derivative financial instruments) | (43,875) | | (40,973) | |
1.Includes £4 million liability (31 March 2023: £4 million liability) in relation to the hedging of capital expenditure. The cash flows related to these derivatives are included within investing activities in the consolidated cash flow statement which is in the same manner as the transactions which are the subject of the hedges. The financing derivatives balance included in net debt exclude the commodity derivatives.
|
| Schedule of balance sheet allocation of derivative balances |
The following table splits out the total derivative balances on the face of the consolidated statement of financial position by category: | | | | | | | | | | | | | | | | | | | | | | | | | 30 September 2023 | | 31 March 2023 | | Assets
£m | Liabilities
£m | Total
£m | | Assets
£m | Liabilities
£m | Total
£m | | Financing derivatives | 329 | | (1,314) | | (985) | | | 363 | | (1,119) | | (756) | | | Commodity contract derivatives | 56 | | (123) | | (67) | | | 66 | | (174) | | (108) | | | Total derivative financial instruments | 385 | | (1,437) | | (1,052) | | | 429 | | (1,293) | | (864) | |
|
| X |
- References
+ Details
| Name: |
ifrs-full_SubclassificationsOfAssetsLiabilitiesAndEquitiesAbstract |
| Namespace Prefix: |
ifrs-full_ |
| Data Type: |
xbrli:stringItemType |
| Balance Type: |
na |
| Period Type: |
duration |
|
| X |
- DefinitionBalance Sheet Allocation of Derivative Balances [Table Text Block]
| Name: |
nggtf_ScheduleOfBalanceSheetAllocationOfDerivativeBalancesTableTextBlock |
| Namespace Prefix: |
nggtf_ |
| Data Type: |
dtr-types:textBlockItemType |
| Balance Type: |
na |
| Period Type: |
duration |
|
| X |
- DefinitionSchedule Of Components Of Net Debt [Table Text Block]
| Name: |
nggtf_ScheduleOfComponentsOfNetDebtTableTextBlock |
| Namespace Prefix: |
nggtf_ |
| Data Type: |
dtr-types:textBlockItemType |
| Balance Type: |
na |
| Period Type: |
duration |
|
v3.23.3
Pensions and other post-retirement benefit obligations (Tables)
|
6 Months Ended |
Sep. 30, 2023 |
|---|
| Employee Benefits [Abstract] |
|
| Schedule of defined benefit plan recognised in balance sheet |
| | | | | | | | | | 30 September 2023 | 31 March 2023 | | £m | £m | | Present value of funded obligations | (17,502) | | (18,934) | | | Fair value of plan assets | 19,570 | | 21,246 | | | 2,068 | | 2,312 | | | Present value of unfunded obligations | (264) | | (292) | | | Other post-employment liabilities | (67) | | (69) | | | Net defined benefit asset | 1,737 | | 1,951 | | | Presented in consolidated statement of financial position: | | | | Assets | 2,352 | | 2,645 | | | Liabilities | (615) | | (694) | | | 1,737 | | 1,951 | |
|
| Schedule of key actuarial assumptions |
| | | | | | | | | | Key actuarial assumptions | 30 September 2023 | 31 March 2023 | | Discount rate – UK past service | 5.55 | % | 4.80 | % | | Discount rate – US | 5.70 | % | 4.85 | % | | Rate of increase in RPI – UK past service | 3.19 | % | 3.17 | % |
|
| X |
- DefinitionThe disclosure of defined benefit plans. [Refer: Defined benefit plans [member]] Reference 1: http://www.xbrl.org/2003/role/disclosureRef
-Name IAS
-Number 19
-IssueDate 2022-03-24
-Paragraph 138
-URI https://taxonomy.ifrs.org/xifrs-link?type=IAS&num=19&code=ifrs-tx-2022-en-r&anchor=para_138&doctype=Standard
-URIDate 2022-03-24
| Name: |
ifrs-full_DisclosureOfDefinedBenefitPlansExplanatory |
| Namespace Prefix: |
ifrs-full_ |
| Data Type: |
dtr-types:textBlockItemType |
| Balance Type: |
na |
| Period Type: |
duration |
|
| X |
- DefinitionDisclosure Of Defined Benefit Plan Recognised In Statement Of Financial Performance Explanatory [Table Text Block]
| Name: |
nggtf_DisclosureOfDefinedBenefitPlanRecognisedInStatementOfFinancialPerformanceExplanatoryTableTextBlock |
| Namespace Prefix: |
nggtf_ |
| Data Type: |
dtr-types:textBlockItemType |
| Balance Type: |
na |
| Period Type: |
duration |
|
| X |
- DefinitionEmployee Benefits [Abstract]
| Name: |
nggtf_EmployeeBenefitsAbstract |
| Namespace Prefix: |
nggtf_ |
| Data Type: |
xbrli:stringItemType |
| Balance Type: |
na |
| Period Type: |
duration |
|
v3.23.3
| X |
- References
+ Details
| Name: |
ifrs-full_ForeignExchangeRatesAbstract |
| Namespace Prefix: |
ifrs-full_ |
| Data Type: |
xbrli:stringItemType |
| Balance Type: |
na |
| Period Type: |
duration |
|
| X |
- DefinitionSchedule of Average and Closing Foreign Exchange Rates [Table Text Block]
| Name: |
nggtf_ScheduleOfAverageAndClosingForeignExchangeRatesTableTextBlock |
| Namespace Prefix: |
nggtf_ |
| Data Type: |
dtr-types:textBlockItemType |
| Balance Type: |
na |
| Period Type: |
duration |
|
v3.23.3
Additional disclosures in respect of guaranteed securities (Tables)
|
6 Months Ended |
Sep. 30, 2023 |
|---|
| Seperate Financial Statements [Abstract] |
|
| Disclosure of Combined Statement of Financial Position |
| | | | | | | National Grid plc and Niagara Mohawk Power Corporation combined
£m | | Combined statement of financial position | | | Non-current loans to other subsidiaries | 126 | | | Non-current assets | 12,033 | | | Current loans to other subsidiaries | 15,557 | | | Current assets | 1,526 | | | Current loans from other subsidiaries | (6,893) | | | Current liabilities | (1,263) | | | Non-current loans from other subsidiaries | (2,080) | | | Non-current liabilities | (13,703) | | | Net assets¹ | 5,303 | | | Equity | 5,303 | | | | | Combined income statement – continuing operations | | | Revenue | 1,594 | | | Operating costs | (1,330) | | | Operating profit | 264 | | | Other income from other subsidiaries | — | | | Other income and costs, including taxation | (51) | | | Profit after tax | 213 | |
1.Excluded from net assets above are investments in other consolidated subsidiaries with a carrying value of £14,480 million.
|
| Disclosure of Combined Income Statement |
| | | | | | | National Grid plc and Niagara Mohawk Power Corporation combined
£m | | Combined statement of financial position | | | Non-current loans to other subsidiaries | 126 | | | Non-current assets | 12,033 | | | Current loans to other subsidiaries | 15,557 | | | Current assets | 1,526 | | | Current loans from other subsidiaries | (6,893) | | | Current liabilities | (1,263) | | | Non-current loans from other subsidiaries | (2,080) | | | Non-current liabilities | (13,703) | | | Net assets¹ | 5,303 | | | Equity | 5,303 | | | | | Combined income statement – continuing operations | | | Revenue | 1,594 | | | Operating costs | (1,330) | | | Operating profit | 264 | | | Other income from other subsidiaries | — | | | Other income and costs, including taxation | (51) | | | Profit after tax | 213 | |
1.Excluded from net assets above are investments in other consolidated subsidiaries with a carrying value of £14,480 million.
|
| X |
- DefinitionSeperate Financial Statements [Abstract]
| Name: |
nggtf_SeperateFinancialStatementsAbstract |
| Namespace Prefix: |
nggtf_ |
| Data Type: |
xbrli:stringItemType |
| Balance Type: |
na |
| Period Type: |
duration |
|
| X |
- DefinitionTabular disclosure of condensed balance sheet, including, but not limited to, balance sheets of consolidated entities and consolidation eliminations. Reference 1: http://www.xbrl.org/2009/role/commonPracticeRef
-Publisher SEC
-Name Regulation S-X (SX)
-Number 210
-Section 12
-Paragraph (a)
-Subsection 04
| Name: |
srt_ScheduleOfCondensedBalanceSheetTableTextBlock |
| Namespace Prefix: |
srt_ |
| Data Type: |
dtr-types:textBlockItemType |
| Balance Type: |
na |
| Period Type: |
duration |
|
| X |
- DefinitionTabular disclosure of condensed income statement, including, but not limited to, income statements of consolidated entities and consolidation eliminations. Reference 1: http://www.xbrl.org/2009/role/commonPracticeRef
-Publisher SEC
-Name Regulation S-X (SX)
-Number 210
-Section 12
-Paragraph (a)
-Subsection 04
| Name: |
srt_ScheduleOfCondensedIncomeStatementTableTextBlock |
| Namespace Prefix: |
srt_ |
| Data Type: |
dtr-types:textBlockItemType |
| Balance Type: |
na |
| Period Type: |
duration |
|
v3.23.3
| X |
- DefinitionThe nominal or face amount of a financial instrument, used to calculate payments made on that instrument. Reference 1: http://www.xbrl.org/2009/role/commonPracticeRef
-Name IAS
-Number 1
-IssueDate 2022-03-24
-Paragraph 112
-Subparagraph c
-URI https://taxonomy.ifrs.org/xifrs-link?type=IAS&num=1&code=ifrs-tx-2022-en-r&anchor=para_112_c&doctype=Standard
-URIDate 2022-03-24
| Name: |
ifrs-full_NotionalAmount |
| Namespace Prefix: |
ifrs-full_ |
| Data Type: |
xbrli:monetaryItemType |
| Balance Type: |
na |
| Period Type: |
instant |
|
| X |
- DefinitionThe proportion of ownership interest in an associate attributable to the entity. [Refer: Associates [member]] Reference 1: http://www.xbrl.org/2003/role/disclosureRef
-Name IAS
-Number 27
-IssueDate 2022-03-24
-Paragraph 17
-Subparagraph b
-Clause iii
-URI https://taxonomy.ifrs.org/xifrs-link?type=IAS&num=27&code=ifrs-tx-2022-en-r&anchor=para_17_b_iii&doctype=Standard
-URIDate 2022-03-24
Reference 2: http://www.xbrl.org/2003/role/disclosureRef
-Name IAS
-Number 27
-IssueDate 2022-03-24
-Paragraph 16
-Subparagraph b
-Clause iii
-URI https://taxonomy.ifrs.org/xifrs-link?type=IAS&num=27&code=ifrs-tx-2022-en-r&anchor=para_16_b_iii&doctype=Standard
-URIDate 2022-03-24
Reference 3: http://www.xbrl.org/2003/role/disclosureRef
-Name IFRS
-Number 12
-IssueDate 2022-03-24
-Paragraph 21
-Subparagraph a
-Clause iv
-URI https://taxonomy.ifrs.org/xifrs-link?type=IFRS&num=12&code=ifrs-tx-2022-en-r&anchor=para_21_a_iv&doctype=Standard
-URIDate 2022-03-24
| Name: |
ifrs-full_ProportionOfOwnershipInterestInAssociate |
| Namespace Prefix: |
ifrs-full_ |
| Data Type: |
dtr-types:percentItemType |
| Balance Type: |
na |
| Period Type: |
duration |
|
| X |
- DefinitionThe amount of undrawn borrowing facilities that may be available for future operating activities and to settle capital commitments. [Refer: Capital commitments] Reference 1: http://www.xbrl.org/2003/role/exampleRef
-Name IAS
-Number 7
-IssueDate 2022-03-24
-Paragraph 50
-Subparagraph a
-URI https://taxonomy.ifrs.org/xifrs-link?type=IAS&num=7&code=ifrs-tx-2022-en-r&anchor=para_50_a&doctype=Standard
-URIDate 2022-03-24
| Name: |
ifrs-full_UndrawnBorrowingFacilities |
| Namespace Prefix: |
ifrs-full_ |
| Data Type: |
xbrli:monetaryItemType |
| Balance Type: |
credit |
| Period Type: |
instant |
|
| X |
- Details
| Name: |
ifrs-full_SignificantInvestmentsInAssociatesAxis=nggtf_GasTTopCoLimitedMember |
| Namespace Prefix: |
|
| Data Type: |
na |
| Balance Type: |
|
| Period Type: |
|
|
| X |
- Details
| Name: |
ifrs-full_BorrowingsByNameAxis=nggtf_FixedInterestRateBondsMember |
| Namespace Prefix: |
|
| Data Type: |
na |
| Balance Type: |
|
| Period Type: |
|
|
v3.23.3
| X |
- References
+ Details
| Name: |
ifrs-full_DisclosureOfOperatingSegmentsAbstract |
| Namespace Prefix: |
ifrs-full_ |
| Data Type: |
xbrli:stringItemType |
| Balance Type: |
na |
| Period Type: |
duration |
|
| X |
- DefinitionNumber Of Reportable Operating Segments
| Name: |
nggtf_NumberOfReportableOperatingSegments |
| Namespace Prefix: |
nggtf_ |
| Data Type: |
xbrli:integerItemType |
| Balance Type: |
na |
| Period Type: |
instant |
|
v3.23.3
Segmental analysis - Schedule of revenue by segment (Details) - GBP (£)
£ in Millions |
6 Months Ended |
Sep. 30, 2023 |
Sep. 30, 2022 |
| Disclosure of operating segments [line items] |
|
|
|
| Total revenue from continuing operations |
£ 8,489
|
£ 9,444
|
[1] |
| UK |
|
|
|
| Disclosure of operating segments [line items] |
|
|
|
| Total revenue from continuing operations |
4,309
|
4,589
|
|
| US |
|
|
|
| Disclosure of operating segments [line items] |
|
|
|
| Total revenue from continuing operations |
4,180
|
4,855
|
|
| UK Electricity Transmission |
|
|
|
| Disclosure of operating segments [line items] |
|
|
|
| Total revenue from continuing operations |
1,337
|
955
|
|
| UK Electricity Distribution |
|
|
|
| Disclosure of operating segments [line items] |
|
|
|
| Total revenue from continuing operations |
848
|
997
|
|
| UK Electricity System Operator |
|
|
|
| Disclosure of operating segments [line items] |
|
|
|
| Total revenue from continuing operations |
1,717
|
2,045
|
|
| New England |
|
|
|
| Disclosure of operating segments [line items] |
|
|
|
| Total revenue from continuing operations |
1,441
|
1,760
|
|
| New York |
|
|
|
| Disclosure of operating segments [line items] |
|
|
|
| Total revenue from continuing operations |
2,365
|
2,758
|
|
| National Grid Ventures |
|
|
|
| Disclosure of operating segments [line items] |
|
|
|
| Total revenue from continuing operations |
639
|
676
|
|
| Other |
|
|
|
| Disclosure of operating segments [line items] |
|
|
|
| Total revenue from continuing operations |
142
|
253
|
|
| Operating segments |
|
|
|
| Disclosure of operating segments [line items] |
|
|
|
| Total revenue from continuing operations |
8,554
|
9,490
|
|
| Operating segments | UK Electricity Transmission |
|
|
|
| Disclosure of operating segments [line items] |
|
|
|
| Total revenue from continuing operations |
1,356
|
969
|
|
| Operating segments | UK Electricity Distribution |
|
|
|
| Disclosure of operating segments [line items] |
|
|
|
| Total revenue from continuing operations |
850
|
1,005
|
|
| Operating segments | UK Electricity System Operator |
|
|
|
| Disclosure of operating segments [line items] |
|
|
|
| Total revenue from continuing operations |
1,734
|
2,060
|
|
| Operating segments | New England |
|
|
|
| Disclosure of operating segments [line items] |
|
|
|
| Total revenue from continuing operations |
1,441
|
1,760
|
|
| Operating segments | New York |
|
|
|
| Disclosure of operating segments [line items] |
|
|
|
| Total revenue from continuing operations |
2,365
|
2,758
|
|
| Operating segments | National Grid Ventures |
|
|
|
| Disclosure of operating segments [line items] |
|
|
|
| Total revenue from continuing operations |
666
|
685
|
|
| Operating segments | Other |
|
|
|
| Disclosure of operating segments [line items] |
|
|
|
| Total revenue from continuing operations |
142
|
253
|
|
| Sales between segments |
|
|
|
| Disclosure of operating segments [line items] |
|
|
|
| Total revenue from continuing operations |
(65)
|
(46)
|
|
| Sales between segments | UK Electricity Transmission |
|
|
|
| Disclosure of operating segments [line items] |
|
|
|
| Total revenue from continuing operations |
(19)
|
(14)
|
|
| Sales between segments | UK Electricity Distribution |
|
|
|
| Disclosure of operating segments [line items] |
|
|
|
| Total revenue from continuing operations |
(2)
|
(8)
|
|
| Sales between segments | UK Electricity System Operator |
|
|
|
| Disclosure of operating segments [line items] |
|
|
|
| Total revenue from continuing operations |
(17)
|
(15)
|
|
| Sales between segments | New England |
|
|
|
| Disclosure of operating segments [line items] |
|
|
|
| Total revenue from continuing operations |
0
|
0
|
|
| Sales between segments | New York |
|
|
|
| Disclosure of operating segments [line items] |
|
|
|
| Total revenue from continuing operations |
0
|
0
|
|
| Sales between segments | National Grid Ventures |
|
|
|
| Disclosure of operating segments [line items] |
|
|
|
| Total revenue from continuing operations |
(27)
|
(9)
|
|
| Sales between segments | Other |
|
|
|
| Disclosure of operating segments [line items] |
|
|
|
| Total revenue from continuing operations |
£ 0
|
£ 0
|
|
|
|
| X |
- DefinitionLine items represent concepts included in a table. These concepts are used to disclose reportable information associated with members defined in one or many axes of the table.
| Name: |
ifrs-full_DisclosureOfOperatingSegmentsLineItems |
| Namespace Prefix: |
ifrs-full_ |
| Data Type: |
xbrli:stringItemType |
| Balance Type: |
na |
| Period Type: |
duration |
|
| X |
- DefinitionThe income arising in the course of an entity's ordinary activities. Income is increases in assets, or decreases in liabilities, that result in increases in equity, other than those relating to contributions from holders of equity claims. Reference 1: http://www.xbrl.org/2003/role/disclosureRef
-Name IFRS
-Number 8
-IssueDate 2022-03-24
-Paragraph 28
-Subparagraph a
-URI https://taxonomy.ifrs.org/xifrs-link?type=IFRS&num=8&code=ifrs-tx-2022-en-r&anchor=para_28_a&doctype=Standard
-URIDate 2022-03-24
Reference 2: http://www.xbrl.org/2003/role/disclosureRef
-Name IFRS
-Number 8
-IssueDate 2022-03-24
-Paragraph 23
-Subparagraph a
-URI https://taxonomy.ifrs.org/xifrs-link?type=IFRS&num=8&code=ifrs-tx-2022-en-r&anchor=para_23_a&doctype=Standard
-URIDate 2022-03-24
Reference 3: http://www.xbrl.org/2003/role/disclosureRef
-Name IFRS
-Number 8
-IssueDate 2022-03-24
-Paragraph 32
-URI https://taxonomy.ifrs.org/xifrs-link?type=IFRS&num=8&code=ifrs-tx-2022-en-r&anchor=para_32&doctype=Standard
-URIDate 2022-03-24
Reference 4: http://www.xbrl.org/2003/role/disclosureRef
-Name IFRS
-Number 8
-IssueDate 2022-03-24
-Paragraph 33
-Subparagraph a
-URI https://taxonomy.ifrs.org/xifrs-link?type=IFRS&num=8&code=ifrs-tx-2022-en-r&anchor=para_33_a&doctype=Standard
-URIDate 2022-03-24
Reference 5: http://www.xbrl.org/2003/role/disclosureRef
-Name IFRS
-Number 8
-IssueDate 2022-03-24
-Paragraph 34
-URI https://taxonomy.ifrs.org/xifrs-link?type=IFRS&num=8&code=ifrs-tx-2022-en-r&anchor=para_34&doctype=Standard
-URIDate 2022-03-24
Reference 6: http://www.xbrl.org/2003/role/disclosureRef
-Name IFRS
-Number 5
-IssueDate 2022-03-24
-Paragraph 33
-Subparagraph b
-Clause i
-URI https://taxonomy.ifrs.org/xifrs-link?type=IFRS&num=5&code=ifrs-tx-2022-en-r&anchor=para_33_b_i&doctype=Standard
-URIDate 2022-03-24
Reference 7: http://www.xbrl.org/2003/role/disclosureRef
-Name IFRS
-Number 12
-IssueDate 2022-03-24
-Paragraph B12
-Subparagraph b
-Clause v
-URI https://taxonomy.ifrs.org/xifrs-link?type=IFRS&num=12&code=ifrs-tx-2022-en-r&anchor=para_B12_b_v&doctype=Appendix&subtype=B
-URIDate 2022-03-24
Reference 8: http://www.xbrl.org/2003/role/exampleRef
-Name IFRS
-Number 12
-IssueDate 2022-03-24
-Paragraph B10
-Subparagraph b
-URI https://taxonomy.ifrs.org/xifrs-link?type=IFRS&num=12&code=ifrs-tx-2022-en-r&anchor=para_B10_b&doctype=Appendix&subtype=B
-URIDate 2022-03-24
Reference 9: http://www.xbrl.org/2003/role/disclosureRef
-Name IAS
-Number 1
-IssueDate 2022-03-24
-Paragraph 82
-Subparagraph a
-URI https://taxonomy.ifrs.org/xifrs-link?type=IAS&num=1&code=ifrs-tx-2022-en-r&anchor=para_82_a&doctype=Standard
-URIDate 2022-03-24
Reference 10: http://www.xbrl.org/2003/role/exampleRef
-Name IAS
-Number 1
-IssueDate 2022-03-24
-Paragraph 103
-URI https://taxonomy.ifrs.org/xifrs-link?type=IAS&num=1&code=ifrs-tx-2022-en-r&anchor=para_103&doctype=Standard
-URIDate 2022-03-24
Reference 11: http://www.xbrl.org/2003/role/exampleRef
-Name IAS
-Number 1
-IssueDate 2022-03-24
-Paragraph 102
-URI https://taxonomy.ifrs.org/xifrs-link?type=IAS&num=1&code=ifrs-tx-2022-en-r&anchor=para_102&doctype=Standard
-URIDate 2022-03-24
| Name: |
ifrs-full_Revenue |
| Namespace Prefix: |
ifrs-full_ |
| Data Type: |
xbrli:monetaryItemType |
| Balance Type: |
credit |
| Period Type: |
duration |
|
| X |
- Details
| Name: |
ifrs-full_GeographicalAreasAxis=ifrs-full_CountryOfDomicileMember |
| Namespace Prefix: |
|
| Data Type: |
na |
| Balance Type: |
|
| Period Type: |
|
|
| X |
- Details
| Name: |
ifrs-full_GeographicalAreasAxis=country_US |
| Namespace Prefix: |
|
| Data Type: |
na |
| Balance Type: |
|
| Period Type: |
|
|
| X |
- Details
| Name: |
ifrs-full_SegmentsAxis=nggtf_UKElectricityTransmissionMember |
| Namespace Prefix: |
|
| Data Type: |
na |
| Balance Type: |
|
| Period Type: |
|
|
| X |
- Details
| Name: |
ifrs-full_SegmentsAxis=nggtf_UKElectricityDistributionMember |
| Namespace Prefix: |
|
| Data Type: |
na |
| Balance Type: |
|
| Period Type: |
|
|
| X |
- Details
| Name: |
ifrs-full_SegmentsAxis=nggtf_UKElectricitySystemOperatorMember |
| Namespace Prefix: |
|
| Data Type: |
na |
| Balance Type: |
|
| Period Type: |
|
|
| X |
- Details
| Name: |
ifrs-full_SegmentsAxis=nggtf_NewEnglandMember |
| Namespace Prefix: |
|
| Data Type: |
na |
| Balance Type: |
|
| Period Type: |
|
|
| X |
- Details
| Name: |
ifrs-full_SegmentsAxis=nggtf_NewYorkSegmentMember |
| Namespace Prefix: |
|
| Data Type: |
na |
| Balance Type: |
|
| Period Type: |
|
|
| X |
- Details
| Name: |
ifrs-full_SegmentsAxis=nggtf_NationalGridVenturesMember |
| Namespace Prefix: |
|
| Data Type: |
na |
| Balance Type: |
|
| Period Type: |
|
|
| X |
- Details
| Name: |
ifrs-full_SegmentsAxis=nggtf_OtherSegmentsMember |
| Namespace Prefix: |
|
| Data Type: |
na |
| Balance Type: |
|
| Period Type: |
|
|
| X |
- Details
| Name: |
ifrs-full_SegmentConsolidationItemsAxis=ifrs-full_OperatingSegmentsMember |
| Namespace Prefix: |
|
| Data Type: |
na |
| Balance Type: |
|
| Period Type: |
|
|
| X |
- Details
| Name: |
ifrs-full_SegmentConsolidationItemsAxis=ifrs-full_EliminationOfIntersegmentAmountsMember |
| Namespace Prefix: |
|
| Data Type: |
na |
| Balance Type: |
|
| Period Type: |
|
|
v3.23.3
Segmental analysis - Schedule of operating profit/(loss) by segment (Details) - GBP (£)
£ in Millions |
6 Months Ended |
Sep. 30, 2023 |
Sep. 30, 2022 |
| Disclosure of operating segments [line items] |
|
|
|
| Operating profit from continuing operations |
£ 1,985
|
£ 2,239
|
[1] |
| Share of post-tax results of joint ventures and associates |
71
|
51
|
[1] |
| Finance income |
115
|
37
|
[1] |
| Finance costs |
(800)
|
(661)
|
[1] |
| Profit before tax |
1,371
|
1,666
|
[1] |
| UK |
|
|
|
| Disclosure of operating segments [line items] |
|
|
|
| Operating profit from continuing operations |
2,016
|
1,518
|
|
| US |
|
|
|
| Disclosure of operating segments [line items] |
|
|
|
| Operating profit from continuing operations |
(31)
|
721
|
|
| Operating segments | UK Electricity Transmission |
|
|
|
| Disclosure of operating segments [line items] |
|
|
|
| Operating profit from continuing operations |
838
|
493
|
|
| Operating segments | UK Electricity Distribution |
|
|
|
| Disclosure of operating segments [line items] |
|
|
|
| Operating profit from continuing operations |
472
|
522
|
|
| Operating segments | UK Electricity System Operator |
|
|
|
| Disclosure of operating segments [line items] |
|
|
|
| Operating profit from continuing operations |
443
|
146
|
|
| Operating segments | New England |
|
|
|
| Disclosure of operating segments [line items] |
|
|
|
| Operating profit from continuing operations |
(47)
|
720
|
|
| Operating segments | New York |
|
|
|
| Disclosure of operating segments [line items] |
|
|
|
| Operating profit from continuing operations |
8
|
(26)
|
|
| Operating segments | National Grid Ventures |
|
|
|
| Disclosure of operating segments [line items] |
|
|
|
| Operating profit from continuing operations |
310
|
308
|
|
| Operating segments | Other |
|
|
|
| Disclosure of operating segments [line items] |
|
|
|
| Operating profit from continuing operations |
(39)
|
76
|
|
| Before exceptional items and remeasurements |
|
|
|
| Disclosure of operating segments [line items] |
|
|
|
| Operating profit from continuing operations |
1,902
|
1,756
|
|
| Share of post-tax results of joint ventures and associates |
59
|
70
|
|
| Finance income |
123
|
69
|
|
| Finance costs |
(834)
|
(801)
|
|
| Profit before tax |
1,250
|
1,094
|
|
| Before exceptional items and remeasurements | UK |
|
|
|
| Disclosure of operating segments [line items] |
|
|
|
| Operating profit from continuing operations |
1,956
|
1,550
|
|
| Before exceptional items and remeasurements | US |
|
|
|
| Disclosure of operating segments [line items] |
|
|
|
| Operating profit from continuing operations |
(54)
|
206
|
|
| Before exceptional items and remeasurements | Operating segments | UK Electricity Transmission |
|
|
|
| Disclosure of operating segments [line items] |
|
|
|
| Operating profit from continuing operations |
839
|
499
|
|
| Before exceptional items and remeasurements | Operating segments | UK Electricity Distribution |
|
|
|
| Disclosure of operating segments [line items] |
|
|
|
| Operating profit from continuing operations |
476
|
531
|
|
| Before exceptional items and remeasurements | Operating segments | UK Electricity System Operator |
|
|
|
| Disclosure of operating segments [line items] |
|
|
|
| Operating profit from continuing operations |
443
|
147
|
|
| Before exceptional items and remeasurements | Operating segments | New England |
|
|
|
| Disclosure of operating segments [line items] |
|
|
|
| Operating profit from continuing operations |
(32)
|
193
|
|
| Before exceptional items and remeasurements | Operating segments | New York |
|
|
|
| Disclosure of operating segments [line items] |
|
|
|
| Operating profit from continuing operations |
(30)
|
(18)
|
|
| Before exceptional items and remeasurements | Operating segments | National Grid Ventures |
|
|
|
| Disclosure of operating segments [line items] |
|
|
|
| Operating profit from continuing operations |
219
|
259
|
|
| Before exceptional items and remeasurements | Operating segments | Other |
|
|
|
| Disclosure of operating segments [line items] |
|
|
|
| Operating profit from continuing operations |
(13)
|
145
|
|
| Exceptional items and remeasurements (see note 4) |
|
|
|
| Disclosure of operating segments [line items] |
|
|
|
| Operating profit from continuing operations |
83
|
483
|
|
| Share of post-tax results of joint ventures and associates |
12
|
(19)
|
|
| Finance income |
(8)
|
(32)
|
|
| Finance costs |
34
|
140
|
|
| Profit before tax |
121
|
572
|
|
| Exceptional items and remeasurements (see note 4) | UK |
|
|
|
| Disclosure of operating segments [line items] |
|
|
|
| Operating profit from continuing operations |
60
|
(32)
|
|
| Exceptional items and remeasurements (see note 4) | US |
|
|
|
| Disclosure of operating segments [line items] |
|
|
|
| Operating profit from continuing operations |
23
|
515
|
|
| Exceptional items and remeasurements (see note 4) | Operating segments | UK Electricity Transmission |
|
|
|
| Disclosure of operating segments [line items] |
|
|
|
| Operating profit from continuing operations |
(1)
|
(6)
|
|
| Exceptional items and remeasurements (see note 4) | Operating segments | UK Electricity Distribution |
|
|
|
| Disclosure of operating segments [line items] |
|
|
|
| Operating profit from continuing operations |
(4)
|
(9)
|
|
| Exceptional items and remeasurements (see note 4) | Operating segments | UK Electricity System Operator |
|
|
|
| Disclosure of operating segments [line items] |
|
|
|
| Operating profit from continuing operations |
0
|
(1)
|
|
| Exceptional items and remeasurements (see note 4) | Operating segments | New England |
|
|
|
| Disclosure of operating segments [line items] |
|
|
|
| Operating profit from continuing operations |
(15)
|
527
|
|
| Exceptional items and remeasurements (see note 4) | Operating segments | New York |
|
|
|
| Disclosure of operating segments [line items] |
|
|
|
| Operating profit from continuing operations |
38
|
(8)
|
|
| Exceptional items and remeasurements (see note 4) | Operating segments | National Grid Ventures |
|
|
|
| Disclosure of operating segments [line items] |
|
|
|
| Operating profit from continuing operations |
91
|
49
|
|
| Exceptional items and remeasurements (see note 4) | Operating segments | Other |
|
|
|
| Disclosure of operating segments [line items] |
|
|
|
| Operating profit from continuing operations |
£ (26)
|
£ (69)
|
|
|
|
| X |
- DefinitionLine items represent concepts included in a table. These concepts are used to disclose reportable information associated with members defined in one or many axes of the table.
| Name: |
ifrs-full_DisclosureOfOperatingSegmentsLineItems |
| Namespace Prefix: |
ifrs-full_ |
| Data Type: |
xbrli:stringItemType |
| Balance Type: |
na |
| Period Type: |
duration |
|
| X |
- DefinitionThe amount of costs associated with financing activities of the entity. Reference 1: http://www.xbrl.org/2003/role/disclosureRef
-Name IAS
-Number 1
-IssueDate 2022-03-24
-Paragraph 82
-Subparagraph b
-URI https://taxonomy.ifrs.org/xifrs-link?type=IAS&num=1&code=ifrs-tx-2022-en-r&anchor=para_82_b&doctype=Standard
-URIDate 2022-03-24
| Name: |
ifrs-full_FinanceCosts |
| Namespace Prefix: |
ifrs-full_ |
| Data Type: |
xbrli:monetaryItemType |
| Balance Type: |
debit |
| Period Type: |
duration |
|
| X |
- DefinitionThe amount of income associated with interest and other financing activities of the entity. Reference 1: http://www.xbrl.org/2009/role/commonPracticeRef
-Name IAS
-Number 1
-IssueDate 2022-03-24
-Paragraph 85
-URI https://taxonomy.ifrs.org/xifrs-link?type=IAS&num=1&code=ifrs-tx-2022-en-r&anchor=para_85&doctype=Standard
-URIDate 2022-03-24
| Name: |
ifrs-full_FinanceIncome |
| Namespace Prefix: |
ifrs-full_ |
| Data Type: |
xbrli:monetaryItemType |
| Balance Type: |
credit |
| Period Type: |
duration |
|
| X |
- DefinitionThe profit (loss) before tax expense or income. [Refer: Profit (loss)] Reference 1: http://www.xbrl.org/2003/role/exampleRef
-Name IFRS
-Number 8
-IssueDate 2022-03-24
-Paragraph 28
-Subparagraph b
-URI https://taxonomy.ifrs.org/xifrs-link?type=IFRS&num=8&code=ifrs-tx-2022-en-r&anchor=para_28_b&doctype=Standard
-URIDate 2022-03-24
Reference 2: http://www.xbrl.org/2003/role/exampleRef
-Name IFRS
-Number 8
-IssueDate 2022-03-24
-Paragraph 23
-URI https://taxonomy.ifrs.org/xifrs-link?type=IFRS&num=8&code=ifrs-tx-2022-en-r&anchor=para_23&doctype=Standard
-URIDate 2022-03-24
Reference 3: http://www.xbrl.org/2003/role/disclosureRef
-Name IFRS
-Number 5
-IssueDate 2022-03-24
-Paragraph 33
-Subparagraph b
-Clause i
-URI https://taxonomy.ifrs.org/xifrs-link?type=IFRS&num=5&code=ifrs-tx-2022-en-r&anchor=para_33_b_i&doctype=Standard
-URIDate 2022-03-24
Reference 4: http://www.xbrl.org/2003/role/exampleRef
-Name IAS
-Number 1
-IssueDate 2022-03-24
-Paragraph 103
-URI https://taxonomy.ifrs.org/xifrs-link?type=IAS&num=1&code=ifrs-tx-2022-en-r&anchor=para_103&doctype=Standard
-URIDate 2022-03-24
Reference 5: http://www.xbrl.org/2003/role/exampleRef
-Name IAS
-Number 1
-IssueDate 2022-03-24
-Paragraph 102
-URI https://taxonomy.ifrs.org/xifrs-link?type=IAS&num=1&code=ifrs-tx-2022-en-r&anchor=para_102&doctype=Standard
-URIDate 2022-03-24
| Name: |
ifrs-full_ProfitLossBeforeTax |
| Namespace Prefix: |
ifrs-full_ |
| Data Type: |
xbrli:monetaryItemType |
| Balance Type: |
credit |
| Period Type: |
duration |
|
| X |
- DefinitionThe profit (loss) from operating activities of the entity. [Refer: Profit (loss)] Reference 1: http://www.xbrl.org/2003/role/exampleRef
-Name IAS
-Number 32
-IssueDate 2022-03-24
-Paragraph IE33
-URI https://taxonomy.ifrs.org/xifrs-link?type=IAS&num=32&code=ifrs-tx-2022-en-r&anchor=para_IE33&doctype=Illustrative%20Examples
-URIDate 2022-03-24
Reference 2: http://www.xbrl.org/2009/role/commonPracticeRef
-Name IAS
-Number 1
-IssueDate 2022-03-24
-Paragraph 85
-URI https://taxonomy.ifrs.org/xifrs-link?type=IAS&num=1&code=ifrs-tx-2022-en-r&anchor=para_85&doctype=Standard
-URIDate 2022-03-24
| Name: |
ifrs-full_ProfitLossFromOperatingActivities |
| Namespace Prefix: |
ifrs-full_ |
| Data Type: |
xbrli:monetaryItemType |
| Balance Type: |
credit |
| Period Type: |
duration |
|
| X |
- DefinitionThe entity's share of the profit (loss) of associates and joint ventures accounted for using the equity method. [Refer: Associates [member]; Investments accounted for using equity method; Joint ventures [member]; Profit (loss)] Reference 1: http://www.xbrl.org/2003/role/disclosureRef
-Name IFRS
-Number 8
-IssueDate 2022-03-24
-Paragraph 28
-Subparagraph e
-URI https://taxonomy.ifrs.org/xifrs-link?type=IFRS&num=8&code=ifrs-tx-2022-en-r&anchor=para_28_e&doctype=Standard
-URIDate 2022-03-24
Reference 2: http://www.xbrl.org/2003/role/disclosureRef
-Name IFRS
-Number 8
-IssueDate 2022-03-24
-Paragraph 23
-Subparagraph g
-URI https://taxonomy.ifrs.org/xifrs-link?type=IFRS&num=8&code=ifrs-tx-2022-en-r&anchor=para_23_g&doctype=Standard
-URIDate 2022-03-24
Reference 3: http://www.xbrl.org/2003/role/disclosureRef
-Note Effective on first application of IFRS 9
-Name IFRS
-Number 4
-IssueDate 2022-03-24
-Paragraph 39M
-Subparagraph b
-URI https://taxonomy.ifrs.org/xifrs-link?type=IFRS&num=4&code=ifrs-tx-2022-en-b&anchor=para_39M_b&doctype=Standard
-URIDate 2022-03-24
Reference 4: http://www.xbrl.org/2003/role/disclosureRef
-Name IAS
-Number 1
-IssueDate 2022-03-24
-Paragraph 82
-Subparagraph c
-URI https://taxonomy.ifrs.org/xifrs-link?type=IAS&num=1&code=ifrs-tx-2022-en-r&anchor=para_82_c&doctype=Standard
-URIDate 2022-03-24
| Name: |
ifrs-full_ShareOfProfitLossOfAssociatesAndJointVenturesAccountedForUsingEquityMethod |
| Namespace Prefix: |
ifrs-full_ |
| Data Type: |
xbrli:monetaryItemType |
| Balance Type: |
credit |
| Period Type: |
duration |
|
| X |
- Details
| Name: |
ifrs-full_GeographicalAreasAxis=ifrs-full_CountryOfDomicileMember |
| Namespace Prefix: |
|
| Data Type: |
na |
| Balance Type: |
|
| Period Type: |
|
|
| X |
- Details
| Name: |
ifrs-full_GeographicalAreasAxis=country_US |
| Namespace Prefix: |
|
| Data Type: |
na |
| Balance Type: |
|
| Period Type: |
|
|
| X |
- Details
| Name: |
ifrs-full_SegmentConsolidationItemsAxis=ifrs-full_OperatingSegmentsMember |
| Namespace Prefix: |
|
| Data Type: |
na |
| Balance Type: |
|
| Period Type: |
|
|
| X |
- Details
| Name: |
ifrs-full_SegmentsAxis=nggtf_UKElectricityTransmissionMember |
| Namespace Prefix: |
|
| Data Type: |
na |
| Balance Type: |
|
| Period Type: |
|
|
| X |
- Details
| Name: |
ifrs-full_SegmentsAxis=nggtf_UKElectricityDistributionMember |
| Namespace Prefix: |
|
| Data Type: |
na |
| Balance Type: |
|
| Period Type: |
|
|
| X |
- Details
| Name: |
ifrs-full_SegmentsAxis=nggtf_UKElectricitySystemOperatorMember |
| Namespace Prefix: |
|
| Data Type: |
na |
| Balance Type: |
|
| Period Type: |
|
|
| X |
- Details
| Name: |
ifrs-full_SegmentsAxis=nggtf_NewEnglandMember |
| Namespace Prefix: |
|
| Data Type: |
na |
| Balance Type: |
|
| Period Type: |
|
|
| X |
- Details
| Name: |
ifrs-full_SegmentsAxis=nggtf_NewYorkSegmentMember |
| Namespace Prefix: |
|
| Data Type: |
na |
| Balance Type: |
|
| Period Type: |
|
|
| X |
- Details
| Name: |
ifrs-full_SegmentsAxis=nggtf_NationalGridVenturesMember |
| Namespace Prefix: |
|
| Data Type: |
na |
| Balance Type: |
|
| Period Type: |
|
|
| X |
- Details
| Name: |
ifrs-full_SegmentsAxis=nggtf_OtherSegmentsMember |
| Namespace Prefix: |
|
| Data Type: |
na |
| Balance Type: |
|
| Period Type: |
|
|
| X |
- Details
| Name: |
srt_StatementScenarioAxis=nggtf_BeforeExceptionalItemsAndRemeasurementsNettingMember |
| Namespace Prefix: |
|
| Data Type: |
na |
| Balance Type: |
|
| Period Type: |
|
|
| X |
- Details
| Name: |
srt_StatementScenarioAxis=nggtf_ExceptionalItemsAndRemeasurementsNettingMember |
| Namespace Prefix: |
|
| Data Type: |
na |
| Balance Type: |
|
| Period Type: |
|
|
v3.23.3
Segmental analysis - Schedule of capital expenditure by segment (Details) - GBP (£)
£ in Millions |
6 Months Ended |
|
Sep. 30, 2023 |
Sep. 30, 2022 |
Mar. 31, 2023 |
| Disclosure of operating segments [line items] |
|
|
|
| Net book value of property, plant and equipment and other intangible assets |
£ 71,113
|
|
£ 68,037
|
| Capital expenditure |
3,706
|
£ 3,717
|
|
| Depreciation, amortisation and impairment |
(1,021)
|
(932)
|
|
| Operating segments | UK Electricity Transmission |
|
|
|
| Disclosure of operating segments [line items] |
|
|
|
| Net book value of property, plant and equipment and other intangible assets |
16,030
|
|
15,483
|
| Capital expenditure |
800
|
629
|
|
| Depreciation, amortisation and impairment |
(250)
|
(235)
|
|
| Operating segments | UK Electricity Distribution |
|
|
|
| Disclosure of operating segments [line items] |
|
|
|
| Net book value of property, plant and equipment and other intangible assets |
13,940
|
|
13,462
|
| Capital expenditure |
608
|
584
|
|
| Depreciation, amortisation and impairment |
(105)
|
(104)
|
|
| Operating segments | UK Electricity System Operator |
|
|
|
| Disclosure of operating segments [line items] |
|
|
|
| Net book value of property, plant and equipment and other intangible assets |
434
|
|
411
|
| Capital expenditure |
75
|
42
|
|
| Depreciation, amortisation and impairment |
(52)
|
(40)
|
|
| Operating segments | New England |
|
|
|
| Disclosure of operating segments [line items] |
|
|
|
| Net book value of property, plant and equipment and other intangible assets |
13,781
|
|
13,033
|
| Capital expenditure |
789
|
801
|
|
| Depreciation, amortisation and impairment |
(204)
|
(184)
|
|
| Operating segments | New York |
|
|
|
| Disclosure of operating segments [line items] |
|
|
|
| Net book value of property, plant and equipment and other intangible assets |
22,937
|
|
21,730
|
| Capital expenditure |
1,257
|
1,242
|
|
| Depreciation, amortisation and impairment |
(321)
|
(292)
|
|
| Operating segments | National Grid Ventures |
|
|
|
| Disclosure of operating segments [line items] |
|
|
|
| Net book value of property, plant and equipment and other intangible assets |
3,956
|
|
3,880
|
| Capital expenditure |
175
|
410
|
|
| Depreciation, amortisation and impairment |
(84)
|
(73)
|
|
| Operating segments | Other |
|
|
|
| Disclosure of operating segments [line items] |
|
|
|
| Net book value of property, plant and equipment and other intangible assets |
35
|
|
38
|
| Capital expenditure |
2
|
9
|
|
| Depreciation, amortisation and impairment |
(5)
|
(4)
|
|
| UK |
|
|
|
| Disclosure of operating segments [line items] |
|
|
|
| Net book value of property, plant and equipment and other intangible assets |
33,475
|
|
32,343
|
| Capital expenditure |
1,649
|
1,594
|
|
| Depreciation, amortisation and impairment |
(464)
|
(432)
|
|
| US |
|
|
|
| Disclosure of operating segments [line items] |
|
|
|
| Net book value of property, plant and equipment and other intangible assets |
37,638
|
|
35,694
|
| Capital expenditure |
2,057
|
2,123
|
|
| Depreciation, amortisation and impairment |
(557)
|
(500)
|
|
| Property, plant and equipment |
|
|
|
| Disclosure of operating segments [line items] |
|
|
|
| Net book value of property, plant and equipment and other intangible assets |
67,396
|
|
64,433
|
| Capital expenditure |
3,449
|
3,490
|
|
| Depreciation, amortisation and impairment |
(868)
|
(829)
|
|
| Other intangible assets |
|
|
|
| Disclosure of operating segments [line items] |
|
|
|
| Net book value of property, plant and equipment and other intangible assets |
3,717
|
|
£ 3,604
|
| Capital expenditure |
257
|
227
|
|
| Depreciation, amortisation and impairment |
£ (153)
|
£ (103)
|
|
| X |
- DefinitionThe amount of depreciation expense, amortisation expense and impairment loss (reversal of impairment loss) recognised in profit or loss. [Refer: Depreciation and amortisation expense; Impairment loss (reversal of impairment loss) recognised in profit or loss] Reference 1: http://www.xbrl.org/2009/role/commonPracticeRef
-Name IAS
-Number 1
-IssueDate 2022-03-24
-Paragraph 112
-Subparagraph c
-URI https://taxonomy.ifrs.org/xifrs-link?type=IAS&num=1&code=ifrs-tx-2022-en-r&anchor=para_112_c&doctype=Standard
-URIDate 2022-03-24
| Name: |
ifrs-full_DepreciationAmortisationAndImpairmentLossReversalOfImpairmentLossRecognisedInProfitOrLoss |
| Namespace Prefix: |
ifrs-full_ |
| Data Type: |
xbrli:monetaryItemType |
| Balance Type: |
debit |
| Period Type: |
duration |
|
| X |
- DefinitionLine items represent concepts included in a table. These concepts are used to disclose reportable information associated with members defined in one or many axes of the table.
| Name: |
ifrs-full_DisclosureOfOperatingSegmentsLineItems |
| Namespace Prefix: |
ifrs-full_ |
| Data Type: |
xbrli:stringItemType |
| Balance Type: |
na |
| Period Type: |
duration |
|
| X |
- DefinitionAdditions To Property, Plant And Equipment And Intangible Assets Other Than Goodwill
| Name: |
nggtf_AdditionsToPropertyPlantAndEquipmentAndIntangibleAssetsOtherThanGoodwill |
| Namespace Prefix: |
nggtf_ |
| Data Type: |
xbrli:monetaryItemType |
| Balance Type: |
debit |
| Period Type: |
duration |
|
| X |
- DefinitionProperty, Plant And Equipment And Intangible Assets Other Than Goodwill, Net
| Name: |
nggtf_PropertyPlantAndEquipmentAndIntangibleAssetsOtherThanGoodwillNet |
| Namespace Prefix: |
nggtf_ |
| Data Type: |
xbrli:monetaryItemType |
| Balance Type: |
debit |
| Period Type: |
instant |
|
| X |
- Details
| Name: |
ifrs-full_SegmentConsolidationItemsAxis=ifrs-full_OperatingSegmentsMember |
| Namespace Prefix: |
|
| Data Type: |
na |
| Balance Type: |
|
| Period Type: |
|
|
| X |
- Details
| Name: |
ifrs-full_SegmentsAxis=nggtf_UKElectricityTransmissionMember |
| Namespace Prefix: |
|
| Data Type: |
na |
| Balance Type: |
|
| Period Type: |
|
|
| X |
- Details
| Name: |
ifrs-full_SegmentsAxis=nggtf_UKElectricityDistributionMember |
| Namespace Prefix: |
|
| Data Type: |
na |
| Balance Type: |
|
| Period Type: |
|
|
| X |
- Details
| Name: |
ifrs-full_SegmentsAxis=nggtf_UKElectricitySystemOperatorMember |
| Namespace Prefix: |
|
| Data Type: |
na |
| Balance Type: |
|
| Period Type: |
|
|
| X |
- Details
| Name: |
ifrs-full_SegmentsAxis=nggtf_NewEnglandMember |
| Namespace Prefix: |
|
| Data Type: |
na |
| Balance Type: |
|
| Period Type: |
|
|
| X |
- Details
| Name: |
ifrs-full_SegmentsAxis=nggtf_NewYorkSegmentMember |
| Namespace Prefix: |
|
| Data Type: |
na |
| Balance Type: |
|
| Period Type: |
|
|
| X |
- Details
| Name: |
ifrs-full_SegmentsAxis=nggtf_NationalGridVenturesMember |
| Namespace Prefix: |
|
| Data Type: |
na |
| Balance Type: |
|
| Period Type: |
|
|
| X |
- Details
| Name: |
ifrs-full_SegmentsAxis=nggtf_OtherSegmentsMember |
| Namespace Prefix: |
|
| Data Type: |
na |
| Balance Type: |
|
| Period Type: |
|
|
| X |
- Details
| Name: |
ifrs-full_GeographicalAreasAxis=ifrs-full_CountryOfDomicileMember |
| Namespace Prefix: |
|
| Data Type: |
na |
| Balance Type: |
|
| Period Type: |
|
|
| X |
- Details
| Name: |
ifrs-full_GeographicalAreasAxis=country_US |
| Namespace Prefix: |
|
| Data Type: |
na |
| Balance Type: |
|
| Period Type: |
|
|
| X |
- Details
| Name: |
ifrs-full_ClassesOfAssetsAxis=ifrs-full_PropertyPlantAndEquipmentMember |
| Namespace Prefix: |
|
| Data Type: |
na |
| Balance Type: |
|
| Period Type: |
|
|
| X |
- Details
| Name: |
ifrs-full_ClassesOfAssetsAxis=ifrs-full_IntangibleAssetsOtherThanGoodwillMember |
| Namespace Prefix: |
|
| Data Type: |
na |
| Balance Type: |
|
| Period Type: |
|
|
v3.23.3
Revenue (Details) - GBP (£)
£ in Millions |
6 Months Ended |
Sep. 30, 2023 |
Sep. 30, 2022 |
| Revenue from Contracts with Customers [line items] |
|
|
|
| Total IFRS 15 revenue |
£ 8,085
|
£ 8,822
|
|
| Total other revenue |
404
|
622
|
|
| Total revenue from continuing operations |
8,489
|
9,444
|
[1] |
| UK |
|
|
|
| Revenue from Contracts with Customers [line items] |
|
|
|
| Total IFRS 15 revenue |
4,301
|
4,285
|
|
| Total other revenue |
8
|
304
|
|
| Total revenue from continuing operations |
4,309
|
4,589
|
|
| US |
|
|
|
| Revenue from Contracts with Customers [line items] |
|
|
|
| Total IFRS 15 revenue |
3,784
|
4,537
|
|
| Total other revenue |
396
|
318
|
|
| Total revenue from continuing operations |
4,180
|
4,855
|
|
| UK Electricity Transmission |
|
|
|
| Revenue from Contracts with Customers [line items] |
|
|
|
| Total IFRS 15 revenue |
1,308
|
947
|
|
| Total other revenue |
29
|
8
|
|
| Total revenue from continuing operations |
1,337
|
955
|
|
| UK Electricity Transmission | UK |
|
|
|
| Revenue from Contracts with Customers [line items] |
|
|
|
| Total IFRS 15 revenue |
1,308
|
947
|
|
| Total other revenue |
29
|
8
|
|
| UK Electricity Transmission | US |
|
|
|
| Revenue from Contracts with Customers [line items] |
|
|
|
| Total IFRS 15 revenue |
0
|
0
|
|
| Total other revenue |
0
|
0
|
|
| UK Electricity Distribution |
|
|
|
| Revenue from Contracts with Customers [line items] |
|
|
|
| Total IFRS 15 revenue |
846
|
983
|
|
| Total other revenue |
2
|
14
|
|
| Total revenue from continuing operations |
848
|
997
|
|
| UK Electricity Distribution | UK |
|
|
|
| Revenue from Contracts with Customers [line items] |
|
|
|
| Total IFRS 15 revenue |
846
|
983
|
|
| Total other revenue |
2
|
14
|
|
| UK Electricity Distribution | US |
|
|
|
| Revenue from Contracts with Customers [line items] |
|
|
|
| Total IFRS 15 revenue |
0
|
0
|
|
| Total other revenue |
0
|
0
|
|
| UK Electricity System Operator |
|
|
|
| Revenue from Contracts with Customers [line items] |
|
|
|
| Total IFRS 15 revenue |
1,717
|
2,045
|
|
| Total other revenue |
0
|
0
|
|
| Total revenue from continuing operations |
1,717
|
2,045
|
|
| UK Electricity System Operator | UK |
|
|
|
| Revenue from Contracts with Customers [line items] |
|
|
|
| Total IFRS 15 revenue |
1,717
|
2,045
|
|
| Total other revenue |
0
|
0
|
|
| UK Electricity System Operator | US |
|
|
|
| Revenue from Contracts with Customers [line items] |
|
|
|
| Total IFRS 15 revenue |
0
|
0
|
|
| Total other revenue |
0
|
0
|
|
| New England |
|
|
|
| Revenue from Contracts with Customers [line items] |
|
|
|
| Total IFRS 15 revenue |
1,376
|
1,732
|
|
| Total other revenue |
65
|
28
|
|
| Total revenue from continuing operations |
1,441
|
1,760
|
|
| New England | UK |
|
|
|
| Revenue from Contracts with Customers [line items] |
|
|
|
| Total IFRS 15 revenue |
0
|
0
|
|
| Total other revenue |
0
|
0
|
|
| New England | US |
|
|
|
| Revenue from Contracts with Customers [line items] |
|
|
|
| Total IFRS 15 revenue |
1,376
|
1,732
|
|
| Total other revenue |
65
|
28
|
|
| New York |
|
|
|
| Revenue from Contracts with Customers [line items] |
|
|
|
| Total IFRS 15 revenue |
2,337
|
2,740
|
|
| Total other revenue |
28
|
18
|
|
| Total revenue from continuing operations |
2,365
|
2,758
|
|
| New York | UK |
|
|
|
| Revenue from Contracts with Customers [line items] |
|
|
|
| Total IFRS 15 revenue |
0
|
0
|
|
| Total other revenue |
0
|
0
|
|
| New York | US |
|
|
|
| Revenue from Contracts with Customers [line items] |
|
|
|
| Total IFRS 15 revenue |
2,337
|
2,740
|
|
| Total other revenue |
28
|
18
|
|
| National Grid Ventures |
|
|
|
| Revenue from Contracts with Customers [line items] |
|
|
|
| Total IFRS 15 revenue |
501
|
375
|
|
| Total other revenue |
138
|
301
|
|
| Total revenue from continuing operations |
639
|
676
|
|
| National Grid Ventures | UK |
|
|
|
| Revenue from Contracts with Customers [line items] |
|
|
|
| Total IFRS 15 revenue |
430
|
310
|
|
| Total other revenue |
(50)
|
83
|
|
| National Grid Ventures | US |
|
|
|
| Revenue from Contracts with Customers [line items] |
|
|
|
| Total IFRS 15 revenue |
71
|
65
|
|
| Total other revenue |
188
|
218
|
|
| Other |
|
|
|
| Revenue from Contracts with Customers [line items] |
|
|
|
| Total IFRS 15 revenue |
0
|
0
|
|
| Total other revenue |
142
|
253
|
|
| Total revenue from continuing operations |
142
|
253
|
|
| Other | UK |
|
|
|
| Revenue from Contracts with Customers [line items] |
|
|
|
| Total IFRS 15 revenue |
0
|
0
|
|
| Total other revenue |
27
|
199
|
|
| Other | US |
|
|
|
| Revenue from Contracts with Customers [line items] |
|
|
|
| Total IFRS 15 revenue |
0
|
0
|
|
| Total other revenue |
115
|
54
|
|
| Transmission |
|
|
|
| Revenue from Contracts with Customers [line items] |
|
|
|
| Total IFRS 15 revenue |
2,056
|
1,484
|
|
| Transmission | UK Electricity Transmission |
|
|
|
| Revenue from Contracts with Customers [line items] |
|
|
|
| Total IFRS 15 revenue |
1,299
|
931
|
|
| Transmission | UK Electricity Distribution |
|
|
|
| Revenue from Contracts with Customers [line items] |
|
|
|
| Total IFRS 15 revenue |
0
|
0
|
|
| Transmission | UK Electricity System Operator |
|
|
|
| Revenue from Contracts with Customers [line items] |
|
|
|
| Total IFRS 15 revenue |
5
|
77
|
|
| Transmission | New England |
|
|
|
| Revenue from Contracts with Customers [line items] |
|
|
|
| Total IFRS 15 revenue |
43
|
53
|
|
| Transmission | New York |
|
|
|
| Revenue from Contracts with Customers [line items] |
|
|
|
| Total IFRS 15 revenue |
283
|
117
|
|
| Transmission | National Grid Ventures |
|
|
|
| Revenue from Contracts with Customers [line items] |
|
|
|
| Total IFRS 15 revenue |
426
|
306
|
|
| Transmission | Other |
|
|
|
| Revenue from Contracts with Customers [line items] |
|
|
|
| Total IFRS 15 revenue |
0
|
0
|
|
| Distribution |
|
|
|
| Revenue from Contracts with Customers [line items] |
|
|
|
| Total IFRS 15 revenue |
4,186
|
5,232
|
|
| Distribution | UK Electricity Transmission |
|
|
|
| Revenue from Contracts with Customers [line items] |
|
|
|
| Total IFRS 15 revenue |
0
|
0
|
|
| Distribution | UK Electricity Distribution |
|
|
|
| Revenue from Contracts with Customers [line items] |
|
|
|
| Total IFRS 15 revenue |
810
|
940
|
|
| Distribution | UK Electricity System Operator |
|
|
|
| Revenue from Contracts with Customers [line items] |
|
|
|
| Total IFRS 15 revenue |
0
|
0
|
|
| Distribution | New England |
|
|
|
| Revenue from Contracts with Customers [line items] |
|
|
|
| Total IFRS 15 revenue |
1,329
|
1,675
|
|
| Distribution | New York |
|
|
|
| Revenue from Contracts with Customers [line items] |
|
|
|
| Total IFRS 15 revenue |
2,047
|
2,617
|
|
| Distribution | National Grid Ventures |
|
|
|
| Revenue from Contracts with Customers [line items] |
|
|
|
| Total IFRS 15 revenue |
0
|
0
|
|
| Distribution | Other |
|
|
|
| Revenue from Contracts with Customers [line items] |
|
|
|
| Total IFRS 15 revenue |
0
|
0
|
|
| System Operator |
|
|
|
| Revenue from Contracts with Customers [line items] |
|
|
|
| Total IFRS 15 revenue |
1,712
|
1,968
|
|
| System Operator | UK Electricity Transmission |
|
|
|
| Revenue from Contracts with Customers [line items] |
|
|
|
| Total IFRS 15 revenue |
0
|
0
|
|
| System Operator | UK Electricity Distribution |
|
|
|
| Revenue from Contracts with Customers [line items] |
|
|
|
| Total IFRS 15 revenue |
0
|
0
|
|
| System Operator | UK Electricity System Operator |
|
|
|
| Revenue from Contracts with Customers [line items] |
|
|
|
| Total IFRS 15 revenue |
1,712
|
1,968
|
|
| System Operator | New England |
|
|
|
| Revenue from Contracts with Customers [line items] |
|
|
|
| Total IFRS 15 revenue |
0
|
0
|
|
| System Operator | New York |
|
|
|
| Revenue from Contracts with Customers [line items] |
|
|
|
| Total IFRS 15 revenue |
0
|
0
|
|
| System Operator | National Grid Ventures |
|
|
|
| Revenue from Contracts with Customers [line items] |
|
|
|
| Total IFRS 15 revenue |
0
|
0
|
|
| System Operator | Other |
|
|
|
| Revenue from Contracts with Customers [line items] |
|
|
|
| Total IFRS 15 revenue |
0
|
0
|
|
| Generation |
|
|
|
| Revenue from Contracts with Customers [line items] |
|
|
|
| Total other revenue |
181
|
224
|
|
| Generation | UK Electricity Transmission |
|
|
|
| Revenue from Contracts with Customers [line items] |
|
|
|
| Total other revenue |
0
|
0
|
|
| Generation | UK Electricity Distribution |
|
|
|
| Revenue from Contracts with Customers [line items] |
|
|
|
| Total other revenue |
0
|
0
|
|
| Generation | UK Electricity System Operator |
|
|
|
| Revenue from Contracts with Customers [line items] |
|
|
|
| Total other revenue |
0
|
0
|
|
| Generation | New England |
|
|
|
| Revenue from Contracts with Customers [line items] |
|
|
|
| Total other revenue |
0
|
0
|
|
| Generation | New York |
|
|
|
| Revenue from Contracts with Customers [line items] |
|
|
|
| Total other revenue |
0
|
0
|
|
| Generation | National Grid Ventures |
|
|
|
| Revenue from Contracts with Customers [line items] |
|
|
|
| Total other revenue |
181
|
224
|
|
| Generation | Other |
|
|
|
| Revenue from Contracts with Customers [line items] |
|
|
|
| Total other revenue |
0
|
0
|
|
| Other |
|
|
|
| Revenue from Contracts with Customers [line items] |
|
|
|
| Total IFRS 15 revenue |
131
|
138
|
|
| Total other revenue |
223
|
398
|
|
| Other | UK Electricity Transmission |
|
|
|
| Revenue from Contracts with Customers [line items] |
|
|
|
| Total IFRS 15 revenue |
9
|
16
|
|
| Total other revenue |
29
|
8
|
|
| Other | UK Electricity Distribution |
|
|
|
| Revenue from Contracts with Customers [line items] |
|
|
|
| Total IFRS 15 revenue |
36
|
43
|
|
| Total other revenue |
2
|
14
|
|
| Other | UK Electricity System Operator |
|
|
|
| Revenue from Contracts with Customers [line items] |
|
|
|
| Total IFRS 15 revenue |
0
|
0
|
|
| Total other revenue |
0
|
0
|
|
| Other | New England |
|
|
|
| Revenue from Contracts with Customers [line items] |
|
|
|
| Total IFRS 15 revenue |
4
|
4
|
|
| Total other revenue |
65
|
28
|
|
| Other | New York |
|
|
|
| Revenue from Contracts with Customers [line items] |
|
|
|
| Total IFRS 15 revenue |
7
|
6
|
|
| Total other revenue |
28
|
18
|
|
| Other | National Grid Ventures |
|
|
|
| Revenue from Contracts with Customers [line items] |
|
|
|
| Total IFRS 15 revenue |
75
|
69
|
|
| Total other revenue |
(43)
|
77
|
|
| Other | Other |
|
|
|
| Revenue from Contracts with Customers [line items] |
|
|
|
| Total IFRS 15 revenue |
0
|
0
|
|
| Total other revenue |
£ 142
|
£ 253
|
|
|
|
| X |
- DefinitionLine items represent concepts included in a table. These concepts are used to disclose reportable information associated with members defined in one or many axes of the table.
| Name: |
ifrs-full_DisclosureOfDisaggregationOfRevenueFromContractsWithCustomersLineItems |
| Namespace Prefix: |
ifrs-full_ |
| Data Type: |
xbrli:stringItemType |
| Balance Type: |
na |
| Period Type: |
duration |
|
| X |
- DefinitionThe income arising in the course of an entity's ordinary activities. Income is increases in assets, or decreases in liabilities, that result in increases in equity, other than those relating to contributions from holders of equity claims. Reference 1: http://www.xbrl.org/2003/role/disclosureRef
-Name IFRS
-Number 8
-IssueDate 2022-03-24
-Paragraph 28
-Subparagraph a
-URI https://taxonomy.ifrs.org/xifrs-link?type=IFRS&num=8&code=ifrs-tx-2022-en-r&anchor=para_28_a&doctype=Standard
-URIDate 2022-03-24
Reference 2: http://www.xbrl.org/2003/role/disclosureRef
-Name IFRS
-Number 8
-IssueDate 2022-03-24
-Paragraph 23
-Subparagraph a
-URI https://taxonomy.ifrs.org/xifrs-link?type=IFRS&num=8&code=ifrs-tx-2022-en-r&anchor=para_23_a&doctype=Standard
-URIDate 2022-03-24
Reference 3: http://www.xbrl.org/2003/role/disclosureRef
-Name IFRS
-Number 8
-IssueDate 2022-03-24
-Paragraph 32
-URI https://taxonomy.ifrs.org/xifrs-link?type=IFRS&num=8&code=ifrs-tx-2022-en-r&anchor=para_32&doctype=Standard
-URIDate 2022-03-24
Reference 4: http://www.xbrl.org/2003/role/disclosureRef
-Name IFRS
-Number 8
-IssueDate 2022-03-24
-Paragraph 33
-Subparagraph a
-URI https://taxonomy.ifrs.org/xifrs-link?type=IFRS&num=8&code=ifrs-tx-2022-en-r&anchor=para_33_a&doctype=Standard
-URIDate 2022-03-24
Reference 5: http://www.xbrl.org/2003/role/disclosureRef
-Name IFRS
-Number 8
-IssueDate 2022-03-24
-Paragraph 34
-URI https://taxonomy.ifrs.org/xifrs-link?type=IFRS&num=8&code=ifrs-tx-2022-en-r&anchor=para_34&doctype=Standard
-URIDate 2022-03-24
Reference 6: http://www.xbrl.org/2003/role/disclosureRef
-Name IFRS
-Number 5
-IssueDate 2022-03-24
-Paragraph 33
-Subparagraph b
-Clause i
-URI https://taxonomy.ifrs.org/xifrs-link?type=IFRS&num=5&code=ifrs-tx-2022-en-r&anchor=para_33_b_i&doctype=Standard
-URIDate 2022-03-24
Reference 7: http://www.xbrl.org/2003/role/disclosureRef
-Name IFRS
-Number 12
-IssueDate 2022-03-24
-Paragraph B12
-Subparagraph b
-Clause v
-URI https://taxonomy.ifrs.org/xifrs-link?type=IFRS&num=12&code=ifrs-tx-2022-en-r&anchor=para_B12_b_v&doctype=Appendix&subtype=B
-URIDate 2022-03-24
Reference 8: http://www.xbrl.org/2003/role/exampleRef
-Name IFRS
-Number 12
-IssueDate 2022-03-24
-Paragraph B10
-Subparagraph b
-URI https://taxonomy.ifrs.org/xifrs-link?type=IFRS&num=12&code=ifrs-tx-2022-en-r&anchor=para_B10_b&doctype=Appendix&subtype=B
-URIDate 2022-03-24
Reference 9: http://www.xbrl.org/2003/role/disclosureRef
-Name IAS
-Number 1
-IssueDate 2022-03-24
-Paragraph 82
-Subparagraph a
-URI https://taxonomy.ifrs.org/xifrs-link?type=IAS&num=1&code=ifrs-tx-2022-en-r&anchor=para_82_a&doctype=Standard
-URIDate 2022-03-24
Reference 10: http://www.xbrl.org/2003/role/exampleRef
-Name IAS
-Number 1
-IssueDate 2022-03-24
-Paragraph 103
-URI https://taxonomy.ifrs.org/xifrs-link?type=IAS&num=1&code=ifrs-tx-2022-en-r&anchor=para_103&doctype=Standard
-URIDate 2022-03-24
Reference 11: http://www.xbrl.org/2003/role/exampleRef
-Name IAS
-Number 1
-IssueDate 2022-03-24
-Paragraph 102
-URI https://taxonomy.ifrs.org/xifrs-link?type=IAS&num=1&code=ifrs-tx-2022-en-r&anchor=para_102&doctype=Standard
-URIDate 2022-03-24
| Name: |
ifrs-full_Revenue |
| Namespace Prefix: |
ifrs-full_ |
| Data Type: |
xbrli:monetaryItemType |
| Balance Type: |
credit |
| Period Type: |
duration |
|
| X |
- DefinitionThe amount of revenue from contracts with customers. A customer is a party that has contracted with an entity to obtain goods or services that are an output of the entity’s ordinary activities in exchange for consideration. Reference 1: http://www.xbrl.org/2003/role/disclosureRef
-Name IFRS
-Number 15
-IssueDate 2022-03-24
-Paragraph 114
-URI https://taxonomy.ifrs.org/xifrs-link?type=IFRS&num=15&code=ifrs-tx-2022-en-r&anchor=para_114&doctype=Standard
-URIDate 2022-03-24
Reference 2: http://www.xbrl.org/2003/role/disclosureRef
-Name IFRS
-Number 15
-IssueDate 2022-03-24
-Paragraph 113
-Subparagraph a
-URI https://taxonomy.ifrs.org/xifrs-link?type=IFRS&num=15&code=ifrs-tx-2022-en-r&anchor=para_113_a&doctype=Standard
-URIDate 2022-03-24
| Name: |
ifrs-full_RevenueFromContractsWithCustomers |
| Namespace Prefix: |
ifrs-full_ |
| Data Type: |
xbrli:monetaryItemType |
| Balance Type: |
credit |
| Period Type: |
duration |
|
| X |
- DefinitionOther Miscellaneous Revenue, Non IFRS15
| Name: |
nggtf_OtherMiscellaneousRevenueNonIFRS15 |
| Namespace Prefix: |
nggtf_ |
| Data Type: |
xbrli:monetaryItemType |
| Balance Type: |
credit |
| Period Type: |
duration |
|
| X |
- Details
| Name: |
ifrs-full_GeographicalAreasAxis=ifrs-full_CountryOfDomicileMember |
| Namespace Prefix: |
|
| Data Type: |
na |
| Balance Type: |
|
| Period Type: |
|
|
| X |
- Details
| Name: |
ifrs-full_GeographicalAreasAxis=country_US |
| Namespace Prefix: |
|
| Data Type: |
na |
| Balance Type: |
|
| Period Type: |
|
|
| X |
- Details
| Name: |
ifrs-full_SegmentsAxis=nggtf_UKElectricityTransmissionMember |
| Namespace Prefix: |
|
| Data Type: |
na |
| Balance Type: |
|
| Period Type: |
|
|
| X |
- Details
| Name: |
ifrs-full_SegmentsAxis=nggtf_UKElectricityDistributionMember |
| Namespace Prefix: |
|
| Data Type: |
na |
| Balance Type: |
|
| Period Type: |
|
|
| X |
- Details
| Name: |
ifrs-full_SegmentsAxis=nggtf_UKElectricitySystemOperatorMember |
| Namespace Prefix: |
|
| Data Type: |
na |
| Balance Type: |
|
| Period Type: |
|
|
| X |
- Details
| Name: |
ifrs-full_SegmentsAxis=nggtf_NewEnglandMember |
| Namespace Prefix: |
|
| Data Type: |
na |
| Balance Type: |
|
| Period Type: |
|
|
| X |
- Details
| Name: |
ifrs-full_SegmentsAxis=nggtf_NewYorkSegmentMember |
| Namespace Prefix: |
|
| Data Type: |
na |
| Balance Type: |
|
| Period Type: |
|
|
| X |
- Details
| Name: |
ifrs-full_SegmentsAxis=nggtf_NationalGridVenturesMember |
| Namespace Prefix: |
|
| Data Type: |
na |
| Balance Type: |
|
| Period Type: |
|
|
| X |
- Details
| Name: |
ifrs-full_SegmentsAxis=nggtf_OtherSegmentsMember |
| Namespace Prefix: |
|
| Data Type: |
na |
| Balance Type: |
|
| Period Type: |
|
|
| X |
- Details
| Name: |
ifrs-full_ProductsAndServicesAxis=nggtf_TransmissionMember |
| Namespace Prefix: |
|
| Data Type: |
na |
| Balance Type: |
|
| Period Type: |
|
|
| X |
- Details
| Name: |
ifrs-full_ProductsAndServicesAxis=nggtf_DistributionMember |
| Namespace Prefix: |
|
| Data Type: |
na |
| Balance Type: |
|
| Period Type: |
|
|
| X |
- Details
| Name: |
ifrs-full_ProductsAndServicesAxis=nggtf_SystemOperatorMember |
| Namespace Prefix: |
|
| Data Type: |
na |
| Balance Type: |
|
| Period Type: |
|
|
| X |
- Details
| Name: |
ifrs-full_ProductsAndServicesAxis=nggtf_GenerationMember |
| Namespace Prefix: |
|
| Data Type: |
na |
| Balance Type: |
|
| Period Type: |
|
|
| X |
- Details
| Name: |
ifrs-full_ProductsAndServicesAxis=nggtf_OtherProductAndServicesMember |
| Namespace Prefix: |
|
| Data Type: |
na |
| Balance Type: |
|
| Period Type: |
|
|
v3.23.3
Exceptional items and remeasurements - Schedule of exceptional items and remeasurements from continuing operations (Details) - GBP (£)
£ in Millions |
6 Months Ended |
Sep. 30, 2023 |
Sep. 30, 2022 |
| Included within operating profit from continuing operations |
|
|
|
| Operating profit |
£ 1,985
|
£ 2,239
|
[1] |
| Included within net finance costs |
|
|
|
| Net gains on derivative financial instruments |
34
|
140
|
|
| Net losses on financial assets at fair value through profit and loss |
(8)
|
(32)
|
|
| Net finance costs |
(685)
|
(624)
|
|
| Included within share of post-tax results of joint ventures and associates |
|
|
|
| Share of post-tax results of joint ventures and associates |
71
|
51
|
[1] |
| Profit before tax |
1,371
|
1,666
|
[1] |
| Profit after tax from continuing operations |
1,064
|
1,219
|
[1],[2] |
| Total |
|
|
|
| Included within operating profit from continuing operations |
|
|
|
| Net gain on disposal of NECO |
|
511
|
|
| Cost efficiency programme |
(39)
|
(61)
|
|
| Transaction, separation and integration costs |
(11)
|
(65)
|
|
| IFA1 fire insurance proceeds |
92
|
33
|
|
| Net gains on commodity contract derivatives |
41
|
65
|
|
| Operating profit |
83
|
483
|
|
| Included within net finance costs |
|
|
|
| Net gains on derivative financial instruments |
34
|
140
|
|
| Net losses on financial assets at fair value through profit and loss |
(8)
|
(32)
|
|
| Net finance costs |
26
|
108
|
|
| Included within share of post-tax results of joint ventures and associates |
|
|
|
| Net gains on financial instruments |
12
|
(19)
|
|
| Share of post-tax results of joint ventures and associates |
12
|
(19)
|
|
| Profit before tax |
121
|
572
|
|
| Tax on exceptional items and remeasurements |
(20)
|
(270)
|
|
| Profit after tax from continuing operations |
101
|
302
|
|
| Exceptional items |
|
|
|
| Included within operating profit from continuing operations |
|
|
|
| Net gain on disposal of NECO |
|
511
|
|
| Cost efficiency programme |
(39)
|
(61)
|
|
| Transaction, separation and integration costs |
(11)
|
(65)
|
|
| IFA1 fire insurance proceeds |
92
|
33
|
|
| Net gains on commodity contract derivatives |
0
|
0
|
|
| Operating profit |
42
|
418
|
|
| Included within net finance costs |
|
|
|
| Net gains on derivative financial instruments |
0
|
0
|
|
| Net losses on financial assets at fair value through profit and loss |
0
|
0
|
|
| Net finance costs |
0
|
0
|
|
| Included within share of post-tax results of joint ventures and associates |
|
|
|
| Net gains on financial instruments |
0
|
0
|
|
| Share of post-tax results of joint ventures and associates |
0
|
0
|
|
| Profit before tax |
42
|
418
|
|
| Tax on exceptional items and remeasurements |
1
|
(221)
|
|
| Profit after tax from continuing operations |
43
|
197
|
|
| Remeasurements |
|
|
|
| Included within operating profit from continuing operations |
|
|
|
| Net gain on disposal of NECO |
|
0
|
|
| Cost efficiency programme |
0
|
0
|
|
| Transaction, separation and integration costs |
0
|
0
|
|
| IFA1 fire insurance proceeds |
0
|
0
|
|
| Net gains on commodity contract derivatives |
41
|
65
|
|
| Operating profit |
41
|
65
|
|
| Included within net finance costs |
|
|
|
| Net gains on derivative financial instruments |
34
|
140
|
|
| Net losses on financial assets at fair value through profit and loss |
(8)
|
(32)
|
|
| Net finance costs |
26
|
108
|
|
| Included within share of post-tax results of joint ventures and associates |
|
|
|
| Net gains on financial instruments |
12
|
(19)
|
|
| Share of post-tax results of joint ventures and associates |
12
|
(19)
|
|
| Profit before tax |
79
|
154
|
|
| Tax on exceptional items and remeasurements |
(21)
|
(49)
|
|
| Profit after tax from continuing operations |
£ 58
|
£ 105
|
|
|
|
| X |
- DefinitionThe amount of current tax expense (income) and adjustments for the current tax of prior periods. [Refer: Current tax expense (income); Adjustments for current tax of prior periods] Reference 1: http://www.xbrl.org/2009/role/commonPracticeRef
-Name IAS
-Number 12
-IssueDate 2022-03-24
-Paragraph 80
-URI https://taxonomy.ifrs.org/xifrs-link?type=IAS&num=12&code=ifrs-tx-2022-en-r&anchor=para_80&doctype=Standard
-URIDate 2022-03-24
| Name: |
ifrs-full_CurrentTaxExpenseIncomeAndAdjustmentsForCurrentTaxOfPriorPeriods |
| Namespace Prefix: |
ifrs-full_ |
| Data Type: |
xbrli:monetaryItemType |
| Balance Type: |
debit |
| Period Type: |
duration |
|
| X |
- DefinitionThe amount of expense relating to restructuring. Restructuring is a programme that is planned and controlled by management and materially changes either the scope of a business undertaken by an entity or the manner in which that business is conducted. Such programmes include: (a) the sale or termination of a line of business; (b) closure of business locations in a country or region or the relocation of activities from one country or region to another; (c) changes in management structure; and (d) fundamental reorganisations that have a material effect on the nature and focus of the entity's operations. Reference 1: http://www.xbrl.org/2003/role/disclosureRef
-Name IAS
-Number 1
-IssueDate 2022-03-24
-Paragraph 98
-Subparagraph b
-URI https://taxonomy.ifrs.org/xifrs-link?type=IAS&num=1&code=ifrs-tx-2022-en-r&anchor=para_98_b&doctype=Standard
-URIDate 2022-03-24
| Name: |
ifrs-full_ExpenseOfRestructuringActivities |
| Namespace Prefix: |
ifrs-full_ |
| Data Type: |
xbrli:monetaryItemType |
| Balance Type: |
debit |
| Period Type: |
duration |
|
| X |
- DefinitionThe amount of income or cost associated with interest and other financing activities of the entity. Reference 1: http://www.xbrl.org/2009/role/commonPracticeRef
-Name IAS
-Number 1
-IssueDate 2022-03-24
-Paragraph 85
-URI https://taxonomy.ifrs.org/xifrs-link?type=IAS&num=1&code=ifrs-tx-2022-en-r&anchor=para_85&doctype=Standard
-URIDate 2022-03-24
| Name: |
ifrs-full_FinanceIncomeCost |
| Namespace Prefix: |
ifrs-full_ |
| Data Type: |
xbrli:monetaryItemType |
| Balance Type: |
credit |
| Period Type: |
duration |
|
| X |
- DefinitionThe gains (losses) on financial assets at fair value through profit or loss. [Refer: Financial assets at fair value through profit or loss] Reference 1: http://www.xbrl.org/2003/role/disclosureRef
-Name IFRS
-Number 7
-IssueDate 2022-03-24
-Paragraph 20
-Subparagraph a
-Clause i
-URI https://taxonomy.ifrs.org/xifrs-link?type=IFRS&num=7&code=ifrs-tx-2022-en-r&anchor=para_20_a_i&doctype=Standard
-URIDate 2022-03-24
| Name: |
ifrs-full_GainsLossesOnFinancialAssetsAtFairValueThroughProfitOrLoss |
| Namespace Prefix: |
ifrs-full_ |
| Data Type: |
xbrli:monetaryItemType |
| Balance Type: |
credit |
| Period Type: |
duration |
|
| X |
- DefinitionThe gain on the disposal of investments. Reference 1: http://www.xbrl.org/2003/role/disclosureRef
-Name IAS
-Number 1
-IssueDate 2022-03-24
-Paragraph 98
-Subparagraph d
-URI https://taxonomy.ifrs.org/xifrs-link?type=IAS&num=1&code=ifrs-tx-2022-en-r&anchor=para_98_d&doctype=Standard
-URIDate 2022-03-24
| Name: |
ifrs-full_GainsOnDisposalsOfInvestments |
| Namespace Prefix: |
ifrs-full_ |
| Data Type: |
xbrli:monetaryItemType |
| Balance Type: |
credit |
| Period Type: |
duration |
|
| X |
- DefinitionThe amount of income recognised from the reimbursement of a claim as a result of the occurrence of an insured event covered by an insurance contract. [Refer: Types of insurance contracts [member]] Reference 1: http://www.xbrl.org/2009/role/commonPracticeRef
-Name IAS
-Number 1
-IssueDate 2022-03-24
-Paragraph 112
-Subparagraph c
-URI https://taxonomy.ifrs.org/xifrs-link?type=IAS&num=1&code=ifrs-tx-2022-en-r&anchor=para_112_c&doctype=Standard
-URIDate 2022-03-24
| Name: |
ifrs-full_IncomeFromReimbursementsUnderInsurancePolicies |
| Namespace Prefix: |
ifrs-full_ |
| Data Type: |
xbrli:monetaryItemType |
| Balance Type: |
credit |
| Period Type: |
duration |
|
| X |
- DefinitionThe profit (loss) before tax expense or income. [Refer: Profit (loss)] Reference 1: http://www.xbrl.org/2003/role/exampleRef
-Name IFRS
-Number 8
-IssueDate 2022-03-24
-Paragraph 28
-Subparagraph b
-URI https://taxonomy.ifrs.org/xifrs-link?type=IFRS&num=8&code=ifrs-tx-2022-en-r&anchor=para_28_b&doctype=Standard
-URIDate 2022-03-24
Reference 2: http://www.xbrl.org/2003/role/exampleRef
-Name IFRS
-Number 8
-IssueDate 2022-03-24
-Paragraph 23
-URI https://taxonomy.ifrs.org/xifrs-link?type=IFRS&num=8&code=ifrs-tx-2022-en-r&anchor=para_23&doctype=Standard
-URIDate 2022-03-24
Reference 3: http://www.xbrl.org/2003/role/disclosureRef
-Name IFRS
-Number 5
-IssueDate 2022-03-24
-Paragraph 33
-Subparagraph b
-Clause i
-URI https://taxonomy.ifrs.org/xifrs-link?type=IFRS&num=5&code=ifrs-tx-2022-en-r&anchor=para_33_b_i&doctype=Standard
-URIDate 2022-03-24
Reference 4: http://www.xbrl.org/2003/role/exampleRef
-Name IAS
-Number 1
-IssueDate 2022-03-24
-Paragraph 103
-URI https://taxonomy.ifrs.org/xifrs-link?type=IAS&num=1&code=ifrs-tx-2022-en-r&anchor=para_103&doctype=Standard
-URIDate 2022-03-24
Reference 5: http://www.xbrl.org/2003/role/exampleRef
-Name IAS
-Number 1
-IssueDate 2022-03-24
-Paragraph 102
-URI https://taxonomy.ifrs.org/xifrs-link?type=IAS&num=1&code=ifrs-tx-2022-en-r&anchor=para_102&doctype=Standard
-URIDate 2022-03-24
| Name: |
ifrs-full_ProfitLossBeforeTax |
| Namespace Prefix: |
ifrs-full_ |
| Data Type: |
xbrli:monetaryItemType |
| Balance Type: |
credit |
| Period Type: |
duration |
|
| X |
- DefinitionThe profit (loss) from continuing operations. [Refer: Continuing operations [member]; Profit (loss)] Reference 1: http://www.xbrl.org/2003/role/disclosureRef
-Name IFRS
-Number 8
-IssueDate 2022-03-24
-Paragraph 28
-Subparagraph b
-URI https://taxonomy.ifrs.org/xifrs-link?type=IFRS&num=8&code=ifrs-tx-2022-en-r&anchor=para_28_b&doctype=Standard
-URIDate 2022-03-24
Reference 2: http://www.xbrl.org/2003/role/disclosureRef
-Name IFRS
-Number 8
-IssueDate 2022-03-24
-Paragraph 23
-URI https://taxonomy.ifrs.org/xifrs-link?type=IFRS&num=8&code=ifrs-tx-2022-en-r&anchor=para_23&doctype=Standard
-URIDate 2022-03-24
Reference 3: http://www.xbrl.org/2003/role/disclosureRef
-Name IFRS
-Number 12
-IssueDate 2022-03-24
-Paragraph B12
-Subparagraph b
-Clause vi
-URI https://taxonomy.ifrs.org/xifrs-link?type=IFRS&num=12&code=ifrs-tx-2022-en-r&anchor=para_B12_b_vi&doctype=Appendix&subtype=B
-URIDate 2022-03-24
Reference 4: http://www.xbrl.org/2003/role/disclosureRef
-Name IAS
-Number 1
-IssueDate 2022-03-24
-Paragraph 81A
-Subparagraph a
-URI https://taxonomy.ifrs.org/xifrs-link?type=IAS&num=1&code=ifrs-tx-2022-en-r&anchor=para_81A_a&doctype=Standard
-URIDate 2022-03-24
| Name: |
ifrs-full_ProfitLossFromContinuingOperations |
| Namespace Prefix: |
ifrs-full_ |
| Data Type: |
xbrli:monetaryItemType |
| Balance Type: |
credit |
| Period Type: |
duration |
|
| X |
- DefinitionThe profit (loss) from operating activities of the entity. [Refer: Profit (loss)] Reference 1: http://www.xbrl.org/2003/role/exampleRef
-Name IAS
-Number 32
-IssueDate 2022-03-24
-Paragraph IE33
-URI https://taxonomy.ifrs.org/xifrs-link?type=IAS&num=32&code=ifrs-tx-2022-en-r&anchor=para_IE33&doctype=Illustrative%20Examples
-URIDate 2022-03-24
Reference 2: http://www.xbrl.org/2009/role/commonPracticeRef
-Name IAS
-Number 1
-IssueDate 2022-03-24
-Paragraph 85
-URI https://taxonomy.ifrs.org/xifrs-link?type=IAS&num=1&code=ifrs-tx-2022-en-r&anchor=para_85&doctype=Standard
-URIDate 2022-03-24
| Name: |
ifrs-full_ProfitLossFromOperatingActivities |
| Namespace Prefix: |
ifrs-full_ |
| Data Type: |
xbrli:monetaryItemType |
| Balance Type: |
credit |
| Period Type: |
duration |
|
| X |
- DefinitionThe entity's share of the profit (loss) of associates and joint ventures accounted for using the equity method. [Refer: Associates [member]; Investments accounted for using equity method; Joint ventures [member]; Profit (loss)] Reference 1: http://www.xbrl.org/2003/role/disclosureRef
-Name IFRS
-Number 8
-IssueDate 2022-03-24
-Paragraph 28
-Subparagraph e
-URI https://taxonomy.ifrs.org/xifrs-link?type=IFRS&num=8&code=ifrs-tx-2022-en-r&anchor=para_28_e&doctype=Standard
-URIDate 2022-03-24
Reference 2: http://www.xbrl.org/2003/role/disclosureRef
-Name IFRS
-Number 8
-IssueDate 2022-03-24
-Paragraph 23
-Subparagraph g
-URI https://taxonomy.ifrs.org/xifrs-link?type=IFRS&num=8&code=ifrs-tx-2022-en-r&anchor=para_23_g&doctype=Standard
-URIDate 2022-03-24
Reference 3: http://www.xbrl.org/2003/role/disclosureRef
-Note Effective on first application of IFRS 9
-Name IFRS
-Number 4
-IssueDate 2022-03-24
-Paragraph 39M
-Subparagraph b
-URI https://taxonomy.ifrs.org/xifrs-link?type=IFRS&num=4&code=ifrs-tx-2022-en-b&anchor=para_39M_b&doctype=Standard
-URIDate 2022-03-24
Reference 4: http://www.xbrl.org/2003/role/disclosureRef
-Name IAS
-Number 1
-IssueDate 2022-03-24
-Paragraph 82
-Subparagraph c
-URI https://taxonomy.ifrs.org/xifrs-link?type=IAS&num=1&code=ifrs-tx-2022-en-r&anchor=para_82_c&doctype=Standard
-URIDate 2022-03-24
| Name: |
ifrs-full_ShareOfProfitLossOfAssociatesAndJointVenturesAccountedForUsingEquityMethod |
| Namespace Prefix: |
ifrs-full_ |
| Data Type: |
xbrli:monetaryItemType |
| Balance Type: |
credit |
| Period Type: |
duration |
|
| X |
- DefinitionGains (Losses) On Derivatives Financial Instruments, Finance Cost
| Name: |
nggtf_GainsLossesOnDerivativesFinancialInstrumentsFinanceCost |
| Namespace Prefix: |
nggtf_ |
| Data Type: |
xbrli:monetaryItemType |
| Balance Type: |
credit |
| Period Type: |
duration |
|
| X |
- DefinitionGains (Losses) On Derivatives Financial Instruments, Operating Profit
| Name: |
nggtf_GainsLossesOnDerivativesFinancialInstrumentsOperatingProfit |
| Namespace Prefix: |
nggtf_ |
| Data Type: |
xbrli:monetaryItemType |
| Balance Type: |
credit |
| Period Type: |
duration |
|
| X |
- DefinitionGains (Losses) On Financial Instruments, Share Of Post-Tax Results Of Joint Ventures And Associates
| Name: |
nggtf_GainsLossesOnFinancialInstrumentsShareOfPostTaxResultsOfJointVenturesAndAssociates |
| Namespace Prefix: |
nggtf_ |
| Data Type: |
xbrli:monetaryItemType |
| Balance Type: |
credit |
| Period Type: |
duration |
|
| X |
- DefinitionIncluded within net finance costs [Abstract]
| Name: |
nggtf_IncludedWithinNetFinanceCostsAbstract |
| Namespace Prefix: |
nggtf_ |
| Data Type: |
xbrli:stringItemType |
| Balance Type: |
na |
| Period Type: |
duration |
|
| X |
- DefinitionIncluded within operating profit [Abstract]
| Name: |
nggtf_IncludedWithinOperatingProfitAbstract |
| Namespace Prefix: |
nggtf_ |
| Data Type: |
xbrli:stringItemType |
| Balance Type: |
na |
| Period Type: |
duration |
|
| X |
- DefinitionIncluded Within Share Of Post-Tax Results Of Joint Ventures And Associates
| Name: |
nggtf_IncludedWithinShareOfPostTaxResultsOfJointVenturesAndAssociatesAbstract |
| Namespace Prefix: |
nggtf_ |
| Data Type: |
xbrli:stringItemType |
| Balance Type: |
na |
| Period Type: |
duration |
|
| X |
- DefinitionTransaction, Separation And Integration Costs
| Name: |
nggtf_TransactionSeparationAndIntegrationCosts |
| Namespace Prefix: |
nggtf_ |
| Data Type: |
xbrli:monetaryItemType |
| Balance Type: |
debit |
| Period Type: |
duration |
|
| X |
- Details
| Name: |
srt_StatementScenarioAxis=nggtf_ExceptionalItemsAndRemeasurementsNettingMember |
| Namespace Prefix: |
|
| Data Type: |
na |
| Balance Type: |
|
| Period Type: |
|
|
| X |
- Details
| Name: |
srt_StatementScenarioAxis=nggtf_ExceptionalItemsMember |
| Namespace Prefix: |
|
| Data Type: |
na |
| Balance Type: |
|
| Period Type: |
|
|
| X |
- Details
| Name: |
srt_StatementScenarioAxis=nggtf_RemeasurementsMember |
| Namespace Prefix: |
|
| Data Type: |
na |
| Balance Type: |
|
| Period Type: |
|
|
v3.23.3
Exceptional items and remeasurements - Narrative (Details)
£ in Millions, $ in Billions |
|
1 Months Ended |
6 Months Ended |
23 Months Ended |
|
May 25, 2022
GBP (£)
|
May 25, 2022
USD ($)
|
Nov. 30, 2021
GBP (£)
|
Sep. 30, 2023
GBP (£)
|
Sep. 30, 2022
GBP (£)
|
Sep. 30, 2023
GBP (£)
|
| Cost efficiency programme |
|
|
|
|
|
|
| Disclosure Of Exceptional Items [Line Items] |
|
|
|
|
|
|
| Cost efficiency programme, annual savings target |
|
|
£ 400
|
|
|
|
| Cost efficiency programme, period |
|
|
3 years
|
|
|
|
| Exceptional items |
|
|
|
|
|
|
| Disclosure Of Exceptional Items [Line Items] |
|
|
|
|
|
|
| Expense of restructuring activities |
|
|
|
£ 39
|
£ 61
|
|
| Transaction, separation and integration costs |
|
|
|
11
|
65
|
|
| Cash outflows relating to transaction, separation and integration costs |
|
|
|
9
|
59
|
|
| Income from insurance recovery |
|
|
|
92
|
33
|
|
| Cash inflows relating to insurance recovery |
|
|
|
0
|
33
|
|
| Gains on disposals of investments |
|
|
|
|
511
|
|
| Exceptional items | Cost efficiency programme |
|
|
|
|
|
|
| Disclosure Of Exceptional Items [Line Items] |
|
|
|
|
|
|
| Expense of restructuring activities |
|
|
|
39
|
61
|
£ 142
|
| Cash outflows relating to restructuring activities |
|
|
|
£ 28
|
£ 38
|
|
| Exceptional items | The Narragansett Electric Company |
|
|
|
|
|
|
| Disclosure Of Exceptional Items [Line Items] |
|
|
|
|
|
|
| Proportion of ownership interest disposed |
100.00%
|
100.00%
|
|
|
|
|
| Consideration received |
£ 3,100
|
$ 3.9
|
|
|
|
|
| X |
- DefinitionThe amount of consideration paid or received in respect of both obtaining and losing control of subsidiaries or other businesses. [Refer: Subsidiaries [member]] Reference 1: http://www.xbrl.org/2003/role/disclosureRef
-Name IAS
-Number 7
-IssueDate 2022-03-24
-Paragraph 40
-Subparagraph a
-URI https://taxonomy.ifrs.org/xifrs-link?type=IAS&num=7&code=ifrs-tx-2022-en-r&anchor=para_40_a&doctype=Standard
-URIDate 2022-03-24
| Name: |
ifrs-full_ConsiderationPaidReceived |
| Namespace Prefix: |
ifrs-full_ |
| Data Type: |
xbrli:monetaryItemType |
| Balance Type: |
credit |
| Period Type: |
duration |
|
| X |
- DefinitionThe amount of expense relating to restructuring. Restructuring is a programme that is planned and controlled by management and materially changes either the scope of a business undertaken by an entity or the manner in which that business is conducted. Such programmes include: (a) the sale or termination of a line of business; (b) closure of business locations in a country or region or the relocation of activities from one country or region to another; (c) changes in management structure; and (d) fundamental reorganisations that have a material effect on the nature and focus of the entity's operations. Reference 1: http://www.xbrl.org/2003/role/disclosureRef
-Name IAS
-Number 1
-IssueDate 2022-03-24
-Paragraph 98
-Subparagraph b
-URI https://taxonomy.ifrs.org/xifrs-link?type=IAS&num=1&code=ifrs-tx-2022-en-r&anchor=para_98_b&doctype=Standard
-URIDate 2022-03-24
| Name: |
ifrs-full_ExpenseOfRestructuringActivities |
| Namespace Prefix: |
ifrs-full_ |
| Data Type: |
xbrli:monetaryItemType |
| Balance Type: |
debit |
| Period Type: |
duration |
|
| X |
- DefinitionThe gain on the disposal of investments. Reference 1: http://www.xbrl.org/2003/role/disclosureRef
-Name IAS
-Number 1
-IssueDate 2022-03-24
-Paragraph 98
-Subparagraph d
-URI https://taxonomy.ifrs.org/xifrs-link?type=IAS&num=1&code=ifrs-tx-2022-en-r&anchor=para_98_d&doctype=Standard
-URIDate 2022-03-24
| Name: |
ifrs-full_GainsOnDisposalsOfInvestments |
| Namespace Prefix: |
ifrs-full_ |
| Data Type: |
xbrli:monetaryItemType |
| Balance Type: |
credit |
| Period Type: |
duration |
|
| X |
- DefinitionThe amount of income recognised from the reimbursement of a claim as a result of the occurrence of an insured event covered by an insurance contract. [Refer: Types of insurance contracts [member]] Reference 1: http://www.xbrl.org/2009/role/commonPracticeRef
-Name IAS
-Number 1
-IssueDate 2022-03-24
-Paragraph 112
-Subparagraph c
-URI https://taxonomy.ifrs.org/xifrs-link?type=IAS&num=1&code=ifrs-tx-2022-en-r&anchor=para_112_c&doctype=Standard
-URIDate 2022-03-24
| Name: |
ifrs-full_IncomeFromReimbursementsUnderInsurancePolicies |
| Namespace Prefix: |
ifrs-full_ |
| Data Type: |
xbrli:monetaryItemType |
| Balance Type: |
credit |
| Period Type: |
duration |
|
| X |
- DefinitionCash Inflows Relating To Insurance Recovery
| Name: |
nggtf_CashInflowsRelatingToInsuranceRecovery |
| Namespace Prefix: |
nggtf_ |
| Data Type: |
xbrli:monetaryItemType |
| Balance Type: |
debit |
| Period Type: |
duration |
|
| X |
- DefinitionCash Outflows Relating To Restructuring Activities, Operating Activities
| Name: |
nggtf_CashOutflowsRelatingToRestructuringActivitiesOperatingActivities |
| Namespace Prefix: |
nggtf_ |
| Data Type: |
xbrli:monetaryItemType |
| Balance Type: |
credit |
| Period Type: |
duration |
|
| X |
- DefinitionCash Outflows Relating To Transaction, Separation And Integration Costs, Operating Activities
| Name: |
nggtf_CashOutflowsRelatingToTransactionSeparationAndIntegrationCostsOperatingActivities |
| Namespace Prefix: |
nggtf_ |
| Data Type: |
xbrli:monetaryItemType |
| Balance Type: |
credit |
| Period Type: |
duration |
|
| X |
- DefinitionCost Efficiency Programme, Annual Savings, Target
| Name: |
nggtf_CostEfficiencyProgrammeAnnualSavingsTarget |
| Namespace Prefix: |
nggtf_ |
| Data Type: |
xbrli:monetaryItemType |
| Balance Type: |
debit |
| Period Type: |
duration |
|
| X |
- DefinitionCost Efficiency Programme, Period
| Name: |
nggtf_CostEfficiencyProgrammePeriod |
| Namespace Prefix: |
nggtf_ |
| Data Type: |
xbrli:durationItemType |
| Balance Type: |
na |
| Period Type: |
duration |
|
| X |
- DefinitionDisclosure Of Exceptional Items
| Name: |
nggtf_DisclosureOfExceptionalItemsLineItems |
| Namespace Prefix: |
nggtf_ |
| Data Type: |
xbrli:stringItemType |
| Balance Type: |
na |
| Period Type: |
duration |
|
| X |
- DefinitionProportion Of Ownership Interest Disposed
| Name: |
nggtf_ProportionOfOwnershipInterestDisposed |
| Namespace Prefix: |
nggtf_ |
| Data Type: |
dtr-types:percentItemType |
| Balance Type: |
na |
| Period Type: |
duration |
|
| X |
- DefinitionTransaction, Separation And Integration Costs
| Name: |
nggtf_TransactionSeparationAndIntegrationCosts |
| Namespace Prefix: |
nggtf_ |
| Data Type: |
xbrli:monetaryItemType |
| Balance Type: |
debit |
| Period Type: |
duration |
|
| X |
- Details
| Name: |
nggtf_RestructuringActivitiesAxis=nggtf_CostEfficiencyProgrammeMember |
| Namespace Prefix: |
|
| Data Type: |
na |
| Balance Type: |
|
| Period Type: |
|
|
| X |
- Details
| Name: |
srt_StatementScenarioAxis=nggtf_ExceptionalItemsMember |
| Namespace Prefix: |
|
| Data Type: |
na |
| Balance Type: |
|
| Period Type: |
|
|
| X |
- Details
| Name: |
ifrs-full_SignificantInvestmentsInSubsidiariesAxis=nggtf_TheNarragansettElectricCompanyMember |
| Namespace Prefix: |
|
| Data Type: |
na |
| Balance Type: |
|
| Period Type: |
|
|
v3.23.3
| X |
- DefinitionThe weighted average of interest and other costs that an entity incurs in connection with the borrowing of funds applicable to the borrowings of the entity that are outstanding during the period, other than borrowings made specifically for the purpose of obtaining a qualifying asset. [Refer: Weighted average [member]; Borrowings] Reference 1: http://www.xbrl.org/2003/role/disclosureRef
-Name IAS
-Number 23
-IssueDate 2022-03-24
-Paragraph 26
-Subparagraph b
-URI https://taxonomy.ifrs.org/xifrs-link?type=IAS&num=23&code=ifrs-tx-2022-en-r&anchor=para_26_b&doctype=Standard
-URIDate 2022-03-24
| Name: |
ifrs-full_CapitalisationRateOfBorrowingCostsEligibleForCapitalisation |
| Namespace Prefix: |
ifrs-full_ |
| Data Type: |
dtr-types:percentItemType |
| Balance Type: |
na |
| Period Type: |
duration |
|
| X |
- DefinitionThe amount of expense recognised due to the unwinding of the discount on provisions other than provisions from employee benefits, resulting from the effect of the passage of time. [Refer: Other provisions] Reference 1: http://www.xbrl.org/2009/role/commonPracticeRef
-Name IAS
-Number 1
-IssueDate 2022-03-24
-Paragraph 112
-Subparagraph c
-URI https://taxonomy.ifrs.org/xifrs-link?type=IAS&num=1&code=ifrs-tx-2022-en-r&anchor=para_112_c&doctype=Standard
-URIDate 2022-03-24
| Name: |
ifrs-full_ExpenseDueToUnwindingOfDiscountOnProvisions |
| Namespace Prefix: |
ifrs-full_ |
| Data Type: |
xbrli:monetaryItemType |
| Balance Type: |
debit |
| Period Type: |
duration |
|
| X |
- DefinitionThe amount of costs associated with financing activities of the entity. Reference 1: http://www.xbrl.org/2003/role/disclosureRef
-Name IAS
-Number 1
-IssueDate 2022-03-24
-Paragraph 82
-Subparagraph b
-URI https://taxonomy.ifrs.org/xifrs-link?type=IAS&num=1&code=ifrs-tx-2022-en-r&anchor=para_82_b&doctype=Standard
-URIDate 2022-03-24
| Name: |
ifrs-full_FinanceCosts |
| Namespace Prefix: |
ifrs-full_ |
| Data Type: |
xbrli:monetaryItemType |
| Balance Type: |
debit |
| Period Type: |
duration |
|
| X |
- DefinitionThe amount of income associated with interest and other financing activities of the entity. Reference 1: http://www.xbrl.org/2009/role/commonPracticeRef
-Name IAS
-Number 1
-IssueDate 2022-03-24
-Paragraph 85
-URI https://taxonomy.ifrs.org/xifrs-link?type=IAS&num=1&code=ifrs-tx-2022-en-r&anchor=para_85&doctype=Standard
-URIDate 2022-03-24
| Name: |
ifrs-full_FinanceIncome |
| Namespace Prefix: |
ifrs-full_ |
| Data Type: |
xbrli:monetaryItemType |
| Balance Type: |
credit |
| Period Type: |
duration |
|
| X |
- DefinitionThe amount of income or cost associated with interest and other financing activities of the entity. Reference 1: http://www.xbrl.org/2009/role/commonPracticeRef
-Name IAS
-Number 1
-IssueDate 2022-03-24
-Paragraph 85
-URI https://taxonomy.ifrs.org/xifrs-link?type=IAS&num=1&code=ifrs-tx-2022-en-r&anchor=para_85&doctype=Standard
-URIDate 2022-03-24
| Name: |
ifrs-full_FinanceIncomeCost |
| Namespace Prefix: |
ifrs-full_ |
| Data Type: |
xbrli:monetaryItemType |
| Balance Type: |
credit |
| Period Type: |
duration |
|
| X |
- DefinitionThe gains (losses) on financial assets at fair value through profit or loss. [Refer: Financial assets at fair value through profit or loss] Reference 1: http://www.xbrl.org/2003/role/disclosureRef
-Name IFRS
-Number 7
-IssueDate 2022-03-24
-Paragraph 20
-Subparagraph a
-Clause i
-URI https://taxonomy.ifrs.org/xifrs-link?type=IFRS&num=7&code=ifrs-tx-2022-en-r&anchor=para_20_a_i&doctype=Standard
-URIDate 2022-03-24
| Name: |
ifrs-full_GainsLossesOnFinancialAssetsAtFairValueThroughProfitOrLoss |
| Namespace Prefix: |
ifrs-full_ |
| Data Type: |
xbrli:monetaryItemType |
| Balance Type: |
credit |
| Period Type: |
duration |
|
| X |
- References
+ Details
| Name: |
ifrs-full_InterestCostsAbstract |
| Namespace Prefix: |
ifrs-full_ |
| Data Type: |
xbrli:stringItemType |
| Balance Type: |
na |
| Period Type: |
duration |
|
| X |
- DefinitionThe amount of interest costs that an entity incurs in connection with the borrowing of funds that are directly attributable to the acquisition, construction or production of a qualifying asset and which form part of the cost of that asset. Reference 1: http://www.xbrl.org/2009/role/commonPracticeRef
-Name IAS
-Number 1
-IssueDate 2022-03-24
-Paragraph 112
-Subparagraph c
-URI https://taxonomy.ifrs.org/xifrs-link?type=IAS&num=1&code=ifrs-tx-2022-en-r&anchor=para_112_c&doctype=Standard
-URIDate 2022-03-24
| Name: |
ifrs-full_InterestCostsCapitalised |
| Namespace Prefix: |
ifrs-full_ |
| Data Type: |
xbrli:monetaryItemType |
| Balance Type: |
na |
| Period Type: |
duration |
|
| X |
- DefinitionThe amount of interest expense (income) arising from defined benefit plans. [Refer: Interest income (expense); Post-employment benefit expense in profit or loss, defined benefit plans] [Contrast: Increase (decrease) in net defined benefit liability (asset) resulting from interest expense (income)] Reference 1: http://www.xbrl.org/2009/role/commonPracticeRef
-Name IAS
-Number 19
-IssueDate 2022-03-24
-Paragraph 135
-Subparagraph b
-URI https://taxonomy.ifrs.org/xifrs-link?type=IAS&num=19&code=ifrs-tx-2022-en-r&anchor=para_135_b&doctype=Standard
-URIDate 2022-03-24
| Name: |
ifrs-full_InterestExpenseIncomeDefinedBenefitPlans |
| Namespace Prefix: |
ifrs-full_ |
| Data Type: |
xbrli:monetaryItemType |
| Balance Type: |
debit |
| Period Type: |
duration |
|
| X |
- DefinitionThe amount of interest expense on debt instruments issued. [Refer: Interest expense; Debt instruments issued] Reference 1: http://www.xbrl.org/2009/role/commonPracticeRef
-Name IAS
-Number 1
-IssueDate 2022-03-24
-Paragraph 112
-Subparagraph c
-URI https://taxonomy.ifrs.org/xifrs-link?type=IAS&num=1&code=ifrs-tx-2022-en-r&anchor=para_112_c&doctype=Standard
-URIDate 2022-03-24
| Name: |
ifrs-full_InterestExpenseOnDebtInstrumentsIssued |
| Namespace Prefix: |
ifrs-full_ |
| Data Type: |
xbrli:monetaryItemType |
| Balance Type: |
debit |
| Period Type: |
duration |
|
| X |
- DefinitionThe amount of interest income on debt instruments held. [Refer: Interest income; Debt instruments held] Reference 1: http://www.xbrl.org/2009/role/commonPracticeRef
-Name IAS
-Number 1
-IssueDate 2022-03-24
-Paragraph 112
-Subparagraph c
-URI https://taxonomy.ifrs.org/xifrs-link?type=IAS&num=1&code=ifrs-tx-2022-en-r&anchor=para_112_c&doctype=Standard
-URIDate 2022-03-24
| Name: |
ifrs-full_InterestIncomeOnDebtInstrumentsHeld |
| Namespace Prefix: |
ifrs-full_ |
| Data Type: |
xbrli:monetaryItemType |
| Balance Type: |
credit |
| Period Type: |
duration |
|
| X |
- DefinitionThe amount of interest income on other financial assets. [Refer: Interest income; Other financial assets] Reference 1: http://www.xbrl.org/2009/role/commonPracticeRef
-Name IAS
-Number 1
-IssueDate 2022-03-24
-Paragraph 112
-Subparagraph c
-URI https://taxonomy.ifrs.org/xifrs-link?type=IAS&num=1&code=ifrs-tx-2022-en-r&anchor=para_112_c&doctype=Standard
-URIDate 2022-03-24
| Name: |
ifrs-full_InterestIncomeOnOtherFinancialAssets |
| Namespace Prefix: |
ifrs-full_ |
| Data Type: |
xbrli:monetaryItemType |
| Balance Type: |
credit |
| Period Type: |
duration |
|
| X |
- DefinitionFinance Cost, Accretion On Inflation-Linked Debt, Expense (Income)
| Name: |
nggtf_FinanceCostAccretionOnInflationLinkedDebtExpenseIncome |
| Namespace Prefix: |
nggtf_ |
| Data Type: |
xbrli:monetaryItemType |
| Balance Type: |
debit |
| Period Type: |
duration |
|
| X |
- DefinitionFinance Cost, Accretion On Inflation-Linked Swaps, Expense (Income)
| Name: |
nggtf_FinanceCostAccretionOnInflationLinkedSwapsExpenseIncome |
| Namespace Prefix: |
nggtf_ |
| Data Type: |
xbrli:monetaryItemType |
| Balance Type: |
debit |
| Period Type: |
duration |
|
| X |
- DefinitionFinance Income [Abstract]
| Name: |
nggtf_FinanceIncomeAbstract |
| Namespace Prefix: |
nggtf_ |
| Data Type: |
xbrli:stringItemType |
| Balance Type: |
na |
| Period Type: |
duration |
|
| X |
- DefinitionGains (Losses) On Derivatives Financial Instruments, Finance Cost
| Name: |
nggtf_GainsLossesOnDerivativesFinancialInstrumentsFinanceCost |
| Namespace Prefix: |
nggtf_ |
| Data Type: |
xbrli:monetaryItemType |
| Balance Type: |
credit |
| Period Type: |
duration |
|
| X |
- DefinitionNet Interest Expense (Income) On Other Financial Liabilities
| Name: |
nggtf_NetInterestExpenseIncomeOnOtherFinancialLiabilities |
| Namespace Prefix: |
nggtf_ |
| Data Type: |
xbrli:monetaryItemType |
| Balance Type: |
debit |
| Period Type: |
duration |
|
| X |
- DefinitionTax Relief On Capitalised Interest
| Name: |
nggtf_TaxReliefOnCapitalisedInterest |
| Namespace Prefix: |
nggtf_ |
| Data Type: |
xbrli:monetaryItemType |
| Balance Type: |
credit |
| Period Type: |
duration |
|
v3.23.3
Assets held for sale and discontinued operations - Schedule of assets and liabilities classified as held for sale (Details) - GBP (£)
£ in Millions |
Sep. 30, 2023 |
Mar. 31, 2023 |
| Disclosure Of Detailed Information About Assets Held For Sale [Line Items] |
|
|
| Assets held for sale |
£ 1,441
|
£ 1,443
|
| Liabilities held for sale |
(51)
|
(109)
|
| Assets and liabilities classified as held for sale |
|
|
| Disclosure Of Detailed Information About Assets Held For Sale [Line Items] |
|
|
| Assets held for sale |
1,441
|
1,443
|
| Liabilities held for sale |
(51)
|
(109)
|
| Net assets held for sale |
1,390
|
1,334
|
| Assets and liabilities classified as held for sale | FAA option |
|
|
| Disclosure Of Detailed Information About Assets Held For Sale [Line Items] |
|
|
| Assets held for sale |
0
|
0
|
| Liabilities held for sale |
0
|
(109)
|
| Net assets held for sale |
0
|
(109)
|
| Assets and liabilities classified as held for sale | FAA forward |
|
|
| Disclosure Of Detailed Information About Assets Held For Sale [Line Items] |
|
|
| Assets held for sale |
0
|
0
|
| Liabilities held for sale |
(7)
|
0
|
| Net assets held for sale |
(7)
|
0
|
| Assets and liabilities classified as held for sale | RAA option |
|
|
| Disclosure Of Detailed Information About Assets Held For Sale [Line Items] |
|
|
| Assets held for sale |
0
|
0
|
| Liabilities held for sale |
(44)
|
0
|
| Net assets held for sale |
(44)
|
0
|
| Assets and liabilities classified as held for sale | GasT TopCo Limited |
|
|
| Disclosure Of Detailed Information About Assets Held For Sale [Line Items] |
|
|
| Assets held for sale |
1,441
|
1,443
|
| Liabilities held for sale |
0
|
0
|
| Net assets held for sale |
£ 1,441
|
£ 1,443
|
| X |
- DefinitionThe amount of liabilities included in disposal groups classified as held for sale. [Refer: Liabilities; Disposal groups classified as held for sale [member]] Reference 1: http://www.xbrl.org/2003/role/disclosureRef
-Name IFRS
-Number 5
-IssueDate 2022-03-24
-Paragraph 38
-URI https://taxonomy.ifrs.org/xifrs-link?type=IFRS&num=5&code=ifrs-tx-2022-en-r&anchor=para_38&doctype=Standard
-URIDate 2022-03-24
Reference 2: http://www.xbrl.org/2003/role/disclosureRef
-Name IAS
-Number 1
-IssueDate 2022-03-24
-Paragraph 54
-Subparagraph p
-URI https://taxonomy.ifrs.org/xifrs-link?type=IAS&num=1&code=ifrs-tx-2022-en-r&anchor=para_54_p&doctype=Standard
-URIDate 2022-03-24
| Name: |
ifrs-full_LiabilitiesIncludedInDisposalGroupsClassifiedAsHeldForSale |
| Namespace Prefix: |
ifrs-full_ |
| Data Type: |
xbrli:monetaryItemType |
| Balance Type: |
credit |
| Period Type: |
instant |
|
| X |
- DefinitionThe amount of non-current assets or disposal groups classified as held for sale. [Refer: Disposal groups classified as held for sale [member]] Reference 1: http://www.xbrl.org/2003/role/disclosureRef
-Name IFRS
-Number 5
-IssueDate 2022-03-24
-Paragraph 38
-URI https://taxonomy.ifrs.org/xifrs-link?type=IFRS&num=5&code=ifrs-tx-2022-en-r&anchor=para_38&doctype=Standard
-URIDate 2022-03-24
| Name: |
ifrs-full_NoncurrentAssetsOrDisposalGroupsClassifiedAsHeldForSale |
| Namespace Prefix: |
ifrs-full_ |
| Data Type: |
xbrli:monetaryItemType |
| Balance Type: |
debit |
| Period Type: |
instant |
|
| X |
- DefinitionNet Assets (Liabilities) Classified As Held For Sale
| Name: |
nggtf_NetAssetsLiabilitiesClassifiedAsHeldForSale |
| Namespace Prefix: |
nggtf_ |
| Data Type: |
xbrli:monetaryItemType |
| Balance Type: |
debit |
| Period Type: |
instant |
|
| X |
- Details
| Name: |
ifrs-full_AssetsAndLiabilitiesClassifiedAsHeldForSaleAxis=ifrs-full_AssetsAndLiabilitiesClassifiedAsHeldForSaleMember |
| Namespace Prefix: |
|
| Data Type: |
na |
| Balance Type: |
|
| Period Type: |
|
|
| X |
- Details
| Name: |
ifrs-full_ClassesOfFinancialInstrumentsAxis=nggtf_FAAOptionsMember |
| Namespace Prefix: |
|
| Data Type: |
na |
| Balance Type: |
|
| Period Type: |
|
|
| X |
- Details
| Name: |
ifrs-full_ClassesOfFinancialInstrumentsAxis=nggtf_FAAForwardMember |
| Namespace Prefix: |
|
| Data Type: |
na |
| Balance Type: |
|
| Period Type: |
|
|
| X |
- Details
| Name: |
ifrs-full_ClassesOfFinancialInstrumentsAxis=nggtf_RAAOptionsMember |
| Namespace Prefix: |
|
| Data Type: |
na |
| Balance Type: |
|
| Period Type: |
|
|
| X |
- Details
| Name: |
ifrs-full_SignificantInvestmentsInAssociatesAxis=nggtf_GasTTopCoLimitedMember |
| Namespace Prefix: |
|
| Data Type: |
na |
| Balance Type: |
|
| Period Type: |
|
|
v3.23.3
| X |
- DefinitionThe portion of consideration paid or received, consisting of cash and cash equivalents, in respect of both obtaining and losing control of subsidiaries or other businesses. [Refer: Subsidiaries [member]; Cash and cash equivalents; Consideration paid (received)] Reference 1: http://www.xbrl.org/2003/role/disclosureRef
-Name IAS
-Number 7
-IssueDate 2022-03-24
-Paragraph 40
-Subparagraph b
-URI https://taxonomy.ifrs.org/xifrs-link?type=IAS&num=7&code=ifrs-tx-2022-en-r&anchor=para_40_b&doctype=Standard
-URIDate 2022-03-24
| Name: |
ifrs-full_PortionOfConsiderationPaidReceivedConsistingOfCashAndCashEquivalents |
| Namespace Prefix: |
ifrs-full_ |
| Data Type: |
xbrli:monetaryItemType |
| Balance Type: |
credit |
| Period Type: |
duration |
|
| X |
- DefinitionThe proportion of ownership interest in an associate attributable to the entity. [Refer: Associates [member]] Reference 1: http://www.xbrl.org/2003/role/disclosureRef
-Name IAS
-Number 27
-IssueDate 2022-03-24
-Paragraph 17
-Subparagraph b
-Clause iii
-URI https://taxonomy.ifrs.org/xifrs-link?type=IAS&num=27&code=ifrs-tx-2022-en-r&anchor=para_17_b_iii&doctype=Standard
-URIDate 2022-03-24
Reference 2: http://www.xbrl.org/2003/role/disclosureRef
-Name IAS
-Number 27
-IssueDate 2022-03-24
-Paragraph 16
-Subparagraph b
-Clause iii
-URI https://taxonomy.ifrs.org/xifrs-link?type=IAS&num=27&code=ifrs-tx-2022-en-r&anchor=para_16_b_iii&doctype=Standard
-URIDate 2022-03-24
Reference 3: http://www.xbrl.org/2003/role/disclosureRef
-Name IFRS
-Number 12
-IssueDate 2022-03-24
-Paragraph 21
-Subparagraph a
-Clause iv
-URI https://taxonomy.ifrs.org/xifrs-link?type=IFRS&num=12&code=ifrs-tx-2022-en-r&anchor=para_21_a_iv&doctype=Standard
-URIDate 2022-03-24
| Name: |
ifrs-full_ProportionOfOwnershipInterestInAssociate |
| Namespace Prefix: |
ifrs-full_ |
| Data Type: |
dtr-types:percentItemType |
| Balance Type: |
na |
| Period Type: |
duration |
|
| X |
- DefinitionPortion Of Consideration Received Consisting Of Shareholding In Acquirer, Percentage
| Name: |
nggtf_PortionOfConsiderationReceivedConsistingOfShareholdingInAcquirerPercentage |
| Namespace Prefix: |
nggtf_ |
| Data Type: |
dtr-types:percentItemType |
| Balance Type: |
na |
| Period Type: |
instant |
|
| X |
- DefinitionProportion Of Ownership Interest Disposed
| Name: |
nggtf_ProportionOfOwnershipInterestDisposed |
| Namespace Prefix: |
nggtf_ |
| Data Type: |
dtr-types:percentItemType |
| Balance Type: |
na |
| Period Type: |
duration |
|
| X |
- Details
| Name: |
ifrs-full_SignificantInvestmentsInAssociatesAxis=nggtf_GasTTopCoLimitedMember |
| Namespace Prefix: |
|
| Data Type: |
na |
| Balance Type: |
|
| Period Type: |
|
|
| X |
- Details
| Name: |
dei_LegalEntityAxis=nggtf_MacquarieInfrastructureAndRealAssetsMIRAAndBritishColumbiaInvestmentManagementCorporationBCIMember |
| Namespace Prefix: |
|
| Data Type: |
na |
| Balance Type: |
|
| Period Type: |
|
|
| X |
- Details
| Name: |
ifrs-full_SignificantInvestmentsInSubsidiariesAxis=nggtf_UKGasTransmissionMember |
| Namespace Prefix: |
|
| Data Type: |
na |
| Balance Type: |
|
| Period Type: |
|
|
v3.23.3
| X |
- DefinitionLine items represent concepts included in a table. These concepts are used to disclose reportable information associated with members defined in one or many axes of the table.
| Name: |
ifrs-full_DisclosureOfAnalysisOfSingleAmountOfDiscontinuedOperationsLineItems |
| Namespace Prefix: |
ifrs-full_ |
| Data Type: |
xbrli:stringItemType |
| Balance Type: |
na |
| Period Type: |
duration |
|
| X |
- DefinitionThe amount of costs associated with financing activities of the entity. Reference 1: http://www.xbrl.org/2003/role/disclosureRef
-Name IAS
-Number 1
-IssueDate 2022-03-24
-Paragraph 82
-Subparagraph b
-URI https://taxonomy.ifrs.org/xifrs-link?type=IAS&num=1&code=ifrs-tx-2022-en-r&anchor=para_82_b&doctype=Standard
-URIDate 2022-03-24
| Name: |
ifrs-full_FinanceCosts |
| Namespace Prefix: |
ifrs-full_ |
| Data Type: |
xbrli:monetaryItemType |
| Balance Type: |
debit |
| Period Type: |
duration |
|
| X |
- DefinitionThe amount of income associated with interest and other financing activities of the entity. Reference 1: http://www.xbrl.org/2009/role/commonPracticeRef
-Name IAS
-Number 1
-IssueDate 2022-03-24
-Paragraph 85
-URI https://taxonomy.ifrs.org/xifrs-link?type=IAS&num=1&code=ifrs-tx-2022-en-r&anchor=para_85&doctype=Standard
-URIDate 2022-03-24
| Name: |
ifrs-full_FinanceIncome |
| Namespace Prefix: |
ifrs-full_ |
| Data Type: |
xbrli:monetaryItemType |
| Balance Type: |
credit |
| Period Type: |
duration |
|
| X |
- DefinitionThe amount of all operating expenses. Reference 1: http://www.xbrl.org/2009/role/commonPracticeRef
-Name IAS
-Number 1
-IssueDate 2022-03-24
-Paragraph 85
-URI https://taxonomy.ifrs.org/xifrs-link?type=IAS&num=1&code=ifrs-tx-2022-en-r&anchor=para_85&doctype=Standard
-URIDate 2022-03-24
| Name: |
ifrs-full_OperatingExpense |
| Namespace Prefix: |
ifrs-full_ |
| Data Type: |
xbrli:monetaryItemType |
| Balance Type: |
debit |
| Period Type: |
duration |
|
| X |
- DefinitionThe profit (loss) before tax expense or income. [Refer: Profit (loss)] Reference 1: http://www.xbrl.org/2003/role/exampleRef
-Name IFRS
-Number 8
-IssueDate 2022-03-24
-Paragraph 28
-Subparagraph b
-URI https://taxonomy.ifrs.org/xifrs-link?type=IFRS&num=8&code=ifrs-tx-2022-en-r&anchor=para_28_b&doctype=Standard
-URIDate 2022-03-24
Reference 2: http://www.xbrl.org/2003/role/exampleRef
-Name IFRS
-Number 8
-IssueDate 2022-03-24
-Paragraph 23
-URI https://taxonomy.ifrs.org/xifrs-link?type=IFRS&num=8&code=ifrs-tx-2022-en-r&anchor=para_23&doctype=Standard
-URIDate 2022-03-24
Reference 3: http://www.xbrl.org/2003/role/disclosureRef
-Name IFRS
-Number 5
-IssueDate 2022-03-24
-Paragraph 33
-Subparagraph b
-Clause i
-URI https://taxonomy.ifrs.org/xifrs-link?type=IFRS&num=5&code=ifrs-tx-2022-en-r&anchor=para_33_b_i&doctype=Standard
-URIDate 2022-03-24
Reference 4: http://www.xbrl.org/2003/role/exampleRef
-Name IAS
-Number 1
-IssueDate 2022-03-24
-Paragraph 103
-URI https://taxonomy.ifrs.org/xifrs-link?type=IAS&num=1&code=ifrs-tx-2022-en-r&anchor=para_103&doctype=Standard
-URIDate 2022-03-24
Reference 5: http://www.xbrl.org/2003/role/exampleRef
-Name IAS
-Number 1
-IssueDate 2022-03-24
-Paragraph 102
-URI https://taxonomy.ifrs.org/xifrs-link?type=IAS&num=1&code=ifrs-tx-2022-en-r&anchor=para_102&doctype=Standard
-URIDate 2022-03-24
| Name: |
ifrs-full_ProfitLossBeforeTax |
| Namespace Prefix: |
ifrs-full_ |
| Data Type: |
xbrli:monetaryItemType |
| Balance Type: |
credit |
| Period Type: |
duration |
|
| X |
- DefinitionThe profit (loss) from discontinued operations. [Refer: Discontinued operations [member]; Profit (loss)] Reference 1: http://www.xbrl.org/2003/role/disclosureRef
-Name IFRS
-Number 5
-IssueDate 2022-03-24
-Paragraph 33
-Subparagraph a
-URI https://taxonomy.ifrs.org/xifrs-link?type=IFRS&num=5&code=ifrs-tx-2022-en-r&anchor=para_33_a&doctype=Standard
-URIDate 2022-03-24
Reference 2: http://www.xbrl.org/2003/role/disclosureRef
-Name IFRS
-Number 12
-IssueDate 2022-03-24
-Paragraph B12
-Subparagraph b
-Clause vii
-URI https://taxonomy.ifrs.org/xifrs-link?type=IFRS&num=12&code=ifrs-tx-2022-en-r&anchor=para_B12_b_vii&doctype=Appendix&subtype=B
-URIDate 2022-03-24
Reference 3: http://www.xbrl.org/2003/role/disclosureRef
-Name IAS
-Number 1
-IssueDate 2022-03-24
-Paragraph 82
-Subparagraph ea
-URI https://taxonomy.ifrs.org/xifrs-link?type=IAS&num=1&code=ifrs-tx-2022-en-r&anchor=para_82_ea&doctype=Standard
-URIDate 2022-03-24
Reference 4: http://www.xbrl.org/2003/role/disclosureRef
-Name IAS
-Number 1
-IssueDate 2022-03-24
-Paragraph 98
-Subparagraph e
-URI https://taxonomy.ifrs.org/xifrs-link?type=IAS&num=1&code=ifrs-tx-2022-en-r&anchor=para_98_e&doctype=Standard
-URIDate 2022-03-24
| Name: |
ifrs-full_ProfitLossFromDiscontinuedOperations |
| Namespace Prefix: |
ifrs-full_ |
| Data Type: |
xbrli:monetaryItemType |
| Balance Type: |
credit |
| Period Type: |
duration |
|
| X |
- DefinitionThe profit (loss) from operating activities of the entity. [Refer: Profit (loss)] Reference 1: http://www.xbrl.org/2003/role/exampleRef
-Name IAS
-Number 32
-IssueDate 2022-03-24
-Paragraph IE33
-URI https://taxonomy.ifrs.org/xifrs-link?type=IAS&num=32&code=ifrs-tx-2022-en-r&anchor=para_IE33&doctype=Illustrative%20Examples
-URIDate 2022-03-24
Reference 2: http://www.xbrl.org/2009/role/commonPracticeRef
-Name IAS
-Number 1
-IssueDate 2022-03-24
-Paragraph 85
-URI https://taxonomy.ifrs.org/xifrs-link?type=IAS&num=1&code=ifrs-tx-2022-en-r&anchor=para_85&doctype=Standard
-URIDate 2022-03-24
| Name: |
ifrs-full_ProfitLossFromOperatingActivities |
| Namespace Prefix: |
ifrs-full_ |
| Data Type: |
xbrli:monetaryItemType |
| Balance Type: |
credit |
| Period Type: |
duration |
|
| X |
- DefinitionThe income arising in the course of an entity's ordinary activities. Income is increases in assets, or decreases in liabilities, that result in increases in equity, other than those relating to contributions from holders of equity claims. Reference 1: http://www.xbrl.org/2003/role/disclosureRef
-Name IFRS
-Number 8
-IssueDate 2022-03-24
-Paragraph 28
-Subparagraph a
-URI https://taxonomy.ifrs.org/xifrs-link?type=IFRS&num=8&code=ifrs-tx-2022-en-r&anchor=para_28_a&doctype=Standard
-URIDate 2022-03-24
Reference 2: http://www.xbrl.org/2003/role/disclosureRef
-Name IFRS
-Number 8
-IssueDate 2022-03-24
-Paragraph 23
-Subparagraph a
-URI https://taxonomy.ifrs.org/xifrs-link?type=IFRS&num=8&code=ifrs-tx-2022-en-r&anchor=para_23_a&doctype=Standard
-URIDate 2022-03-24
Reference 3: http://www.xbrl.org/2003/role/disclosureRef
-Name IFRS
-Number 8
-IssueDate 2022-03-24
-Paragraph 32
-URI https://taxonomy.ifrs.org/xifrs-link?type=IFRS&num=8&code=ifrs-tx-2022-en-r&anchor=para_32&doctype=Standard
-URIDate 2022-03-24
Reference 4: http://www.xbrl.org/2003/role/disclosureRef
-Name IFRS
-Number 8
-IssueDate 2022-03-24
-Paragraph 33
-Subparagraph a
-URI https://taxonomy.ifrs.org/xifrs-link?type=IFRS&num=8&code=ifrs-tx-2022-en-r&anchor=para_33_a&doctype=Standard
-URIDate 2022-03-24
Reference 5: http://www.xbrl.org/2003/role/disclosureRef
-Name IFRS
-Number 8
-IssueDate 2022-03-24
-Paragraph 34
-URI https://taxonomy.ifrs.org/xifrs-link?type=IFRS&num=8&code=ifrs-tx-2022-en-r&anchor=para_34&doctype=Standard
-URIDate 2022-03-24
Reference 6: http://www.xbrl.org/2003/role/disclosureRef
-Name IFRS
-Number 5
-IssueDate 2022-03-24
-Paragraph 33
-Subparagraph b
-Clause i
-URI https://taxonomy.ifrs.org/xifrs-link?type=IFRS&num=5&code=ifrs-tx-2022-en-r&anchor=para_33_b_i&doctype=Standard
-URIDate 2022-03-24
Reference 7: http://www.xbrl.org/2003/role/disclosureRef
-Name IFRS
-Number 12
-IssueDate 2022-03-24
-Paragraph B12
-Subparagraph b
-Clause v
-URI https://taxonomy.ifrs.org/xifrs-link?type=IFRS&num=12&code=ifrs-tx-2022-en-r&anchor=para_B12_b_v&doctype=Appendix&subtype=B
-URIDate 2022-03-24
Reference 8: http://www.xbrl.org/2003/role/exampleRef
-Name IFRS
-Number 12
-IssueDate 2022-03-24
-Paragraph B10
-Subparagraph b
-URI https://taxonomy.ifrs.org/xifrs-link?type=IFRS&num=12&code=ifrs-tx-2022-en-r&anchor=para_B10_b&doctype=Appendix&subtype=B
-URIDate 2022-03-24
Reference 9: http://www.xbrl.org/2003/role/disclosureRef
-Name IAS
-Number 1
-IssueDate 2022-03-24
-Paragraph 82
-Subparagraph a
-URI https://taxonomy.ifrs.org/xifrs-link?type=IAS&num=1&code=ifrs-tx-2022-en-r&anchor=para_82_a&doctype=Standard
-URIDate 2022-03-24
Reference 10: http://www.xbrl.org/2003/role/exampleRef
-Name IAS
-Number 1
-IssueDate 2022-03-24
-Paragraph 103
-URI https://taxonomy.ifrs.org/xifrs-link?type=IAS&num=1&code=ifrs-tx-2022-en-r&anchor=para_103&doctype=Standard
-URIDate 2022-03-24
Reference 11: http://www.xbrl.org/2003/role/exampleRef
-Name IAS
-Number 1
-IssueDate 2022-03-24
-Paragraph 102
-URI https://taxonomy.ifrs.org/xifrs-link?type=IAS&num=1&code=ifrs-tx-2022-en-r&anchor=para_102&doctype=Standard
-URIDate 2022-03-24
| Name: |
ifrs-full_Revenue |
| Namespace Prefix: |
ifrs-full_ |
| Data Type: |
xbrli:monetaryItemType |
| Balance Type: |
credit |
| Period Type: |
duration |
|
| X |
- DefinitionThe tax expense (income) relating to the profit (loss) arising from ordinary activities of discontinued operations. [Refer: Discontinued operations [member]; Profit (loss)] Reference 1: http://www.xbrl.org/2003/role/disclosureRef
-Name IFRS
-Number 5
-IssueDate 2022-03-24
-Paragraph 33
-Subparagraph b
-Clause ii
-URI https://taxonomy.ifrs.org/xifrs-link?type=IFRS&num=5&code=ifrs-tx-2022-en-r&anchor=para_33_b_ii&doctype=Standard
-URIDate 2022-03-24
Reference 2: http://www.xbrl.org/2003/role/disclosureRef
-Name IAS
-Number 12
-IssueDate 2022-03-24
-Paragraph 81
-Subparagraph h
-Clause ii
-URI https://taxonomy.ifrs.org/xifrs-link?type=IAS&num=12&code=ifrs-tx-2022-en-r&anchor=para_81_h_ii&doctype=Standard
-URIDate 2022-03-24
| Name: |
ifrs-full_TaxExpenseRelatingToProfitLossFromOrdinaryActivitiesOfDiscontinuedOperations |
| Namespace Prefix: |
ifrs-full_ |
| Data Type: |
xbrli:monetaryItemType |
| Balance Type: |
debit |
| Period Type: |
duration |
|
| X |
- Details
| Name: |
ifrs-full_ContinuingAndDiscontinuedOperationsAxis=ifrs-full_DiscontinuedOperationsMember |
| Namespace Prefix: |
|
| Data Type: |
na |
| Balance Type: |
|
| Period Type: |
|
|
| X |
- Details
| Name: |
srt_StatementScenarioAxis=nggtf_AfterExceptionalItemsAndRemeasurementsNettingMember |
| Namespace Prefix: |
|
| Data Type: |
na |
| Balance Type: |
|
| Period Type: |
|
|
v3.23.3
| X |
- References
+ Details
| Name: |
ifrs-full_ComponentsOfOtherComprehensiveIncomeThatWillBeReclassifiedToProfitOrLossNetOfTaxAbstract |
| Namespace Prefix: |
ifrs-full_ |
| Data Type: |
xbrli:stringItemType |
| Balance Type: |
na |
| Period Type: |
duration |
|
| X |
- References
+ Details
| Name: |
ifrs-full_ComponentsOfOtherComprehensiveIncomeThatWillNotBeReclassifiedToProfitOrLossNetOfTaxAbstract |
| Namespace Prefix: |
ifrs-full_ |
| Data Type: |
xbrli:stringItemType |
| Balance Type: |
na |
| Period Type: |
duration |
|
| X |
- DefinitionThe amount of change in equity resulting from transactions and other events, other than those changes resulting from transactions with owners in their capacity as owners. Reference 1: http://www.xbrl.org/2003/role/disclosureRef
-Name IFRS
-Number 1
-IssueDate 2022-03-24
-Paragraph 32
-Subparagraph a
-Clause ii
-URI https://taxonomy.ifrs.org/xifrs-link?type=IFRS&num=1&code=ifrs-tx-2022-en-r&anchor=para_32_a_ii&doctype=Standard
-URIDate 2022-03-24
Reference 2: http://www.xbrl.org/2003/role/disclosureRef
-Name IFRS
-Number 1
-IssueDate 2022-03-24
-Paragraph 24
-Subparagraph b
-URI https://taxonomy.ifrs.org/xifrs-link?type=IFRS&num=1&code=ifrs-tx-2022-en-r&anchor=para_24_b&doctype=Standard
-URIDate 2022-03-24
Reference 3: http://www.xbrl.org/2003/role/disclosureRef
-Name IFRS
-Number 12
-IssueDate 2022-03-24
-Paragraph B12
-Subparagraph b
-Clause ix
-URI https://taxonomy.ifrs.org/xifrs-link?type=IFRS&num=12&code=ifrs-tx-2022-en-r&anchor=para_B12_b_ix&doctype=Appendix&subtype=B
-URIDate 2022-03-24
Reference 4: http://www.xbrl.org/2003/role/exampleRef
-Name IFRS
-Number 12
-IssueDate 2022-03-24
-Paragraph B10
-Subparagraph b
-URI https://taxonomy.ifrs.org/xifrs-link?type=IFRS&num=12&code=ifrs-tx-2022-en-r&anchor=para_B10_b&doctype=Appendix&subtype=B
-URIDate 2022-03-24
Reference 5: http://www.xbrl.org/2003/role/disclosureRef
-Name IAS
-Number 1
-IssueDate 2022-03-24
-Paragraph 81A
-Subparagraph c
-URI https://taxonomy.ifrs.org/xifrs-link?type=IAS&num=1&code=ifrs-tx-2022-en-r&anchor=para_81A_c&doctype=Standard
-URIDate 2022-03-24
Reference 6: http://www.xbrl.org/2003/role/disclosureRef
-Name IAS
-Number 1
-IssueDate 2022-03-24
-Paragraph 106
-Subparagraph a
-URI https://taxonomy.ifrs.org/xifrs-link?type=IAS&num=1&code=ifrs-tx-2022-en-r&anchor=para_106_a&doctype=Standard
-URIDate 2022-03-24
| Name: |
ifrs-full_ComprehensiveIncome |
| Namespace Prefix: |
ifrs-full_ |
| Data Type: |
xbrli:monetaryItemType |
| Balance Type: |
credit |
| Period Type: |
duration |
|
| X |
- DefinitionLine items represent concepts included in a table. These concepts are used to disclose reportable information associated with members defined in one or many axes of the table.
| Name: |
ifrs-full_DisclosureOfAnalysisOfSingleAmountOfDiscontinuedOperationsLineItems |
| Namespace Prefix: |
ifrs-full_ |
| Data Type: |
xbrli:stringItemType |
| Balance Type: |
na |
| Period Type: |
duration |
|
| X |
- DefinitionThe gains (losses) recognised in other comprehensive income on cash flow hedges, before tax, before reclassification adjustments. [Refer: Cash flow hedges [member]] Reference 1: http://www.xbrl.org/2003/role/disclosureRef
-Name IAS
-Number 1
-IssueDate 2022-03-24
-Paragraph 91
-Subparagraph b
-URI https://taxonomy.ifrs.org/xifrs-link?type=IAS&num=1&code=ifrs-tx-2022-en-r&anchor=para_91_b&doctype=Standard
-URIDate 2022-03-24
Reference 2: http://www.xbrl.org/2003/role/disclosureRef
-Note Expiry date 2023-01-01
-Name IFRS
-Number 7
-IssueDate 2022-03-24
-Paragraph 23
-Subparagraph c
-URI https://taxonomy.ifrs.org/xifrs-link?type=IFRS&num=7&code=ifrs-tx-2017-en-b&anchor=para_23_c&doctype=Standard&book=b
-URIDate 2022-03-24
| Name: |
ifrs-full_GainsLossesOnCashFlowHedgesBeforeTax |
| Namespace Prefix: |
ifrs-full_ |
| Data Type: |
xbrli:monetaryItemType |
| Balance Type: |
credit |
| Period Type: |
duration |
|
| X |
- DefinitionThe amount of income and expense (including reclassification adjustments) that is not recognised in profit or loss as required or permitted by IFRSs. [Refer: IFRSs [member]] Reference 1: http://www.xbrl.org/2003/role/disclosureRef
-Name IFRS
-Number 12
-IssueDate 2022-03-24
-Paragraph B12
-Subparagraph b
-Clause viii
-URI https://taxonomy.ifrs.org/xifrs-link?type=IFRS&num=12&code=ifrs-tx-2022-en-r&anchor=para_B12_b_viii&doctype=Appendix&subtype=B
-URIDate 2022-03-24
Reference 2: http://www.xbrl.org/2003/role/disclosureRef
-Name IAS
-Number 1
-IssueDate 2022-03-24
-Paragraph 81A
-Subparagraph b
-URI https://taxonomy.ifrs.org/xifrs-link?type=IAS&num=1&code=ifrs-tx-2022-en-r&anchor=para_81A_b&doctype=Standard
-URIDate 2022-03-24
Reference 3: http://www.xbrl.org/2003/role/disclosureRef
-Name IAS
-Number 1
-IssueDate 2022-03-24
-Paragraph 91
-Subparagraph a
-URI https://taxonomy.ifrs.org/xifrs-link?type=IAS&num=1&code=ifrs-tx-2022-en-r&anchor=para_91_a&doctype=Standard
-URIDate 2022-03-24
Reference 4: http://www.xbrl.org/2003/role/disclosureRef
-Name IAS
-Number 1
-IssueDate 2022-03-24
-Paragraph 106
-Subparagraph d
-Clause ii
-URI https://taxonomy.ifrs.org/xifrs-link?type=IAS&num=1&code=ifrs-tx-2022-en-r&anchor=para_106_d_ii&doctype=Standard
-URIDate 2022-03-24
| Name: |
ifrs-full_OtherComprehensiveIncome |
| Namespace Prefix: |
ifrs-full_ |
| Data Type: |
xbrli:monetaryItemType |
| Balance Type: |
credit |
| Period Type: |
duration |
|
| X |
- DefinitionThe amount of other comprehensive income, before tax, related to gains (losses) on remeasurements of defined benefit plans, which comprise actuarial gains and losses; the return on plan assets, excluding amounts included in net interest on the net defined benefit liability (asset); and any change in the effect of the asset ceiling, excluding amounts included in net interest on the net defined benefit liability (asset). [Refer: Other comprehensive income; Defined benefit plans [member]; Plan assets [member]; Net defined benefit liability (asset)] [Contrast: Decrease (increase) in net defined benefit liability (asset) resulting from gain (loss) on remeasurement in other comprehensive income] Reference 1: http://www.xbrl.org/2009/role/commonPracticeRef
-Name IAS
-Number 19
-IssueDate 2022-03-24
-Paragraph 135
-Subparagraph b
-URI https://taxonomy.ifrs.org/xifrs-link?type=IAS&num=19&code=ifrs-tx-2022-en-r&anchor=para_135_b&doctype=Standard
-URIDate 2022-03-24
Reference 2: http://www.xbrl.org/2003/role/disclosureRef
-Name IAS
-Number 1
-IssueDate 2022-03-24
-Paragraph 91
-Subparagraph b
-URI https://taxonomy.ifrs.org/xifrs-link?type=IAS&num=1&code=ifrs-tx-2022-en-r&anchor=para_91_b&doctype=Standard
-URIDate 2022-03-24
Reference 3: http://www.xbrl.org/2003/role/disclosureRef
-Name IAS
-Number 1
-IssueDate 2022-03-24
-Paragraph 7
-URI https://taxonomy.ifrs.org/xifrs-link?type=IAS&num=1&code=ifrs-tx-2022-en-r&anchor=para_7&doctype=Standard
-URIDate 2022-03-24
| Name: |
ifrs-full_OtherComprehensiveIncomeBeforeTaxGainsLossesOnRemeasurementsOfDefinedBenefitPlans |
| Namespace Prefix: |
ifrs-full_ |
| Data Type: |
xbrli:monetaryItemType |
| Balance Type: |
credit |
| Period Type: |
duration |
|
| X |
- DefinitionThe amount of other comprehensive income that will be reclassified to profit or loss, net of tax. [Refer: Other comprehensive income] Reference 1: http://www.xbrl.org/2003/role/exampleRef
-Name IAS
-Number 1
-IssueDate 2022-03-24
-Paragraph IG6
-URI https://taxonomy.ifrs.org/xifrs-link?type=IAS&num=1&code=ifrs-tx-2022-en-r&anchor=para_IG6&doctype=Implementation%20Guidance
-URIDate 2022-03-24
Reference 2: http://www.xbrl.org/2003/role/exampleRef
-Name IAS
-Number 1
-IssueDate 2022-03-24
-Paragraph 82A
-URI https://taxonomy.ifrs.org/xifrs-link?type=IAS&num=1&code=ifrs-tx-2022-en-r&anchor=para_82A&doctype=Standard
-URIDate 2022-03-24
| Name: |
ifrs-full_OtherComprehensiveIncomeThatWillBeReclassifiedToProfitOrLossNetOfTax |
| Namespace Prefix: |
ifrs-full_ |
| Data Type: |
xbrli:monetaryItemType |
| Balance Type: |
credit |
| Period Type: |
duration |
|
| X |
- DefinitionThe amount of other comprehensive income that will not be reclassified to profit or loss, net of tax. [Refer: Other comprehensive income] Reference 1: http://www.xbrl.org/2003/role/exampleRef
-Name IAS
-Number 1
-IssueDate 2022-03-24
-Paragraph IG6
-URI https://taxonomy.ifrs.org/xifrs-link?type=IAS&num=1&code=ifrs-tx-2022-en-r&anchor=para_IG6&doctype=Implementation%20Guidance
-URIDate 2022-03-24
Reference 2: http://www.xbrl.org/2003/role/exampleRef
-Name IAS
-Number 1
-IssueDate 2022-03-24
-Paragraph 82A
-URI https://taxonomy.ifrs.org/xifrs-link?type=IAS&num=1&code=ifrs-tx-2022-en-r&anchor=para_82A&doctype=Standard
-URIDate 2022-03-24
| Name: |
ifrs-full_OtherComprehensiveIncomeThatWillNotBeReclassifiedToProfitOrLossNetOfTax |
| Namespace Prefix: |
ifrs-full_ |
| Data Type: |
xbrli:monetaryItemType |
| Balance Type: |
credit |
| Period Type: |
duration |
|
| X |
- DefinitionThe profit (loss) from discontinued operations. [Refer: Discontinued operations [member]; Profit (loss)] Reference 1: http://www.xbrl.org/2003/role/disclosureRef
-Name IFRS
-Number 5
-IssueDate 2022-03-24
-Paragraph 33
-Subparagraph a
-URI https://taxonomy.ifrs.org/xifrs-link?type=IFRS&num=5&code=ifrs-tx-2022-en-r&anchor=para_33_a&doctype=Standard
-URIDate 2022-03-24
Reference 2: http://www.xbrl.org/2003/role/disclosureRef
-Name IFRS
-Number 12
-IssueDate 2022-03-24
-Paragraph B12
-Subparagraph b
-Clause vii
-URI https://taxonomy.ifrs.org/xifrs-link?type=IFRS&num=12&code=ifrs-tx-2022-en-r&anchor=para_B12_b_vii&doctype=Appendix&subtype=B
-URIDate 2022-03-24
Reference 3: http://www.xbrl.org/2003/role/disclosureRef
-Name IAS
-Number 1
-IssueDate 2022-03-24
-Paragraph 82
-Subparagraph ea
-URI https://taxonomy.ifrs.org/xifrs-link?type=IAS&num=1&code=ifrs-tx-2022-en-r&anchor=para_82_ea&doctype=Standard
-URIDate 2022-03-24
Reference 4: http://www.xbrl.org/2003/role/disclosureRef
-Name IAS
-Number 1
-IssueDate 2022-03-24
-Paragraph 98
-Subparagraph e
-URI https://taxonomy.ifrs.org/xifrs-link?type=IAS&num=1&code=ifrs-tx-2022-en-r&anchor=para_98_e&doctype=Standard
-URIDate 2022-03-24
| Name: |
ifrs-full_ProfitLossFromDiscontinuedOperations |
| Namespace Prefix: |
ifrs-full_ |
| Data Type: |
xbrli:monetaryItemType |
| Balance Type: |
credit |
| Period Type: |
duration |
|
| X |
- DefinitionGains (Losses) On Cost Of Hedging, Before Tax
| Name: |
nggtf_GainsLossesOnCostOfHedgingBeforeTax |
| Namespace Prefix: |
nggtf_ |
| Data Type: |
xbrli:monetaryItemType |
| Balance Type: |
credit |
| Period Type: |
duration |
|
| X |
- DefinitionGains (Losses) On Investments In Debt Instruments Measured At Fair Value Through Other Comprehensive Income
| Name: |
nggtf_GainsLossesOnInvestmentsInDebtInstrumentsMeasuredAtFairValueThroughOtherComprehensiveIncome |
| Namespace Prefix: |
nggtf_ |
| Data Type: |
xbrli:monetaryItemType |
| Balance Type: |
credit |
| Period Type: |
duration |
|
| X |
- Details
| Name: |
ifrs-full_ContinuingAndDiscontinuedOperationsAxis=ifrs-full_DiscontinuedOperationsMember |
| Namespace Prefix: |
|
| Data Type: |
na |
| Balance Type: |
|
| Period Type: |
|
|
v3.23.3
| X |
- DefinitionThe tax expense (income) divided by the accounting profit. [Refer: Accounting profit] Reference 1: http://www.xbrl.org/2003/role/disclosureRef
-Name IAS
-Number 12
-IssueDate 2022-03-24
-Paragraph 81
-Subparagraph c
-Clause ii
-URI https://taxonomy.ifrs.org/xifrs-link?type=IAS&num=12&code=ifrs-tx-2022-en-r&anchor=para_81_c_ii&doctype=Standard
-URIDate 2022-03-24
| Name: |
ifrs-full_AverageEffectiveTaxRate |
| Namespace Prefix: |
ifrs-full_ |
| Data Type: |
dtr-types:percentItemType |
| Balance Type: |
na |
| Period Type: |
duration |
|
v3.23.3
Earnings per share (Details) - GBP (£)
£ / shares in Units, £ in Millions, shares in Millions |
6 Months Ended |
Sep. 30, 2023 |
Sep. 30, 2022 |
| Basic earnings per share [abstract] |
|
|
|
| Profit after tax from continuing operations attributable to the parent |
£ 1,063
|
£ 1,219
|
|
| Profit after tax from discontinued operations attributable to the parent |
65
|
37
|
|
| Total profit after tax attributable to the parent |
£ 1,128
|
£ 1,256
|
|
| Basic earnings per share (continuing) (in GBP per share) |
£ 0.288
|
£ 0.334
|
[1] |
| Basic earnings per share (discontinued) (in GBP per share) |
0.018
|
0.01
|
|
| Basic earnings per share (continuing and discontinued) (in GBP per share) |
£ 0.306
|
£ 0.344
|
[1] |
| Weighted average number of shares - basic (in shares) |
3,682
|
3,651
|
|
| Diluted earnings per share [abstract] |
|
|
|
| Profit after tax from continuing operations attributable to the parent |
£ 1,063
|
£ 1,219
|
|
| Profit after tax from discontinued operations attributable to the parent |
65
|
37
|
|
| Total profit after tax attributable to the parent |
£ 1,128
|
£ 1,256
|
|
| Diluted earnings per share (continuing) (in GBP per share) |
£ 0.287
|
£ 0.332
|
[1] |
| Diluted earnings per share (discontinued) (in GBP per share) |
0.018
|
0.01
|
|
| Diluted earnings per share (continuing and discontinued) (in GBP per share) |
£ 0.305
|
£ 0.342
|
[1] |
| Weighted average number of shares - diluted (in shares) |
3,700
|
3,668
|
|
|
|
| X |
- DefinitionThe weighted average number of ordinary shares outstanding plus the weighted average number of ordinary shares that would be issued on the conversion of all the dilutive potential ordinary shares into ordinary shares. [Refer: Ordinary shares [member]; Weighted average [member]] Reference 1: http://www.xbrl.org/2003/role/disclosureRef
-Name IAS
-Number 33
-IssueDate 2022-03-24
-Paragraph 70
-Subparagraph b
-URI https://taxonomy.ifrs.org/xifrs-link?type=IAS&num=33&code=ifrs-tx-2022-en-r&anchor=para_70_b&doctype=Standard
-URIDate 2022-03-24
| Name: |
ifrs-full_AdjustedWeightedAverageShares |
| Namespace Prefix: |
ifrs-full_ |
| Data Type: |
xbrli:sharesItemType |
| Balance Type: |
na |
| Period Type: |
duration |
|
| X |
- DefinitionThe amount of profit (loss) attributable to ordinary equity holders of the parent entity (the numerator) divided by the weighted average number of ordinary shares outstanding during the period (the denominator). Reference 1: http://www.xbrl.org/2003/role/disclosureRef
-Name IAS
-Number 33
-IssueDate 2022-03-24
-Paragraph 66
-URI https://taxonomy.ifrs.org/xifrs-link?type=IAS&num=33&code=ifrs-tx-2022-en-r&anchor=para_66&doctype=Standard
-URIDate 2022-03-24
Reference 2: http://www.xbrl.org/2003/role/disclosureRef
-Name IAS
-Number 33
-IssueDate 2022-03-24
-Paragraph 67
-URI https://taxonomy.ifrs.org/xifrs-link?type=IAS&num=33&code=ifrs-tx-2022-en-r&anchor=para_67&doctype=Standard
-URIDate 2022-03-24
| Name: |
ifrs-full_BasicEarningsLossPerShare |
| Namespace Prefix: |
ifrs-full_ |
| Data Type: |
dtr-types:perShareItemType |
| Balance Type: |
na |
| Period Type: |
duration |
|
| X |
- DefinitionBasic earnings (loss) per share from continuing operations. [Refer: Basic earnings (loss) per share; Continuing operations [member]] Reference 1: http://www.xbrl.org/2003/role/disclosureRef
-Name IAS
-Number 33
-IssueDate 2022-03-24
-Paragraph 66
-URI https://taxonomy.ifrs.org/xifrs-link?type=IAS&num=33&code=ifrs-tx-2022-en-r&anchor=para_66&doctype=Standard
-URIDate 2022-03-24
Reference 2: http://www.xbrl.org/2003/role/disclosureRef
-Name IAS
-Number 33
-IssueDate 2022-03-24
-Paragraph 67
-URI https://taxonomy.ifrs.org/xifrs-link?type=IAS&num=33&code=ifrs-tx-2022-en-r&anchor=para_67&doctype=Standard
-URIDate 2022-03-24
| Name: |
ifrs-full_BasicEarningsLossPerShareFromContinuingOperations |
| Namespace Prefix: |
ifrs-full_ |
| Data Type: |
dtr-types:perShareItemType |
| Balance Type: |
na |
| Period Type: |
duration |
|
| X |
- DefinitionBasic earnings (loss) per share from discontinued operations. [Refer: Basic earnings (loss) per share; Discontinued operations [member]] Reference 1: http://www.xbrl.org/2003/role/disclosureRef
-Name IAS
-Number 33
-IssueDate 2022-03-24
-Paragraph 68
-URI https://taxonomy.ifrs.org/xifrs-link?type=IAS&num=33&code=ifrs-tx-2022-en-r&anchor=para_68&doctype=Standard
-URIDate 2022-03-24
Reference 2: http://www.xbrl.org/2003/role/disclosureRef
-Name IAS
-Number 33
-IssueDate 2022-03-24
-Paragraph 67
-URI https://taxonomy.ifrs.org/xifrs-link?type=IAS&num=33&code=ifrs-tx-2022-en-r&anchor=para_67&doctype=Standard
-URIDate 2022-03-24
| Name: |
ifrs-full_BasicEarningsLossPerShareFromDiscontinuedOperations |
| Namespace Prefix: |
ifrs-full_ |
| Data Type: |
dtr-types:perShareItemType |
| Balance Type: |
na |
| Period Type: |
duration |
|
| X |
- References
+ Details
| Name: |
ifrs-full_BasicEarningsPerShareAbstract |
| Namespace Prefix: |
ifrs-full_ |
| Data Type: |
xbrli:stringItemType |
| Balance Type: |
na |
| Period Type: |
duration |
|
| X |
- DefinitionThe amount of profit (loss) attributable to ordinary equity holders of the parent entity (the numerator), divided by the weighted average number of ordinary shares outstanding during the period (the denominator), both adjusted for the effects of all dilutive potential ordinary shares. [Refer: Ordinary shares [member]; Weighted average [member]] Reference 1: http://www.xbrl.org/2003/role/disclosureRef
-Name IAS
-Number 33
-IssueDate 2022-03-24
-Paragraph 66
-URI https://taxonomy.ifrs.org/xifrs-link?type=IAS&num=33&code=ifrs-tx-2022-en-r&anchor=para_66&doctype=Standard
-URIDate 2022-03-24
Reference 2: http://www.xbrl.org/2003/role/disclosureRef
-Name IAS
-Number 33
-IssueDate 2022-03-24
-Paragraph 67
-URI https://taxonomy.ifrs.org/xifrs-link?type=IAS&num=33&code=ifrs-tx-2022-en-r&anchor=para_67&doctype=Standard
-URIDate 2022-03-24
| Name: |
ifrs-full_DilutedEarningsLossPerShare |
| Namespace Prefix: |
ifrs-full_ |
| Data Type: |
dtr-types:perShareItemType |
| Balance Type: |
na |
| Period Type: |
duration |
|
| X |
- DefinitionDiluted earnings (loss) per share from continuing operations. [Refer: Continuing operations [member]; Diluted earnings (loss) per share] Reference 1: http://www.xbrl.org/2003/role/disclosureRef
-Name IAS
-Number 33
-IssueDate 2022-03-24
-Paragraph 66
-URI https://taxonomy.ifrs.org/xifrs-link?type=IAS&num=33&code=ifrs-tx-2022-en-r&anchor=para_66&doctype=Standard
-URIDate 2022-03-24
Reference 2: http://www.xbrl.org/2003/role/disclosureRef
-Name IAS
-Number 33
-IssueDate 2022-03-24
-Paragraph 67
-URI https://taxonomy.ifrs.org/xifrs-link?type=IAS&num=33&code=ifrs-tx-2022-en-r&anchor=para_67&doctype=Standard
-URIDate 2022-03-24
| Name: |
ifrs-full_DilutedEarningsLossPerShareFromContinuingOperations |
| Namespace Prefix: |
ifrs-full_ |
| Data Type: |
dtr-types:perShareItemType |
| Balance Type: |
na |
| Period Type: |
duration |
|
| X |
- DefinitionDiluted earnings (loss) per share from discontinued operations. [Refer: Diluted earnings (loss) per share; Discontinued operations [member]] Reference 1: http://www.xbrl.org/2003/role/disclosureRef
-Name IAS
-Number 33
-IssueDate 2022-03-24
-Paragraph 68
-URI https://taxonomy.ifrs.org/xifrs-link?type=IAS&num=33&code=ifrs-tx-2022-en-r&anchor=para_68&doctype=Standard
-URIDate 2022-03-24
Reference 2: http://www.xbrl.org/2003/role/disclosureRef
-Name IAS
-Number 33
-IssueDate 2022-03-24
-Paragraph 67
-URI https://taxonomy.ifrs.org/xifrs-link?type=IAS&num=33&code=ifrs-tx-2022-en-r&anchor=para_67&doctype=Standard
-URIDate 2022-03-24
| Name: |
ifrs-full_DilutedEarningsLossPerShareFromDiscontinuedOperations |
| Namespace Prefix: |
ifrs-full_ |
| Data Type: |
dtr-types:perShareItemType |
| Balance Type: |
na |
| Period Type: |
duration |
|
| X |
- References
+ Details
| Name: |
ifrs-full_DilutedEarningsPerShareAbstract |
| Namespace Prefix: |
ifrs-full_ |
| Data Type: |
xbrli:stringItemType |
| Balance Type: |
na |
| Period Type: |
duration |
|
| X |
- DefinitionThe profit (loss) attributable to ordinary equity holders of the parent entity. [Refer: Profit (loss)] Reference 1: http://www.xbrl.org/2003/role/disclosureRef
-Name IAS
-Number 33
-IssueDate 2022-03-24
-Paragraph 70
-Subparagraph a
-URI https://taxonomy.ifrs.org/xifrs-link?type=IAS&num=33&code=ifrs-tx-2022-en-r&anchor=para_70_a&doctype=Standard
-URIDate 2022-03-24
| Name: |
ifrs-full_ProfitLossAttributableToOrdinaryEquityHoldersOfParentEntity |
| Namespace Prefix: |
ifrs-full_ |
| Data Type: |
xbrli:monetaryItemType |
| Balance Type: |
credit |
| Period Type: |
duration |
|
| X |
- DefinitionThe profit (loss) attributable to ordinary equity holders of the parent entity, adjusted for the effects of all dilutive potential ordinary shares. [Refer: Profit (loss)] Reference 1: http://www.xbrl.org/2003/role/disclosureRef
-Name IAS
-Number 33
-IssueDate 2022-03-24
-Paragraph 70
-Subparagraph a
-URI https://taxonomy.ifrs.org/xifrs-link?type=IAS&num=33&code=ifrs-tx-2022-en-r&anchor=para_70_a&doctype=Standard
-URIDate 2022-03-24
| Name: |
ifrs-full_ProfitLossAttributableToOrdinaryEquityHoldersOfParentEntityIncludingDilutiveEffects |
| Namespace Prefix: |
ifrs-full_ |
| Data Type: |
xbrli:monetaryItemType |
| Balance Type: |
credit |
| Period Type: |
duration |
|
| X |
- DefinitionThe profit (loss) from continuing operations attributable to ordinary equity holders of the parent entity. [Refer: Continuing operations [member]; Profit (loss) from continuing operations] Reference 1: http://www.xbrl.org/2003/role/disclosureRef
-Name IAS
-Number 33
-IssueDate 2022-03-24
-Paragraph 70
-Subparagraph a
-URI https://taxonomy.ifrs.org/xifrs-link?type=IAS&num=33&code=ifrs-tx-2022-en-r&anchor=para_70_a&doctype=Standard
-URIDate 2022-03-24
| Name: |
ifrs-full_ProfitLossFromContinuingOperationsAttributableToOrdinaryEquityHoldersOfParentEntity |
| Namespace Prefix: |
ifrs-full_ |
| Data Type: |
xbrli:monetaryItemType |
| Balance Type: |
credit |
| Period Type: |
duration |
|
| X |
- DefinitionThe profit (loss) from continuing operations attributable to ordinary equity holders of the parent entity, adjusted for the effects of all dilutive potential ordinary shares. [Refer: Profit (loss) from continuing operations] Reference 1: http://www.xbrl.org/2003/role/disclosureRef
-Name IAS
-Number 33
-IssueDate 2022-03-24
-Paragraph 70
-Subparagraph a
-URI https://taxonomy.ifrs.org/xifrs-link?type=IAS&num=33&code=ifrs-tx-2022-en-r&anchor=para_70_a&doctype=Standard
-URIDate 2022-03-24
| Name: |
ifrs-full_ProfitLossFromContinuingOperationsAttributableToOrdinaryEquityHoldersOfParentEntityIncludingDilutiveEffects |
| Namespace Prefix: |
ifrs-full_ |
| Data Type: |
xbrli:monetaryItemType |
| Balance Type: |
credit |
| Period Type: |
duration |
|
| X |
- DefinitionThe profit (loss) from discontinued operations attributable to ordinary equity holders of the parent entity. [Refer: Profit (loss) from discontinued operations] Reference 1: http://www.xbrl.org/2003/role/disclosureRef
-Name IAS
-Number 33
-IssueDate 2022-03-24
-Paragraph 70
-Subparagraph a
-URI https://taxonomy.ifrs.org/xifrs-link?type=IAS&num=33&code=ifrs-tx-2022-en-r&anchor=para_70_a&doctype=Standard
-URIDate 2022-03-24
| Name: |
ifrs-full_ProfitLossFromDiscontinuedOperationsAttributableToOrdinaryEquityHoldersOfParentEntity |
| Namespace Prefix: |
ifrs-full_ |
| Data Type: |
xbrli:monetaryItemType |
| Balance Type: |
credit |
| Period Type: |
duration |
|
| X |
- DefinitionThe profit (loss) from discontinued operations attributable to ordinary equity holders of the parent entity, adjusted for the effects of all dilutive potential ordinary shares. [Refer: Profit (loss) from discontinued operations] Reference 1: http://www.xbrl.org/2003/role/disclosureRef
-Name IAS
-Number 33
-IssueDate 2022-03-24
-Paragraph 70
-Subparagraph a
-URI https://taxonomy.ifrs.org/xifrs-link?type=IAS&num=33&code=ifrs-tx-2022-en-r&anchor=para_70_a&doctype=Standard
-URIDate 2022-03-24
| Name: |
ifrs-full_ProfitLossFromDiscontinuedOperationsAttributableToOrdinaryEquityHoldersOfParentEntityIncludingDilutiveEffects |
| Namespace Prefix: |
ifrs-full_ |
| Data Type: |
xbrli:monetaryItemType |
| Balance Type: |
credit |
| Period Type: |
duration |
|
| X |
- DefinitionThe number of ordinary shares outstanding at the beginning of the period, adjusted by the number of ordinary shares bought back or issued during the period multiplied by a time-weighting factor. Reference 1: http://www.xbrl.org/2003/role/disclosureRef
-Name IAS
-Number 33
-IssueDate 2022-03-24
-Paragraph 70
-Subparagraph b
-URI https://taxonomy.ifrs.org/xifrs-link?type=IAS&num=33&code=ifrs-tx-2022-en-r&anchor=para_70_b&doctype=Standard
-URIDate 2022-03-24
| Name: |
ifrs-full_WeightedAverageShares |
| Namespace Prefix: |
ifrs-full_ |
| Data Type: |
xbrli:sharesItemType |
| Balance Type: |
na |
| Period Type: |
duration |
|
v3.23.3
| X |
- DefinitionThe amount of dividends paid by the entity on ordinary shares. [Refer: Ordinary shares [member]] Reference 1: http://www.xbrl.org/2003/role/disclosureRef
-Name IAS
-Number 34
-IssueDate 2022-03-24
-Paragraph 16A
-Subparagraph f
-URI https://taxonomy.ifrs.org/xifrs-link?type=IAS&num=34&code=ifrs-tx-2022-en-r&anchor=para_16A_f&doctype=Standard
-URIDate 2022-03-24
| Name: |
ifrs-full_DividendsPaidOrdinaryShares |
| Namespace Prefix: |
ifrs-full_ |
| Data Type: |
xbrli:monetaryItemType |
| Balance Type: |
debit |
| Period Type: |
duration |
|
| X |
- DefinitionThe amount of dividends paid per ordinary share. Reference 1: http://www.xbrl.org/2003/role/disclosureRef
-Name IAS
-Number 34
-IssueDate 2022-03-24
-Paragraph 16A
-Subparagraph f
-URI https://taxonomy.ifrs.org/xifrs-link?type=IAS&num=34&code=ifrs-tx-2022-en-r&anchor=para_16A_f&doctype=Standard
-URIDate 2022-03-24
| Name: |
ifrs-full_DividendsPaidOrdinarySharesPerShare |
| Namespace Prefix: |
ifrs-full_ |
| Data Type: |
dtr-types:perShareItemType |
| Balance Type: |
na |
| Period Type: |
duration |
|
| X |
- Definition[Line Items] for Summary Of Dividends [Table]
| Name: |
nggtf_SummaryOfDividendsLineItems |
| Namespace Prefix: |
nggtf_ |
| Data Type: |
xbrli:stringItemType |
| Balance Type: |
na |
| Period Type: |
duration |
|
| X |
- Details
| Name: |
nggtf_DividendsAxis=nggtf_FinalDividendMember |
| Namespace Prefix: |
|
| Data Type: |
na |
| Balance Type: |
|
| Period Type: |
|
|
| X |
- Details
| Name: |
nggtf_DividendsAxis=nggtf_InterimDividendMember |
| Namespace Prefix: |
|
| Data Type: |
na |
| Balance Type: |
|
| Period Type: |
|
|
v3.23.3
| X |
- DefinitionThe amount of dividends paid by the entity on ordinary shares. [Refer: Ordinary shares [member]] Reference 1: http://www.xbrl.org/2003/role/disclosureRef
-Name IAS
-Number 34
-IssueDate 2022-03-24
-Paragraph 16A
-Subparagraph f
-URI https://taxonomy.ifrs.org/xifrs-link?type=IAS&num=34&code=ifrs-tx-2022-en-r&anchor=para_16A_f&doctype=Standard
-URIDate 2022-03-24
| Name: |
ifrs-full_DividendsPaidOrdinaryShares |
| Namespace Prefix: |
ifrs-full_ |
| Data Type: |
xbrli:monetaryItemType |
| Balance Type: |
debit |
| Period Type: |
duration |
|
| X |
- DefinitionThe amount of dividends paid per ordinary share. Reference 1: http://www.xbrl.org/2003/role/disclosureRef
-Name IAS
-Number 34
-IssueDate 2022-03-24
-Paragraph 16A
-Subparagraph f
-URI https://taxonomy.ifrs.org/xifrs-link?type=IAS&num=34&code=ifrs-tx-2022-en-r&anchor=para_16A_f&doctype=Standard
-URIDate 2022-03-24
| Name: |
ifrs-full_DividendsPaidOrdinarySharesPerShare |
| Namespace Prefix: |
ifrs-full_ |
| Data Type: |
dtr-types:perShareItemType |
| Balance Type: |
na |
| Period Type: |
duration |
|
| X |
- DefinitionThe amount of dividends proposed or declared after the reporting period but before financial statements are authorised for issue. Such dividends are not recognised as a liability at the end of the reporting period because no obligation exists at that time. Reference 1: http://www.xbrl.org/2003/role/disclosureRef
-Name IAS
-Number 10
-IssueDate 2022-03-24
-Paragraph 13
-URI https://taxonomy.ifrs.org/xifrs-link?type=IAS&num=10&code=ifrs-tx-2022-en-r&anchor=para_13&doctype=Standard
-URIDate 2022-03-24
Reference 2: http://www.xbrl.org/2003/role/disclosureRef
-Name IAS
-Number 1
-IssueDate 2022-03-24
-Paragraph 137
-Subparagraph a
-URI https://taxonomy.ifrs.org/xifrs-link?type=IAS&num=1&code=ifrs-tx-2022-en-r&anchor=para_137_a&doctype=Standard
-URIDate 2022-03-24
| Name: |
ifrs-full_DividendsProposedOrDeclaredBeforeFinancialStatementsAuthorisedForIssueButNotRecognisedAsDistributionToOwners |
| Namespace Prefix: |
ifrs-full_ |
| Data Type: |
xbrli:monetaryItemType |
| Balance Type: |
na |
| Period Type: |
duration |
|
| X |
- DefinitionThe amount, per share, of dividends proposed or declared before financial statements were authorised for issue but not recognised as distribution to owners. Reference 1: http://www.xbrl.org/2003/role/disclosureRef
-Name IAS
-Number 1
-IssueDate 2022-03-24
-Paragraph 137
-Subparagraph a
-URI https://taxonomy.ifrs.org/xifrs-link?type=IAS&num=1&code=ifrs-tx-2022-en-r&anchor=para_137_a&doctype=Standard
-URIDate 2022-03-24
| Name: |
ifrs-full_DividendsProposedOrDeclaredBeforeFinancialStatementsAuthorisedForIssueButNotRecognisedAsDistributionToOwnersPerShare |
| Namespace Prefix: |
ifrs-full_ |
| Data Type: |
dtr-types:perShareItemType |
| Balance Type: |
na |
| Period Type: |
duration |
|
| X |
- Definition[Line Items] for Summary Of Dividends [Table]
| Name: |
nggtf_SummaryOfDividendsLineItems |
| Namespace Prefix: |
nggtf_ |
| Data Type: |
xbrli:stringItemType |
| Balance Type: |
na |
| Period Type: |
duration |
|
| X |
- Details
| Name: |
nggtf_DividendsAxis=nggtf_FinalDividendMember |
| Namespace Prefix: |
|
| Data Type: |
na |
| Balance Type: |
|
| Period Type: |
|
|
v3.23.3
Fair value measurement - Schedule of assets and liabilities measured at fair value (Details) - GBP (£)
£ in Millions |
Sep. 30, 2023 |
Mar. 31, 2023 |
Sep. 30, 2022 |
Mar. 31, 2022 |
| Disclosure Of Fair Value Measurement Of Assets And Liabilities [Line Items] |
|
|
|
|
| Financial assets |
£ 2,263
|
£ 3,052
|
|
|
| Financial liabilities |
(1,447)
|
(1,312)
|
|
|
| Total |
816
|
1,740
|
|
|
| Level 1 |
|
|
|
|
| Disclosure Of Fair Value Measurement Of Assets And Liabilities [Line Items] |
|
|
|
|
| Financial assets |
1,007
|
1,764
|
|
|
| Financial liabilities |
0
|
0
|
|
|
| Total |
1,007
|
1,764
|
|
|
| Level 2 |
|
|
|
|
| Disclosure Of Fair Value Measurement Of Assets And Liabilities [Line Items] |
|
|
|
|
| Financial assets |
751
|
810
|
|
|
| Financial liabilities |
(1,297)
|
(1,131)
|
|
|
| Total |
(546)
|
(321)
|
|
|
| Level 3 |
|
|
|
|
| Disclosure Of Fair Value Measurement Of Assets And Liabilities [Line Items] |
|
|
|
|
| Financial assets |
505
|
478
|
|
|
| Financial liabilities |
(150)
|
(181)
|
|
|
| Total |
355
|
297
|
£ 223
|
£ 233
|
| Financing derivatives |
|
|
|
|
| Disclosure Of Fair Value Measurement Of Assets And Liabilities [Line Items] |
|
|
|
|
| Financial liabilities |
(1,314)
|
(1,119)
|
|
|
| Financing derivatives | Level 1 |
|
|
|
|
| Disclosure Of Fair Value Measurement Of Assets And Liabilities [Line Items] |
|
|
|
|
| Financial liabilities |
0
|
0
|
|
|
| Financing derivatives | Level 2 |
|
|
|
|
| Disclosure Of Fair Value Measurement Of Assets And Liabilities [Line Items] |
|
|
|
|
| Financial liabilities |
(1,219)
|
(997)
|
|
|
| Financing derivatives | Level 3 |
|
|
|
|
| Disclosure Of Fair Value Measurement Of Assets And Liabilities [Line Items] |
|
|
|
|
| Financial liabilities |
(95)
|
(122)
|
|
|
| Commodity contract derivatives |
|
|
|
|
| Disclosure Of Fair Value Measurement Of Assets And Liabilities [Line Items] |
|
|
|
|
| Financial liabilities |
(123)
|
(174)
|
|
|
| Commodity contract derivatives | Level 1 |
|
|
|
|
| Disclosure Of Fair Value Measurement Of Assets And Liabilities [Line Items] |
|
|
|
|
| Financial liabilities |
0
|
0
|
|
|
| Commodity contract derivatives | Level 2 |
|
|
|
|
| Disclosure Of Fair Value Measurement Of Assets And Liabilities [Line Items] |
|
|
|
|
| Financial liabilities |
(78)
|
(134)
|
|
|
| Commodity contract derivatives | Level 3 |
|
|
|
|
| Disclosure Of Fair Value Measurement Of Assets And Liabilities [Line Items] |
|
|
|
|
| Financial liabilities |
(45)
|
(40)
|
|
|
| Contingent consideration |
|
|
|
|
| Disclosure Of Fair Value Measurement Of Assets And Liabilities [Line Items] |
|
|
|
|
| Financial liabilities |
(10)
|
(19)
|
|
|
| Contingent consideration | Level 1 |
|
|
|
|
| Disclosure Of Fair Value Measurement Of Assets And Liabilities [Line Items] |
|
|
|
|
| Financial liabilities |
0
|
0
|
|
|
| Contingent consideration | Level 2 |
|
|
|
|
| Disclosure Of Fair Value Measurement Of Assets And Liabilities [Line Items] |
|
|
|
|
| Financial liabilities |
0
|
0
|
|
|
| Contingent consideration | Level 3 |
|
|
|
|
| Disclosure Of Fair Value Measurement Of Assets And Liabilities [Line Items] |
|
|
|
|
| Financial liabilities |
(10)
|
(19)
|
|
|
| Investments held at fair value through profit and loss |
|
|
|
|
| Disclosure Of Fair Value Measurement Of Assets And Liabilities [Line Items] |
|
|
|
|
| Financial assets |
1,490
|
2,216
|
|
|
| Investments held at fair value through profit and loss | Level 1 |
|
|
|
|
| Disclosure Of Fair Value Measurement Of Assets And Liabilities [Line Items] |
|
|
|
|
| Financial assets |
1,007
|
1,764
|
|
|
| Investments held at fair value through profit and loss | Level 2 |
|
|
|
|
| Disclosure Of Fair Value Measurement Of Assets And Liabilities [Line Items] |
|
|
|
|
| Financial assets |
0
|
0
|
|
|
| Investments held at fair value through profit and loss | Level 3 |
|
|
|
|
| Disclosure Of Fair Value Measurement Of Assets And Liabilities [Line Items] |
|
|
|
|
| Financial assets |
483
|
452
|
|
|
| Investments held at fair value through other comprehensive income |
|
|
|
|
| Disclosure Of Fair Value Measurement Of Assets And Liabilities [Line Items] |
|
|
|
|
| Financial assets |
388
|
407
|
|
|
| Investments held at fair value through other comprehensive income | Level 1 |
|
|
|
|
| Disclosure Of Fair Value Measurement Of Assets And Liabilities [Line Items] |
|
|
|
|
| Financial assets |
0
|
0
|
|
|
| Investments held at fair value through other comprehensive income | Level 2 |
|
|
|
|
| Disclosure Of Fair Value Measurement Of Assets And Liabilities [Line Items] |
|
|
|
|
| Financial assets |
388
|
407
|
|
|
| Investments held at fair value through other comprehensive income | Level 3 |
|
|
|
|
| Disclosure Of Fair Value Measurement Of Assets And Liabilities [Line Items] |
|
|
|
|
| Financial assets |
0
|
0
|
|
|
| Financing derivatives |
|
|
|
|
| Disclosure Of Fair Value Measurement Of Assets And Liabilities [Line Items] |
|
|
|
|
| Financial assets |
329
|
363
|
|
|
| Financing derivatives | Level 1 |
|
|
|
|
| Disclosure Of Fair Value Measurement Of Assets And Liabilities [Line Items] |
|
|
|
|
| Financial assets |
0
|
0
|
|
|
| Financing derivatives | Level 2 |
|
|
|
|
| Disclosure Of Fair Value Measurement Of Assets And Liabilities [Line Items] |
|
|
|
|
| Financial assets |
309
|
341
|
|
|
| Financing derivatives | Level 3 |
|
|
|
|
| Disclosure Of Fair Value Measurement Of Assets And Liabilities [Line Items] |
|
|
|
|
| Financial assets |
20
|
22
|
|
|
| Commodity contract derivatives |
|
|
|
|
| Disclosure Of Fair Value Measurement Of Assets And Liabilities [Line Items] |
|
|
|
|
| Financial assets |
56
|
66
|
|
|
| Commodity contract derivatives | Level 1 |
|
|
|
|
| Disclosure Of Fair Value Measurement Of Assets And Liabilities [Line Items] |
|
|
|
|
| Financial assets |
0
|
0
|
|
|
| Commodity contract derivatives | Level 2 |
|
|
|
|
| Disclosure Of Fair Value Measurement Of Assets And Liabilities [Line Items] |
|
|
|
|
| Financial assets |
54
|
62
|
|
|
| Commodity contract derivatives | Level 3 |
|
|
|
|
| Disclosure Of Fair Value Measurement Of Assets And Liabilities [Line Items] |
|
|
|
|
| Financial assets |
£ 2
|
£ 4
|
|
|
| X |
- DefinitionThe amount of assets that are: (a) cash; (b) an equity instrument of another entity; (c) a contractual right: (i) to receive cash or another financial asset from another entity; or (ii) to exchange financial assets or financial liabilities with another entity under conditions that are potentially favourable to the entity; or (d) a contract that will, or may be, settled in the entity’s own equity instruments and is: (i) a non-derivative for which the entity is, or may be, obliged to receive a variable number of the entity’s own equity instruments; or (ii) a derivative that will, or may be, settled other than by the exchange of a fixed amount of cash or another financial asset for a fixed number of the entity’s own equity instruments. For this purpose the entity’s own equity instruments do not include puttable financial instruments classified as equity instruments in accordance with paragraphs 16A-16B of IAS 32, instruments that impose on the entity an obligation to deliver to another party a pro rata share of the net assets of the entity only on liquidation and are classified as equity instruments in accordance with paragraphs 16C-16D of IAS 32, or instruments that are contracts for the future receipt or delivery of the entity’s own equity instruments. [Refer: Financial instruments, class [member]; Financial liabilities] Reference 1: http://www.xbrl.org/2003/role/disclosureRef
-Name IFRS
-Number 7
-IssueDate 2022-03-24
-Paragraph 35H
-URI https://taxonomy.ifrs.org/xifrs-link?type=IFRS&num=7&code=ifrs-tx-2022-en-r&anchor=para_35H&doctype=Standard
-URIDate 2022-03-24
Reference 2: http://www.xbrl.org/2003/role/disclosureRef
-Name IFRS
-Number 7
-IssueDate 2022-03-24
-Paragraph 35M
-URI https://taxonomy.ifrs.org/xifrs-link?type=IFRS&num=7&code=ifrs-tx-2022-en-r&anchor=para_35M&doctype=Standard
-URIDate 2022-03-24
Reference 3: http://www.xbrl.org/2003/role/exampleRef
-Name IFRS
-Number 7
-IssueDate 2022-03-24
-Paragraph 35N
-URI https://taxonomy.ifrs.org/xifrs-link?type=IFRS&num=7&code=ifrs-tx-2022-en-r&anchor=para_35N&doctype=Standard
-URIDate 2022-03-24
Reference 4: http://www.xbrl.org/2003/role/disclosureRef
-Name IFRS
-Number 7
-IssueDate 2022-03-24
-Paragraph 35I
-URI https://taxonomy.ifrs.org/xifrs-link?type=IFRS&num=7&code=ifrs-tx-2022-en-r&anchor=para_35I&doctype=Standard
-URIDate 2022-03-24
Reference 5: http://www.xbrl.org/2003/role/disclosureRef
-Name IFRS
-Number 7
-IssueDate 2022-03-24
-Paragraph 25
-URI https://taxonomy.ifrs.org/xifrs-link?type=IFRS&num=7&code=ifrs-tx-2022-en-r&anchor=para_25&doctype=Standard
-URIDate 2022-03-24
| Name: |
ifrs-full_FinancialAssets |
| Namespace Prefix: |
ifrs-full_ |
| Data Type: |
xbrli:monetaryItemType |
| Balance Type: |
debit |
| Period Type: |
instant |
|
| X |
- DefinitionThe amount of liabilities that are: (a) a contractual obligation: (i) to deliver cash or another financial asset to another entity; or (ii) to exchange financial assets or financial liabilities with another entity under conditions that are potentially unfavourable to the entity; or (b) a contract that will, or may be, settled in the entity’s own equity instruments and is: (i) a non-derivative for which the entity is, or may be, obliged to deliver a variable number of the entity’s own equity instruments; or (ii) a derivative that will, or may be, settled other than by the exchange of a fixed amount of cash or another financial asset for a fixed number of the entity’s own equity instruments. For this purpose, rights, options or warrants to acquire a fixed number of the entity’s own equity instruments for a fixed amount of any currency are equity instruments if the entity offers the rights, options or warrants pro rata to all of its existing owners of the same class of its own non-derivative equity instruments. Also, for those purposes the entity’s own equity instruments do not include puttable financial instruments that are classified as equity instruments in accordance with paragraphs 16A-16B of IAS 32, instruments that impose on the entity an obligation to deliver to another party a pro rata share of the net assets of the entity only on liquidation and are classified as equity instruments in accordance with paragraphs 16C-16D of IAS 32, or instruments that are contracts for the future receipt or delivery of the entity’s own equity instruments. As an exception, an instrument that meets the definition of a financial liability is classified as an equity instrument if it has all the features and meets the conditions in paragraphs 16A-16B or paragraphs 16C-16D of IAS 32. [Refer: Financial instruments, class [member]; Financial assets; Derivatives [member]] Reference 1: http://www.xbrl.org/2003/role/disclosureRef
-Name IFRS
-Number 7
-IssueDate 2022-03-24
-Paragraph 25
-URI https://taxonomy.ifrs.org/xifrs-link?type=IFRS&num=7&code=ifrs-tx-2022-en-r&anchor=para_25&doctype=Standard
-URIDate 2022-03-24
| Name: |
ifrs-full_FinancialLiabilities |
| Namespace Prefix: |
ifrs-full_ |
| Data Type: |
xbrli:monetaryItemType |
| Balance Type: |
credit |
| Period Type: |
instant |
|
| X |
- Definition[Line Items] for Disclosure Of Fair Value Measurement Of Assets And Liabilities [Table]
| Name: |
nggtf_DisclosureOfFairValueMeasurementOfAssetsAndLiabilitiesLineItems |
| Namespace Prefix: |
nggtf_ |
| Data Type: |
xbrli:stringItemType |
| Balance Type: |
na |
| Period Type: |
duration |
|
| X |
- DefinitionFinancial Assets (Liabilities)
| Name: |
nggtf_FinancialAssetsLiabilities |
| Namespace Prefix: |
nggtf_ |
| Data Type: |
xbrli:monetaryItemType |
| Balance Type: |
debit |
| Period Type: |
instant |
|
| X |
- Details
| Name: |
ifrs-full_LevelsOfFairValueHierarchyAxis=ifrs-full_Level1OfFairValueHierarchyMember |
| Namespace Prefix: |
|
| Data Type: |
na |
| Balance Type: |
|
| Period Type: |
|
|
| X |
- Details
| Name: |
ifrs-full_LevelsOfFairValueHierarchyAxis=ifrs-full_Level2OfFairValueHierarchyMember |
| Namespace Prefix: |
|
| Data Type: |
na |
| Balance Type: |
|
| Period Type: |
|
|
| X |
- Details
| Name: |
ifrs-full_LevelsOfFairValueHierarchyAxis=ifrs-full_Level3OfFairValueHierarchyMember |
| Namespace Prefix: |
|
| Data Type: |
na |
| Balance Type: |
|
| Period Type: |
|
|
| X |
- Details
| Name: |
ifrs-full_ClassesOfLiabilitiesAxis=nggtf_FinancingDerivativesMember |
| Namespace Prefix: |
|
| Data Type: |
na |
| Balance Type: |
|
| Period Type: |
|
|
| X |
- Details
| Name: |
ifrs-full_ClassesOfLiabilitiesAxis=nggtf_CommodityDerivativesMember |
| Namespace Prefix: |
|
| Data Type: |
na |
| Balance Type: |
|
| Period Type: |
|
|
| X |
- Details
| Name: |
ifrs-full_ClassesOfLiabilitiesAxis=ifrs-full_ContingentConsiderationMember |
| Namespace Prefix: |
|
| Data Type: |
na |
| Balance Type: |
|
| Period Type: |
|
|
| X |
- Details
| Name: |
ifrs-full_ClassesOfAssetsAxis=nggtf_InvestmentsHeldAtFVTPLMember |
| Namespace Prefix: |
|
| Data Type: |
na |
| Balance Type: |
|
| Period Type: |
|
|
| X |
- Details
| Name: |
ifrs-full_ClassesOfAssetsAxis=nggtf_InvestmentsHeldAtFVTOCIMember |
| Namespace Prefix: |
|
| Data Type: |
na |
| Balance Type: |
|
| Period Type: |
|
|
| X |
- Details
| Name: |
ifrs-full_ClassesOfAssetsAxis=nggtf_FinancingDerivativesMember |
| Namespace Prefix: |
|
| Data Type: |
na |
| Balance Type: |
|
| Period Type: |
|
|
| X |
- Details
| Name: |
ifrs-full_ClassesOfAssetsAxis=nggtf_CommodityDerivativesMember |
| Namespace Prefix: |
|
| Data Type: |
na |
| Balance Type: |
|
| Period Type: |
|
|
v3.23.3
| X |
- DefinitionThe amount of outstanding funds that the entity is obligated to repay. Reference 1: http://www.xbrl.org/2009/role/commonPracticeRef
-Name IAS
-Number 1
-IssueDate 2022-03-24
-Paragraph 55
-URI https://taxonomy.ifrs.org/xifrs-link?type=IAS&num=1&code=ifrs-tx-2022-en-r&anchor=para_55&doctype=Standard
-URIDate 2022-03-24
| Name: |
ifrs-full_Borrowings |
| Namespace Prefix: |
ifrs-full_ |
| Data Type: |
xbrli:monetaryItemType |
| Balance Type: |
credit |
| Period Type: |
instant |
|
| X |
- Definition[Line Items] for Disclosure Of Fair Value Measurement Of Assets And Liabilities [Table]
| Name: |
nggtf_DisclosureOfFairValueMeasurementOfAssetsAndLiabilitiesLineItems |
| Namespace Prefix: |
nggtf_ |
| Data Type: |
xbrli:stringItemType |
| Balance Type: |
na |
| Period Type: |
duration |
|
| X |
- DefinitionNumber Of Equity Investments
| Name: |
nggtf_NumberOfEquityInvestments |
| Namespace Prefix: |
nggtf_ |
| Data Type: |
xbrli:integerItemType |
| Balance Type: |
na |
| Period Type: |
instant |
|
| X |
- DefinitionNumber Of Equity Investments Valued Based On Internal Valuation Process
| Name: |
nggtf_NumberOfEquityInvestmentsValuedBasedOnInternalValuationProcess |
| Namespace Prefix: |
nggtf_ |
| Data Type: |
xbrli:integerItemType |
| Balance Type: |
na |
| Period Type: |
instant |
|
| X |
- DefinitionNumber Of Equity Investments Valued Based On Latest Transaction Price
| Name: |
nggtf_NumberOfEquityInvestmentsValuedBasedOnLatestTransactionPrice |
| Namespace Prefix: |
nggtf_ |
| Data Type: |
xbrli:integerItemType |
| Balance Type: |
na |
| Period Type: |
instant |
|
| X |
- Details
| Name: |
ifrs-full_MeasurementAxis=ifrs-full_AtFairValueMember |
| Namespace Prefix: |
|
| Data Type: |
na |
| Balance Type: |
|
| Period Type: |
|
|
v3.23.3
| X |
- DefinitionLine items represent concepts included in a table. These concepts are used to disclose reportable information associated with members defined in one or many axes of the table.
| Name: |
ifrs-full_DisclosureOfSensitivityAnalysisForActuarialAssumptionsLineItems |
| Namespace Prefix: |
ifrs-full_ |
| Data Type: |
xbrli:stringItemType |
| Balance Type: |
na |
| Period Type: |
duration |
|
| X |
- DefinitionSensitivity Analysis 10% Decrease In Area Price Change
| Name: |
nggtf_SensitivityAnalysis10DecreaseInAreaPriceChange |
| Namespace Prefix: |
nggtf_ |
| Data Type: |
xbrli:monetaryItemType |
| Balance Type: |
credit |
| Period Type: |
instant |
|
| X |
- DefinitionSensitivity Analysis 10% Decrease In Commodity Prices
| Name: |
nggtf_SensitivityAnalysis10DecreaseInCommodityPrices |
| Namespace Prefix: |
nggtf_ |
| Data Type: |
xbrli:monetaryItemType |
| Balance Type: |
credit |
| Period Type: |
instant |
|
| X |
- DefinitionSensitivity Analysis 10% Decrease In Venture Capital Price
| Name: |
nggtf_SensitivityAnalysis10DecreaseInVentureCapitalPrice |
| Namespace Prefix: |
nggtf_ |
| Data Type: |
xbrli:monetaryItemType |
| Balance Type: |
credit |
| Period Type: |
instant |
|
| X |
- DefinitionSensitivity Analysis 10% Increase In Area Price Change
| Name: |
nggtf_SensitivityAnalysis10IncreaseInAreaPriceChange |
| Namespace Prefix: |
nggtf_ |
| Data Type: |
xbrli:monetaryItemType |
| Balance Type: |
debit |
| Period Type: |
instant |
|
| X |
- DefinitionSensitivity Analysis 10% Increase In Commodity Prices
| Name: |
nggtf_SensitivityAnalysis10IncreaseInCommodityPrices |
| Namespace Prefix: |
nggtf_ |
| Data Type: |
xbrli:monetaryItemType |
| Balance Type: |
debit |
| Period Type: |
instant |
|
| X |
- DefinitionSensitivity Analysis 10% Increase In Venture Capital Price
| Name: |
nggtf_SensitivityAnalysis10IncreaseInVentureCapitalPrice |
| Namespace Prefix: |
nggtf_ |
| Data Type: |
xbrli:monetaryItemType |
| Balance Type: |
debit |
| Period Type: |
instant |
|
| X |
- DefinitionSensitivity Analysis 20 Basis Point Change Decrease In Market Curve
| Name: |
nggtf_SensitivityAnalysis20BasisPointChangeDecreaseInMarketCurve |
| Namespace Prefix: |
nggtf_ |
| Data Type: |
xbrli:monetaryItemType |
| Balance Type: |
credit |
| Period Type: |
instant |
|
| X |
- DefinitionSensitivity Analysis 20 Basis Point Change Decrease In Retail Price Index And Consumer Price Index
| Name: |
nggtf_SensitivityAnalysis20BasisPointChangeDecreaseInRetailPriceIndexAndConsumerPriceIndex |
| Namespace Prefix: |
nggtf_ |
| Data Type: |
xbrli:monetaryItemType |
| Balance Type: |
credit |
| Period Type: |
instant |
|
| X |
- DefinitionSensitivity Analysis 20 Basis Point Change Increast Market Curve
| Name: |
nggtf_SensitivityAnalysis20BasisPointChangeIncreaseInMarketCurve |
| Namespace Prefix: |
nggtf_ |
| Data Type: |
xbrli:monetaryItemType |
| Balance Type: |
debit |
| Period Type: |
instant |
|
| X |
- DefinitionSensitivity Analysis 20 Basis Point Change Increase In Retail Price Index And Consumer Price Index
| Name: |
nggtf_SensitivityAnalysis20BasisPointChangeIncreaseInRetailPriceIndexAndConsumerPriceIndex |
| Namespace Prefix: |
nggtf_ |
| Data Type: |
xbrli:monetaryItemType |
| Balance Type: |
debit |
| Period Type: |
instant |
|
| X |
- DefinitionSensitivity Analysis 50 Basis Point Change Decrease In Discount Rate
| Name: |
nggtf_SensitivityAnalysis50BasisPointChangeDecreaseInDiscountRate |
| Namespace Prefix: |
nggtf_ |
| Data Type: |
xbrli:monetaryItemType |
| Balance Type: |
credit |
| Period Type: |
instant |
|
| X |
- DefinitionSensitivity Analysis 50 Basis Point Change Increase In Discount Rate
| Name: |
nggtf_SensitivityAnalysis50BasisPointChangeIncreaseInDiscountRate |
| Namespace Prefix: |
nggtf_ |
| Data Type: |
xbrli:monetaryItemType |
| Balance Type: |
debit |
| Period Type: |
instant |
|
| X |
- Details
| Name: |
ifrs-full_ClassesOfFinancialInstrumentsAxis=nggtf_FinancingDerivativesMember |
| Namespace Prefix: |
|
| Data Type: |
na |
| Balance Type: |
|
| Period Type: |
|
|
| X |
- Details
| Name: |
ifrs-full_TypesOfRisksAxis=nggtf_MarketRiskLimitedPriceInflationMarketCurveTwentyBasisPointsIncreaseMember |
| Namespace Prefix: |
|
| Data Type: |
na |
| Balance Type: |
|
| Period Type: |
|
|
| X |
- Details
| Name: |
ifrs-full_TypesOfRisksAxis=nggtf_MarketRiskLimitedPriceInflationMarketCurveTwentyBasisPointsDecreaseMember |
| Namespace Prefix: |
|
| Data Type: |
na |
| Balance Type: |
|
| Period Type: |
|
|
| X |
- Details
| Name: |
ifrs-full_TypesOfRisksAxis=nggtf_MarketRiskRetailPriceIndexAndConsumerPriceIndexTwentyBasisPointsIncreaseMember |
| Namespace Prefix: |
|
| Data Type: |
na |
| Balance Type: |
|
| Period Type: |
|
|
| X |
- Details
| Name: |
ifrs-full_TypesOfRisksAxis=nggtf_MarketRiskRetailPriceIndexAndConsumerPriceIndexTwentyBasisPointsDecreaseMember |
| Namespace Prefix: |
|
| Data Type: |
na |
| Balance Type: |
|
| Period Type: |
|
|
| X |
- Details
| Name: |
ifrs-full_ClassesOfFinancialInstrumentsAxis=nggtf_CommodityDerivativesMember |
| Namespace Prefix: |
|
| Data Type: |
na |
| Balance Type: |
|
| Period Type: |
|
|
| X |
- Details
| Name: |
ifrs-full_TypesOfRisksAxis=nggtf_CommodityPriceRiskTenPercentIncreaseMember |
| Namespace Prefix: |
|
| Data Type: |
na |
| Balance Type: |
|
| Period Type: |
|
|
| X |
- Details
| Name: |
ifrs-full_TypesOfRisksAxis=nggtf_CommodityPriceRiskTenPercentDecreaseMember |
| Namespace Prefix: |
|
| Data Type: |
na |
| Balance Type: |
|
| Period Type: |
|
|
| X |
- Details
| Name: |
ifrs-full_TypesOfRisksAxis=nggtf_MarketRiskMarketAreaPriceTenPercentIncreaseMember |
| Namespace Prefix: |
|
| Data Type: |
na |
| Balance Type: |
|
| Period Type: |
|
|
| X |
- Details
| Name: |
ifrs-full_TypesOfRisksAxis=nggtf_MarketRiskMarketAreaPriceTenPercentDecreaseMember |
| Namespace Prefix: |
|
| Data Type: |
na |
| Balance Type: |
|
| Period Type: |
|
|
| X |
- Details
| Name: |
ifrs-full_ClassesOfFinancialInstrumentsAxis=nggtf_OtherFinancialInstrumentsMember |
| Namespace Prefix: |
|
| Data Type: |
na |
| Balance Type: |
|
| Period Type: |
|
|
| X |
- Details
| Name: |
ifrs-full_TypesOfRisksAxis=nggtf_DiscountRateRisk50BasisPointsIncreaseMember |
| Namespace Prefix: |
|
| Data Type: |
na |
| Balance Type: |
|
| Period Type: |
|
|
| X |
- Details
| Name: |
ifrs-full_TypesOfRisksAxis=nggtf_DiscountRateRisk50BasisPointsDecreaseMember |
| Namespace Prefix: |
|
| Data Type: |
na |
| Balance Type: |
|
| Period Type: |
|
|
| X |
- Details
| Name: |
ifrs-full_TypesOfRisksAxis=nggtf_VentureCapitalPriceRiskTenPercentIncreaseMember |
| Namespace Prefix: |
|
| Data Type: |
na |
| Balance Type: |
|
| Period Type: |
|
|
| X |
- Details
| Name: |
ifrs-full_TypesOfRisksAxis=nggtf_VentureCapitalPriceRiskTenPercentDecreaseMember |
| Namespace Prefix: |
|
| Data Type: |
na |
| Balance Type: |
|
| Period Type: |
|
|
v3.23.3
Fair value measurement - Schedule of reconciliation of changes in Level 3 (Details) - GBP (£)
£ in Millions |
6 Months Ended |
Sep. 30, 2023 |
Sep. 30, 2022 |
| Changes In Fair Value Measurement, Assets (Liabilities) [Roll Forward] |
|
|
| Financial assets (liabilities), beginning balance |
£ 1,740
|
|
| Financial assets (liabilities), ending balance |
816
|
|
| Level 3 |
|
|
| Changes In Fair Value Measurement, Assets (Liabilities) [Roll Forward] |
|
|
| Financial assets (liabilities), beginning balance |
297
|
£ 233
|
| Net gains/(losses) through the consolidated income statement for the period |
47
|
150
|
| Purchases |
1
|
(152)
|
| Settlements |
10
|
(8)
|
| Financial assets (liabilities), ending balance |
355
|
223
|
| Financing derivatives | Level 3 |
|
|
| Changes In Fair Value Measurement, Assets (Liabilities) [Roll Forward] |
|
|
| Financial assets (liabilities), beginning balance |
(100)
|
(187)
|
| Net gains/(losses) through the consolidated income statement for the period |
25
|
76
|
| Purchases |
0
|
(133)
|
| Settlements |
0
|
0
|
| Financial assets (liabilities), ending balance |
(75)
|
(244)
|
| Gains (losses) recognized in P&L |
25
|
93
|
| Commodity contract derivatives | Level 3 |
|
|
| Changes In Fair Value Measurement, Assets (Liabilities) [Roll Forward] |
|
|
| Financial assets (liabilities), beginning balance |
(36)
|
44
|
| Net gains/(losses) through the consolidated income statement for the period |
(4)
|
44
|
| Purchases |
(10)
|
(56)
|
| Settlements |
7
|
(4)
|
| Financial assets (liabilities), ending balance |
(43)
|
28
|
| Gains (losses) recognized in P&L |
(15)
|
(23)
|
| Other | Level 3 |
|
|
| Changes In Fair Value Measurement, Assets (Liabilities) [Roll Forward] |
|
|
| Financial assets (liabilities), beginning balance |
433
|
376
|
| Net gains/(losses) through the consolidated income statement for the period |
26
|
30
|
| Purchases |
11
|
37
|
| Settlements |
3
|
(4)
|
| Financial assets (liabilities), ending balance |
£ 473
|
£ 439
|
| X |
- DefinitionChanges In Fair Value Measurement, Assets (Liabilities) [Roll Forward]
| Name: |
nggtf_ChangesInFairValueMeasurementAssetsLiabilitiesRollForward |
| Namespace Prefix: |
nggtf_ |
| Data Type: |
xbrli:stringItemType |
| Balance Type: |
na |
| Period Type: |
duration |
|
| X |
- DefinitionFinancial Assets (Liabilities)
| Name: |
nggtf_FinancialAssetsLiabilities |
| Namespace Prefix: |
nggtf_ |
| Data Type: |
xbrli:monetaryItemType |
| Balance Type: |
debit |
| Period Type: |
instant |
|
| X |
- DefinitionGains (Losses) Recognized In Profit Or Loss, Fair Value Measurement, Assets (Liabilities)
| Name: |
nggtf_GainsLossesRecognizedInProfitOrLossFairValueMeasurementAssetsLiabilities |
| Namespace Prefix: |
nggtf_ |
| Data Type: |
xbrli:monetaryItemType |
| Balance Type: |
credit |
| Period Type: |
duration |
|
| X |
- DefinitionGains (Losses) Recognized In Profit Or Loss, Fair Value Measurement, Assets (Liabilities) Held At End Of Period
| Name: |
nggtf_GainsLossesRecognizedInProfitOrLossFairValueMeasurementAssetsLiabilitiesHeldAtEndOfPeriod |
| Namespace Prefix: |
nggtf_ |
| Data Type: |
xbrli:monetaryItemType |
| Balance Type: |
credit |
| Period Type: |
duration |
|
| X |
- DefinitionPurchases, Fair Value Measurement, Assets (Liabilities)
| Name: |
nggtf_PurchasesFairValueMeasurementAssetsLiabilities |
| Namespace Prefix: |
nggtf_ |
| Data Type: |
xbrli:monetaryItemType |
| Balance Type: |
debit |
| Period Type: |
duration |
|
| X |
- DefinitionSales, Fair Value Measurement, Assets (Liabilities)
| Name: |
nggtf_SalesFairValueMeasurementAssetsLiabilities |
| Namespace Prefix: |
nggtf_ |
| Data Type: |
xbrli:monetaryItemType |
| Balance Type: |
credit |
| Period Type: |
duration |
|
| X |
- Details
| Name: |
ifrs-full_LevelsOfFairValueHierarchyAxis=ifrs-full_Level3OfFairValueHierarchyMember |
| Namespace Prefix: |
|
| Data Type: |
na |
| Balance Type: |
|
| Period Type: |
|
|
| X |
- Details
| Name: |
ifrs-full_ClassesOfFinancialInstrumentsAxis=nggtf_FinancingDerivativesMember |
| Namespace Prefix: |
|
| Data Type: |
na |
| Balance Type: |
|
| Period Type: |
|
|
| X |
- Details
| Name: |
ifrs-full_ClassesOfFinancialInstrumentsAxis=nggtf_CommodityDerivativesMember |
| Namespace Prefix: |
|
| Data Type: |
na |
| Balance Type: |
|
| Period Type: |
|
|
| X |
- Details
| Name: |
ifrs-full_ClassesOfFinancialInstrumentsAxis=nggtf_OtherFinancialInstrumentsMember |
| Namespace Prefix: |
|
| Data Type: |
na |
| Balance Type: |
|
| Period Type: |
|
|
v3.23.3
| X |
- DefinitionThe amount of outstanding funds that the entity is obligated to repay. Reference 1: http://www.xbrl.org/2009/role/commonPracticeRef
-Name IAS
-Number 1
-IssueDate 2022-03-24
-Paragraph 55
-URI https://taxonomy.ifrs.org/xifrs-link?type=IAS&num=1&code=ifrs-tx-2022-en-r&anchor=para_55&doctype=Standard
-URIDate 2022-03-24
| Name: |
ifrs-full_Borrowings |
| Namespace Prefix: |
ifrs-full_ |
| Data Type: |
xbrli:monetaryItemType |
| Balance Type: |
credit |
| Period Type: |
instant |
|
| X |
- DefinitionThe amount of cash on hand and demand deposits, along with short-term, highly liquid investments that are readily convertible to known amounts of cash and that are subject to an insignificant risk of changes in value. [Refer: Cash; Cash equivalents] Reference 1: http://www.xbrl.org/2003/role/disclosureRef
-Name IAS
-Number 7
-IssueDate 2022-03-24
-Paragraph 45
-URI https://taxonomy.ifrs.org/xifrs-link?type=IAS&num=7&code=ifrs-tx-2022-en-r&anchor=para_45&doctype=Standard
-URIDate 2022-03-24
Reference 2: http://www.xbrl.org/2003/role/disclosureRef
-Name IFRS
-Number 12
-IssueDate 2022-03-24
-Paragraph B13
-Subparagraph a
-URI https://taxonomy.ifrs.org/xifrs-link?type=IFRS&num=12&code=ifrs-tx-2022-en-r&anchor=para_B13_a&doctype=Appendix&subtype=B
-URIDate 2022-03-24
Reference 3: http://www.xbrl.org/2003/role/disclosureRef
-Name IAS
-Number 1
-IssueDate 2022-03-24
-Paragraph 54
-Subparagraph i
-URI https://taxonomy.ifrs.org/xifrs-link?type=IAS&num=1&code=ifrs-tx-2022-en-r&anchor=para_54_i&doctype=Standard
-URIDate 2022-03-24
| Name: |
ifrs-full_CashAndCashEquivalents |
| Namespace Prefix: |
ifrs-full_ |
| Data Type: |
xbrli:monetaryItemType |
| Balance Type: |
debit |
| Period Type: |
instant |
|
| X |
- DefinitionLine items represent concepts included in a table. These concepts are used to disclose reportable information associated with members defined in one or many axes of the table.
| Name: |
ifrs-full_DisclosureOfFinancialInstrumentsLineItems |
| Namespace Prefix: |
ifrs-full_ |
| Data Type: |
xbrli:stringItemType |
| Balance Type: |
na |
| Period Type: |
duration |
|
| X |
- DefinitionThe amount of net debt of the entity. Reference 1: http://www.xbrl.org/2009/role/commonPracticeRef
-Name IAS
-Number 1
-IssueDate 2022-03-24
-Paragraph 112
-Subparagraph c
-URI https://taxonomy.ifrs.org/xifrs-link?type=IAS&num=1&code=ifrs-tx-2022-en-r&anchor=para_112_c&doctype=Standard
-URIDate 2022-03-24
| Name: |
ifrs-full_NetDebt |
| Namespace Prefix: |
ifrs-full_ |
| Data Type: |
xbrli:monetaryItemType |
| Balance Type: |
credit |
| Period Type: |
instant |
|
| X |
- DefinitionThe amount of current financial assets that the entity does not separately disclose in the same statement or note. [Refer: Other financial assets; Current financial assets] Reference 1: http://www.xbrl.org/2003/role/disclosureRef
-Name IAS
-Number 1
-IssueDate 2022-03-24
-Paragraph 54
-Subparagraph d
-URI https://taxonomy.ifrs.org/xifrs-link?type=IAS&num=1&code=ifrs-tx-2022-en-r&anchor=para_54_d&doctype=Standard
-URIDate 2022-03-24
| Name: |
ifrs-full_OtherCurrentFinancialAssets |
| Namespace Prefix: |
ifrs-full_ |
| Data Type: |
xbrli:monetaryItemType |
| Balance Type: |
debit |
| Period Type: |
instant |
|
| X |
- DefinitionDerivative Financial Assets (Liabilities)
| Name: |
nggtf_DerivativeFinancialAssetsLiabilities |
| Namespace Prefix: |
nggtf_ |
| Data Type: |
xbrli:monetaryItemType |
| Balance Type: |
debit |
| Period Type: |
instant |
|
| X |
- Definition
+ References
+ Details
| Name: |
nggtf_FinancingDerivatives |
| Namespace Prefix: |
nggtf_ |
| Data Type: |
xbrli:monetaryItemType |
| Balance Type: |
debit |
| Period Type: |
instant |
|
| X |
- Details
| Name: |
ifrs-full_ClassesOfFinancialInstrumentsAxis=ifrs-full_DerivativesMember |
| Namespace Prefix: |
|
| Data Type: |
na |
| Balance Type: |
|
| Period Type: |
|
|
| X |
- Details
| Name: |
ifrs-full_HedgedItemsAxis=nggtf_CapitalExpendituresMember |
| Namespace Prefix: |
|
| Data Type: |
na |
| Balance Type: |
|
| Period Type: |
|
|
v3.23.3
| X |
- DefinitionThe amount of financial assets classified as derivative instruments. [Refer: Financial assets; Derivatives [member]] Reference 1: http://www.xbrl.org/2009/role/commonPracticeRef
-Name IAS
-Number 1
-IssueDate 2022-03-24
-Paragraph 55
-URI https://taxonomy.ifrs.org/xifrs-link?type=IAS&num=1&code=ifrs-tx-2022-en-r&anchor=para_55&doctype=Standard
-URIDate 2022-03-24
| Name: |
ifrs-full_DerivativeFinancialAssets |
| Namespace Prefix: |
ifrs-full_ |
| Data Type: |
xbrli:monetaryItemType |
| Balance Type: |
debit |
| Period Type: |
instant |
|
| X |
- DefinitionThe amount of financial liabilities classified as derivative instruments. [Refer: Financial assets; Derivatives [member]] Reference 1: http://www.xbrl.org/2009/role/commonPracticeRef
-Name IAS
-Number 1
-IssueDate 2022-03-24
-Paragraph 55
-URI https://taxonomy.ifrs.org/xifrs-link?type=IAS&num=1&code=ifrs-tx-2022-en-r&anchor=para_55&doctype=Standard
-URIDate 2022-03-24
| Name: |
ifrs-full_DerivativeFinancialLiabilities |
| Namespace Prefix: |
ifrs-full_ |
| Data Type: |
xbrli:monetaryItemType |
| Balance Type: |
credit |
| Period Type: |
instant |
|
| X |
- DefinitionLine items represent concepts included in a table. These concepts are used to disclose reportable information associated with members defined in one or many axes of the table.
| Name: |
ifrs-full_DisclosureOfFinancialInstrumentsLineItems |
| Namespace Prefix: |
ifrs-full_ |
| Data Type: |
xbrli:stringItemType |
| Balance Type: |
na |
| Period Type: |
duration |
|
| X |
- DefinitionDerivative Financial Assets (Liabilities)
| Name: |
nggtf_DerivativeFinancialAssetsLiabilities |
| Namespace Prefix: |
nggtf_ |
| Data Type: |
xbrli:monetaryItemType |
| Balance Type: |
debit |
| Period Type: |
instant |
|
| X |
- Details
| Name: |
ifrs-full_ClassesOfFinancialInstrumentsAxis=nggtf_FinancingDerivativesMember |
| Namespace Prefix: |
|
| Data Type: |
na |
| Balance Type: |
|
| Period Type: |
|
|
| X |
- Details
| Name: |
ifrs-full_ClassesOfFinancialInstrumentsAxis=nggtf_CommodityDerivativesMember |
| Namespace Prefix: |
|
| Data Type: |
na |
| Balance Type: |
|
| Period Type: |
|
|
v3.23.3
Pensions and other post-retirement benefit obligations - Schedule of defined benefit plan recognised in balance sheet (Details) - GBP (£)
£ in Millions |
Sep. 30, 2023 |
Mar. 31, 2023 |
| Disclosure of defined benefit plans [line items] |
|
|
| Other post-employment liabilities |
£ (67)
|
£ (69)
|
| Net defined benefit asset |
1,737
|
1,951
|
| Assets |
2,352
|
2,645
|
| Liabilities |
(615)
|
(694)
|
| Funded obligations |
|
|
| Disclosure of defined benefit plans [line items] |
|
|
| Present value of obligations |
(17,502)
|
(18,934)
|
| Fair value of plan assets |
19,570
|
21,246
|
| Funding surplus/(deficit) |
2,068
|
2,312
|
| Unfunded obligations |
|
|
| Disclosure of defined benefit plans [line items] |
|
|
| Present value of obligations |
£ (264)
|
£ (292)
|
| X |
- DefinitionThe present value, without deducting any plan assets, of expected future payments required to settle the obligation resulting from employee service in the current and prior periods. [Refer: Plan assets, at fair value] Reference 1: http://www.xbrl.org/2009/role/commonPracticeRef
-Name IAS
-Number 19
-IssueDate 2022-03-24
-Paragraph 57
-Subparagraph a
-URI https://taxonomy.ifrs.org/xifrs-link?type=IAS&num=19&code=ifrs-tx-2022-en-r&anchor=para_57_a&doctype=Standard
-URIDate 2022-03-24
| Name: |
ifrs-full_DefinedBenefitObligationAtPresentValue |
| Namespace Prefix: |
ifrs-full_ |
| Data Type: |
xbrli:monetaryItemType |
| Balance Type: |
credit |
| Period Type: |
instant |
|
| X |
- DefinitionLine items represent concepts included in a table. These concepts are used to disclose reportable information associated with members defined in one or many axes of the table.
| Name: |
ifrs-full_DisclosureOfDefinedBenefitPlansLineItems |
| Namespace Prefix: |
ifrs-full_ |
| Data Type: |
xbrli:stringItemType |
| Balance Type: |
na |
| Period Type: |
duration |
|
| X |
- DefinitionThe amount of deficit or surplus in a defined benefit plan, adjusted for any effect of limiting a net defined benefit asset to the asset ceiling. [Refer: Defined benefit plans [member]] Reference 1: http://www.xbrl.org/2003/role/disclosureRef
-Name IAS
-Number 19
-IssueDate 2022-03-24
-Paragraph 140
-Subparagraph a
-URI https://taxonomy.ifrs.org/xifrs-link?type=IAS&num=19&code=ifrs-tx-2022-en-r&anchor=para_140_a&doctype=Standard
-URIDate 2022-03-24
| Name: |
ifrs-full_LiabilityAssetOfDefinedBenefitPlans |
| Namespace Prefix: |
ifrs-full_ |
| Data Type: |
xbrli:monetaryItemType |
| Balance Type: |
credit |
| Period Type: |
instant |
|
| X |
- DefinitionThe fair value of defined benefit plan assets. Plan assets comprise assets held by a long-term employee benefit fund and qualifying insurance policies. [Refer: At fair value [member]] Reference 1: http://www.xbrl.org/2009/role/commonPracticeRef
-Name IAS
-Number 19
-IssueDate 2022-03-24
-Paragraph 57
-Subparagraph a
-URI https://taxonomy.ifrs.org/xifrs-link?type=IAS&num=19&code=ifrs-tx-2022-en-r&anchor=para_57_a&doctype=Standard
-URIDate 2022-03-24
| Name: |
ifrs-full_PlanAssetsAtFairValue |
| Namespace Prefix: |
ifrs-full_ |
| Data Type: |
xbrli:monetaryItemType |
| Balance Type: |
debit |
| Period Type: |
instant |
|
| X |
- DefinitionThe amount of surplus in a defined benefit plan, adjusted for any effect of limiting a net defined benefit asset to the asset ceiling. [Refer: Defined benefit plans [member]] Reference 1: http://www.xbrl.org/2009/role/commonPracticeRef
-Name IAS
-Number 1
-IssueDate 2022-03-24
-Paragraph 55
-URI https://taxonomy.ifrs.org/xifrs-link?type=IAS&num=1&code=ifrs-tx-2022-en-r&anchor=para_55&doctype=Standard
-URIDate 2022-03-24
| Name: |
ifrs-full_RecognisedAssetsDefinedBenefitPlan |
| Namespace Prefix: |
ifrs-full_ |
| Data Type: |
xbrli:monetaryItemType |
| Balance Type: |
debit |
| Period Type: |
instant |
|
| X |
- DefinitionThe amount of deficit in a defined benefit plan. [Refer: Defined benefit plans [member]] Reference 1: http://www.xbrl.org/2009/role/commonPracticeRef
-Name IAS
-Number 1
-IssueDate 2022-03-24
-Paragraph 55
-URI https://taxonomy.ifrs.org/xifrs-link?type=IAS&num=1&code=ifrs-tx-2022-en-r&anchor=para_55&doctype=Standard
-URIDate 2022-03-24
| Name: |
ifrs-full_RecognisedLiabilitiesDefinedBenefitPlan |
| Namespace Prefix: |
ifrs-full_ |
| Data Type: |
xbrli:monetaryItemType |
| Balance Type: |
credit |
| Period Type: |
instant |
|
| X |
- DefinitionThe fair value of any plan assets, less the present value of the defined benefit obligation. [Refer: Plan assets [member]] Reference 1: http://www.xbrl.org/2009/role/commonPracticeRef
-Name IAS
-Number 19
-IssueDate 2022-03-24
-Paragraph 57
-Subparagraph a
-URI https://taxonomy.ifrs.org/xifrs-link?type=IAS&num=19&code=ifrs-tx-2022-en-r&anchor=para_57_a&doctype=Standard
-URIDate 2022-03-24
| Name: |
ifrs-full_SurplusDeficitInPlan |
| Namespace Prefix: |
ifrs-full_ |
| Data Type: |
xbrli:monetaryItemType |
| Balance Type: |
debit |
| Period Type: |
instant |
|
| X |
- DefinitionOther Post-Employment Liabilities
| Name: |
nggtf_OtherPostEmploymentLiabilities |
| Namespace Prefix: |
nggtf_ |
| Data Type: |
xbrli:monetaryItemType |
| Balance Type: |
credit |
| Period Type: |
instant |
|
| X |
- Details
| Name: |
ifrs-full_FundingArrangementsOfDefinedBenefitPlansAxis=ifrs-full_WhollyOrPartlyFundedDefinedBenefitPlansMember |
| Namespace Prefix: |
|
| Data Type: |
na |
| Balance Type: |
|
| Period Type: |
|
|
| X |
- Details
| Name: |
ifrs-full_FundingArrangementsOfDefinedBenefitPlansAxis=ifrs-full_WhollyUnfundedDefinedBenefitPlansMember |
| Namespace Prefix: |
|
| Data Type: |
na |
| Balance Type: |
|
| Period Type: |
|
|
v3.23.3
| X |
- DefinitionThe discount rate used as the significant actuarial assumption to determine the present value of a defined benefit obligation. [Refer: Defined benefit obligation, at present value; Actuarial assumptions [member]] Reference 1: http://www.xbrl.org/2009/role/commonPracticeRef
-Name IAS
-Number 19
-IssueDate 2022-03-24
-Paragraph 144
-URI https://taxonomy.ifrs.org/xifrs-link?type=IAS&num=19&code=ifrs-tx-2022-en-r&anchor=para_144&doctype=Standard
-URIDate 2022-03-24
| Name: |
ifrs-full_ActuarialAssumptionOfDiscountRates |
| Namespace Prefix: |
ifrs-full_ |
| Data Type: |
dtr-types:percentItemType |
| Balance Type: |
na |
| Period Type: |
instant |
|
| X |
- DefinitionLine items represent concepts included in a table. These concepts are used to disclose reportable information associated with members defined in one or many axes of the table.
| Name: |
ifrs-full_DisclosureOfDefinedBenefitPlansLineItems |
| Namespace Prefix: |
ifrs-full_ |
| Data Type: |
xbrli:stringItemType |
| Balance Type: |
na |
| Period Type: |
duration |
|
| X |
- DefinitionActuarial Assumption Of Discount Rates, Past Service
| Name: |
nggtf_ActuarialAssumptionOfDiscountRatesPastService |
| Namespace Prefix: |
nggtf_ |
| Data Type: |
dtr-types:percentItemType |
| Balance Type: |
na |
| Period Type: |
instant |
|
| X |
- DefinitionActuarial Assumption Of Expected Rates Of Pension Increases, Past Service
| Name: |
nggtf_ActuarialAssumptionOfExpectedRatesOfPensionIncreasesPastService |
| Namespace Prefix: |
nggtf_ |
| Data Type: |
dtr-types:percentItemType |
| Balance Type: |
na |
| Period Type: |
instant |
|
| X |
- Details
| Name: |
ifrs-full_GeographicalAreasAxis=ifrs-full_CountryOfDomicileMember |
| Namespace Prefix: |
|
| Data Type: |
na |
| Balance Type: |
|
| Period Type: |
|
|
| X |
- Details
| Name: |
ifrs-full_GeographicalAreasAxis=country_US |
| Namespace Prefix: |
|
| Data Type: |
na |
| Balance Type: |
|
| Period Type: |
|
|
v3.23.3
| X |
- DefinitionThe decrease (increase) in a net defined benefit liability (asset) resulting from actuarial gains (losses) arising from changes in financial assumptions that result in remeasurements of the net defined benefit liability (asset). Financial assumptions deal with items such as: (a) the discount rate; (b) benefit levels, excluding any cost of the benefits to be met by employees, and future salary; (c) in the case of medical benefits, future medical costs, including claim handling costs (ie the costs that will be incurred in processing and resolving claims, including legal and adjuster's fees); and (d) taxes payable by the plan on contributions relating to service before the reporting date or on benefits resulting from that service. [Refer: Net defined benefit liability (asset)] Reference 1: http://www.xbrl.org/2003/role/disclosureRef
-Name IAS
-Number 19
-IssueDate 2022-03-24
-Paragraph 141
-Subparagraph c
-Clause iii
-URI https://taxonomy.ifrs.org/xifrs-link?type=IAS&num=19&code=ifrs-tx-2022-en-r&anchor=para_141_c_iii&doctype=Standard
-URIDate 2022-03-24
| Name: |
ifrs-full_ActuarialGainsLossesArisingFromChangesInFinancialAssumptionsNetDefinedBenefitLiabilityAsset |
| Namespace Prefix: |
ifrs-full_ |
| Data Type: |
xbrli:monetaryItemType |
| Balance Type: |
debit |
| Period Type: |
duration |
|
| X |
- DefinitionLine items represent concepts included in a table. These concepts are used to disclose reportable information associated with members defined in one or many axes of the table.
| Name: |
ifrs-full_DisclosureOfDefinedBenefitPlansLineItems |
| Namespace Prefix: |
ifrs-full_ |
| Data Type: |
xbrli:stringItemType |
| Balance Type: |
na |
| Period Type: |
duration |
|
| X |
- DefinitionThe decrease (increase) in a net defined benefit liability (asset) resulting from the remeasurement of that net defined benefit liability (asset). [Refer: Net defined benefit liability (asset)] Reference 1: http://www.xbrl.org/2003/role/disclosureRef
-Name IAS
-Number 19
-IssueDate 2022-03-24
-Paragraph 141
-Subparagraph c
-URI https://taxonomy.ifrs.org/xifrs-link?type=IAS&num=19&code=ifrs-tx-2022-en-r&anchor=para_141_c&doctype=Standard
-URIDate 2022-03-24
| Name: |
ifrs-full_GainLossOnRemeasurementOfNetDefinedBenefitLiabilityAsset |
| Namespace Prefix: |
ifrs-full_ |
| Data Type: |
xbrli:monetaryItemType |
| Balance Type: |
debit |
| Period Type: |
duration |
|
| X |
- DefinitionThe increase (decrease) in the net defined benefit liability (asset). [Refer: Net defined benefit liability (asset)] Reference 1: http://www.xbrl.org/2003/role/disclosureRef
-Name IAS
-Number 19
-IssueDate 2022-03-24
-Paragraph 141
-URI https://taxonomy.ifrs.org/xifrs-link?type=IAS&num=19&code=ifrs-tx-2022-en-r&anchor=para_141&doctype=Standard
-URIDate 2022-03-24
| Name: |
ifrs-full_IncreaseDecreaseInNetDefinedBenefitLiabilityAsset |
| Namespace Prefix: |
ifrs-full_ |
| Data Type: |
xbrli:monetaryItemType |
| Balance Type: |
credit |
| Period Type: |
duration |
|
| X |
- DefinitionThe amount of deficit or surplus in a defined benefit plan, adjusted for any effect of limiting a net defined benefit asset to the asset ceiling. [Refer: Defined benefit plans [member]] Reference 1: http://www.xbrl.org/2003/role/disclosureRef
-Name IAS
-Number 19
-IssueDate 2022-03-24
-Paragraph 140
-Subparagraph a
-URI https://taxonomy.ifrs.org/xifrs-link?type=IAS&num=19&code=ifrs-tx-2022-en-r&anchor=para_140_a&doctype=Standard
-URIDate 2022-03-24
| Name: |
ifrs-full_LiabilityAssetOfDefinedBenefitPlans |
| Namespace Prefix: |
ifrs-full_ |
| Data Type: |
xbrli:monetaryItemType |
| Balance Type: |
credit |
| Period Type: |
instant |
|
| X |
- DefinitionThe decrease (increase) in the net defined benefit liability (asset) resulting from the return on plan assets, excluding amounts included in interest income or expense. The return on plan assets is interest, dividends and other revenue derived from the plan assets, together with realised and unrealised gains or losses on the plan assets, less any costs of managing plan assets and less any tax payable by the plan itself, other than tax included in the actuarial assumptions used to measure the present value of the defined benefit obligation. [Refer: Plan assets [member]; Net defined benefit liability (asset); Actuarial assumptions [member]; Increase (decrease) in net defined benefit liability (asset) resulting from interest expense (income)] Reference 1: http://www.xbrl.org/2003/role/disclosureRef
-Name IAS
-Number 19
-IssueDate 2022-03-24
-Paragraph 141
-Subparagraph c
-Clause i
-URI https://taxonomy.ifrs.org/xifrs-link?type=IAS&num=19&code=ifrs-tx-2022-en-r&anchor=para_141_c_i&doctype=Standard
-URIDate 2022-03-24
| Name: |
ifrs-full_ReturnOnPlanAssetsNetDefinedBenefitLiabilityAsset |
| Namespace Prefix: |
ifrs-full_ |
| Data Type: |
xbrli:monetaryItemType |
| Balance Type: |
debit |
| Period Type: |
duration |
|
| X |
- DefinitionThe fair value of any plan assets, less the present value of the defined benefit obligation. [Refer: Plan assets [member]] Reference 1: http://www.xbrl.org/2009/role/commonPracticeRef
-Name IAS
-Number 19
-IssueDate 2022-03-24
-Paragraph 57
-Subparagraph a
-URI https://taxonomy.ifrs.org/xifrs-link?type=IAS&num=19&code=ifrs-tx-2022-en-r&anchor=para_57_a&doctype=Standard
-URIDate 2022-03-24
| Name: |
ifrs-full_SurplusDeficitInPlan |
| Namespace Prefix: |
ifrs-full_ |
| Data Type: |
xbrli:monetaryItemType |
| Balance Type: |
debit |
| Period Type: |
instant |
|
| X |
- Details
| Name: |
ifrs-full_GeographicalAreasAxis=ifrs-full_CountryOfDomicileMember |
| Namespace Prefix: |
|
| Data Type: |
na |
| Balance Type: |
|
| Period Type: |
|
|
| X |
- Details
| Name: |
ifrs-full_GeographicalAreasAxis=country_US |
| Namespace Prefix: |
|
| Data Type: |
na |
| Balance Type: |
|
| Period Type: |
|
|
v3.23.3
| X |
- DefinitionThe amount of capital commitments for which the entity has entered into a contract. [Refer: Capital commitments] Reference 1: http://www.xbrl.org/2009/role/commonPracticeRef
-Name IAS
-Number 1
-IssueDate 2022-03-24
-Paragraph 112
-Subparagraph c
-URI https://taxonomy.ifrs.org/xifrs-link?type=IAS&num=1&code=ifrs-tx-2022-en-r&anchor=para_112_c&doctype=Standard
-URIDate 2022-03-24
| Name: |
ifrs-full_ContractualCapitalCommitments |
| Namespace Prefix: |
ifrs-full_ |
| Data Type: |
xbrli:monetaryItemType |
| Balance Type: |
credit |
| Period Type: |
instant |
|
| X |
- References
+ Details
| Name: |
ifrs-full_SubclassificationsOfAssetsLiabilitiesAndEquitiesAbstract |
| Namespace Prefix: |
ifrs-full_ |
| Data Type: |
xbrli:stringItemType |
| Balance Type: |
na |
| Period Type: |
duration |
|
| X |
- DefinitionEnergy Purchase Commitments
| Name: |
nggtf_EnergyPurchaseCommitments |
| Namespace Prefix: |
nggtf_ |
| Data Type: |
xbrli:monetaryItemType |
| Balance Type: |
credit |
| Period Type: |
instant |
|
v3.23.3
| X |
- DefinitionThe average exchange rate used by the entity. Exchange rate is the ratio of exchange for two currencies. Reference 1: http://www.xbrl.org/2009/role/commonPracticeRef
-Name IAS
-Number 1
-IssueDate 2022-03-24
-Paragraph 112
-Subparagraph c
-URI https://taxonomy.ifrs.org/xifrs-link?type=IAS&num=1&code=ifrs-tx-2022-en-r&anchor=para_112_c&doctype=Standard
-URIDate 2022-03-24
| Name: |
ifrs-full_AverageForeignExchangeRate |
| Namespace Prefix: |
ifrs-full_ |
| Data Type: |
xbrli:decimalItemType |
| Balance Type: |
na |
| Period Type: |
duration |
|
| X |
- DefinitionThe spot exchange rate at the end of the reporting period. Exchange rate is the ratio of exchange for two currencies. Spot exchange rate is the exchange rate for immediate delivery. Reference 1: http://www.xbrl.org/2009/role/commonPracticeRef
-Name IAS
-Number 1
-IssueDate 2022-03-24
-Paragraph 112
-Subparagraph c
-URI https://taxonomy.ifrs.org/xifrs-link?type=IAS&num=1&code=ifrs-tx-2022-en-r&anchor=para_112_c&doctype=Standard
-URIDate 2022-03-24
| Name: |
ifrs-full_ClosingForeignExchangeRate |
| Namespace Prefix: |
ifrs-full_ |
| Data Type: |
xbrli:decimalItemType |
| Balance Type: |
na |
| Period Type: |
instant |
|
| X |
- References
+ Details
| Name: |
ifrs-full_ForeignExchangeRatesAbstract |
| Namespace Prefix: |
ifrs-full_ |
| Data Type: |
xbrli:stringItemType |
| Balance Type: |
na |
| Period Type: |
duration |
|
v3.23.3
| X |
- DefinitionThe cash inflow from issuing shares. Reference 1: http://www.xbrl.org/2003/role/exampleRef
-Name IAS
-Number 7
-IssueDate 2022-03-24
-Paragraph 17
-Subparagraph a
-URI https://taxonomy.ifrs.org/xifrs-link?type=IAS&num=7&code=ifrs-tx-2022-en-r&anchor=para_17_a&doctype=Standard
-URIDate 2022-03-24
| Name: |
ifrs-full_ProceedsFromIssuingShares |
| Namespace Prefix: |
ifrs-full_ |
| Data Type: |
xbrli:monetaryItemType |
| Balance Type: |
debit |
| Period Type: |
duration |
|
| X |
- DefinitionPreferred Shares Issuance Rate
| Name: |
nggtf_PreferredSharesIssuanceRate |
| Namespace Prefix: |
nggtf_ |
| Data Type: |
dtr-types:percentItemType |
| Balance Type: |
na |
| Period Type: |
duration |
|
| X |
- Details
| Name: |
dei_LegalEntityAxis=nggtf_ParentGuarantorAndNiagaraMohawkPowerCorporationMember |
| Namespace Prefix: |
|
| Data Type: |
na |
| Balance Type: |
|
| Period Type: |
|
|
| X |
- Details
| Name: |
ifrs-full_BorrowingsByNameAxis=nggtf_SubsidiaryGuarantorNationalGridGasPlcMember |
| Namespace Prefix: |
|
| Data Type: |
na |
| Balance Type: |
|
| Period Type: |
|
|
| X |
- Details
| Name: |
ifrs-full_BorrowingsByNameAxis=nggtf_IssuerOfNotesBritishTranscoFinanceInc.Member |
| Namespace Prefix: |
|
| Data Type: |
na |
| Balance Type: |
|
| Period Type: |
|
|
v3.23.3
Additional disclosures in respect of guaranteed securities - Disclosure of Combined Statement of Financial Position (Details) - GBP (£)
£ in Millions |
Sep. 30, 2023 |
Mar. 31, 2023 |
Sep. 30, 2022 |
Mar. 31, 2022 |
| Disclosure of information about consolidated structured entities [line items] |
|
|
|
|
| Non-current assets |
£ 86,550
|
£ 83,531
|
|
|
| Current assets |
7,697
|
9,166
|
|
|
| Current liabilities |
(8,279)
|
(9,130)
|
|
|
| Non-current liabilities |
(56,488)
|
(54,005)
|
|
|
| Net assets |
29,480
|
29,562
|
|
|
| Equity |
29,480
|
£ 29,562
|
£ 25,957
|
£ 23,856
|
| Other subsidiaries |
|
|
|
|
| Disclosure of information about consolidated structured entities [line items] |
|
|
|
|
| Non-current assets |
126
|
|
|
|
| Current assets |
15,557
|
|
|
|
| Current liabilities |
(6,893)
|
|
|
|
| Non-current liabilities |
(2,080)
|
|
|
|
| Investments in subsidiaries reported in separate financial statements |
14,480
|
|
|
|
| National Grid plc and Niagara Mohawk Power Corporation combined |
|
|
|
|
| Disclosure of information about consolidated structured entities [line items] |
|
|
|
|
| Non-current assets |
12,033
|
|
|
|
| Current assets |
1,526
|
|
|
|
| Current liabilities |
(1,263)
|
|
|
|
| Non-current liabilities |
(13,703)
|
|
|
|
| Net assets |
5,303
|
|
|
|
| Equity |
£ 5,303
|
|
|
|
| X |
- DefinitionThe amount of assets that the entity (a) expects to realise or intends to sell or consume in its normal operating cycle; (b) holds primarily for the purpose of trading; (c) expects to realise within twelve months after the reporting period; or (d) classifies as cash or cash equivalents (as defined in IAS 7) unless the asset is restricted from being exchanged or used to settle a liability for at least twelve months after the reporting period. [Refer: Assets] Reference 1: http://www.xbrl.org/2003/role/disclosureRef
-Name IFRS
-Number 12
-IssueDate 2022-03-24
-Paragraph B12
-Subparagraph b
-Clause i
-URI https://taxonomy.ifrs.org/xifrs-link?type=IFRS&num=12&code=ifrs-tx-2022-en-r&anchor=para_B12_b_i&doctype=Appendix&subtype=B
-URIDate 2022-03-24
Reference 2: http://www.xbrl.org/2003/role/exampleRef
-Name IFRS
-Number 12
-IssueDate 2022-03-24
-Paragraph B10
-Subparagraph b
-URI https://taxonomy.ifrs.org/xifrs-link?type=IFRS&num=12&code=ifrs-tx-2022-en-r&anchor=para_B10_b&doctype=Appendix&subtype=B
-URIDate 2022-03-24
Reference 3: http://www.xbrl.org/2003/role/disclosureRef
-Name IAS
-Number 1
-IssueDate 2022-03-24
-Paragraph 66
-URI https://taxonomy.ifrs.org/xifrs-link?type=IAS&num=1&code=ifrs-tx-2022-en-r&anchor=para_66&doctype=Standard
-URIDate 2022-03-24
| Name: |
ifrs-full_CurrentAssets |
| Namespace Prefix: |
ifrs-full_ |
| Data Type: |
xbrli:monetaryItemType |
| Balance Type: |
debit |
| Period Type: |
instant |
|
| X |
- DefinitionExpiry date 2023-01-01: The amount of liabilities that: (a) the entity expects to settle in its normal operating cycle; (b) the entity holds primarily for the purpose of trading; (c) are due to be settled within twelve months after the reporting period; or (d) the entity does not have an unconditional right to defer settlement for at least twelve months after the reporting period.
Effective 2023-01-01: The amount of liabilities that: (a) the entity expects to settle in its normal operating cycle; (b) the entity holds primarily for the purpose of trading; (c) are due to be settled within twelve months after the reporting period; or (d) the entity does not have the right at the end of the reporting period to defer settlement for at least twelve months after the reporting period. Reference 1: http://www.xbrl.org/2003/role/disclosureRef
-Name IFRS
-Number 12
-IssueDate 2022-03-24
-Paragraph B12
-Subparagraph b
-Clause iii
-URI https://taxonomy.ifrs.org/xifrs-link?type=IFRS&num=12&code=ifrs-tx-2022-en-r&anchor=para_B12_b_iii&doctype=Appendix&subtype=B
-URIDate 2022-03-24
Reference 2: http://www.xbrl.org/2003/role/exampleRef
-Name IFRS
-Number 12
-IssueDate 2022-03-24
-Paragraph B10
-Subparagraph b
-URI https://taxonomy.ifrs.org/xifrs-link?type=IFRS&num=12&code=ifrs-tx-2022-en-r&anchor=para_B10_b&doctype=Appendix&subtype=B
-URIDate 2022-03-24
Reference 3: http://www.xbrl.org/2003/role/disclosureRef
-Name IAS
-Number 1
-IssueDate 2022-03-24
-Paragraph 69
-URI https://taxonomy.ifrs.org/xifrs-link?type=IAS&num=1&code=ifrs-tx-2022-en-r&anchor=para_69&doctype=Standard
-URIDate 2022-03-24
| Name: |
ifrs-full_CurrentLiabilities |
| Namespace Prefix: |
ifrs-full_ |
| Data Type: |
xbrli:monetaryItemType |
| Balance Type: |
credit |
| Period Type: |
instant |
|
| X |
- DefinitionThe amount of residual interest in the assets of the entity after deducting all its liabilities. Reference 1: http://www.xbrl.org/2003/role/disclosureRef
-Name IFRS
-Number 1
-IssueDate 2022-03-24
-Paragraph 24
-Subparagraph a
-URI https://taxonomy.ifrs.org/xifrs-link?type=IFRS&num=1&code=ifrs-tx-2022-en-r&anchor=para_24_a&doctype=Standard
-URIDate 2022-03-24
Reference 2: http://www.xbrl.org/2003/role/disclosureRef
-Name IFRS
-Number 1
-IssueDate 2022-03-24
-Paragraph 32
-Subparagraph a
-Clause i
-URI https://taxonomy.ifrs.org/xifrs-link?type=IFRS&num=1&code=ifrs-tx-2022-en-r&anchor=para_32_a_i&doctype=Standard
-URIDate 2022-03-24
Reference 3: http://www.xbrl.org/2003/role/disclosureRef
-Name IFRS
-Number 13
-IssueDate 2022-03-24
-Paragraph 93
-Subparagraph a
-URI https://taxonomy.ifrs.org/xifrs-link?type=IFRS&num=13&code=ifrs-tx-2022-en-r&anchor=para_93_a&doctype=Standard
-URIDate 2022-03-24
Reference 4: http://www.xbrl.org/2003/role/disclosureRef
-Name IFRS
-Number 13
-IssueDate 2022-03-24
-Paragraph 93
-Subparagraph b
-URI https://taxonomy.ifrs.org/xifrs-link?type=IFRS&num=13&code=ifrs-tx-2022-en-r&anchor=para_93_b&doctype=Standard
-URIDate 2022-03-24
Reference 5: http://www.xbrl.org/2003/role/disclosureRef
-Name IFRS
-Number 13
-IssueDate 2022-03-24
-Paragraph 93
-Subparagraph e
-URI https://taxonomy.ifrs.org/xifrs-link?type=IFRS&num=13&code=ifrs-tx-2022-en-r&anchor=para_93_e&doctype=Standard
-URIDate 2022-03-24
Reference 6: http://www.xbrl.org/2003/role/disclosureRef
-Name IAS
-Number 1
-IssueDate 2022-03-24
-Paragraph 55
-URI https://taxonomy.ifrs.org/xifrs-link?type=IAS&num=1&code=ifrs-tx-2022-en-r&anchor=para_55&doctype=Standard
-URIDate 2022-03-24
Reference 7: http://www.xbrl.org/2003/role/disclosureRef
-Name IAS
-Number 1
-IssueDate 2022-03-24
-Paragraph 78
-Subparagraph e
-URI https://taxonomy.ifrs.org/xifrs-link?type=IAS&num=1&code=ifrs-tx-2022-en-r&anchor=para_78_e&doctype=Standard
-URIDate 2022-03-24
| Name: |
ifrs-full_Equity |
| Namespace Prefix: |
ifrs-full_ |
| Data Type: |
xbrli:monetaryItemType |
| Balance Type: |
credit |
| Period Type: |
instant |
|
| X |
- DefinitionThe amount of investments in subsidiaries in an entity's separate financial statements. [Refer: Subsidiaries [member]] Reference 1: http://www.xbrl.org/2003/role/disclosureRef
-Name IAS
-Number 27
-IssueDate 2022-03-24
-Paragraph 10
-URI https://taxonomy.ifrs.org/xifrs-link?type=IAS&num=27&code=ifrs-tx-2022-en-r&anchor=para_10&doctype=Standard
-URIDate 2022-03-24
| Name: |
ifrs-full_InvestmentsInSubsidiaries |
| Namespace Prefix: |
ifrs-full_ |
| Data Type: |
xbrli:monetaryItemType |
| Balance Type: |
debit |
| Period Type: |
instant |
|
| X |
- DefinitionThe amount of assets less the amount of liabilities. Reference 1: http://www.xbrl.org/2003/role/exampleRef
-Name IFRS
-Number 1
-IssueDate 2022-03-24
-Paragraph IG63
-URI https://taxonomy.ifrs.org/xifrs-link?type=IFRS&num=1&code=ifrs-tx-2022-en-r&anchor=para_IG63&doctype=Implementation%20Guidance
-URIDate 2022-03-24
Reference 2: http://www.xbrl.org/2009/role/commonPracticeRef
-Name IAS
-Number 1
-IssueDate 2022-03-24
-Paragraph 112
-Subparagraph c
-URI https://taxonomy.ifrs.org/xifrs-link?type=IAS&num=1&code=ifrs-tx-2022-en-r&anchor=para_112_c&doctype=Standard
-URIDate 2022-03-24
| Name: |
ifrs-full_NetAssetsLiabilities |
| Namespace Prefix: |
ifrs-full_ |
| Data Type: |
xbrli:monetaryItemType |
| Balance Type: |
debit |
| Period Type: |
instant |
|
| X |
- DefinitionThe amount of assets that do not meet the definition of current assets. [Refer: Current assets] Reference 1: http://www.xbrl.org/2003/role/disclosureRef
-Name IFRS
-Number 12
-IssueDate 2022-03-24
-Paragraph B12
-Subparagraph b
-Clause ii
-URI https://taxonomy.ifrs.org/xifrs-link?type=IFRS&num=12&code=ifrs-tx-2022-en-r&anchor=para_B12_b_ii&doctype=Appendix&subtype=B
-URIDate 2022-03-24
Reference 2: http://www.xbrl.org/2003/role/exampleRef
-Name IFRS
-Number 12
-IssueDate 2022-03-24
-Paragraph B10
-Subparagraph b
-URI https://taxonomy.ifrs.org/xifrs-link?type=IFRS&num=12&code=ifrs-tx-2022-en-r&anchor=para_B10_b&doctype=Appendix&subtype=B
-URIDate 2022-03-24
Reference 3: http://www.xbrl.org/2003/role/disclosureRef
-Name IAS
-Number 1
-IssueDate 2022-03-24
-Paragraph 66
-URI https://taxonomy.ifrs.org/xifrs-link?type=IAS&num=1&code=ifrs-tx-2022-en-r&anchor=para_66&doctype=Standard
-URIDate 2022-03-24
| Name: |
ifrs-full_NoncurrentAssets |
| Namespace Prefix: |
ifrs-full_ |
| Data Type: |
xbrli:monetaryItemType |
| Balance Type: |
debit |
| Period Type: |
instant |
|
| X |
- DefinitionThe amount of liabilities that do not meet the definition of current liabilities. [Refer: Current liabilities] Reference 1: http://www.xbrl.org/2003/role/disclosureRef
-Name IFRS
-Number 12
-IssueDate 2022-03-24
-Paragraph B12
-Subparagraph b
-Clause iv
-URI https://taxonomy.ifrs.org/xifrs-link?type=IFRS&num=12&code=ifrs-tx-2022-en-r&anchor=para_B12_b_iv&doctype=Appendix&subtype=B
-URIDate 2022-03-24
Reference 2: http://www.xbrl.org/2003/role/exampleRef
-Name IFRS
-Number 12
-IssueDate 2022-03-24
-Paragraph B10
-Subparagraph b
-URI https://taxonomy.ifrs.org/xifrs-link?type=IFRS&num=12&code=ifrs-tx-2022-en-r&anchor=para_B10_b&doctype=Appendix&subtype=B
-URIDate 2022-03-24
Reference 3: http://www.xbrl.org/2003/role/disclosureRef
-Name IAS
-Number 1
-IssueDate 2022-03-24
-Paragraph 69
-URI https://taxonomy.ifrs.org/xifrs-link?type=IAS&num=1&code=ifrs-tx-2022-en-r&anchor=para_69&doctype=Standard
-URIDate 2022-03-24
| Name: |
ifrs-full_NoncurrentLiabilities |
| Namespace Prefix: |
ifrs-full_ |
| Data Type: |
xbrli:monetaryItemType |
| Balance Type: |
credit |
| Period Type: |
instant |
|
| X |
- Details
| Name: |
dei_LegalEntityAxis=nggtf_OtherSubsidiariesMember |
| Namespace Prefix: |
|
| Data Type: |
na |
| Balance Type: |
|
| Period Type: |
|
|
| X |
- Details
| Name: |
dei_LegalEntityAxis=nggtf_ParentGuarantorAndNiagaraMohawkPowerCorporationMember |
| Namespace Prefix: |
|
| Data Type: |
na |
| Balance Type: |
|
| Period Type: |
|
|
v3.23.3
Additional disclosures in respect of guaranteed securities - Disclosure of Combined Income Statement (Details) - GBP (£)
£ in Millions |
6 Months Ended |
Sep. 30, 2023 |
Sep. 30, 2022 |
[1] |
| Disclosure of information about consolidated structured entities [line items] |
|
|
|
| Revenue |
£ 8,489
|
£ 9,444
|
|
| Operating profit |
1,985
|
2,239
|
|
| Profit after tax from continuing operations |
1,064
|
£ 1,219
|
[2] |
| National Grid plc and Niagara Mohawk Power Corporation combined |
|
|
|
| Disclosure of information about consolidated structured entities [line items] |
|
|
|
| Revenue |
1,594
|
|
|
| Operating costs |
(1,330)
|
|
|
| Operating profit |
264
|
|
|
| Other income and costs, including taxation |
(51)
|
|
|
| Profit after tax from continuing operations |
213
|
|
|
| Other subsidiaries |
|
|
|
| Disclosure of information about consolidated structured entities [line items] |
|
|
|
| Other income from other subsidiaries |
£ 0
|
|
|
|
|
| X |
- DefinitionThe amount of all operating expenses. Reference 1: http://www.xbrl.org/2009/role/commonPracticeRef
-Name IAS
-Number 1
-IssueDate 2022-03-24
-Paragraph 85
-URI https://taxonomy.ifrs.org/xifrs-link?type=IAS&num=1&code=ifrs-tx-2022-en-r&anchor=para_85&doctype=Standard
-URIDate 2022-03-24
| Name: |
ifrs-full_OperatingExpense |
| Namespace Prefix: |
ifrs-full_ |
| Data Type: |
xbrli:monetaryItemType |
| Balance Type: |
debit |
| Period Type: |
duration |
|
| X |
- DefinitionThe amount of operating income that the entity does not separately disclose in the same statement or note. Reference 1: http://www.xbrl.org/2003/role/disclosureRef
-Name IAS
-Number 26
-IssueDate 2022-03-24
-Paragraph 35
-Subparagraph b
-Clause iv
-URI https://taxonomy.ifrs.org/xifrs-link?type=IAS&num=26&code=ifrs-tx-2022-en-r&anchor=para_35_b_iv&doctype=Standard
-URIDate 2022-03-24
Reference 2: http://www.xbrl.org/2003/role/exampleRef
-Name IAS
-Number 1
-IssueDate 2022-03-24
-Paragraph 103
-URI https://taxonomy.ifrs.org/xifrs-link?type=IAS&num=1&code=ifrs-tx-2022-en-r&anchor=para_103&doctype=Standard
-URIDate 2022-03-24
Reference 3: http://www.xbrl.org/2003/role/exampleRef
-Name IAS
-Number 1
-IssueDate 2022-03-24
-Paragraph 102
-URI https://taxonomy.ifrs.org/xifrs-link?type=IAS&num=1&code=ifrs-tx-2022-en-r&anchor=para_102&doctype=Standard
-URIDate 2022-03-24
| Name: |
ifrs-full_OtherIncome |
| Namespace Prefix: |
ifrs-full_ |
| Data Type: |
xbrli:monetaryItemType |
| Balance Type: |
credit |
| Period Type: |
duration |
|
| X |
- DefinitionThe profit (loss) from continuing operations. [Refer: Continuing operations [member]; Profit (loss)] Reference 1: http://www.xbrl.org/2003/role/disclosureRef
-Name IFRS
-Number 8
-IssueDate 2022-03-24
-Paragraph 28
-Subparagraph b
-URI https://taxonomy.ifrs.org/xifrs-link?type=IFRS&num=8&code=ifrs-tx-2022-en-r&anchor=para_28_b&doctype=Standard
-URIDate 2022-03-24
Reference 2: http://www.xbrl.org/2003/role/disclosureRef
-Name IFRS
-Number 8
-IssueDate 2022-03-24
-Paragraph 23
-URI https://taxonomy.ifrs.org/xifrs-link?type=IFRS&num=8&code=ifrs-tx-2022-en-r&anchor=para_23&doctype=Standard
-URIDate 2022-03-24
Reference 3: http://www.xbrl.org/2003/role/disclosureRef
-Name IFRS
-Number 12
-IssueDate 2022-03-24
-Paragraph B12
-Subparagraph b
-Clause vi
-URI https://taxonomy.ifrs.org/xifrs-link?type=IFRS&num=12&code=ifrs-tx-2022-en-r&anchor=para_B12_b_vi&doctype=Appendix&subtype=B
-URIDate 2022-03-24
Reference 4: http://www.xbrl.org/2003/role/disclosureRef
-Name IAS
-Number 1
-IssueDate 2022-03-24
-Paragraph 81A
-Subparagraph a
-URI https://taxonomy.ifrs.org/xifrs-link?type=IAS&num=1&code=ifrs-tx-2022-en-r&anchor=para_81A_a&doctype=Standard
-URIDate 2022-03-24
| Name: |
ifrs-full_ProfitLossFromContinuingOperations |
| Namespace Prefix: |
ifrs-full_ |
| Data Type: |
xbrli:monetaryItemType |
| Balance Type: |
credit |
| Period Type: |
duration |
|
| X |
- DefinitionThe profit (loss) from operating activities of the entity. [Refer: Profit (loss)] Reference 1: http://www.xbrl.org/2003/role/exampleRef
-Name IAS
-Number 32
-IssueDate 2022-03-24
-Paragraph IE33
-URI https://taxonomy.ifrs.org/xifrs-link?type=IAS&num=32&code=ifrs-tx-2022-en-r&anchor=para_IE33&doctype=Illustrative%20Examples
-URIDate 2022-03-24
Reference 2: http://www.xbrl.org/2009/role/commonPracticeRef
-Name IAS
-Number 1
-IssueDate 2022-03-24
-Paragraph 85
-URI https://taxonomy.ifrs.org/xifrs-link?type=IAS&num=1&code=ifrs-tx-2022-en-r&anchor=para_85&doctype=Standard
-URIDate 2022-03-24
| Name: |
ifrs-full_ProfitLossFromOperatingActivities |
| Namespace Prefix: |
ifrs-full_ |
| Data Type: |
xbrli:monetaryItemType |
| Balance Type: |
credit |
| Period Type: |
duration |
|
| X |
- DefinitionThe income arising in the course of an entity's ordinary activities. Income is increases in assets, or decreases in liabilities, that result in increases in equity, other than those relating to contributions from holders of equity claims. Reference 1: http://www.xbrl.org/2003/role/disclosureRef
-Name IFRS
-Number 8
-IssueDate 2022-03-24
-Paragraph 28
-Subparagraph a
-URI https://taxonomy.ifrs.org/xifrs-link?type=IFRS&num=8&code=ifrs-tx-2022-en-r&anchor=para_28_a&doctype=Standard
-URIDate 2022-03-24
Reference 2: http://www.xbrl.org/2003/role/disclosureRef
-Name IFRS
-Number 8
-IssueDate 2022-03-24
-Paragraph 23
-Subparagraph a
-URI https://taxonomy.ifrs.org/xifrs-link?type=IFRS&num=8&code=ifrs-tx-2022-en-r&anchor=para_23_a&doctype=Standard
-URIDate 2022-03-24
Reference 3: http://www.xbrl.org/2003/role/disclosureRef
-Name IFRS
-Number 8
-IssueDate 2022-03-24
-Paragraph 32
-URI https://taxonomy.ifrs.org/xifrs-link?type=IFRS&num=8&code=ifrs-tx-2022-en-r&anchor=para_32&doctype=Standard
-URIDate 2022-03-24
Reference 4: http://www.xbrl.org/2003/role/disclosureRef
-Name IFRS
-Number 8
-IssueDate 2022-03-24
-Paragraph 33
-Subparagraph a
-URI https://taxonomy.ifrs.org/xifrs-link?type=IFRS&num=8&code=ifrs-tx-2022-en-r&anchor=para_33_a&doctype=Standard
-URIDate 2022-03-24
Reference 5: http://www.xbrl.org/2003/role/disclosureRef
-Name IFRS
-Number 8
-IssueDate 2022-03-24
-Paragraph 34
-URI https://taxonomy.ifrs.org/xifrs-link?type=IFRS&num=8&code=ifrs-tx-2022-en-r&anchor=para_34&doctype=Standard
-URIDate 2022-03-24
Reference 6: http://www.xbrl.org/2003/role/disclosureRef
-Name IFRS
-Number 5
-IssueDate 2022-03-24
-Paragraph 33
-Subparagraph b
-Clause i
-URI https://taxonomy.ifrs.org/xifrs-link?type=IFRS&num=5&code=ifrs-tx-2022-en-r&anchor=para_33_b_i&doctype=Standard
-URIDate 2022-03-24
Reference 7: http://www.xbrl.org/2003/role/disclosureRef
-Name IFRS
-Number 12
-IssueDate 2022-03-24
-Paragraph B12
-Subparagraph b
-Clause v
-URI https://taxonomy.ifrs.org/xifrs-link?type=IFRS&num=12&code=ifrs-tx-2022-en-r&anchor=para_B12_b_v&doctype=Appendix&subtype=B
-URIDate 2022-03-24
Reference 8: http://www.xbrl.org/2003/role/exampleRef
-Name IFRS
-Number 12
-IssueDate 2022-03-24
-Paragraph B10
-Subparagraph b
-URI https://taxonomy.ifrs.org/xifrs-link?type=IFRS&num=12&code=ifrs-tx-2022-en-r&anchor=para_B10_b&doctype=Appendix&subtype=B
-URIDate 2022-03-24
Reference 9: http://www.xbrl.org/2003/role/disclosureRef
-Name IAS
-Number 1
-IssueDate 2022-03-24
-Paragraph 82
-Subparagraph a
-URI https://taxonomy.ifrs.org/xifrs-link?type=IAS&num=1&code=ifrs-tx-2022-en-r&anchor=para_82_a&doctype=Standard
-URIDate 2022-03-24
Reference 10: http://www.xbrl.org/2003/role/exampleRef
-Name IAS
-Number 1
-IssueDate 2022-03-24
-Paragraph 103
-URI https://taxonomy.ifrs.org/xifrs-link?type=IAS&num=1&code=ifrs-tx-2022-en-r&anchor=para_103&doctype=Standard
-URIDate 2022-03-24
Reference 11: http://www.xbrl.org/2003/role/exampleRef
-Name IAS
-Number 1
-IssueDate 2022-03-24
-Paragraph 102
-URI https://taxonomy.ifrs.org/xifrs-link?type=IAS&num=1&code=ifrs-tx-2022-en-r&anchor=para_102&doctype=Standard
-URIDate 2022-03-24
| Name: |
ifrs-full_Revenue |
| Namespace Prefix: |
ifrs-full_ |
| Data Type: |
xbrli:monetaryItemType |
| Balance Type: |
credit |
| Period Type: |
duration |
|
| X |
- DefinitionOther Income (Expense), Including Tax Expense
| Name: |
nggtf_OtherIncomeExpenseIncludingTaxExpense |
| Namespace Prefix: |
nggtf_ |
| Data Type: |
xbrli:monetaryItemType |
| Balance Type: |
credit |
| Period Type: |
duration |
|
| X |
- Details
| Name: |
dei_LegalEntityAxis=nggtf_ParentGuarantorAndNiagaraMohawkPowerCorporationMember |
| Namespace Prefix: |
|
| Data Type: |
na |
| Balance Type: |
|
| Period Type: |
|
|
| X |
- Details
| Name: |
dei_LegalEntityAxis=nggtf_OtherSubsidiariesMember |
| Namespace Prefix: |
|
| Data Type: |
na |
| Balance Type: |
|
| Period Type: |
|
|
National Grid (NYSE:NGG)
Historical Stock Chart
From Apr 2024 to May 2024

National Grid (NYSE:NGG)
Historical Stock Chart
From May 2023 to May 2024
