false
Q3
--12-31
0000880984
0000880984
2023-01-01
2023-09-30
0000880984
2023-11-07
0000880984
2023-09-30
0000880984
2022-12-31
0000880984
2022-01-01
2022-09-30
0000880984
2023-07-01
2023-09-30
0000880984
2022-07-01
2022-09-30
0000880984
us-gaap:CommonStockMember
2022-12-31
0000880984
us-gaap:AdditionalPaidInCapitalMember
2022-12-31
0000880984
us-gaap:RetainedEarningsMember
2022-12-31
0000880984
us-gaap:TreasuryStockCommonMember
2022-12-31
0000880984
us-gaap:ParentMember
2022-12-31
0000880984
us-gaap:NoncontrollingInterestMember
2022-12-31
0000880984
us-gaap:CommonStockMember
2023-03-31
0000880984
us-gaap:AdditionalPaidInCapitalMember
2023-03-31
0000880984
us-gaap:RetainedEarningsMember
2023-03-31
0000880984
us-gaap:TreasuryStockCommonMember
2023-03-31
0000880984
us-gaap:ParentMember
2023-03-31
0000880984
us-gaap:NoncontrollingInterestMember
2023-03-31
0000880984
2023-03-31
0000880984
us-gaap:CommonStockMember
2023-06-30
0000880984
us-gaap:AdditionalPaidInCapitalMember
2023-06-30
0000880984
us-gaap:RetainedEarningsMember
2023-06-30
0000880984
us-gaap:TreasuryStockCommonMember
2023-06-30
0000880984
us-gaap:ParentMember
2023-06-30
0000880984
us-gaap:NoncontrollingInterestMember
2023-06-30
0000880984
2023-06-30
0000880984
us-gaap:CommonStockMember
2021-12-31
0000880984
us-gaap:AdditionalPaidInCapitalMember
2021-12-31
0000880984
us-gaap:RetainedEarningsMember
2021-12-31
0000880984
us-gaap:TreasuryStockCommonMember
2021-12-31
0000880984
us-gaap:ParentMember
2021-12-31
0000880984
us-gaap:NoncontrollingInterestMember
2021-12-31
0000880984
2021-12-31
0000880984
us-gaap:CommonStockMember
2022-03-31
0000880984
us-gaap:AdditionalPaidInCapitalMember
2022-03-31
0000880984
us-gaap:RetainedEarningsMember
2022-03-31
0000880984
us-gaap:TreasuryStockCommonMember
2022-03-31
0000880984
us-gaap:ParentMember
2022-03-31
0000880984
us-gaap:NoncontrollingInterestMember
2022-03-31
0000880984
2022-03-31
0000880984
us-gaap:CommonStockMember
2022-06-30
0000880984
us-gaap:AdditionalPaidInCapitalMember
2022-06-30
0000880984
us-gaap:RetainedEarningsMember
2022-06-30
0000880984
us-gaap:TreasuryStockCommonMember
2022-06-30
0000880984
us-gaap:ParentMember
2022-06-30
0000880984
us-gaap:NoncontrollingInterestMember
2022-06-30
0000880984
2022-06-30
0000880984
us-gaap:CommonStockMember
2023-01-01
2023-03-31
0000880984
us-gaap:AdditionalPaidInCapitalMember
2023-01-01
2023-03-31
0000880984
us-gaap:RetainedEarningsMember
2023-01-01
2023-03-31
0000880984
us-gaap:TreasuryStockCommonMember
2023-01-01
2023-03-31
0000880984
us-gaap:ParentMember
2023-01-01
2023-03-31
0000880984
us-gaap:NoncontrollingInterestMember
2023-01-01
2023-03-31
0000880984
2023-01-01
2023-03-31
0000880984
us-gaap:CommonStockMember
2023-04-01
2023-06-30
0000880984
us-gaap:AdditionalPaidInCapitalMember
2023-04-01
2023-06-30
0000880984
us-gaap:RetainedEarningsMember
2023-04-01
2023-06-30
0000880984
us-gaap:TreasuryStockCommonMember
2023-04-01
2023-06-30
0000880984
us-gaap:ParentMember
2023-04-01
2023-06-30
0000880984
us-gaap:NoncontrollingInterestMember
2023-04-01
2023-06-30
0000880984
2023-04-01
2023-06-30
0000880984
us-gaap:CommonStockMember
2023-07-01
2023-09-30
0000880984
us-gaap:AdditionalPaidInCapitalMember
2023-07-01
2023-09-30
0000880984
us-gaap:RetainedEarningsMember
2023-07-01
2023-09-30
0000880984
us-gaap:TreasuryStockCommonMember
2023-07-01
2023-09-30
0000880984
us-gaap:ParentMember
2023-07-01
2023-09-30
0000880984
us-gaap:NoncontrollingInterestMember
2023-07-01
2023-09-30
0000880984
us-gaap:CommonStockMember
2022-01-01
2022-03-31
0000880984
us-gaap:AdditionalPaidInCapitalMember
2022-01-01
2022-03-31
0000880984
us-gaap:RetainedEarningsMember
2022-01-01
2022-03-31
0000880984
us-gaap:TreasuryStockCommonMember
2022-01-01
2022-03-31
0000880984
us-gaap:ParentMember
2022-01-01
2022-03-31
0000880984
us-gaap:NoncontrollingInterestMember
2022-01-01
2022-03-31
0000880984
2022-01-01
2022-03-31
0000880984
us-gaap:CommonStockMember
2022-04-01
2022-06-30
0000880984
us-gaap:AdditionalPaidInCapitalMember
2022-04-01
2022-06-30
0000880984
us-gaap:RetainedEarningsMember
2022-04-01
2022-06-30
0000880984
us-gaap:TreasuryStockCommonMember
2022-04-01
2022-06-30
0000880984
us-gaap:ParentMember
2022-04-01
2022-06-30
0000880984
us-gaap:NoncontrollingInterestMember
2022-04-01
2022-06-30
0000880984
2022-04-01
2022-06-30
0000880984
us-gaap:CommonStockMember
2022-07-01
2022-09-30
0000880984
us-gaap:AdditionalPaidInCapitalMember
2022-07-01
2022-09-30
0000880984
us-gaap:RetainedEarningsMember
2022-07-01
2022-09-30
0000880984
us-gaap:TreasuryStockCommonMember
2022-07-01
2022-09-30
0000880984
us-gaap:ParentMember
2022-07-01
2022-09-30
0000880984
us-gaap:NoncontrollingInterestMember
2022-07-01
2022-09-30
0000880984
us-gaap:CommonStockMember
2023-09-30
0000880984
us-gaap:AdditionalPaidInCapitalMember
2023-09-30
0000880984
us-gaap:RetainedEarningsMember
2023-09-30
0000880984
us-gaap:TreasuryStockCommonMember
2023-09-30
0000880984
us-gaap:ParentMember
2023-09-30
0000880984
us-gaap:NoncontrollingInterestMember
2023-09-30
0000880984
us-gaap:CommonStockMember
2022-09-30
0000880984
us-gaap:AdditionalPaidInCapitalMember
2022-09-30
0000880984
us-gaap:RetainedEarningsMember
2022-09-30
0000880984
us-gaap:TreasuryStockCommonMember
2022-09-30
0000880984
us-gaap:ParentMember
2022-09-30
0000880984
us-gaap:NoncontrollingInterestMember
2022-09-30
0000880984
2022-09-30
0000880984
2023-09-05
2023-09-05
0000880984
us-gaap:SalesRevenueNetMember
us-gaap:CustomerConcentrationRiskMember
ACFN:OneCustomerMember
2023-07-01
2023-09-30
0000880984
us-gaap:SalesRevenueNetMember
us-gaap:CustomerConcentrationRiskMember
ACFN:OneCustomerMember
2023-01-01
2023-09-30
0000880984
us-gaap:AccountsReceivableMember
us-gaap:CustomerConcentrationRiskMember
ACFN:TwoCustomerMember
2023-01-01
2023-09-30
0000880984
us-gaap:AccountsReceivableMember
us-gaap:CustomerConcentrationRiskMember
ACFN:OneCustomerMember
2022-01-01
2022-12-31
0000880984
ACFN:StockOptionsMember
2023-01-01
2023-09-30
0000880984
ACFN:StockOptionsMember
2022-01-01
2022-09-30
0000880984
ACFN:StockOptionsMember
2022-07-01
2022-09-30
0000880984
us-gaap:SubsequentEventMember
2023-11-07
0000880984
2022-01-01
2022-12-31
0000880984
ACFN:OperatingLeaseAgreementsMember
ACFN:OmnimetrixHoldingsIncMember
2019-04-01
2019-04-30
0000880984
ACFN:OperatingLeaseAgreementsMember
ACFN:OmnimetrixHoldingsIncMember
2023-01-01
2023-09-30
0000880984
ACFN:OperatingLeaseAgreementsMember
ACFN:OmnimetrixHoldingsIncMember
2022-01-01
2022-09-30
0000880984
ACFN:OperatingLeaseAgreementsMember
ACFN:OmnimetrixHoldingsIncMember
2023-07-01
2023-09-30
0000880984
ACFN:OperatingLeaseAgreementsMember
ACFN:OmnimetrixHoldingsIncMember
2022-07-01
2022-09-30
0000880984
ACFN:KingIndustrialRealityIncMember
2021-07-06
0000880984
ACFN:KingIndustrialRealtyIncMember
2021-07-06
0000880984
2021-07-05
2021-07-06
0000880984
2021-07-06
0000880984
ACFN:MasterServicesAgreementMember
2023-09-30
0000880984
ACFN:MasterServicesAgreementMember
2023-01-01
2023-09-30
0000880984
ACFN:AmendedAndRestatedTwoThousandSixStockincentivePlanMember
2023-09-30
0000880984
ACFN:NonEmployeeDirectorsMember
2023-01-01
2023-09-30
0000880984
ACFN:NonEmployeeDirectorsMember
2023-07-01
2023-09-30
0000880984
srt:DirectorMember
2023-01-01
2023-09-30
0000880984
srt:ChiefExecutiveOfficerMember
2023-01-01
2023-09-30
0000880984
srt:ChiefFinancialOfficerMember
2023-01-01
2023-09-30
0000880984
us-gaap:ShareBasedPaymentArrangementEmployeeMember
2023-01-01
2023-09-30
0000880984
us-gaap:ShareBasedPaymentArrangementNonemployeeMember
2023-01-01
2023-09-30
0000880984
us-gaap:ShareBasedPaymentArrangementNonemployeeMember
2023-07-01
2023-09-30
0000880984
us-gaap:OptionMember
2023-09-30
0000880984
us-gaap:SellingGeneralAndAdministrativeExpensesMember
2023-01-01
2023-09-30
0000880984
us-gaap:SellingGeneralAndAdministrativeExpensesMember
2022-01-01
2022-09-30
0000880984
us-gaap:SellingGeneralAndAdministrativeExpensesMember
2023-07-01
2023-09-30
0000880984
us-gaap:SellingGeneralAndAdministrativeExpensesMember
2022-07-01
2022-09-30
0000880984
us-gaap:WarrantMember
2022-12-31
0000880984
us-gaap:WarrantMember
2022-01-01
2022-12-31
0000880984
us-gaap:WarrantMember
2023-01-01
2023-09-30
0000880984
us-gaap:WarrantMember
2023-09-30
0000880984
ACFN:PGMember
2023-01-01
2023-09-30
0000880984
ACFN:CPMember
2023-01-01
2023-09-30
0000880984
ACFN:PGMember
2022-01-01
2022-09-30
0000880984
ACFN:CPMember
2022-01-01
2022-09-30
0000880984
ACFN:PGMember
2023-07-01
2023-09-30
0000880984
ACFN:CPMember
2023-07-01
2023-09-30
0000880984
ACFN:PGMember
2022-07-01
2022-09-30
0000880984
ACFN:CPMember
2022-07-01
2022-09-30
0000880984
ACFN:SoftwareMember
2022-01-01
2022-09-30
0000880984
ACFN:HardwareMember
ACFN:PGMember
2023-01-01
2023-09-30
0000880984
ACFN:MonitoringMember
ACFN:PGMember
2023-01-01
2023-09-30
0000880984
ACFN:HardwareMember
ACFN:CPMember
2023-01-01
2023-09-30
0000880984
ACFN:MonitoringMember
ACFN:CPMember
2023-01-01
2023-09-30
0000880984
ACFN:HardwareMember
2023-01-01
2023-09-30
0000880984
ACFN:MonitoringMember
2023-01-01
2023-09-30
0000880984
ACFN:HardwareMember
ACFN:PGMember
2022-01-01
2022-09-30
0000880984
ACFN:MonitoringMember
ACFN:PGMember
2022-01-01
2022-09-30
0000880984
ACFN:HardwareMember
ACFN:CPMember
2022-01-01
2022-09-30
0000880984
ACFN:MonitoringMember
ACFN:CPMember
2022-01-01
2022-09-30
0000880984
ACFN:HardwareMember
2022-01-01
2022-09-30
0000880984
ACFN:MonitoringMember
2022-01-01
2022-09-30
0000880984
ACFN:HardwareMember
ACFN:PGMember
2023-07-01
2023-09-30
0000880984
ACFN:MonitoringMember
ACFN:PGMember
2023-07-01
2023-09-30
0000880984
ACFN:HardwareMember
ACFN:CPMember
2023-07-01
2023-09-30
0000880984
ACFN:MonitoringMember
ACFN:CPMember
2023-07-01
2023-09-30
0000880984
ACFN:HardwareMember
2023-07-01
2023-09-30
0000880984
ACFN:MonitoringMember
2023-07-01
2023-09-30
0000880984
ACFN:HardwareMember
ACFN:PGMember
2022-07-01
2022-09-30
0000880984
ACFN:MonitoringMember
ACFN:PGMember
2022-07-01
2022-09-30
0000880984
ACFN:HardwareMember
ACFN:CPMember
2022-07-01
2022-09-30
0000880984
ACFN:MonitoringMember
ACFN:CPMember
2022-07-01
2022-09-30
0000880984
ACFN:HardwareMember
2022-07-01
2022-09-30
0000880984
ACFN:MonitoringMember
2022-07-01
2022-09-30
0000880984
ACFN:HardwareMember
2022-12-31
0000880984
ACFN:MonitoringMember
2022-12-31
0000880984
ACFN:HardwareMember
2023-09-30
0000880984
ACFN:MonitoringMember
2023-09-30
0000880984
ACFN:CapitalizedSalesCommissionsMember
2023-09-30
0000880984
ACFN:CapitalizedSalesCommissionsMember
2022-12-31
0000880984
ACFN:HardwareMember
ACFN:AmortizationMember
2023-01-01
2023-09-30
0000880984
ACFN:HardwareMember
ACFN:AmortizationMember
2022-01-01
2022-09-30
0000880984
ACFN:HardwareMember
ACFN:AmortizationMember
2023-07-01
2023-09-30
0000880984
ACFN:HardwareMember
ACFN:AmortizationMember
2022-07-01
2022-09-30
0000880984
ACFN:HardwareMember
ACFN:SalesOfCustomDesignedUnitsMember
2023-01-01
2023-09-30
0000880984
ACFN:HardwareMember
ACFN:SalesOfCustomDesignedUnitsMember
2022-01-01
2022-09-30
0000880984
ACFN:HardwareMember
ACFN:SalesOfCustomDesignedUnitsMember
2023-07-01
2023-09-30
0000880984
ACFN:HardwareMember
ACFN:SalesOfCustomDesignedUnitsMember
2022-07-01
2022-09-30
0000880984
ACFN:HardwareMember
ACFN:HardwareSalesMember
2023-01-01
2023-09-30
0000880984
ACFN:HardwareMember
ACFN:HardwareSalesMember
2022-01-01
2022-09-30
0000880984
ACFN:HardwareMember
ACFN:HardwareSalesMember
2023-07-01
2023-09-30
0000880984
ACFN:HardwareMember
ACFN:HardwareSalesMember
2022-07-01
2022-09-30
0000880984
ACFN:HardwareMember
ACFN:OtherAccessoriesMember
2023-01-01
2023-09-30
0000880984
ACFN:HardwareMember
ACFN:OtherAccessoriesMember
2022-01-01
2022-09-30
0000880984
ACFN:HardwareMember
ACFN:OtherAccessoriesMember
2023-07-01
2023-09-30
0000880984
ACFN:HardwareMember
ACFN:OtherAccessoriesMember
2022-07-01
2022-09-30
0000880984
ACFN:COGSMember
ACFN:AmortizationMember
2023-01-01
2023-09-30
0000880984
ACFN:COGSMember
ACFN:AmortizationMember
2022-01-01
2022-09-30
0000880984
ACFN:COGSMember
ACFN:AmortizationMember
2023-07-01
2023-09-30
0000880984
ACFN:COGSMember
ACFN:AmortizationMember
2022-07-01
2022-09-30
0000880984
ACFN:COGSMember
ACFN:COGSOfCustomDesignedUnitsMember
2023-01-01
2023-09-30
0000880984
ACFN:COGSMember
ACFN:COGSOfCustomDesignedUnitsMember
2022-01-01
2022-09-30
0000880984
ACFN:COGSMember
ACFN:COGSOfCustomDesignedUnitsMember
2023-07-01
2023-09-30
0000880984
ACFN:COGSMember
ACFN:COGSOfCustomDesignedUnitsMember
2022-07-01
2022-09-30
0000880984
ACFN:COGSMember
ACFN:COGSOfHardwareSalesMember
2023-01-01
2023-09-30
0000880984
ACFN:COGSMember
ACFN:COGSOfHardwareSalesMember
2022-01-01
2022-09-30
0000880984
ACFN:COGSMember
ACFN:COGSOfHardwareSalesMember
2023-07-01
2023-09-30
0000880984
ACFN:COGSMember
ACFN:COGSOfHardwareSalesMember
2022-07-01
2022-09-30
0000880984
ACFN:COGSMember
ACFN:COGSDataCostsMember
2023-01-01
2023-09-30
0000880984
ACFN:COGSMember
ACFN:COGSDataCostsMember
2022-01-01
2022-09-30
0000880984
ACFN:COGSMember
ACFN:COGSDataCostsMember
2023-07-01
2023-09-30
0000880984
ACFN:COGSMember
ACFN:COGSDataCostsMember
2022-07-01
2022-09-30
0000880984
ACFN:COGSMember
ACFN:OtherCOGSAccessoriesMember
2023-01-01
2023-09-30
0000880984
ACFN:COGSMember
ACFN:OtherCOGSAccessoriesMember
2022-01-01
2022-09-30
0000880984
ACFN:COGSMember
ACFN:OtherCOGSAccessoriesMember
2023-07-01
2023-09-30
0000880984
ACFN:COGSMember
ACFN:OtherCOGSAccessoriesMember
2022-07-01
2022-09-30
0000880984
ACFN:COGSMember
2023-01-01
2023-09-30
0000880984
ACFN:COGSMember
2022-01-01
2022-09-30
0000880984
ACFN:COGSMember
2023-07-01
2023-09-30
0000880984
ACFN:COGSMember
2022-07-01
2022-09-30
0000880984
srt:OfficerMember
2023-01-01
2023-09-30
0000880984
srt:OfficerMember
2022-01-01
2022-09-30
0000880984
srt:OfficerMember
2023-07-01
2023-09-30
0000880984
srt:OfficerMember
2022-07-01
2022-09-30
0000880984
srt:DirectorMember
2023-01-01
2023-09-30
0000880984
srt:DirectorMember
2022-01-01
2022-09-30
0000880984
srt:DirectorMember
2023-07-01
2023-09-30
0000880984
srt:DirectorMember
2022-07-01
2022-09-30
0000880984
us-gaap:RelatedPartyMember
2023-09-30
0000880984
us-gaap:RelatedPartyMember
2022-12-31
0000880984
ACFN:OmniMetrixLLCMember
2023-01-01
2023-09-30
0000880984
us-gaap:RelatedPartyMember
2023-01-01
2023-09-30
0000880984
ACFN:OmniMetrixLLCMember
2022-01-01
2022-09-30
0000880984
us-gaap:RelatedPartyMember
2022-01-01
2022-09-30
iso4217:USD
xbrli:shares
iso4217:USD
xbrli:shares
utr:sqft
xbrli:pure
UNITED
STATES
SECURITIES
AND EXCHANGE COMMISSION
WASHINGTON,
D.C. 20549
FORM
10-Q
☒
QUARTERLY REPORT PURSUANT TO SECTION 13 OR 15(d) OF THE
SECURITIES
EXCHANGE ACT OF 1934
For
the quarterly period ended September 30, 2023
or
☐
TRANSITION REPORT PURSUANT TO SECTION 13 OR 15(d) OF THE
SECURITIES
EXCHANGE ACT OF 1934
For
the transition period from to
Commission
file number: 001-33886
ACORN
ENERGY, INC.
(Exact
name of registrant as specified in its charter)
| Delaware |
|
22-2786081 |
(State
or other jurisdiction
of
incorporation or organization) |
|
(I.R.S.
Employer
Identification
No.) |
1000
N West Street, Suite 1200, Wilmington,
Delaware |
|
19801 |
| (Address
of principal executive offices) |
|
(Zip
Code) |
410-654-3315
(Registrant’s
telephone number, including area code)
Securities
registered pursuant to Section 12(b) of the Act:
| Title
of each class |
|
Trading
Symbol(s) |
|
Name
of each exchange on which registered |
| None |
|
|
|
|
Indicate
by check mark whether the registrant (1) has filed all reports required to be filed by Section 13 or 15(d) of the Securities Exchange
Act of 1934 during the preceding 12 months (or for such shorter period that the registrant was required to file such reports), and (2)
has been subject to such filing requirements for the past 90 days. Yes ☒ No ☐
Indicate
by check mark whether the registrant has submitted electronically every Interactive Data File required to be submitted pursuant to Rule
405 of Regulation S-T during the preceding 12 months (or for such shorter period that the registrant was required to submit such files).
Yes ☒ No ☐
Indicate
by check mark whether the registrant is a large accelerated filer, an accelerated filer, a non-accelerated filer, a smaller reporting
company, or an emerging growth company. See the definitions of “large accelerated filer,” “accelerated filer,”
“smaller reporting company,” and “emerging growth company” in Rule 12b-2 of the Exchange Act.
| |
Large
accelerated filer ☐ |
Accelerated
filer ☐ |
| |
Non-accelerated
filer ☒ |
Smaller
reporting company ☒ |
| |
Emerging
growth company ☐ |
|
If
an emerging growth company, indicate by check mark if the registrant has elected not to use the extended transition period for complying
with any new or revised financial accounting standards provided pursuant to Section 13(a) of the Exchange Act. ☐
Indicate
by check mark whether the registrant is a shell company (as defined in Rule 12b-2 of the Exchange Act). Yes ☐ No ☒
Indicate
the number of shares outstanding of each of the issuer’s classes of common stock, as of the latest practicable date.
| Class
|
|
Outstanding
at November 7, 2023 |
| Common
Stock, $0.01 par value per share |
|
2,484,791
|
ACORN
ENERGY, INC.
Quarterly
Report on Form 10-Q
For
the Quarterly Period Ended September 30, 2023
TABLE
OF CONTENTS
Certain
statements contained in this report are forward-looking in nature. These statements are generally identified by the inclusion of phrases
such as “we expect”, “we anticipate”, “we believe”, “we estimate” and other phrases of
similar meaning. Whether such statements ultimately prove to be accurate depends upon a variety of factors that may affect our business
and operations. Many of these factors are described in our most recent Annual Report on Form 10-K as filed with the Securities and Exchange
Commission.
PART
I
| ITEM
1. |
UNAUDITED
CONDENSED CONSOLIDATED FINANCIAL STATEMENTS |
ACORN
ENERGY, INC. AND SUBSIDIARIES
CONDENSED
CONSOLIDATED BALANCE SHEETS
(IN
THOUSANDS, EXCEPT SHARE AND PER SHARE DATA)
| | |
As
of
September 30, 2023 | | |
As
of
December 31, 2022 | |
| | |
(Unaudited) | | |
(Audited) | |
| ASSETS | |
| | | |
| | |
| Current assets: | |
| | | |
| | |
| Cash | |
$ | 1,749 | | |
$ | 1,450 | |
| Accounts receivable, net | |
| 583 | | |
| 597 | |
| Inventory, net | |
| 909 | | |
| 789 | |
| Deferred cost of goods
sold (COGS) | |
| 890 | | |
| 887 | |
| Other
current assets | |
| 343 | | |
| 288 | |
| Total
current assets | |
| 4,474 | | |
| 4,011 | |
| Property and equipment, net | |
| 610 | | |
| 653 | |
| Operating right-of-use assets, net | |
| 220 | | |
| 298 | |
| Deferred COGS | |
| 642 | | |
| 807 | |
| Other assets | |
| 209 | | |
| 215 | |
| Total
assets | |
$ | 6,155 | | |
$ | 5,984 | |
| LIABILITIES AND STOCKHOLDERS’ DEFICIT | |
| | | |
| | |
| Current liabilities: | |
| | | |
| | |
| Accounts payable | |
$ | 444 | | |
$ | 243 | |
| Accrued expenses | |
| 127 | | |
| 171 | |
| Deferred revenue | |
| 4,270 | | |
| 3,984 | |
| Operating lease liabilities | |
| 121 | | |
| 116 | |
| Other
current liabilities | |
| 25 | | |
| 58 | |
| Total
current liabilities | |
| 4,987 | | |
| 4,572 | |
| Long-term liabilities: | |
| | | |
| | |
| Deferred revenue | |
| 1,941 | | |
| 2,187 | |
| Operating lease liabilities | |
| 129 | | |
| 220 | |
| Other
long-term liabilities | |
| 19 | | |
| 16 | |
| Total
long-term liabilities | |
| 2,089 | | |
| 2,423 | |
| Commitments and contingencies (Note 7) | |
| - | | |
| - | |
| Stockholders’ deficit: | |
| | | |
| | |
| Acorn Energy, Inc. stockholders | |
| | | |
| | |
| Common stock - $0.01
par value per share: Authorized – 42,000,000
shares; issued and outstanding – 2,484,791
and 2,482,604
shares at September 30, 2023 and December 31, 2022, respectively* | |
| 25 | | |
| 25 | |
| Additional paid-in capital* | |
| 103,312 | | |
| 103,261 | |
| Accumulated stockholders’
deficit | |
| (101,232 | ) | |
| (101,267 | ) |
| Treasury
stock, at cost – 50,178 and
50,178 shares
at September 30, 2023 and December 31, 2022* | |
| (3,036 | ) | |
| (3,036 | ) |
| Total Acorn Energy, Inc.
stockholders’ deficit | |
| (931 | ) | |
| (1,017 | ) |
| Non-controlling
interest | |
| 10 | | |
| 6 | |
| Total
stockholders’ deficit | |
| (921 | ) | |
| (1,011 | ) |
| Total
liabilities and stockholders’ deficit | |
$ | 6,155 | | |
$ | 5,984 | |
The
accompanying notes are an integral part of these unaudited condensed consolidated financial statements.
ACORN
ENERGY, INC. AND SUBSIDIARIES
CONDENSED
CONSOLIDATED STATEMENTS OF OPERATIONS
(UNAUDITED)
(IN THOUSANDS, EXCEPT PER SHARE DATA)
| | |
2023 | | |
2022 | | |
2023 | | |
2022 | |
| | |
Nine
months ended September
30, | | |
Three
months ended September
30, | |
| | |
2023 | | |
2022 | | |
2023 | | |
2022 | |
| | |
| | |
| | |
| | |
| |
| Revenue | |
$ | 5,809 | | |
$ | 5,155 | | |
$ | 2,087 | | |
$ | 1,783 | |
| COGS | |
| 1,453 | | |
| 1,436 | | |
| 537 | | |
| 568 | |
| Gross profit | |
| 4,356 | | |
| 3,719 | | |
| 1,550 | | |
| 1,215 | |
| Operating expenses: | |
| | | |
| | | |
| | | |
| | |
| Research and development
(R&D) expense | |
| 614 | | |
| 637 | | |
| 212 | | |
| 227 | |
| Selling, general and administrative
(SG&A) expense | |
| 3,746 | | |
| 3,585 | | |
| 1,330 | | |
| 1,198 | |
| Impairment of software | |
| — | | |
| 51 | | |
| — | | |
| — | |
| Total
operating expenses | |
| 4,360 | | |
| 4,273 | | |
| 1,542 | | |
| 1,425 | |
| Operating (loss) income | |
| (4 | ) | |
| (554 | ) | |
| 8 | | |
| (210 | ) |
| Interest income (expense),
net | |
| 46 | | |
| (1 | ) | |
| 19 | | |
| — | |
| Income tax expense | |
| — | | |
| — | | |
| — | | |
| — | |
| Net income (loss) | |
| 42 | | |
| (555 | ) | |
| 27 | | |
| (210 | ) |
| Non-controlling interest
share of net income | |
| (7 | ) | |
| (1 | ) | |
| (3 | ) | |
| — | |
| Net
income (loss) attributable to Acorn Energy, Inc. stockholders | |
$ | 35 | | |
$ | (556 | ) | |
$ | 24 | | |
$ | (210 | ) |
| | |
| | | |
| | | |
| | | |
| | |
| Basic
and diluted net income (loss) per share attributable to Acorn Energy, Inc. stockholders*: | |
$ | 0.01 | | |
$ | (0.22 | ) | |
$ | 0.01 | | |
$ | (0.08 | ) |
| Weighted average number of shares outstanding
attributable to Acorn Energy, Inc. stockholders – basic and diluted | |
| | | |
| | | |
| | | |
| | |
| Basic* | |
| 2,484 | | |
| 2,481 | | |
| 2,485 | | |
| 2,481 | |
| Diluted* | |
| 2,506 | | |
| 2,481 | | |
| 2,532 | | |
| 2,481 | |
The
accompanying notes are an integral part of these unaudited condensed consolidated financial statements.
ACORN
ENERGY, INC. AND SUBSIDIARIES
CONDENSED
CONSOLIDATED STATEMENTS OF CHANGES IN STOCKHOLDERS’ DEFICIT
(UNAUDITED)
(IN THOUSANDS)
| | |
Number
of Shares* | | |
Common
Stock* | | |
Additional
Paid-In Capital* | | |
Accumulated
Deficit | | |
Number
of Treasury Shares* | | |
Treasury
Stock* | | |
Total
Acorn
Energy, Inc.
Stockholders’
Deficit | | |
Non-
controlling interests | | |
Total
Deficit | |
| | |
Three
and Nine Months Ended September 30, 2023 | |
| | |
Number
of Shares* | | |
Common
Stock* | | |
Additional
Paid-In Capital* | | |
Accumulated
Deficit | | |
Number
of Treasury
Shares* | | |
Treasury
Stock* | | |
Total
Acorn
Energy, Inc.
Stockholders’
Deficit | | |
Non-
controlling interests | | |
Total
Deficit | |
| Balances as of December 31, 2022 | |
| 2,483 | | |
$ | 25 | | |
$ | 103,261 | | |
$ | (101,267 | ) | |
| 50 | | |
$ | (3,036 | ) | |
$ | (1,017 | ) | |
$ | 6 | | |
$ | (1,011 | ) |
| Net loss | |
| — | | |
| — | | |
| — | | |
| (85 | ) | |
| — | | |
| — | | |
| (85 | ) | |
| 1 | | |
| (84 | ) |
| Proceeds from warrant exercise | |
| 2 | | |
| -** | | |
| 5 | | |
| — | | |
| — | | |
| — | | |
| 5 | | |
| — | | |
| 5 | |
| Accrued dividend on OmniMetrix preferred shares | |
| — | | |
| — | | |
| — | | |
| — | | |
| — | | |
| — | | |
| — | | |
| (1 | ) | |
| (1 | ) |
| Stock option compensation | |
| — | | |
| — | | |
| 17 | | |
| — | | |
| — | | |
| — | | |
| 17 | | |
| — | | |
| 17 | |
| Balances as of March 31, 2023 | |
| 2,485 | | |
$ | 25 | | |
$ | 103,283 | | |
$ | (101,352 | ) | |
| 50 | | |
$ | (3,036 | ) | |
$ | (1,080 | ) | |
$ | 6 | | |
$ | (1,074 | ) |
| Net income | |
| — | | |
| — | | |
| — | | |
| 96 | | |
| — | | |
| — | | |
| 96 | | |
| 3 | | |
| 99 | |
| Accrued dividend on OmniMetrix preferred shares | |
| — | | |
| — | | |
| — | | |
| — | | |
| — | | |
| — | | |
| — | | |
| (1 | ) | |
| (1 | ) |
| Stock option compensation | |
| — | | |
| — | | |
| 13 | | |
| — | | |
| — | | |
| — | | |
| 13 | | |
| — | | |
| 13 | |
| Balances as of June 30, 2023 | |
| 2,485 | | |
$ | 25 | | |
$ | 103,296 | | |
$ | (101,256 | ) | |
| 50 | | |
$ | (3,036 | ) | |
$ | (971 | ) | |
$ | 8 | | |
$ | (963 | ) |
| Net income | |
| — | | |
| — | | |
| — | | |
| 24 | | |
| — | | |
| — | | |
| 24 | | |
| 3 | | |
| 27 | |
| Accrued dividend on OmniMetrix preferred shares | |
| — | | |
| — | | |
| — | | |
| — | | |
| — | | |
| — | | |
| — | | |
| (1 | ) | |
| (1 | ) |
| Stock option compensation | |
| — | | |
| — | | |
| 16 | | |
| — | | |
| — | | |
| — | | |
| 16 | | |
| — | | |
| 16 | |
| Balances as of September 30, 2023 | |
| 2,485 | | |
$ | 25 | | |
$ | 103,312 | | |
$ | (101,232 | ) | |
| 50 | | |
$ | (3,036 | ) | |
$ | (931 | ) | |
$ | 10 | | |
$ | (921 | ) |
| | |
Three
and Nine Months Ended September 30, 2022 | |
| | |
Number
of Shares* | | |
Common
Stock* | | |
Additional
Paid-In Capital* | | |
Accumulated
Deficit | | |
Number
of Treasury Shares* | | |
Treasury
Stock* | | |
Total
Acorn
Energy, Inc.
Stockholders’
Deficit | | |
Non-
controlling interests | | |
Total
Deficit | |
| Balances as of December 31, 2021 | |
| 2,480 | | |
$ | 25 | | |
$ | 103,176 | | |
$ | (100,634 | ) | |
| 50 | | |
$ | (3,036 | ) | |
$ | (469 | ) | |
$ | 8 | | |
$ | (461 | ) |
| Net loss | |
| — | | |
| — | | |
| — | | |
| (123 | ) | |
| — | | |
| — | | |
| (123 | ) | |
| 1 | | |
| (122 | ) |
| Accrued dividend on OmniMetrix preferred shares | |
| — | | |
| — | | |
| — | | |
| — | | |
| — | | |
| — | | |
| — | | |
| (1 | ) | |
| (1 | ) |
| Stock option compensation | |
| — | | |
| — | | |
| 31 | | |
| — | | |
| — | | |
| — | | |
| 31 | | |
| — | | |
| 31 | |
| Balances as of March 31, 2022 | |
| 2,480 | | |
$ | 25 | | |
$ | 103,207 | | |
$ | (100,757 | ) | |
| 50 | | |
$ | (3,036 | ) | |
$ | (561 | ) | |
$ | 8 | | |
$ | (553 | ) |
| Net loss | |
| — | | |
| — | | |
| — | | |
| (223 | ) | |
| — | | |
| — | | |
| (223 | ) | |
| -** | | |
| (223 | ) |
| Accrued dividend on OmniMetrix preferred shares | |
| — | | |
| — | | |
| — | | |
| — | | |
| — | | |
| — | | |
| — | | |
| (1 | ) | |
| (1 | ) |
| Stock option compensation | |
| — | | |
| — | | |
| 22 | | |
| — | | |
| — | | |
| — | | |
| 22 | | |
| — | | |
| 22 | |
| Balances as of June 30, 2022 | |
| 2,480 | | |
$ | 25 | | |
$ | 103,229 | | |
$ | (100,980 | ) | |
| 50 | | |
$ | (3,036 | ) | |
$ | (762 | ) | |
$ | 7 | | |
$ | (755 | ) |
| Balance | |
| 2,480 | | |
$ | 25 | | |
$ | 103,229 | | |
$ | (100,980 | ) | |
| 50 | | |
$ | (3,036 | ) | |
$ | (762 | ) | |
$ | 7 | | |
$ | (755 | ) |
| | |
| | | |
| | | |
| | | |
| | | |
| | | |
| | | |
| | | |
| | | |
| | |
| Net loss | |
| — | | |
| — | | |
| — | | |
| (210 | ) | |
| — | | |
| — | | |
| (210 | ) | |
| — | | |
| (210 | ) |
| Net income (loss) | |
| — | | |
| — | | |
| — | | |
| (210 | ) | |
| — | | |
| — | | |
| (210 | ) | |
| — | | |
| (210 | ) |
| | |
| | | |
| | | |
| | | |
| | | |
| | | |
| | | |
| | | |
| | | |
| | |
| Accrued dividend on OmniMetrix preferred shares | |
| — | | |
| — | | |
| — | | |
| — | | |
| — | | |
| — | | |
| — | | |
| (1 | ) | |
| (1 | ) |
| Proceeds from stock option exercise | |
| 2 | | |
| -** | | |
| 5 | | |
| — | | |
| — | | |
| — | | |
| 5 | | |
| — | | |
| 5 | |
| Stock option compensation | |
| — | | |
| — | | |
| 16 | | |
| — | | |
| — | | |
| — | | |
| 16 | | |
| — | | |
| 16 | |
| Balances as of September 30, 2022 | |
| 2,482 | | |
$ | 25 | | |
$ | 103,250 | | |
$ | (101,190 | ) | |
| 50 | | |
$ | (3,036 | ) | |
$ | (951 | ) | |
$ | 6 | | |
$ | (945 | ) |
| Balance | |
| 2,482 | | |
$ | 25 | | |
$ | 103,250 | | |
$ | (101,190 | ) | |
| 50 | | |
$ | (3,036 | ) | |
$ | (951 | ) | |
$ | 6 | | |
$ | (945 | ) |
The
accompanying notes are an integral part of these unaudited condensed consolidated financial statements.
ACORN
ENERGY, INC. AND SUBSIDIARIES
CONDENSED
CONSOLIDATED STATEMENTS OF CASH FLOWS
(UNAUDITED)
(IN THOUSANDS)
| | |
2023 | | |
2022 | |
| | |
Nine
months ended September
30, | |
| | |
2023 | | |
2022 | |
| Cash flows provided by (used in) operating
activities: | |
| | | |
| | |
| Net income
(loss) | |
$ | 42 | | |
$ | (555 | ) |
| Depreciation and amortization | |
| 115 | | |
| 83 | |
| Impairment of inventory | |
| 9 | | |
| 31 | |
| Impairment of software | |
| — | | |
| 51 | |
| Non-cash lease expense | |
| 96 | | |
| 93 | |
| Stock-based compensation | |
| 46 | | |
| 69 | |
| Change in operating assets
and liabilities: | |
| | | |
| | |
| Decrease (increase) in
accounts receivable | |
| 14 | | |
| (41 | ) |
| Increase in inventory | |
| (129 | ) | |
| (317 | ) |
| Decrease (increase) in
deferred COGS | |
| 162 | | |
| (158 | ) |
| Increase in other current
assets and other assets | |
| (49 | ) | |
| (62 | ) |
| Increase (decrease) in
accounts payable and accrued expenses | |
| 157 | | |
| (91 | ) |
| Increase in deferred revenue | |
| 40 | | |
| 660 | |
| Decrease in operating lease
liability | |
| (104 | ) | |
| (97 | ) |
| (Decrease)
increase in other current liabilities and non-current liabilities | |
| (33 | ) | |
| 23 | |
| Net
cash provided by (used in) operating activities | |
| 366 | | |
| (311 | ) |
| | |
| | | |
| | |
| Cash flows used in investing activities: | |
| | | |
| | |
| Investments in technology | |
| (70 | ) | |
| (286 | ) |
| Other
capital investments | |
| (2 | ) | |
| (6 | ) |
| Net
cash used in investing activities | |
| (72 | ) | |
| (292 | ) |
| | |
| | | |
| | |
| Cash flows provided by financing activities: | |
| | | |
| | |
| Stock option exercise proceeds | |
| — | | |
| 5 | |
| Warrant exercise proceeds | |
| 5 | | |
| — | |
| Net
cash provided by financing activities | |
| 5 | | |
| 5 | |
| | |
| | | |
| | |
| Net increase (decrease) in cash | |
| 299 | | |
| (598 | ) |
| Cash at the beginning
of the year | |
| 1,450 | | |
| 1,722 | |
| Cash at the end of the
period | |
$ | 1,749 | | |
$ | 1,124 | |
| | |
| | | |
| | |
| Supplemental cash flow information: | |
| | | |
| | |
| Cash paid during the period for: | |
| | | |
| | |
| Interest | |
$ | 2 | | |
$ | 1 | |
| | |
| | | |
| | |
| Non-cash investing and financing activities: | |
| | | |
| | |
| Accrued preferred dividends
to former CEO of OmniMetrix | |
$ | 3 | | |
$ | 3 | |
The
accompanying notes are an integral part of these unaudited condensed consolidated financial statements.
ACORN
ENERGY, INC. AND SUBSIDIARIES
NOTES
TO CONDENSED CONSOLIDATED STATEMENTS
(UNAUDITED)
NOTE
1— BASIS OF PRESENTATION
The
accompanying unaudited condensed consolidated financial statements of Acorn Energy, Inc. (“Acorn”) and its subsidiaries,
OmniMetrix, LLC (“OmniMetrix”) and OMX Holdings, Inc. (collectively, with Acorn and OmniMetrix, “the Company”)
have been prepared in accordance with accounting principles generally accepted in the United States of America for interim financial
information and with the instructions to Article 8 of Regulation S-X. Accordingly, they do not include all of the information and footnotes
required by accounting principles generally accepted in the United States of America for complete consolidated financial statements.
In the opinion of management, all adjustments (consisting of normal recurring adjustments) considered necessary for a fair presentation
have been included. Operating results for the nine- and three-month periods ended September 30, 2023 and 2022 are not necessarily indicative
of the results that may be expected for the year ending December 31, 2023. All dollar amounts are rounded to the nearest thousand and,
thus, are approximate.
These
unaudited condensed consolidated financial statements should be read in conjunction with the consolidated financial statements and footnotes
thereto included in the Company’s Annual Report on Form 10-K for the year ended December 31, 2022, filed with the Securities and
Exchange Commission on March 16, 2023.
Reverse
Stock Split
On
September 5, 2023, the Board of Directors of Acorn approved a Certificate of Amendment to Acorn’s Restated Certificate of Incorporation
(the “Certificate of Amendment”) that provided for a 1-for-16 reverse stock split of Acorn’s Common Stock (the “Reverse
Stock Split”). Acorn filed the Certificate of Amendment with the Secretary of State of the State of Delaware on September 6, 2023,
and the Reverse Stock Split became effective at 5:00 p.m. EDT on September 7, 2023. At the effective time of the Reverse Stock Split,
every sixteen issued and outstanding shares of Acorn’s Common Stock were automatically combined into one issued and outstanding
share of Common Stock, without any change in the par value per share. Stockholders who would have otherwise been entitled to fractional
shares of Common Stock, as a result of the Reverse Stock Split, received a cash payment in lieu of receiving fractional shares. The value
of the fractional shares repurchased was $347 and equated to fifty-eight shares. All share and per share amounts of common stock, options
and warrants contained in this Quarterly Report on Form 10-Q and the accompanying unaudited condensed consolidated financial statements
and related footnotes have been restated for all periods to give retroactive effect to the Reverse Stock Split and the related fractional
share repurchase for all prior periods presented. Accordingly, the unaudited Condensed Consolidated Statement of Stockholders’
Deficit reflects the impact of the Reverse Stock Split by reclassifying from “Common Stock” to “Additional paid in
capital” an amount equal to the aggregate par value of the number of shares by which the total number of shares outstanding decreased
as a result of the Reverse Stock Split.
NOTE
2—ACCOUNTING POLICIES
Use
of Estimates in Preparation of Financial Statements
The
preparation of unaudited condensed consolidated financial statements requires management to make estimates and assumptions that affect
the reported amounts of assets and liabilities and the disclosure of contingent assets and liabilities as of the date of the unaudited
condensed consolidated financial statements, and the reported amounts of revenues and expenses during the reporting periods. Actual results
could differ from those estimates.
As
applicable to these unaudited condensed consolidated financial statements, the most significant estimates and assumptions relate to uncertainties
with respect to revenue recognition and management’s projections related to the going concern analysis.
Concentrations
of Credit Risk
Financial
instruments, which potentially subject the Company to concentrations of credit risk, consist principally of cash and trade accounts receivable.
The Company’s cash was deposited with a U.S. bank and amounted to $1,749,000 at September 30, 2023. The Company does not believe
there is a significant risk of non-performance by its counterparties. For the three-month period ended September 30, 2023, there were
no customers that represented greater than 10% of the Company’s total invoiced sales. For the nine-month period ended September
30, 2023, there was one customer that represented 11% of the Company’s total invoiced sales. At September 30, 2023, the Company
did not have any customers that represented greater than 10% of our total accounts receivable. Approximately 12% of the accounts receivable
at December 31, 2022 was due from one customer which was subsequently collected in full. Credit risk with respect to the balance of trade
receivables is generally diversified due to the number of entities comprising the Company’s customer base. Although we do not believe
there is significant risk of non-performance by these counterparties, any failures or defaults on their part could negatively impact
the value of our financial instruments and could have a material adverse effect on our business, operations or financial condition.
Inventory
Inventories
are comprised of components (raw materials), work-in-process and finished goods, which are measured at the lower of cost or net realizable
value.
Raw
materials inventory is generally comprised of radios, cables, antennas, and electrical components. Finished goods inventory consists
of fully assembled systems ready for final shipment to the customer. Costs are determined at cost of acquisition on a weighted average
basis and include all outside production and applicable shipping costs.
All
inventories are periodically reviewed to identify slow-moving and obsolete inventory. Management conducted an assessment and wrote-off
inventory carried at $9,000 for the nine months ended September 30, 2023, of which $1,000 was written off in the three months ended September
30, 2023.
Revenue
Recognition
On
September 1, 2023, OmniMetrix launched an updated version of its products that includes new functionality in its TrueGuard,
AIRGuard, Patriot and Hero products that allows its customers to have options as it relates to obtaining and utilizing the data that
is provided by its hardware devices. This new functionality allows for SIM card options, configuration options regarding IP address
endpoints and DNS routes, and access to OmniMetrix’s over-the-air data protocol. This product update allows customers to have
the option to purchase OmniMetrix’s monitoring service, monitor the products themselves if they have the ability in-house, or
choose another monitoring provider if they so desire. OmniMetrix’s prior hardware product version could not function as a
distinct product from its monitoring services. This new version’s functionality results in OmniMetrix’s hardware and
monitoring services being capable of being two distinct products and services. OmniMetrix recognizes revenue, COGS and commissions
from the sale of the new version of its hardware products sold when the product is shipped rather than over the estimated time that
the unit is in service for the customer. Monitoring revenue continues to be deferred and amortized over the period that the
monitoring services are rendered. The remaining balance of deferred revenue from the prior version of these products will continue
to be amortized each period until it is fully amortized. The modification to the circuit boards and embedded firmware of hardware
enclosures in inventory as of August 31, 2023 were made such that only the new version of these products was sold subsequent to this
date.
Basic
and Diluted Net Income (Loss) Per Share
Basic
net income (loss) per share is computed by dividing the net income (loss) attributable to Acorn Energy, Inc. by the weighted average
number of shares outstanding during the period, excluding treasury stock. Diluted net income (loss) per share is computed by dividing
the net income (loss) by the weighted average number of shares outstanding plus the dilutive potential of common shares which would result
from the exercise of stock options. The dilutive effects of stock options are excluded from the computation of diluted net income (loss)
per share if doing so would be antidilutive. For the nine-month period ending September 30, 2023, the weighted average number of options
that were excluded from the computation of diluted net loss, as they had an antidilutive effect, was 6,000 (which have a weighted average
exercise price of $8.49). For the three-month period ending September 30, 2023, there were no options that were excluded from the computation
of diluted net loss due to having an antidilutive effect. For both the nine- and three-month periods ending September 30, 2022, the number
of options that were excluded from the computation of diluted net loss, as they had an antidilutive effect, was 60,000 (which have a
weighted average exercise price of $6.72) and the number of warrants that were excluded from the computation of diluted net loss, as
they had an antidilutive effect, was 2,187 (which had a weighted average exercise price of $2.08).
The
following data represents the amounts used in computing EPS and the effect on net income (loss) and the weighted average number of shares
of dilutive potential common stock (in thousands):
SCHEDULE OF EFFECT ON NET INCOME LOSS AND WEIGHTED AVERAGE NUMBER OF SHARES
| | |
2023 | | |
2022 | | |
2023 | | |
2022 | |
| | |
Nine
months ended September
30, | | |
Three
months ended September
30, | |
| | |
2023 | | |
2022 | | |
2023 | | |
2022 | |
| Net income
(loss) available to common stockholders | |
$ | 35 | | |
$ | (556 | ) | |
$ | 24 | | |
$ | (210 | ) |
| | |
| | | |
| | | |
| | | |
| | |
| Weighted average share outstanding: | |
| | | |
| | | |
| | | |
| | |
| Basic | |
| 2,484 | | |
| 2,481 | | |
| 2,485 | | |
| 2,481 | |
| Add:
Stock options | |
| 22 | | |
| — | | |
| 47 | | |
| — | |
| Diluted | |
| 2,506 | | |
| 2,481 | | |
| 2,532 | | |
| 2,481 | |
| | |
| | | |
| | | |
| | | |
| | |
| Basic and diluted net income (loss) per share | |
$ | 0.01 | | |
$ | (0.22 | ) | |
$ | 0.01 | | |
$ | (0.08 | ) |
Recently
Adopted Accounting Standards
Other
than the pronouncement noted below, there have been no recent accounting pronouncements or changes in accounting standards during
the nine-month period ended September 30, 2023 that would affect the Company’s condensed consolidated financial
statements.
On
January 1, 2023, the Company adopted ASU 2016-13, “Financial Instruments – Credit Losses (Topic 326): Measurement of Credit
Losses on Financial Instruments.” This guidance was issued to provide financial statement users with more useful information about
the expected credit losses on financial instruments and other commitments to extend credit held by a reporting entity at each reporting
date. Specifically, this guidance requires entities to utilize a new “expected loss” model as it relates to trade and other
receivables. The adoption of the standard impacts the way the Company estimates the allowance for doubtful accounts on its trade and
other receivables. Refer to Note 4, “Allowance for Credit Losses,” for further information regarding the Company’s
allowance for expected credit losses.
NOTE
3—LIQUIDITY
As
of September 30, 2023, the Company had cash of $1,749,000.
At
September 30, 2023, the Company had negative working capital of $513,000. The Company’s working capital includes $1,749,000 of
cash and deferred revenue of $4,270,000. Such deferred revenue does not require a significant cash outlay for the revenue to be recognized.
Net cash increased during the nine months ended September 30, 2023 by $299,000, of which $366,000 was provided by operating activities,
$72,000 was used in investing activities and $5,000 was provided by financing activities.
As
of November 7, 2023, the Company had cash of $1,684,000. The Company believes that such cash, plus the cash generated from operations,
will provide sufficient liquidity to finance the operating activities of the Company at its current level of operations for the twelve
months from the issuance of these unaudited condensed consolidated financial statements. The Company may, at some point, elect to obtain
a new line of credit or other source of financing to fund additional investments in the business.
NOTE
4—ALLOWANCE FOR CREDIT LOSSES
For
the Company, ASU 2016-13, “Financial Instruments – Credit Losses (Topic 326): Measurement of Credit Losses on Financial Instruments,”
applies to its contract assets (deferred COGS and deferred sales commissions), lease receivables (sublease, see Note 6) and trade receivables.
There are no expected or estimated credit losses on the Company’s contract assets or its lease receivable based on the Company’s
implementation of ASU 2016-13.
The
Company’s trade receivables primarily arise from the sale of our products to independent residential dealers, industrial distributors
and dealers, national and regional retailers, equipment distributors, and certain end users with payment terms generally ranging from
30 to 60 days. The Company evaluates the credit risk of a customer when extending credit based on a combination of various financial
and qualitative factors that may affect the customer’s ability to pay. These factors include the customer’s financial condition
and past payment experience.
The
Company maintains an allowance for credit losses, which represents an estimate of expected losses over the remaining contractual life
of its receivables considering current market conditions and estimates for supportable forecasts when appropriate. The Company measures
expected credit losses on its trade receivables on an entity-by-entity basis. The estimate of expected credit losses considers a historical
loss experience rate that is adjusted for delinquency trends, collection experience, and/or economic risk where appropriate. Additionally,
management develops a specific allowance for trade receivables known to have a high risk of expected future credit loss.
The
Company has historically experienced immaterial write-offs given the nature of the customers that receive credit. As of September 30,
2023, the Company had gross receivables of $590,000 and an allowance for credit losses of $7,000.
The
following is a tabular reconciliation of the Company’s allowance for credit losses:
SCHEDULE
OF ALLOWANCES FOR CREDIT LOSSES
| | |
September
30, 2023 | | |
December
31, 2022 | |
| | |
As
of | |
| | |
September
30, 2023 | | |
December
31, 2022 | |
| | |
(in thousands) | |
| Balance at beginning of period | |
$ | 10 | | |
$ | 6 | |
| Provision for credit losses | |
| 3 | | |
| 3 | |
| Net (charge-offs) credits | |
| (6 | ) | |
| 1 | |
| Balance at end of period | |
$ | 7 | | |
$ | 10 | |
NOTE
5—INVENTORY
SCHEDULE
OF INVENTORY
| | |
September
30, 2023 | | |
December
31, 2022 | |
| | |
As
of | |
| | |
September
30, 2023 | | |
December
31, 2022 | |
| | |
(in thousands) | |
| Raw materials | |
$ | 859 | | |
$ | 684 | |
| Finished goods | |
| 50 | | |
| 105 | |
| Inventory net | |
$ | 909 | | |
$ | 789 | |
At
September 30, 2023 and December 31, 2022, the Company’s inventory reserve was $9,000 and $4,000, respectively.
All
inventories are periodically reviewed to identify slow-moving and obsolete inventory. Management conducted an assessment and wrote-off
inventory carried at $9,000 for the nine months ended September 30, 2023, of which $1,000 was written off in the three months ended September
30, 2023.
NOTE
6—LEASES
OmniMetrix
leases office space and office equipment under operating lease agreements. The office lease has an expiration date of September 30, 2025.
The office equipment lease was entered into in April 2019 and has a sixty-month term. Operating lease payments for the nine months ended
September 30, 2023 and 2022 were $96,000 and $93,000, respectively. Operating lease payments for the three months ended September 30,
2023 and 2022 were $33,000 and $31,000, respectively. The future minimum lease payments on non-cancellable operating leases as of September
30, 2023 using a discount rate of 4.5% are $250,000. The 4.5% discount rate used is the incremental borrowing rate which, as defined
in ASC 842, is the rate of interest that a lessee would have to pay to borrow, on a collateralized basis, over a similar term and in
a similar economic environment, an amount equal to the lease payments.
Supplemental
cash flow information related to leases consisted of the following (in thousands):
SCHEDULE
OF SUPPLEMENTAL CASH FLOW INFORMATION RELATED TO LEASES
| | |
For
the Nine Months Ending
September 30, | |
| | |
2023 | | |
2022 | |
| Cash paid for operating lease liabilities | |
$ | 96 | | |
$ | 93 | |
| | |
| | | |
| | |
Supplemental
balance sheet information related to leases consisted of the following:
SCHEDULE
OF SUPPLEMENTAL BALANCE SHEET INFORMATION RELATED TO LEASES
| | |
| 2023 | |
| Weighted average remaining lease
terms for operating leases | |
| 1.99
years | |
| | |
| | |
The
table below reconciles the undiscounted future minimum lease payments under non-cancelable lease agreements having initial terms of more
than one year to the total operating lease liabilities recognized on the unaudited condensed consolidated balance sheet as of September
30, 2023 (in thousands):
SCHEDULE
OF FUTURE MINIMUM LEASE PAYMENTS
| | |
Year
ended September
30, | |
| 2024 | |
$ | 129 | |
| 2025 | |
| 132 | |
| Total undiscounted cash flows | |
| 261 | |
| Less: Imputed interest | |
| (11 | ) |
| Present value of
operating lease liabilities (a) | |
$ | 250 | |
On
July 6, 2021, the Company entered into an agreement with King Industrial Realty, Inc., to sublease from the Company 1,900 square feet
of office space of the Company’s 21,000 square feet of office and production space in the Hamilton Mill Business Park located in
Buford, Georgia, for a monthly sublease payment of $2,375 (plus an annual escalator each year of 3%) which includes the base rent plus
a pro-rata share of utilities, property taxes and insurance. Fifty percent of any excess rent received above the per square foot amount
that the Company pays will be remitted to the Company’s landlord less the allocation of any shared expenses and leasehold improvements
specific to the sublease. The estimated amount the Company expects to remit to the landlord each future year of the sublease is $6,100
per year. The sublease commenced on October 1, 2021 and will run through September 30, 2025 which is the end of the Company’s lease
term with its landlord. Below are the future payments (in thousands) expected under the sublease net of the estimated annual service
cost of $2,220:
SCHEDULE
OF SUB LEASES
| | |
Year
ended
September
30, | |
| 2024 | |
$ | 28 | |
| 2025 | |
| 29 | |
| Total
undiscounted cash flows | |
$ | 57 | |
NOTE
7—COMMITMENTS AND CONTINGENCIES
The
Company has $250,000 in operating lease obligations payable through 2025 and $15,000 in other contractual obligations. The Company also
had $603,000 in open purchase order commitments payable through October 2023.
NOTE
8—EQUITY
(a)
General
Reverse
Stock Split
On
September 5, 2023, the Board of Directors of Acorn approved a Certificate of Amendment to Acorn’s Restated Certificate of Incorporation
that provided for a 1-for-16 reverse stock split of Acorn’s Common Stock. See Note 1 for related details. At September 30, 2023,
Acorn had issued and outstanding 2,484,791 shares of its common stock, par value $0.01 per share. Holders of outstanding common stock
are entitled to receive dividends when and if declared by the Board and to share ratably in the assets of the Company legally available
for distribution in the event of a liquidation, dissolution or winding up of the Company.
The
Company is not authorized to issue preferred stock. Accordingly, no preferred stock is issued or outstanding.
(b)
Summary Employee Option Information
The
Company’s stock option plans provide for the grant to officers, directors and employees of options to purchase shares of common
stock. The purchase price may be paid in cash or, if the option is “in-the-money” at the end of the option term, it is automatically
exercised “net”. In a net exercise of an option, the Company does not require a payment of the exercise price of the option
from the optionee but reduces the number of shares of common stock issued upon the exercise of the option by the smallest number of whole
shares that has an aggregate fair market value equal to or in excess of the aggregate exercise price for the option shares covered by
the option exercised. Each option is exercisable for one share of the Company’s common stock. Most options expire within five to
ten years from the date of the grant, and generally vest over a three-year period from the date of the grant.
At
September 30, 2023, 77,540 options were available for grant under the Amended and Restated 2006 Stock Incentive Plan and no options were
available for grant under the 2006 Stock Option Plan for Non-Employee Directors. During the nine
months ended September 30, 2023, 13,436 options were issued. No options were issued in the three months ended September 30, 2023. The
options were issued as follows: an aggregate of 3,437 to directors (excluding the CEO), 2,187 to the CEO, 6,250 to the CFO and an aggregate
of 1,562 to employees. In the nine and three months ended September 30, 2023, there were no grants to non-employees (other than the directors,
CEO and CFO).
No
options were exercised in the nine and three months ended September 30, 2023. The intrinsic value of options outstanding and of options
exercisable at September 30, 2023 was $38,000. The Company utilized the Black-Scholes option-pricing model to estimate fair value, utilizing
the following assumptions for the respective years (all in weighted averages):
SCHEDULE
OF BLACK-SCHOLES OPTION PRICING ESTIMATE FAIR VALUE
| | |
Number of
Options (in
shares) | | |
Weighted Average Exercise Price
Per Share | | |
Weighted Average Remaining Contractual
Life | | |
Aggregate Intrinsic Value | |
| Outstanding at December 31, 2022 | |
| 58,966 | | |
$ | 6.71 | | |
| 4.3
years | | |
$ | 16,000 | |
| Granted | |
| 13,436 | | |
| 5.24 | | |
| | | |
| | |
| Exercised | |
| — | | |
| — | | |
| | | |
| | |
| Forfeited or expired | |
| (1,280 | ) | |
| 6.48 | | |
| | | |
| | |
| Outstanding at September 30, 2023 | |
| 71,122 | | |
$ | 6.44 | | |
| 4.2
years | | |
$ | 46,000 | |
| Exercisable at September 30, 2023 | |
| 61,786 | | |
$ | 6.49 | | |
| 3.9
years | | |
$ | 38,000 | |
The
fair value of the options granted of $46,000 was estimated on the grant date using the Black-Scholes option-pricing model with the following
weighted average assumptions:
SCHEDULE
OF STOCK OPTIONS FAIR VALUE ASSUMPTIONS ESTIMATED USING BLACK-SCHOLES
| Risk-free interest rate | |
| 3.9 | % |
| Expected term of options | |
| 4.1
years | |
| Expected annual volatility | |
| 94.5 | % |
| Expected dividend yield | |
| — | % |
(c)
Stock-based Compensation Expense
Stock-based
compensation expense included in SG&A expenses in the Company’s unaudited condensed consolidated statements of operations was
$46,000 and $69,000 for the nine-month periods ended September 30, 2023 and 2022, respectively, and $16,000 and $16,000 for the three-month
periods ended September 30, 2023 and 2022, respectively.
The
total compensation cost related to non-vested awards not yet recognized was $17,000 and $43,000 as of September 30, 2023 and 2022, respectively.
(d)
Warrants
The
Company previously issued warrants at exercise prices equal to or greater than the market value of the Company’s common stock at
the date of issuance. A summary of warrant activity follows:
SUMMARY
OF WARRANT ACTIVITY
| | |
Number of
Warrants (in
shares) | | |
Weighted Average Exercise Price
Per Share | | |
Weighted Average Remaining Contractual Life | |
| Outstanding at December 31, 2022 | |
| 2,187 | | |
$ | 2.08 | | |
| 2.5
months | |
| Granted | |
| — | | |
| — | | |
| | |
| Exercised | |
| (2,187 | ) | |
| 2.08 | | |
| | |
| Forfeited or expired | |
| — | | |
| — | | |
| | |
| Outstanding at September 30, 2023 | |
| — | | |
$ | — | | |
| — | |
NOTE
9— SEGMENT REPORTING
As
of September 30, 2023, the Company operates in two reportable operating segments, both of which are performed through the Company’s
OmniMetrix subsidiary:
| |
● |
Power
Generation (“PG”). OmniMetrix’s PG services provide wireless remote monitoring and control systems and IoT
applications for residential and commercial/industrial power generation equipment. This includes OmniMetrix’s AIRGuard product,
which remotely monitors and controls industrial air compressors, and its Smart Annunciator product, which is typically sold to commercial
customers that require a visual representation of the generator’s status and has a touchscreen display that indicates the current
state of that generator. |
| |
|
|
| |
● |
Cathodic
Protection (“CP”). OmniMetrix’s CP services provide remote monitoring and control products for cathodic protection
systems on oil and gas pipelines serving the gas utilities market and pipeline operators. The CP product lineup includes solutions
to remotely monitor and control rectifiers, test stations and bonds. OmniMetrix also offers the industry’s first RADTM
(Remote AC Mitigation Disconnect) that mounts onto existing Solid-state Decouplers in the field and can remotely disconnect/connect
these AC mitigation tools, which can drastically reduce a company’s expense while increasing employee safety. |
The
Company’s reportable segments are strategic business units, offering different products and services, and are managed separately
as each business requires different technology and marketing strategies.
The
following tables represent segmented data for the nine-month and three-month periods ended September 30, 2023 and 2022 (in thousands):
SUMMARY
OF SEGMENTED DATA
| | |
PG | | |
CP | | |
Total | |
| Nine months ended September 30, 2023: | |
| | | |
| | | |
| | |
| Revenues from
external customers | |
$ | 4,994 | | |
$ | 815 | | |
$ | 5,809 | |
| Segment gross profit | |
| 3,876 | | |
| 480 | | |
| 4,356 | |
| Depreciation and amortization | |
| 99 | | |
| 16 | | |
| 115 | |
| Segment income (loss) before
income taxes | |
$ | 891 | | |
$ | (35 | ) | |
$ | 856 | |
| | |
| | | |
| | | |
| | |
| Nine months ended September 30, 2022: | |
| | | |
| | | |
| | |
| Revenues from external
customers | |
$ | 4,335 | | |
$ | 820 | | |
$ | 5,155 | |
| Segment gross profit | |
| 3,256 | | |
| 463 | | |
| 3,719 | |
| Depreciation and amortization | |
| 72 | | |
| 13 | | |
| 85 | |
| Segment income (loss) before
income taxes* | |
$ | 340 | | |
$ | (103 | ) | |
$ | 237 | |
| | |
| | | |
| | | |
| | |
| Three months ended September 30, 2023: | |
| | | |
| | | |
| | |
| Revenues from external
customers | |
$ | 1,798 | | |
$ | 289 | | |
$ | 2,087 | |
| Segment gross profit | |
| 1,381 | | |
| 169 | | |
| 1,550 | |
| Depreciation and amortization | |
| 36 | | |
| 5 | | |
| 41 | |
| Segment income before income
taxes | |
$ | 361 | | |
$ | 5 | | |
$ | 366 | |
| | |
| | | |
| | | |
| | |
| Three months ended September 30, 2022: | |
| | | |
| | | |
| | |
| Revenues from external
customers | |
$ | 1,510 | | |
$ | 273 | | |
$ | 1,783 | |
| Segment gross profit | |
| 1,092 | | |
| 123 | | |
| 1,215 | |
| Depreciation and amortization | |
| 31 | | |
| 5 | | |
| 36 | |
| Segment income (loss) before
income taxes | |
$ | 78 | | |
$ | (58 | ) | |
$ | 20 | |
| * | is
not related to a specific segment and, thus, is not included in the “Total net income before income taxes for reportable
segments” for the nine months ended September 30, 2022 |
The
Company does not currently break out total assets by reportable segment as there is a high level of shared utilization between the segments.
Further, the Chief Decision Maker does not review the assets by segment.
Reconciliation
of Segment Income (Loss) to Consolidated Net Income (Loss) Before Income Taxes
SCHEDULE
OF RECONCILIATION OF SEGMENT DATA TO CONSOLIDATED STATEMENT OF OPERATIONS
| | |
2023 | | |
2022 | | |
2023 | | |
2022 | |
| | |
Nine
months ended September
30, | | |
Three
months ended September
30, | |
| | |
2023 | | |
2022 | | |
2023 | | |
2022 | |
| Total net income before income
taxes for reportable segments | |
$ | 856 | | |
$ | 237 | | |
$ | 366 | | |
$ | 20 | |
| Unallocated software impairment | |
| | | |
| (51 | ) | |
| | | |
| | |
| Unallocated cost of
corporate headquarters | |
| (814 | ) | |
| (741 | ) | |
| (339 | ) | |
| (230 | ) |
| Consolidated net income (loss) before income
taxes | |
$ | 42 | | |
$ | (555 | ) | |
$ | 27 | | |
$ | (210 | ) |
NOTE
10—REVENUE
The
following table disaggregates the Company’s revenue for the nine-month and three-month periods ended September 30, 2023 and 2022
(in thousands):
SCHEDULE
OF DISAGGREGATES OF REVENUE
| | |
Hardware | | |
Monitoring | | |
Total | |
| Nine months ended September 30, 2023: | |
| | | |
| | | |
| | |
| PG Segment | |
$ | 2,017 | | |
$ | 2,977 | | |
$ | 4,994 | |
| CP
Segment | |
| 620 | | |
| 195 | | |
| 815 | |
| Total
Revenue | |
$ | 2,637 | | |
$ | 3,172 | | |
$ | 5,809 | |
| | |
Hardware | | |
Monitoring | | |
Total | |
| Nine months ended September 30, 2022: | |
| | | |
| | | |
| | |
| PG Segment | |
$ | 1,610 | | |
$ | 2,725 | | |
$ | 4,335 | |
| CP
Segment | |
| 631 | | |
| 189 | | |
| 820 | |
| Total
Revenue | |
$ | 2,241 | | |
$ | 2,914 | | |
$ | 5,155 | |
| | |
Hardware | | |
Monitoring | | |
Total | |
| Three months ended September 30, 2023: | |
| | | |
| | | |
| | |
| PG Segment | |
$ | 780 | | |
$ | 1,018 | | |
$ | 1,798 | |
| CP
Segment | |
| 224 | | |
| 65 | | |
| 289 | |
| Total
Revenue | |
$ | 1,004 | | |
$ | 1,083 | | |
$ | 2,087 | |
| | |
Hardware | | |
Monitoring | | |
Total | |
| Three months ended September 30, 2022: | |
| | | |
| | | |
| | |
| PG Segment | |
$ | 608 | | |
$ | 902 | | |
$ | 1,510 | |
| CP
Segment | |
| 217 | | |
| 56 | | |
| 273 | |
| Total
Revenue | |
$ | 825 | | |
$ | 958 | | |
$ | 1,783 | |
Deferred
revenue activity for the nine months ended September 30, 2023 can be seen in the table below (in thousands):
SCHEDULE
OF DEFERRED REVENUE ACTIVITY
| |
|
Hardware |
|
|
Monitoring |
|
|
Total |
|
| Balance
at December 31, 2022 |
|
$ |
3,751 |
|
|
$ |
2,420 |
|
|
$ |
6,171 |
|
| Additions
during the period |
|
|
1,597 |
|
|
|
3,436 |
|
|
|
5,033 |
|
| Recognized
as revenue |
|
|
(1,821 |
) |
|
|
(3,172 |
) |
|
|
(4,993 |
) |
| Balance
at September 30, 2023 |
|
$ |
3,527 |
|
|
$ |
2,684 |
|
|
$ |
6,211 |
|
| |
|
|
|
|
|
|
|
|
|
|
|
|
| Amounts
to be recognized as revenue in the twelve-month-period ending: |
|
|
|
|
|
|
|
|
|
|
|
|
| September
30, 2024 |
|
$ |
2,023 |
|
|
$ |
2,247 |
|
|
$
|
4,270 |
|
| September
30, 2025 |
|
|
1,179 |
|
|
|
433 |
|
|
|
1,612 |
|
| September
30, 2026 and thereafter |
|
|
325 |
|
|
|
4 |
|
|
|
329 |
|
| |
|
$ |
3,527 |
|
|
$ |
2,684 |
|
|
$ |
6,211 |
|
The
amount of hardware revenue recognized during the nine months ended September 30, 2023 that was included in deferred revenue at the beginning
of the fiscal year was $1,469,000. The amount of monitoring revenue during the nine months ended September 30, 2023 that was included
in deferred revenue at the beginning of the fiscal year was $1,890,000.
SCHEDULE
OF RECONCILIATION OF HARDWARE REVENUE
| Reconciliation of Hardware
Revenue | |
2023 | | |
2022 | | |
2023 | | |
2022 | |
| | |
Nine
months ended September
30, | | |
Three
months ended September
30, | |
| Reconciliation of Hardware
Revenue | |
2023 | | |
2022 | | |
2023 | | |
2022 | |
| Amortization of deferred revenue | |
$ | 1,821 | | |
$ | 1,658 | | |
$ | 629 | | |
$ | 631 | |
| Sales of custom designed units and related
accessories | |
| 135 | | |
| — | | |
| 43 | | |
| — | |
| Hardware sales (new product versions) | |
| 150 | | |
| — | | |
| 150 | | |
| — | |
| Other accessories, services,
shipping and miscellaneous charges | |
| 531 | | |
| 583 | | |
| 182 | | |
| 194 | |
| Total hardware revenue | |
$ | 2,637 | | |
$ | 2,241 | | |
$ | 1,004 | | |
$ | 825 | |
Deferred
charges relate only to the sale of equipment. Deferred charges activity for the nine months ended September 30, 2023 can be seen in the
table below (in thousands):
SCHEDULE
OF DEFERRED CHARGES ACTIVITY
| | |
| | |
| Balance at December 31, 2022 | |
$ | 1,694 | |
| Additions, net of adjustments,
during the period | |
| 655 | |
| Recognized as COGS | |
| (817 | ) |
| Balance at September 30, 2023 | |
$ | 1,532 | |
| | |
| | |
| Amounts to be recognized as COGS in the twelve-month-period
ending: | |
| | |
| September 30, 2024 | |
$ | 890 | |
| September 30, 2025 | |
| 507 | |
| September 30, 2026
and thereafter | |
| 135 | |
| | |
$ | 1,532 | |
SCHEDULE
OF RECONCILIATION OF COGS EXPENSE
| Reconciliation of COGS
Expense | |
2023 | | |
2022 | | |
2023 | | |
2022 | |
| | |
Nine
months ended September
30, | | |
Three
months ended September
30, | |
| Reconciliation of COGS
Expense | |
2023 | | |
2022 | | |
2023 | | |
2022 | |
| Amortization of deferred COGS | |
$ | 817 | | |
$ | 793 | | |
$ | 277 | | |
$ | 309 | |
| COGS of custom designed units and related accessories | |
| 34 | | |
| — | | |
| 11 | | |
| — | |
| COGS of hardware sales (new product versions) | |
| 66 | | |
| — | | |
| 66 | | |
| — | |
| Data costs for monitoring | |
| 224 | | |
| 250 | | |
| 76 | | |
| 93 | |
| Other COGS of accessories,
services, shipping and miscellaneous charges | |
| 312 | | |
| 393 | | |
| 107 | | |
| 166 | |
| Total COGS expense | |
$ | 1,453 | | |
$ | 1,436 | | |
$ | 537 | | |
$ | 568 | |
The
following table provides a reconciliation of the Company’s sales commissions contract assets for the nine-month period ended September
30, 2023 (in thousands):
SCHEDULE
OF SALES COMMISSIONS CONTRACT ASSETS
| | |
Hardware | | |
Monitoring | | |
Total | |
| Balance at December 31, 2022 | |
$ | 319 | | |
$ | 80 | | |
$ | 399 | |
| Additions during the period | |
| 148 | | |
| 43 | | |
| 191 | |
| Amortization of sales
commissions | |
| (149 | ) | |
| (27 | ) | |
| (176 | ) |
| Balance at September 30, 2023 | |
$ | 318 | | |
| 96 | | |
| 414 | |
The
capitalized sales commissions are included in other current assets ($218,000) and other assets ($196,000) in the Company’s unaudited
condensed consolidated balance sheets as of September 30, 2023. The capitalized sales commissions are included in other current assets
($196,000) and other assets ($203,000) in the Company’s condensed consolidated balance sheet at December 31, 2022.
Amounts
to be recognized as sales commission expense in the twelve-month-period ending:
SCHEDULE
OF SALES COMMISSIONS EXPENSE
| |
|
|
|
|
| September
30, 2024 |
|
$ |
218 |
|
| September
30, 2025 |
|
|
138 |
|
| September
30, 2026 and thereafter |
|
|
58 |
|
| Total |
|
$ |
414 |
|
The
contract assets of deferred COGS and deferred sales commissions are subject to review under ASU 2016-13, see Notes 2 and 4; however,
no credit losses on contract assets are expected based on the Company’s implementation of ASU 2016-13.
Commissions
earned from the sales of the new hardware products will be recognized when the product is shipped.
NOTE
11—RELATED PARTY BALANCES AND TRANSACTIONS
Officer
and Director Fees
The
Company recorded fees to officers of $391,000 and $391,000 for the nine months ended September 30, 2023 and 2022, respectively, and $131,000
and $130,000 for the three months ended September 30, 2023 and 2022, respectively, which are included in SG&A expenses.
The
Company recorded fees to directors of $52,000 and $44,000 for the nine months ended September 30, 2023 and 2022, respectively, and $18,000
and $15,000 for the three months ended September 30, 2023 and 2022, respectively, which are included in SG&A expenses.
Intercompany
The
intercompany balance due to Acorn from OmniMetrix for amounts loaned, accrued interest and expenses paid by Acorn on
OmniMetrix’s behalf was $2,928,000
as of September 30, 2023 as compared to $3,677,000
as of December 31, 2022. During the nine months ended September 30, 2023, the intercompany amount due to Acorn from OmniMetrix
decreased by $749,000.
This included repayments of $961,000
offset by interest of $134,000
and dividends of $57,000
due to Acorn and $21,000
in shared expenses paid by Acorn. During the nine
months ended September 30, 2022, the intercompany amount due to Acorn from OmniMetrix decreased by $447,000.
This included repayments of $780,000
offset by interest of $134,000,
dividends of $57,000
due to Acorn and $142,000
in shared expenses paid by Acorn. The intercompany balances are eliminated in consolidation.
ACORN
ENERGY, INC.
| ITEM
2. |
MANAGEMENT’S
DISCUSSION AND ANALYSIS OF FINANCIAL CONDITION AND RESULTS OF OPERATIONS |
This
Form 10-Q contains “forward-looking statements” relating to the Company which represent the Company’s current expectations
or beliefs including, but not limited to, statements concerning the Company’s operations, performance, financial condition and
growth. For this purpose, any statements contained in this Form 10-Q that are not statements of historical fact are forward-looking statements.
Without limiting the generality of the foregoing, words such as “may”, “anticipate”, “intend”, “could”,
“estimate” or “continue” or the negative or other comparable terminology are intended to identify forward-looking
statements. These statements by their nature involve substantial risks and uncertainties, such as credit losses, dependence on management
and key personnel, variability of quarterly results, and the ability of the Company to continue its growth strategy and the Company’s
competition, certain of which are beyond the Company’s control. Should one or more of these risks or uncertainties materialize
or should the underlying assumptions prove incorrect, or any of the other risks set out under the caption “Risk Factors”
in the Company’s Annual Report on Form 10-K for the year ended December 31, 2022 occur, actual outcomes and results could differ
materially from those indicated in the forward-looking statements.
Any
forward-looking statement speaks only as of the date on which such statement is made, and the Company undertakes no obligation to update
any forward-looking statement or statements to reflect events or circumstances after the date on which such statement is made or to reflect
the occurrence of unanticipated events. New factors emerge from time to time, and it is not possible for management to predict all such
factors, nor can it assess the impact of each such factor on the business or the extent to which any factor, or combination of factors,
may cause actual results to differ materially from those contained in any forward-looking statements.
All
dollar amounts in the discussion below are rounded to the nearest thousand and, thus, are approximate.
FINANCIAL
RESULTS BY COMPANY
The
following table shows, for the periods indicated, the financial results (dollar amounts in thousands) attributable to each of our consolidated
companies.
| | |
Nine
months ended September 30, 2023 | |
| | |
OmniMetrix | | |
Acorn | | |
Total | |
| Revenue | |
$ | 5,809 | | |
$ | — | | |
$ | 5,809 | |
| COGS | |
| 1,453 | | |
| — | | |
| 1,453 | |
| Gross profit | |
| 4,356 | | |
| — | | |
| 4,356 | |
| Gross profit margin | |
| 75 | % | |
| | | |
| 75 | % |
| R&D expense | |
| 614 | | |
| — | | |
| 614 | |
| SG&A expense | |
| 2,932 | | |
| 814 | | |
| 3,746 | |
| Operating income (loss) | |
$ | 810 | | |
$ | (814 | ) | |
$ | (4 | ) |
| | |
Nine
months ended September 30, 2022 | |
| | |
OmniMetrix | | |
Acorn | | |
Total | |
| Revenue | |
$ | 5,155 | | |
$ | — | | |
$ | 5,155 | |
| COGS | |
| 1,436 | | |
| — | | |
| 1,436 | |
| Gross profit | |
| 3,719 | | |
| — | | |
| 3,719 | |
| Gross profit margin | |
| 72 | % | |
| | | |
| 72 | % |
| R&D expense | |
| 637 | | |
| — | | |
| 637 | |
| SG&A expense | |
| 2,845 | | |
| 740 | | |
| 3,585 | |
| Impairment of software | |
| 51 | | |
| — | | |
| 51 | |
| Operating income (loss) | |
$ | 186 | | |
$ | (740 | ) | |
$ | (554 | ) |
| | |
Three
months ended September 30, 2023 | |
| | |
OmniMetrix | | |
Acorn | | |
Total | |
| Revenue | |
$ | 2,087 | | |
$ | — | | |
$ | 2,087 | |
| COGS | |
| 537 | | |
| — | | |
| 537 | |
| Gross profit | |
| 1,550 | | |
| — | | |
| 1,550 | |
| Gross profit margin | |
| 74 | % | |
| | | |
| 74 | % |
| R&D expense | |
| 212 | | |
| — | | |
| 212 | |
| SG&A expense | |
| 990 | | |
| 340 | | |
| 1,330 | |
| Operating income (loss) | |
$ | 348 | | |
$ | (340 | ) | |
$ | 8 | |
| |
|
Three
months ended September 30, 2022 |
|
| |
|
OmniMetrix |
|
|
Acorn |
|
|
Total |
|
| Revenue |
|
$ |
1,783 |
|
|
$ |
— |
|
|
$ |
1,783 |
|
| COGS |
|
|
568 |
|
|
|
— |
|
|
|
568 |
|
| Gross
profit |
|
|
1,215 |
|
|
|
— |
|
|
|
1,215 |
|
| Gross
profit margin |
|
|
68 |
% |
|
|
|
|
|
|
68 |
% |
| R&D
expense |
|
|
227 |
|
|
|
— |
|
|
|
227 |
|
| SG&A
expense |
|
|
968 |
|
|
|
230 |
|
|
|
1,198 |
|
| Operating
loss |
|
$ |
20 |
|
|
$ |
(230 |
) |
|
$ |
(210 |
) |
BACKLOG
As
of September 30, 2023, OmniMetrix had a backlog of $6,211,000, primarily comprised of deferred revenue, of which $4,270,000 is expected
to be recognized as revenue in the next twelve months. This compares to a backlog of $6,053,000 at September 30, 2022. Now that we are
selling hardware units that are capable of being distinct, the hardware backlog will no longer continue to grow and will be fully amortized
by August 31, 2026, while the monitoring backlog will continue to be deferred and amortized over the period of service.
RECENT
DEVELOPMENTS
On
March 17, 2021, we entered into a master services agreement for the development of a new user interface for our customer data portal.
As of September 30, 2023, we have invested $178,000 in design, development and quality assurance services of the new user interface.
We deployed the new interface and made it available to our customers on October 1, 2023. Our customers have the option to continue to
use the “classic view” of our user interface, which is our original user interface, or our new user interface known as “OV2”
until December 31, 2023 when we will officially terminate our original user interface. The cost of this project was capitalized, and
amortization began on October 1, 2023 when it was deployed.
In
July 2022, we announced a partnership between OmniMetrix, CPower Energy Management (“CPower”), and Power Solutions
Specialists TX (“PSS”) designed to help homeowners that install next-generation standby generators to earn compensation for
offering grid relief, known as “demand response,” to the Electric Reliability Council of Texas (“ERCOT”). CPower’s
demand response solutions, combined with OmniMetrix’s remote control capabilities, allow the shifting of electricity production
to PSS’s best-in-class residential standby generators for a few hours each year when the grid is stressed or ERCOT energy pricing
is high, without the homeowner needing to take any action. Homeowners are compensated for signing up and possibly supplying grid offload
by running their generators for up to 12 hours per year. We are currently assisting PSS to market the demand response program to generator
owners and will incentivize existing generator owners who sign up and satisfy certain terms and conditions by offering a one-time rebate
of $200 to anyone who signs up before March 31, 2024.
On
September 1, 2023, we launched an updated version of our products that includes new functionality in our TrueGuard, AIRGuard, Patriot
and Hero products that allows our customers to have options as it relates to obtaining and utilizing the data that is provided by our
hardware devices. This new functionality allows for SIM card options, configuration options regarding IP address endpoints and DNS routes,
and access to our over-the-air data protocol. This product update allows customers to have the option to purchase our monitoring service,
monitor the products themselves if they have the ability in-house, or choose another monitoring provider if they so desire, whereas,
historically, our standard products only functioned with our monitoring services. The modification to the circuit boards and embedded
firmware of hardware enclosures in stock as of August 31, 2023 were made such that only the new version of these products was sold
subsequent to this date.
On
September 5, 2023, the Board of Directors of Acorn approved a Certificate of Amendment to Acorn’s Restated Certificate of
Incorporation (the “Certificate of Amendment”) that provided for a 1-for-16 reverse stock split of Acorn’s Common
Stock (the “Reverse Stock Split”). Acorn filed the Certificate of Amendment with the Secretary of State of the State of
Delaware on September 6, 2023, and the Reverse Stock Split became effective at 5:00 p.m. EDT on September 7, 2023. The Reverse Stock
Split increased the market price of Acorn’s Common Stock and makes Acorn’s shares accessible to a broader range of
investors, including institutions and those unable to purchase or recommend low-priced stocks. At the effective time of the Reverse
Stock Split, every sixteen issued and outstanding shares of Acorn’s Common Stock were automatically combined into one issued
and outstanding share of Common Stock, without any change in the par value per share. Stockholders who would have otherwise been
entitled to fractional shares of Common Stock as a result of the Reverse Stock Split received a cash payment in lieu of receiving
fractional shares. The value of the fractional shares repurchased was $347 and equated to fifty-eight shares. All share and
per-share amounts of common stock, options and warrants contained in this Management’s Discussion and Analysis have been
restated for all periods to give retroactive effect to the Reverse Stock Split and the related fractional share repurchase for all
prior periods presented.
On November 7, 2023, we entered into a non-exclusive
reseller agreement with one of the nation’s largest commercial generator dealers with regional dealerships throughout the United
States. We believe this agreement could yield 2,500 to 3,000 new monitoring connections per year for OmniMetrix, which could represent
hardware sales, start-up fees and monitoring revenue of $1 million to $2 million per year in the aggregate. Importantly, endpoints added
from this relationship are expected to make a meaningful contribution to the growth of our base of recurring monitoring revenue. We expect
initial revenue from this relationship to start in the first quarter of 2024 and to build as the program is rolled out across their dealer
network.
OVERVIEW
AND TREND INFORMATION
Acorn
Energy, Inc. (“Acorn” or “the Company”) is a holding company focused on technology-driven solutions for energy
infrastructure asset management. We provide the following services and products through our OmniMetrixTM, LLC (“OmniMetrix”)
subsidiary:
| |
● |
Power
Generation (“PG”). OmniMetrix’s PG services provide wireless remote monitoring and control systems and IoT
applications for residential and commercial/industrial power generation equipment. This includes our AIRGuard product, which remotely
monitors and controls industrial air compressors, and our Smart Annunciator product, which is typically sold to commercial customers
that require a visual representation of the generator’s status and has a touchscreen display that indicates the current state
of that generator. |
| |
|
|
| |
● |
Cathodic
Protection (“CP”). OmniMetrix’s CP services provide remote monitoring and control products for cathodic protection
systems on oil and gas pipelines serving the gas utilities market and pipeline operators. The CP product lineup includes solutions
to remotely monitor and control rectifiers, test stations and bonds. OmniMetrix also offers the industry’s first RADTM
(Remote AC Mitigation Disconnect) that mounts onto existing Solid-state Decouplers in the field and can remotely disconnect/connect
these AC mitigation tools, which can drastically reduce a company’s expense while increasing employee safety. |
Each
of our PG and CP activities represents a reportable segment. The following analysis should be read together with the segment and revenue
information provided in Notes 9 and 10 to the unaudited condensed consolidated financial statements included in this quarterly report.
OmniMetrix
OmniMetrix
is a Georgia limited liability company based in Buford, Georgia that develops and markets wireless remote monitoring and control systems
and services for multiple markets in the Internet of Things (“IoT”) ecosystem: critical assets (including stand-by power
generators, pumps, pumpjacks, light towers, turbines, compressors, and other industrial equipment) as well as cathodic protection for
the pipeline industry (gas utilities and pipeline companies). Acorn owns 99% of OmniMetrix with 1% owned by the former CEO of OmniMetrix.
Following
the emergence of machine-to-machine (M2M) and IoT applications, whereby companies aggregate multiple sensors and monitors into a simplified
dashboard for customers, OmniMetrix believes it plays a key role in this new economic ecosystem. In addition, OmniMetrix sees a rapidly
growing need for backup power infrastructure to secure critical military, government, and private sector assets against emergency events
including terrorist attacks, natural disasters, cybersecurity threats, and other issues related to the reliability of the electric power
grid. As residential and industrial standby generators, turbines, compressors, pumps, pumpjacks, light towers and other industrial equipment
are part of the critical infrastructure increasingly becoming monitored in IoT applications and given that OmniMetrix monitors all major
brands of critical equipment, OmniMetrix believes it is well-positioned as a competitive participant in this market.
OmniMetrix
sells monitoring hardware devices and data monitoring services. Prior to the product modification discussed above under Recent Developments,
revenue (and related costs) associated with sale of equipment was recorded to deferred revenue (and deferred charges) upon shipment for
PG and CP monitoring units. This deferred revenue and the deferred cost of the hardware with respect to the sale of new equipment was
recognized over the life of the units, which was estimated to be three years. Revenue from hardware sales subsequent to August 31, 2023
is recognized upon shipment, instead of being deferred, as discussed above under Recent Developments. Revenues from the prepayment of
monitoring fees (generally paid in advance) are initially recorded as deferred revenue upon receipt of payment from the customer and
then amortized to revenue over the monitoring service period (typically twelve-month, renewable periods).
Results
of Operations
The
following table sets forth certain information with respect to the unaudited condensed consolidated results of operations of the Company
for the nine-month periods ended September 30, 2023 and 2022, including the percentage of total revenues during each period attributable
to selected components of the Statements of Operations data and for the period-to-period percentage changes in such components. For segment
data, see Notes 9 and 10 to the unaudited condensed consolidated financial statements included in this quarterly report.
| | |
Nine
months ended September 30, | |
| | |
2023 | |
|
2022 | |
|
Change | |
| | |
($,000) | | |
%
of revenues | |
|
($,000) | | |
%
of revenues | |
|
From
2022 to 2023 | |
| Revenue | |
$ | 5,809 | | |
| 100 | % |
|
$ | 5,155 | | |
| 100 | % |
|
| 13 | % |
| COGS | |
| 1,453 | | |
| 25 | % |
|
| 1,436 | | |
| 28 | % |
|
| 1 | % |
| Gross profit | |
| 4,356 | | |
| 75 | % |
|
| 3,719 | | |
| 72 | % |
|
| 17 | % |
| R&D expense | |
| 614 | | |
| 11 | % |
|
| 637 | | |
| 12 | % |
|
| (4 | )% |
| SG&A expense | |
| 3,746 | | |
| 64 | % |
|
| 3,585 | | |
| 70 | % |
|
| 4 | % |
| Impairment of software | |
| — | | |
| — | % |
|
| 51 | | |
| 1 | % |
|
| (100 | )% |
| Operating loss | |
| (4 | ) | |
| (* | )% |
|
| (554 | ) | |
| (11 | )% |
|
| (99 | )% |
| Interest income (expense),
net | |
| 46 | | |
| 1 | % |
|
| (1 | ) | |
| * | % |
|
| (4700 | )% |
| Income (loss) before income
taxes | |
| 42 | | |
| 1 | % |
|
| (555 | ) | |
| (11 | )% |
|
| (108 | )% |
| Income tax expense | |
| — | | |
| — | |
|
| — | | |
| — | % |
|
| — | |
| Net income (loss) | |
| 42 | | |
| 1 | % |
|
| (555 | ) | |
| (11 | )% |
|
| (108 | )% |
| Less: Non-controlling
interest share of net income | |
| 7 | | |
| * | % |
|
| 1 | | |
| * | % |
|
| 600 | % |
| Net
income (loss) attributable to Acorn Energy, Inc. | |
$ | 35 | | |
| 1 | % |
|
$ | (556 | ) | |
| (11 | )% |
|
| (106 | )% |
*result
is less than 1%.
The
following table sets forth certain information with respect to the unaudited consolidated results of operations of the Company for the
three-month periods ended September 30, 2023 and 2022, including the percentage of total revenues during each period attributable to
selected components of the operations statement data and for the period-to-period percentage changes in such components. For segment
data, see Notes 9 and 10 to the unaudited condensed consolidated financial statements included in this quarterly report.
| | |
Three
months ended September 30, | |
| | |
2023 | |
|
2022 | |
|
Change | |
| | |
($,000) | | |
%
of revenues | |
|
($,000) | | |
%
of revenues | |
|
from
2022 to 2023 | |
| Revenue | |
$ | 2,087 | | |
| 100 | % |
|
$ | 1,783 | | |
| 100 | % |
|
| 17 | % |
| COGS | |
| 537 | | |
| 26 | % |
|
| 568 | | |
| 32 | % |
|
| (5 | )% |
| Gross profit | |
| 1,550 | | |
| 74 | % |
|
| 1,215 | | |
| 68 | % |
|
| 28 | % |
| R&D expense | |
| 212 | | |
| 10 | % |
|
| 227 | | |
| 13 | % |
|
| (7 | )% |
| SG&A expense | |
| 1,330 | | |
| 64 | % |
|
| 1,198 | | |
| 67 | % |
|
| 11 | % |
| Operating income (loss) | |
| 8 | | |
| * | % |
|
| (210 | ) | |
| (12 | )% |
|
| 104 | % |
| Interest income, net | |
| 19 | | |
| 1 | % |
|
| — | | |
| — | % |
|
| 100 | % |
| Income (loss) before income
taxes | |
| 27 | | |
| 1 | % |
|
| (210 | ) | |
| (12 | )% |
|
| (113 | )% |
| Income tax expense | |
| — | | |
| — | % |
|
| — | | |
| — | % |
|
| — | % |
| Net income (loss) | |
| 27 | | |
| 1 | % |
|
| (210 | ) | |
| (12 | )% |
|
| (113 | )% |
| Less: Non-controlling interest share of net
income | |
| 3 | | |
| * | % |
|
| ** | | |
| * | % |
|
| * | % |
| Net income (loss) attributable
to Acorn Energy, Inc. | |
$ | 24 | | |
| 1 | % |
|
$ | (210 | ) | |
| (12 | )% |
|
| (111 | )% |
*result
is less than 1%.
**less
than $1
Revenue
for the nine and three months ended September 30, 2023 and 2022
In
the nine months ended September 30, 2023, revenue increased by $654,000, or 13%, from $5,155,000 in the nine months ended September 30,
2022 to $5,809,000 in the nine months ended September 30, 2023. Hardware revenue increased by $396,000 from $2,241,000 in the nine months
ended September 30, 2022 to $2,637,000 in the nine months ended September 30, 2023. During the
nine months ended September 30, 2023, we recorded $136,000 in revenue from the sale of custom TG Pro units and related accessories that
are designed to large customer specifications and monitored by the customer. We did not have any custom unit orders in the first nine
months ended September 30, 2022. The hardware revenue during the nine months ended September 30, 2023 is further detailed in the table
below:
| | |
Nine
months ended September
30, | | |
Three
months ended September
30, | |
| Reconciliation of Hardware
Revenue | |
2023 | | |
2022 | | |
2023 | | |
2022 | |
| Amortization of deferred revenue | |
$ | 1,821 | | |
$ | 1,658 | | |
$ | 629 | | |
$ | 631 | |
| Sales of custom designed units and related
accessories | |
| 135 | | |
| — | | |
| 43 | | |
| — | |
| Hardware sales (new product versions) | |
| 150 | | |
| — | | |
| 150 | | |
| — | |
| Other accessories, services,
shipping and miscellaneous charges | |
| 531 | | |
| 583 | | |
| 182 | | |
| 194 | |
| Total hardware revenue | |
$ | 2,637 | | |
$ | 2,241 | | |
$ | 1,004 | | |
$ | 825 | |
The
increase in hardware revenue was due to the sale of custom PG units (as noted above) and increased sales of other PG products as
well as from installation income realized, offset by a decrease in revenue from Hero products as sales of CP products were down
period over period. Monitoring revenue increased by $258,000, or 9%, from $2,914,000 in the nine months ended September 30, 2022 to
$3,172,000 in the nine months ended September 30, 2023. The increase in monitoring revenue was due to an increase in the number of
connections being monitored and growth in our customer base.
As
discussed above, OmniMetrix has two reportable segments, PG and CP. Of the $5,809,000 in revenue recognized in the nine months ended
September 30, 2023, $4,994,000 was generated by PG activities and $815,000 was generated by CP activities. This represents an increase
in revenue from PG activities of $659,000, or 15%, from $4,435,000 in the nine months ended September 30, 2022, and a decrease in revenue
from CP activities of $5,000, or 1%, from $820,000 in the nine months ended September 30, 2022. As noted above, the increase in PG revenue
was due to the sale of custom units, an increase in the sale of other PG products and growth in our customer base. Revenue
increased by $304,000, or 17%, from $1,783,000 in the three months ended September 30, 2022 to $2,087,000 in the three months ended September
30, 2023. The increase is due to the same drivers in the nine-month period as previously discussed.
Of
the $2,087,000 in revenue recognized in the three months ended September 30, 2023, $1,798,000 was generated by PG activities and $289,000
was generated by CP activities. As compared to the three months ended September 30, 2022, revenue from PG activities increased $288,000,
or 19%, and revenue from CP activities increased $16,000, or 6%.
Gross
profit for the nine and three months ended September 30, 2023 and 2022
Gross
profit for the nine months ended September 30, 2023 was $4,356,000, reflecting a gross margin of 75%, compared with a gross profit of
$3,719,000, reflecting a gross margin of 72%, for the nine months ended September 30, 2022.
Gross
margin on hardware revenue for the nine months ended September 30, 2023 was 53% compared to 47% for the nine months ended September 30,
2022. Gross margin on monitoring revenue for the nine months ended September 30, 2023 was 93% compared to 91% for the nine months ended
September 30, 2022.
Gross
profit for the three months ended September 30, 2023 was $1,550,000, reflecting a gross margin of 74%, compared with a gross profit for
the three months ended September 30, 2022 of $1,215,000, reflecting a gross margin of 68%. Gross margin on hardware revenue for the three
months ended September 30, 2023 was 54% compared to 43% for the three months ended September 30, 2022. Cost
of sales in the three and nine months ended September 30, 2022 included a write-off of $31,000 in obsolete CP parts inventory which was
the primary reason for lower gross margin during these prior year periods. Gross margin on monitoring revenue for the three months
ended September 30, 2023 was 93% compared to 90% for the three months ended September 30, 2022. The
lower monitoring gross margin in the prior year periods was due to monitoring rebates that were given to two large customers during the
three months ended September 30, 2022.
Operating
expenses for the nine and three months ended September 30, 2023 and 2022
OmniMetrix
R&D expense. During the nine months ended September 30, 2023 and 2022, R&D expense was $614,000 and $637,000, respectively.
During the three months ended September 30, 2023, OmniMetrix recorded $212,000 of R&D expense as compared to $227,000 in the three
months ended September 30, 2022. The decrease in R&D expense in the nine months ended September 30, 2023 of $23,000 is due to a reduction
of R&D hours related to the phased retirement of one of our engineers partially offset by increased engineering consulting expenses.
OmniMetrix
SG&A expense. During the nine months ended September 30, 2023, OmniMetrix recorded SG&A expense of $2,932,000, compared to
SG&A expense of $2,845,000 in the nine months ended September 30, 2022, an increase of $87,000, or 3%. During the three months ended
September 30, 2023, OmniMetrix recorded SG&A expense of $990,000, compared to SG&A expense of $968,000 in the three months ended
September 30, 2022, an increase of $22,000, or 2%. The increase in the nine-month period was primarily
due to an increase of (i) $45,000 in sales commission amortization, (ii) $30,000 in amortization primarily related to IT assets, (iii)
$83,000 in personnel costs, (iv) $5,000 in net aggregate increases in other expense categories, offset by decreases of (v) $66,000 in
technology consulting and software license fees and (vi) $10,000 in travel and trade show expenses.
During
September 2022, we conducted an evaluation of the status of an ERP software customization project that had been initiated in July 2019
and was ongoing. As a result of this evaluation, we elected to terminate this project effective September 30, 2022 and recorded an impairment
against the capitalized investment in this project of $51,000.
Corporate
SG&A expense. Corporate SG&A expense was $814,000 in the nine months ended September 30, 2023, an increase of $74,000, or
10%, from the $740,000 of corporate SG&A expense reported in the nine months ended September 30, 2022. This increase was due to $102,000
in expenses related to the execution of the reverse stock split offset by a decrease of (i) $15,000 in audit fees due to the timing of
when the services were performed as some were performed in the fourth quarter of 2022 versus first quarter of 2023, (ii) $20,000 in stock
compensation expense, (iii) $9,000 in insurance expenses offset by a net increase of (iv) $16,000 in other public company expenses.
Corporate
SG&A expense for the three months ended September 30, 2023 increased $110,000, or 48%, to $340,000 from $230,000 in the three months
ended September 30, 2022 primarily due to $102,000 in expenses related to the execution of the reverse stock split. Third quarter 2023
corporate SG&A expense of $340,000 was higher by $100,000 than second quarter 2023 corporate SG&A expense of $240,000 due to
the expenses related to the execution of the reverse stock split which were incurred in the third quarter of 2023. We expect the quarterly
corporate overhead to increase in future quarters due to increased audit fees and board fees in addition to costs that may be required
to support the growth of our OmniMetrix subsidiary.
Net
income (loss) attributable to Acorn Energy. We recognized net income attributable to Acorn stockholders of $35,000 in the nine months
ended September 30, 2023, compared to net loss attributable to Acorn stockholders of $556,000 in the nine months ended September 30,
2022. Our net income during the nine months ended September 30, 2023 is comprised of net income at OmniMetrix of $856,000 offset by corporate
expenses of $814,000 and the non-controlling interest share of our income from OmniMetrix of $7,000. Our net loss during the nine months
ended September 30, 2022 is comprised of net income at OmniMetrix of $52,000 offset by corporate expenses, including net interest expense,
of $607,000 and the non-controlling interest share of our income from OmniMetrix of $1,000.
For
the three months ended September 30, 2023, we recognized net income attributable to Acorn stockholders of $24,000, compared to a net
loss attributable to Acorn stockholders of $210,000 for the three months ended September 30, 2022. Our net income during the three months
ended September 30, 2023 is comprised of net income at OmniMetrix of $366,000 offset by corporate expenses of $339,000 and the non-controlling
interest share of our income from OmniMetrix of $3,000. Our net loss in the three months ended September 30, 2022 is comprised of net
income at OmniMetrix of $19,000 offset by corporate expenses of $229,000. The non-controlling interest share of OmniMetrix during this
period was less than $1,000 and rounded to zero.
Liquidity
and Capital Resources
At
September 30, 2023, we had negative working capital of $513,000. Our working capital includes $1,749,000 of cash and deferred revenue
of $4,270,000. The deferred revenue does not require a significant cash outlay for the revenue to be recognized.
During
the nine months ended September 30, 2023, our OmniMetrix subsidiary provided $1,098,000 from operations while our corporate headquarters
used $732,000 during the same period.
During
the nine months ended September 30, 2023, we invested $72,000 in technology and other capital projects and received proceeds of $5,000
from financing activities related to the exercise of warrants.
Other
Liquidity Matters
OmniMetrix
owes Acorn $2,928,000 for loans, accrued interest and expenses advanced to it by Acorn. OmniMetrix made repayments to Acorn of
$961,000 in the nine months ended September 30, 2023 offset by interest, dividends and other advances of $212,000 in the aggregate. The intercompany balances are eliminated in consolidation.
As
of November 7, 2023, we had cash of $1,684,000. We believe that such cash, plus the cash generated from operations, will provide
sufficient liquidity to finance the operating activities of Acorn and OmniMetrix at their current level of operations for the twelve
months from the issuance of these unaudited condensed consolidated financial statements. We may, at some point, elect to obtain a new
line of credit or other source of financing to fund additional investments in the business.
Contractual
Obligations and Commitments
The
table below provides information concerning obligations under certain categories of our contractual obligations as of September 30, 2023.
CASH
PAYMENTS DUE TO CONTRACTUAL OBLIGATIONS
| | |
Twelve
Month Periods Ending September 30, (in thousands) | |
| | |
Total | | |
2024 | | |
2025-2026 | | |
2027-2028 | | |
2029
and thereafter | |
| Software agreements | |
$ | 8 | | |
$ | 8 | | |
$ | — | | |
$ | — | | |
$ | — | |
| Operating leases* | |
| 261 | | |
| 130 | | |
| 131 | | |
| — | | |
| — | |
| Contractual services | |
| 7 | | |
| 7 | | |
| — | | |
| — | | |
| — | |
| Purchase commitments** | |
| 603 | | |
| 603 | | |
| — | | |
| — | | |
| — | |
| Total contractual cash
obligations | |
$ | 879 | | |
$ | 748 | | |
$ | 131 | | |
$ | — | | |
$ | — | |
*Reflects
the gross amount of the operating lease liabilities. Does not include rent amounts to be received under the sublease and it is gross
of the imputed interest of $11,000.
**Reflects
open purchase orders for components/parts to be delivered over the next twelve months as sales forecast requires.
| ITEM
3. |
QUANTITATIVE
AND QUALITATIVE DISCLOSURE ABOUT MARKET RISK |
Concentrations
of Credit Risk
Financial
instruments, which potentially subject the Company to concentrations of credit risk, consist principally of cash and trade accounts receivable.
The Company’s cash was deposited with a U.S. bank and amounted to $1,749,000 at September 30, 2023. The Company does not believe
there is a significant risk of non-performance by its counterparties. For the three-month period ended September 30, 2023, there were
no customers that represented greater than 10% of the Company’s total invoiced sales. For the nine-month period ended September
30, 2023, there was one customer that represented 11% of the Company’s total invoiced sales. At September 30, 2023, the Company
did not have any customers that represented greater than 10% of our total accounts receivable. Approximately 12% of the accounts receivable
at December 31, 2022 was due from one customer which was subsequently collected in full. Credit risk with respect to the balance of trade
receivables is generally diversified due to the number of entities comprising the Company’s customer base. Although we do not believe
there is significant risk of non-performance by these counterparties, any failures or defaults on their part could negatively impact
the value of our financial instruments and could have a material adverse effect on our business, operations or financial condition.
Fair
Value of Financial Instruments
Fair
values of financial instruments included in current assets and current liabilities are estimated to approximate their book values due
to the short maturity of such investments.
| ITEM
4. |
CONTROLS
AND PROCEDURES |
As
of the end of the period covered by this report, we carried out an evaluation, under the supervision and with the participation of our
management, including the Chief Executive Officer and the Chief Financial Officer, of the design and operation of our disclosure controls
and procedures (as such term is defined in Rule 13a-15(e) under the Securities Exchange Act of 1934, as amended (the “Exchange
Act”)). Based on this evaluation, our Chief Executive Officer and Chief Financial Officer concluded that our disclosure controls
and procedures were not effective due to material weaknesses noted in our Annual Report on Form 10-K for the year ended December 31,
2022, to ensure that the information required to be disclosed by us in the reports we file or submit under the Exchange Act is (i) accumulated
and communicated to our management (including our Chief Executive Officer and Chief Financial Officer) in a timely manner, and (ii) recorded,
processed, summarized and reported within the time periods specified in the SEC’s rules and forms.
As
noted in our Annual Report on Form 10-K for the year ended December 31, 2022, we employ a decentralized internal control methodology,
coupled with management’s oversight, whereby our OmniMetrix subsidiary is responsible for mitigating its risks to financial reporting
by implementing and maintaining effective control policies and procedures and subsequently translating that respective risk mitigation
up and through to the parent level and to our external financial statements. In addition, as our operating subsidiary is not large enough
to effectively mitigate certain risks by segregating incompatible duties, management must employ compensating mechanisms throughout our
company in a manner that is feasible within the constraints in which it operates.
The
material weaknesses management identified were caused by an insufficient complement of resources at our OmniMetrix subsidiary and limited
ERP system capabilities, such that individual control policies and procedures at the subsidiary could not be implemented, maintained,
or remediated when and where necessary. As a result, a majority of the significant process areas management identified for our OmniMetrix
subsidiary had one or more material weaknesses present. This condition was further exacerbated as the Company could not demonstrate that
each of the principles described within the Committee of Sponsoring Organizations of the Treadway Commission’s document entitled
“Internal Control - Integrated Framework (2013)” were present and functioning.
Changes
in Internal Control Over Financial Reporting
There
was no change in our internal control over financial reporting (as such term is defined in Rule 13a-15(f) under the Exchange Act) during
the period covered by this report that has materially affected, or is reasonably likely to materially affect, our internal control over
financial reporting.
PART
II
SIGNATURES
Pursuant
to the requirements of the Securities Exchange Act of 1934, the Registrant has duly caused this report to be signed on its behalf by
its principal financial officer thereunto duly authorized.
| |
ACORN
ENERGY, INC. |
| |
|
|
| Dated:
November 9, 2023 |
|
|
| |
|
|
| |
By:
|
/s/
TRACY S. CLIFFORD |
| |
|
Tracy
S. Clifford |
| |
|
Chief
Financial Officer |
Exhibit 3.1


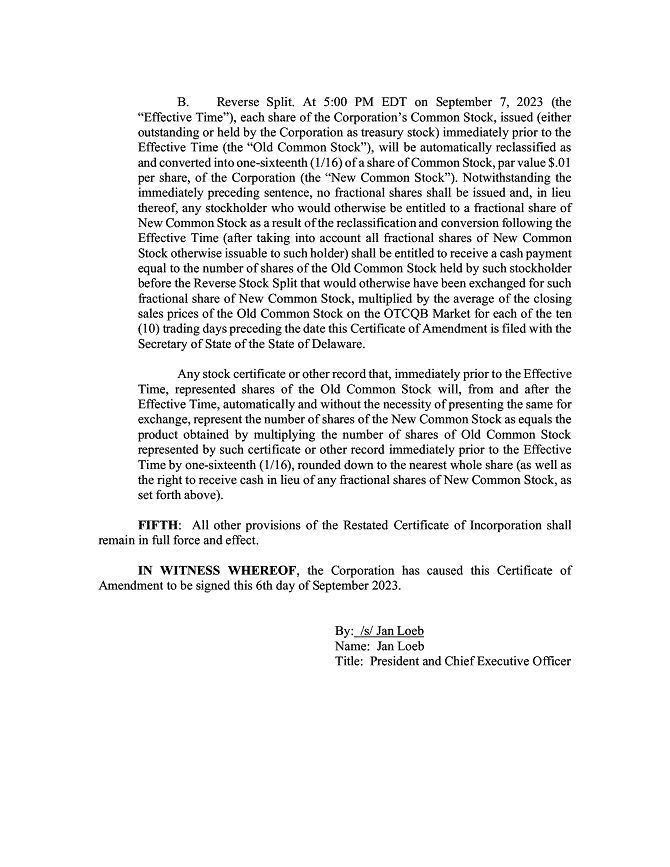
Exhibit 3.2


Exhibit
31.1
I,
Jan H. Loeb, the Chief Executive Officer of Acorn Energy, Inc., certify that:
| |
1. |
I have reviewed this report
on Form 10-Q of Acorn Energy, Inc.; |
| |
|
|
| |
2. |
Based on my knowledge,
this report does not contain any untrue statement of a material fact or omit to state a material fact necessary to make the statements
made, in light of the circumstances under which such statements were made, not misleading with respect to the period covered by this
report; |
| |
|
|
| |
3. |
Based on my knowledge,
the financial statements, and other financial information included in this report, fairly present in all material respects the financial
condition, results of operations and cash flows of the registrant as of, and for, the periods presented in this report; |
| |
|
|
| |
4. |
The registrant’s
other certifying officer and I are responsible for establishing and maintaining disclosure controls and procedures (as defined in
Exchange Act Rules 13a-15(e) and 15d-15(e)) and internal control over financial reporting (as defined in Exchange Act Rules 13a-15(f)
and 15d-15(f)) for the registrant and have: |
| |
(a) |
Designed such disclosure
controls and procedures, or caused such disclosure controls and procedures to be designed under our supervision, to ensure that material
information relating to the registrant, including its consolidated subsidiaries, is made known to us by others within those entities,
particularly during the period in which this report is being prepared; |
| |
|
|
| |
(b) |
Designed such internal
control over financial reporting, or caused such internal control over financial reporting to be designed under our supervision,
to provide reasonable assurance regarding the reliability of financial reporting and the preparation of financial statements for
external purposes in accordance with generally accepted accounting principles; |
| |
|
|
| |
(c) |
Evaluated the effectiveness
of the registrant’s disclosure controls and procedures and presented in this report our conclusions about the effectiveness
of the disclosure controls and procedures, as of the end of the period covered by this report based on such evaluation; and |
| |
|
|
| |
(d) |
Disclosed in this report
any change in the registrant’s internal control over financial reporting that occurred during the registrant’s most recent
fiscal quarter (the registrant’s fourth fiscal quarter in the case of an annual report) that has materially affected, or is
reasonably likely to materially affect, the registrant’s internal control over financial reporting; and |
| |
5. |
The registrant’s
other certifying officer and I have disclosed, based on our most recent evaluation of internal control over financial reporting,
to the registrant’s auditors and the audit committee of the registrant’s board of directors (or persons performing the
equivalent functions): |
| |
(a) |
All significant deficiencies
and material weaknesses in the design or operation of internal control over financial reporting which are reasonably likely to adversely
affect the registrant’s ability to record, process, summarize and report financial information; and |
| |
|
|
| |
(b) |
Any fraud, whether or not
material, that involves management or other employees who have a significant role in the registrant’s internal control over
financial reporting. |
Dated:
November 9, 2023
| By: |
/s/
JAN H. LOEB |
|
| |
Jan H. Loeb |
|
| |
Chief Executive Officer |
|
Exhibit
31.2
I,
Tracy S. Clifford, the Chief Financial Officer of Acorn Energy, Inc., certify that:
| |
1. |
I have reviewed this report
on Form 10-Q of Acorn Energy, Inc.; |
| |
|
|
| |
2. |
Based on my knowledge,
this report does not contain any untrue statement of a material fact or omit to state a material fact necessary to make the statements
made, in light of the circumstances under which such statements were made, not misleading with respect to the period covered by this
report; |
| |
|
|
| |
3. |
Based on my knowledge,
the financial statements, and other financial information included in this report, fairly present in all material respects the financial
condition, results of operations and cash flows of the registrant as of, and for, the periods presented in this report; |
| |
|
|
| |
4. |
The registrant’s
other certifying officer and I are responsible for establishing and maintaining disclosure controls and procedures (as defined in
Exchange Act Rules 13a-15(e) and 15d-15(e)) and internal control over financial reporting (as defined in Exchange Act Rules 13a-15(f)
and 15d-15(f)) for the registrant and have: |
| |
(a) |
Designed such disclosure
controls and procedures, or caused such disclosure controls and procedures to be designed under our supervision, to ensure that material
information relating to the registrant, including its consolidated subsidiaries, is made known to us by others within those entities,
particularly during the period in which this report is being prepared; |
| |
|
|
| |
(b) |
Designed such internal
control over financial reporting, or caused such internal control over financial reporting to be designed under our supervision,
to provide reasonable assurance regarding the reliability of financial reporting and the preparation of financial statements for
external purposes in accordance with generally accepted accounting principles; |
| |
|
|
| |
(c) |
Evaluated the effectiveness
of the registrant’s disclosure controls and procedures and presented in this report our conclusions about the effectiveness
of the disclosure controls and procedures, as of the end of the period covered by this report based on such evaluation; and |
| |
|
|
| |
(d) |
Disclosed in this report
any change in the registrant’s internal control over financial reporting that occurred during the registrant’s most recent
fiscal quarter (the registrant’s fourth fiscal quarter in the case of an annual report) that has materially affected, or is
reasonably likely to materially affect, the registrant’s internal control over financial reporting; and |
| |
5. |
The registrant’s
other certifying officer and I have disclosed, based on our most recent evaluation of internal control over financial reporting,
to the registrant’s auditors and the audit committee of the registrant’s board of directors (or persons performing the
equivalent functions): |
| |
(a) |
All significant deficiencies
and material weaknesses in the design or operation of internal control over financial reporting which are reasonably likely to adversely
affect the registrant’s ability to record, process, summarize and report financial information; and |
| |
|
|
| |
(b) |
Any fraud, whether or not
material, that involves management or other employees who have a significant role in the registrant’s internal control over
financial reporting. |
Dated:
November 9, 2023
| By: |
/s/
TRACY S. CLIFFORD |
|
| |
Tracy S. Clifford |
|
| |
Chief Financial Officer |
|
Exhibit
32.1
CERTIFICATION
PURSUANT TO
18
U.S.C. SECTION 1350,
AS
ADOPTED PURSUANT TO
SECTION
906 OF THE SARBANES-OXLEY ACT OF 2002
In
connection with the Quarterly Report on Form 10-Q of Acorn Energy, Inc. (the “Company”) for the quarterly period ended September
30, 2023, as filed with the Securities and Exchange Commission on the date hereof (the “Report”), I, Jan H. Loeb, Chief Executive
Officer of the Company, hereby certify, pursuant to 18 U.S.C. § 1350, as adopted pursuant to § 906 of the Sarbanes-Oxley Act
of 2002, that:
| (1) |
The Report fully complies
with the requirements of section 13(a) or 15(d) of the Securities Exchange Act of 1934; and |
| |
|
| (2) |
The information contained
in the Report fairly presents, in all material respects, the financial condition and result of operations of the Company. |
| /s/
Jan H. Loeb |
|
| Jan H. Loeb |
|
| Chief Executive Officer |
|
| November 9, 2023 |
|
Exhibit
32.2
CERTIFICATION
PURSUANT TO
18
U.S.C. SECTION 1350,
AS
ADOPTED PURSUANT TO
SECTION
906 OF THE SARBANES-OXLEY ACT OF 2002
In
connection with the Quarterly Report on Form 10-Q of Acorn Energy, Inc. (the “Company”) for the quarterly period ended September
30, 2023, as filed with the Securities and Exchange Commission on the date hereof (the “Report”), I, Tracy S. Clifford, Chief
Financial Officer of the Company, hereby certify, pursuant to 18 U.S.C. § 1350, as adopted pursuant to § 906 of the Sarbanes-Oxley
Act of 2002, that:
| (1) |
The Report fully complies
with the requirements of section 13(a) or 15(d) of the Securities Exchange Act of 1934; and |
| |
|
| (2) |
The information contained
in the Report fairly presents, in all material respects, the financial condition and result of operations of the Company. |
| /s/
Tracy S. Clifford |
|
| Tracy S. Clifford |
|
| Chief Financial Officer |
|
| November 9, 2023 |
|
v3.23.3
Cover - shares
|
9 Months Ended |
|
Sep. 30, 2023 |
Nov. 07, 2023 |
| Cover [Abstract] |
|
|
| Document Type |
10-Q
|
|
| Amendment Flag |
false
|
|
| Document Quarterly Report |
true
|
|
| Document Transition Report |
false
|
|
| Document Period End Date |
Sep. 30, 2023
|
|
| Document Fiscal Period Focus |
Q3
|
|
| Document Fiscal Year Focus |
2023
|
|
| Current Fiscal Year End Date |
--12-31
|
|
| Entity File Number |
001-33886
|
|
| Entity Registrant Name |
ACORN
ENERGY, INC.
|
|
| Entity Central Index Key |
0000880984
|
|
| Entity Tax Identification Number |
22-2786081
|
|
| Entity Incorporation, State or Country Code |
DE
|
|
| Entity Address, Address Line One |
1000
N West Street
|
|
| Entity Address, Address Line Two |
Suite 1200
|
|
| Entity Address, City or Town |
Wilmington
|
|
| Entity Address, State or Province |
DE
|
|
| Entity Address, Postal Zip Code |
19801
|
|
| City Area Code |
410
|
|
| Local Phone Number |
654-3315
|
|
| Entity Current Reporting Status |
Yes
|
|
| Entity Interactive Data Current |
Yes
|
|
| Entity Filer Category |
Non-accelerated Filer
|
|
| Entity Small Business |
true
|
|
| Entity Emerging Growth Company |
false
|
|
| Entity Shell Company |
false
|
|
| Entity Common Stock, Shares Outstanding |
|
2,484,791
|
| X |
- DefinitionBoolean flag that is true when the XBRL content amends previously-filed or accepted submission.
| Name: |
dei_AmendmentFlag |
| Namespace Prefix: |
dei_ |
| Data Type: |
xbrli:booleanItemType |
| Balance Type: |
na |
| Period Type: |
duration |
|
| X |
- DefinitionEnd date of current fiscal year in the format --MM-DD.
| Name: |
dei_CurrentFiscalYearEndDate |
| Namespace Prefix: |
dei_ |
| Data Type: |
xbrli:gMonthDayItemType |
| Balance Type: |
na |
| Period Type: |
duration |
|
| X |
- DefinitionFiscal period values are FY, Q1, Q2, and Q3. 1st, 2nd and 3rd quarter 10-Q or 10-QT statements have value Q1, Q2, and Q3 respectively, with 10-K, 10-KT or other fiscal year statements having FY.
| Name: |
dei_DocumentFiscalPeriodFocus |
| Namespace Prefix: |
dei_ |
| Data Type: |
dei:fiscalPeriodItemType |
| Balance Type: |
na |
| Period Type: |
duration |
|
| X |
- DefinitionThis is focus fiscal year of the document report in YYYY format. For a 2006 annual report, which may also provide financial information from prior periods, fiscal 2006 should be given as the fiscal year focus. Example: 2006.
| Name: |
dei_DocumentFiscalYearFocus |
| Namespace Prefix: |
dei_ |
| Data Type: |
xbrli:gYearItemType |
| Balance Type: |
na |
| Period Type: |
duration |
|
| X |
- DefinitionFor the EDGAR submission types of Form 8-K: the date of the report, the date of the earliest event reported; for the EDGAR submission types of Form N-1A: the filing date; for all other submission types: the end of the reporting or transition period. The format of the date is YYYY-MM-DD.
| Name: |
dei_DocumentPeriodEndDate |
| Namespace Prefix: |
dei_ |
| Data Type: |
xbrli:dateItemType |
| Balance Type: |
na |
| Period Type: |
duration |
|
| X |
- DefinitionBoolean flag that is true only for a form used as an quarterly report. Reference 1: http://www.xbrl.org/2003/role/presentationRef
-Publisher SEC
-Name Form 10-Q
-Number 240
-Section 308
-Subsection a
| Name: |
dei_DocumentQuarterlyReport |
| Namespace Prefix: |
dei_ |
| Data Type: |
xbrli:booleanItemType |
| Balance Type: |
na |
| Period Type: |
duration |
|
| X |
- DefinitionBoolean flag that is true only for a form used as a transition report. Reference 1: http://www.xbrl.org/2003/role/presentationRef
-Publisher SEC
-Name Forms 10-K, 10-Q, 20-F
-Number 240
-Section 13
-Subsection a-1
| Name: |
dei_DocumentTransitionReport |
| Namespace Prefix: |
dei_ |
| Data Type: |
xbrli:booleanItemType |
| Balance Type: |
na |
| Period Type: |
duration |
|
| X |
- DefinitionThe type of document being provided (such as 10-K, 10-Q, 485BPOS, etc). The document type is limited to the same value as the supporting SEC submission type, or the word 'Other'.
| Name: |
dei_DocumentType |
| Namespace Prefix: |
dei_ |
| Data Type: |
dei:submissionTypeItemType |
| Balance Type: |
na |
| Period Type: |
duration |
|
| X |
- DefinitionAddress Line 1 such as Attn, Building Name, Street Name
| Name: |
dei_EntityAddressAddressLine1 |
| Namespace Prefix: |
dei_ |
| Data Type: |
xbrli:normalizedStringItemType |
| Balance Type: |
na |
| Period Type: |
duration |
|
| X |
- DefinitionAddress Line 2 such as Street or Suite number
| Name: |
dei_EntityAddressAddressLine2 |
| Namespace Prefix: |
dei_ |
| Data Type: |
xbrli:normalizedStringItemType |
| Balance Type: |
na |
| Period Type: |
duration |
|
| X |
- Definition
+ References
+ Details
| Name: |
dei_EntityAddressCityOrTown |
| Namespace Prefix: |
dei_ |
| Data Type: |
xbrli:normalizedStringItemType |
| Balance Type: |
na |
| Period Type: |
duration |
|
| X |
- DefinitionCode for the postal or zip code
| Name: |
dei_EntityAddressPostalZipCode |
| Namespace Prefix: |
dei_ |
| Data Type: |
xbrli:normalizedStringItemType |
| Balance Type: |
na |
| Period Type: |
duration |
|
| X |
- DefinitionName of the state or province.
| Name: |
dei_EntityAddressStateOrProvince |
| Namespace Prefix: |
dei_ |
| Data Type: |
dei:stateOrProvinceItemType |
| Balance Type: |
na |
| Period Type: |
duration |
|
| X |
- DefinitionA unique 10-digit SEC-issued value to identify entities that have filed disclosures with the SEC. It is commonly abbreviated as CIK. Reference 1: http://www.xbrl.org/2003/role/presentationRef
-Publisher SEC
-Name Exchange Act
-Number 240
-Section 12
-Subsection b-2
| Name: |
dei_EntityCentralIndexKey |
| Namespace Prefix: |
dei_ |
| Data Type: |
dei:centralIndexKeyItemType |
| Balance Type: |
na |
| Period Type: |
duration |
|
| X |
- DefinitionIndicate number of shares or other units outstanding of each of registrant's classes of capital or common stock or other ownership interests, if and as stated on cover of related periodic report. Where multiple classes or units exist define each class/interest by adding class of stock items such as Common Class A [Member], Common Class B [Member] or Partnership Interest [Member] onto the Instrument [Domain] of the Entity Listings, Instrument.
| Name: |
dei_EntityCommonStockSharesOutstanding |
| Namespace Prefix: |
dei_ |
| Data Type: |
xbrli:sharesItemType |
| Balance Type: |
na |
| Period Type: |
instant |
|
| X |
- DefinitionIndicate 'Yes' or 'No' whether registrants (1) have filed all reports required to be filed by Section 13 or 15(d) of the Securities Exchange Act of 1934 during the preceding 12 months (or for such shorter period that registrants were required to file such reports), and (2) have been subject to such filing requirements for the past 90 days. This information should be based on the registrant's current or most recent filing containing the related disclosure.
| Name: |
dei_EntityCurrentReportingStatus |
| Namespace Prefix: |
dei_ |
| Data Type: |
dei:yesNoItemType |
| Balance Type: |
na |
| Period Type: |
duration |
|
| X |
- DefinitionIndicate if registrant meets the emerging growth company criteria. Reference 1: http://www.xbrl.org/2003/role/presentationRef
-Publisher SEC
-Name Exchange Act
-Number 240
-Section 12
-Subsection b-2
| Name: |
dei_EntityEmergingGrowthCompany |
| Namespace Prefix: |
dei_ |
| Data Type: |
xbrli:booleanItemType |
| Balance Type: |
na |
| Period Type: |
duration |
|
| X |
- DefinitionCommission file number. The field allows up to 17 characters. The prefix may contain 1-3 digits, the sequence number may contain 1-8 digits, the optional suffix may contain 1-4 characters, and the fields are separated with a hyphen.
| Name: |
dei_EntityFileNumber |
| Namespace Prefix: |
dei_ |
| Data Type: |
dei:fileNumberItemType |
| Balance Type: |
na |
| Period Type: |
duration |
|
| X |
- DefinitionIndicate whether the registrant is one of the following: Large Accelerated Filer, Accelerated Filer, Non-accelerated Filer. Definitions of these categories are stated in Rule 12b-2 of the Exchange Act. This information should be based on the registrant's current or most recent filing containing the related disclosure. Reference 1: http://www.xbrl.org/2003/role/presentationRef
-Publisher SEC
-Name Exchange Act
-Number 240
-Section 12
-Subsection b-2
| Name: |
dei_EntityFilerCategory |
| Namespace Prefix: |
dei_ |
| Data Type: |
dei:filerCategoryItemType |
| Balance Type: |
na |
| Period Type: |
duration |
|
| X |
- DefinitionTwo-character EDGAR code representing the state or country of incorporation.
| Name: |
dei_EntityIncorporationStateCountryCode |
| Namespace Prefix: |
dei_ |
| Data Type: |
dei:edgarStateCountryItemType |
| Balance Type: |
na |
| Period Type: |
duration |
|
| X |
- DefinitionBoolean flag that is true when the registrant has submitted electronically every Interactive Data File required to be submitted pursuant to Rule 405 of Regulation S-T during the preceding 12 months (or for such shorter period that the registrant was required to submit such files). Reference 1: http://www.xbrl.org/2003/role/presentationRef
-Publisher SEC
-Name Regulation S-T
-Number 232
-Section 405
| Name: |
dei_EntityInteractiveDataCurrent |
| Namespace Prefix: |
dei_ |
| Data Type: |
dei:yesNoItemType |
| Balance Type: |
na |
| Period Type: |
duration |
|
| X |
- DefinitionThe exact name of the entity filing the report as specified in its charter, which is required by forms filed with the SEC. Reference 1: http://www.xbrl.org/2003/role/presentationRef
-Publisher SEC
-Name Exchange Act
-Number 240
-Section 12
-Subsection b-2
| Name: |
dei_EntityRegistrantName |
| Namespace Prefix: |
dei_ |
| Data Type: |
xbrli:normalizedStringItemType |
| Balance Type: |
na |
| Period Type: |
duration |
|
| X |
- DefinitionBoolean flag that is true when the registrant is a shell company as defined in Rule 12b-2 of the Exchange Act. Reference 1: http://www.xbrl.org/2003/role/presentationRef
-Publisher SEC
-Name Exchange Act
-Number 240
-Section 12
-Subsection b-2
| Name: |
dei_EntityShellCompany |
| Namespace Prefix: |
dei_ |
| Data Type: |
xbrli:booleanItemType |
| Balance Type: |
na |
| Period Type: |
duration |
|
| X |
- DefinitionIndicates that the company is a Smaller Reporting Company (SRC). Reference 1: http://www.xbrl.org/2003/role/presentationRef
-Publisher SEC
-Name Exchange Act
-Number 240
-Section 12
-Subsection b-2
| Name: |
dei_EntitySmallBusiness |
| Namespace Prefix: |
dei_ |
| Data Type: |
xbrli:booleanItemType |
| Balance Type: |
na |
| Period Type: |
duration |
|
| X |
- DefinitionThe Tax Identification Number (TIN), also known as an Employer Identification Number (EIN), is a unique 9-digit value assigned by the IRS. Reference 1: http://www.xbrl.org/2003/role/presentationRef
-Publisher SEC
-Name Exchange Act
-Number 240
-Section 12
-Subsection b-2
| Name: |
dei_EntityTaxIdentificationNumber |
| Namespace Prefix: |
dei_ |
| Data Type: |
dei:employerIdItemType |
| Balance Type: |
na |
| Period Type: |
duration |
|
| X |
- DefinitionLocal phone number for entity.
| Name: |
dei_LocalPhoneNumber |
| Namespace Prefix: |
dei_ |
| Data Type: |
xbrli:normalizedStringItemType |
| Balance Type: |
na |
| Period Type: |
duration |
|
v3.23.3
Condensed Consolidated Balance Sheets - USD ($)
$ in Thousands |
Sep. 30, 2023 |
Dec. 31, 2022 |
| Current assets: |
|
|
|
| Cash |
|
$ 1,749
|
$ 1,450
|
| Accounts receivable, net |
|
583
|
597
|
| Inventory, net |
|
909
|
789
|
| Deferred cost of goods sold (COGS) |
|
890
|
887
|
| Other current assets |
|
343
|
288
|
| Total current assets |
|
4,474
|
4,011
|
| Property and equipment, net |
|
610
|
653
|
| Operating right-of-use assets, net |
|
220
|
298
|
| Deferred COGS |
|
642
|
807
|
| Other assets |
|
209
|
215
|
| Total assets |
|
6,155
|
5,984
|
| Current liabilities: |
|
|
|
| Accounts payable |
|
444
|
243
|
| Accrued expenses |
|
127
|
171
|
| Deferred revenue |
|
4,270
|
3,984
|
| Operating lease liabilities |
|
121
|
116
|
| Other current liabilities |
|
25
|
58
|
| Total current liabilities |
|
4,987
|
4,572
|
| Long-term liabilities: |
|
|
|
| Deferred revenue |
|
1,941
|
2,187
|
| Operating lease liabilities |
|
129
|
220
|
| Other long-term liabilities |
|
19
|
16
|
| Total long-term liabilities |
|
2,089
|
2,423
|
| Commitments and contingencies (Note 7) |
|
|
|
| Acorn Energy, Inc. stockholders |
|
|
|
| Common stock - $0.01 par value per share: Authorized – 42,000,000 shares; issued and outstanding – 2,484,791 and 2,482,604 shares at September 30, 2023 and December 31, 2022, respectively |
[1] |
25
|
25
|
| Additional paid-in capital |
[1] |
103,312
|
103,261
|
| Accumulated stockholders’ deficit |
|
(101,232)
|
(101,267)
|
| Treasury stock, at cost – 50,178 and 50,178 shares at September 30, 2023 and December 31, 2022 |
[1] |
(3,036)
|
(3,036)
|
| Total Acorn Energy, Inc. stockholders’ deficit |
|
(931)
|
(1,017)
|
| Non-controlling interest |
|
10
|
6
|
| Total stockholders’ deficit |
|
(921)
|
(1,011)
|
| Total liabilities and stockholders’ deficit |
|
$ 6,155
|
$ 5,984
|
|
|
| X |
- DefinitionCarrying value as of the balance sheet date of liabilities incurred (and for which invoices have typically been received) and payable to vendors for goods and services received that are used in an entity's business. Used to reflect the current portion of the liabilities (due within one year or within the normal operating cycle if longer). Reference 1: http://www.xbrl.org/2003/role/exampleRef
-Topic 852
-SubTopic 10
-Name Accounting Standards Codification
-Section 55
-Paragraph 10
-Publisher FASB
-URI https://asc.fasb.org//1943274/2147481372/852-10-55-10
Reference 2: http://fasb.org/us-gaap/role/ref/legacyRef
-Name Accounting Standards Codification
-Topic 210
-SubTopic 10
-Section S99
-Paragraph 1
-Subparagraph (SX 210.5-02.19(a))
-Publisher FASB
-URI https://asc.fasb.org//1943274/2147480566/210-10-S99-1
| Name: |
us-gaap_AccountsPayableCurrent |
| Namespace Prefix: |
us-gaap_ |
| Data Type: |
xbrli:monetaryItemType |
| Balance Type: |
credit |
| Period Type: |
instant |
|
| X |
- DefinitionAmount, after allowance for credit loss, of right to consideration from customer for product sold and service rendered in normal course of business, classified as current. Reference 1: http://www.xbrl.org/2003/role/disclosureRef
-Topic 310
-SubTopic 10
-Name Accounting Standards Codification
-Section 45
-Paragraph 2
-Publisher FASB
-URI https://asc.fasb.org//1943274/2147481990/310-10-45-2
Reference 2: http://www.xbrl.org/2003/role/disclosureRef
-Topic 310
-SubTopic 10
-Name Accounting Standards Codification
-Section 45
-Paragraph 9
-Publisher FASB
-URI https://asc.fasb.org//1943274/2147481990/310-10-45-9
| Name: |
us-gaap_AccountsReceivableNetCurrent |
| Namespace Prefix: |
us-gaap_ |
| Data Type: |
xbrli:monetaryItemType |
| Balance Type: |
debit |
| Period Type: |
instant |
|
| X |
- DefinitionCarrying value as of the balance sheet date of obligations incurred and payable, pertaining to costs that are statutory in nature, are incurred on contractual obligations, or accumulate over time and for which invoices have not yet been received or will not be rendered. Examples include taxes, interest, rent and utilities. Used to reflect the current portion of the liabilities (due within one year or within the normal operating cycle if longer). Reference 1: http://fasb.org/us-gaap/role/ref/legacyRef
-Name Accounting Standards Codification
-Topic 210
-SubTopic 10
-Section S99
-Paragraph 1
-Subparagraph (SX 210.5-02.20)
-Publisher FASB
-URI https://asc.fasb.org//1943274/2147480566/210-10-S99-1
| Name: |
us-gaap_AccruedLiabilitiesCurrent |
| Namespace Prefix: |
us-gaap_ |
| Data Type: |
xbrli:monetaryItemType |
| Balance Type: |
credit |
| Period Type: |
instant |
|
| X |
- DefinitionValue received from shareholders in common stock-related transactions that are in excess of par value or stated value and amounts received from other stock-related transactions. Includes only common stock transactions (excludes preferred stock transactions). May be called contributed capital, capital in excess of par, capital surplus, or paid-in capital. Reference 1: http://fasb.org/us-gaap/role/ref/legacyRef
-Topic 210
-SubTopic 10
-Name Accounting Standards Codification
-Section S99
-Paragraph 1
-Subparagraph (SX 210.5-02(30)(a)(1))
-Publisher FASB
-URI https://asc.fasb.org//1943274/2147480566/210-10-S99-1
| Name: |
us-gaap_AdditionalPaidInCapitalCommonStock |
| Namespace Prefix: |
us-gaap_ |
| Data Type: |
xbrli:monetaryItemType |
| Balance Type: |
credit |
| Period Type: |
instant |
|
| X |
- DefinitionSum of the carrying amounts as of the balance sheet date of all assets that are recognized. Assets are probable future economic benefits obtained or controlled by an entity as a result of past transactions or events. Reference 1: http://www.xbrl.org/2003/role/disclosureRef
-Topic 810
-SubTopic 10
-Name Accounting Standards Codification
-Section 50
-Paragraph 3
-Subparagraph (bb)
-Publisher FASB
-URI https://asc.fasb.org//1943274/2147481203/810-10-50-3
Reference 2: http://www.xbrl.org/2003/role/disclosureRef
-Topic 810
-SubTopic 10
-Name Accounting Standards Codification
-Section 45
-Paragraph 25
-Subparagraph (a)
-Publisher FASB
-URI https://asc.fasb.org//1943274/2147481231/810-10-45-25
Reference 3: http://www.xbrl.org/2003/role/disclosureRef
-Topic 235
-SubTopic 10
-Name Accounting Standards Codification
-Section S99
-Paragraph 1
-Subparagraph (SX 210.4-08(g)(1)(ii))
-Publisher FASB
-URI https://asc.fasb.org//1943274/2147480678/235-10-S99-1
Reference 4: http://www.xbrl.org/2003/role/disclosureRef
-Topic 323
-SubTopic 10
-Name Accounting Standards Codification
-Section 50
-Paragraph 3
-Subparagraph (c)
-Publisher FASB
-URI https://asc.fasb.org//1943274/2147481687/323-10-50-3
Reference 5: http://www.xbrl.org/2003/role/disclosureRef
-Topic 825
-SubTopic 10
-Name Accounting Standards Codification
-Section 50
-Paragraph 28
-Subparagraph (f)
-Publisher FASB
-URI https://asc.fasb.org//1943274/2147482907/825-10-50-28
Reference 6: http://www.xbrl.org/2003/role/exampleRef
-Topic 852
-SubTopic 10
-Name Accounting Standards Codification
-Section 55
-Paragraph 10
-Publisher FASB
-URI https://asc.fasb.org//1943274/2147481372/852-10-55-10
Reference 7: http://www.xbrl.org/2003/role/exampleRef
-Topic 946
-SubTopic 830
-Name Accounting Standards Codification
-Section 55
-Paragraph 12
-Publisher FASB
-URI https://asc.fasb.org//1943274/2147480167/946-830-55-12
Reference 8: http://www.xbrl.org/2003/role/disclosureRef
-Topic 944
-SubTopic 210
-Name Accounting Standards Codification
-Section S99
-Paragraph 1
-Subparagraph (SX 210.7-03(a)(12))
-Publisher FASB
-URI https://asc.fasb.org//1943274/2147479440/944-210-S99-1
Reference 9: http://www.xbrl.org/2003/role/disclosureRef
-Topic 280
-SubTopic 10
-Name Accounting Standards Codification
-Section 50
-Paragraph 22
-Publisher FASB
-URI https://asc.fasb.org//1943274/2147482810/280-10-50-22
Reference 10: http://www.xbrl.org/2003/role/disclosureRef
-Topic 946
-SubTopic 210
-Name Accounting Standards Codification
-Section S99
-Paragraph 1
-Subparagraph (SX 210.6-04(8))
-Publisher FASB
-URI https://asc.fasb.org//1943274/2147479617/946-210-S99-1
Reference 11: http://www.xbrl.org/2003/role/disclosureRef
-Topic 210
-SubTopic 10
-Name Accounting Standards Codification
-Section S99
-Paragraph 1
-Subparagraph (SX 210.5-02(18))
-Publisher FASB
-URI https://asc.fasb.org//1943274/2147480566/210-10-S99-1
Reference 12: http://www.xbrl.org/2003/role/disclosureRef
-Topic 470
-SubTopic 10
-Name Accounting Standards Codification
-Section S99
-Paragraph 1A
-Subparagraph (SX 210.13-01(a)(4)(i))
-Publisher FASB
-URI https://asc.fasb.org//1943274/2147480097/470-10-S99-1A
Reference 13: http://www.xbrl.org/2009/role/commonPracticeRef
-Topic 470
-SubTopic 10
-Name Accounting Standards Codification
-Section S99
-Paragraph 1A
-Subparagraph (SX 210.13-01(a)(4)(ii))
-Publisher FASB
-URI https://asc.fasb.org//1943274/2147480097/470-10-S99-1A
Reference 14: http://www.xbrl.org/2009/role/commonPracticeRef
-Topic 470
-SubTopic 10
-Name Accounting Standards Codification
-Section S99
-Paragraph 1A
-Subparagraph (SX 210.13-01(a)(4)(iii))
-Publisher FASB
-URI https://asc.fasb.org//1943274/2147480097/470-10-S99-1A
Reference 15: http://www.xbrl.org/2003/role/disclosureRef
-Topic 470
-SubTopic 10
-Name Accounting Standards Codification
-Section S99
-Paragraph 1A
-Subparagraph (SX 210.13-01(a)(4)(iii)(A))
-Publisher FASB
-URI https://asc.fasb.org//1943274/2147480097/470-10-S99-1A
Reference 16: http://www.xbrl.org/2003/role/disclosureRef
-Topic 470
-SubTopic 10
-Name Accounting Standards Codification
-Section S99
-Paragraph 1A
-Subparagraph (SX 210.13-01(a)(4)(iv))
-Publisher FASB
-URI https://asc.fasb.org//1943274/2147480097/470-10-S99-1A
Reference 17: http://www.xbrl.org/2003/role/disclosureRef
-Topic 470
-SubTopic 10
-Name Accounting Standards Codification
-Section S99
-Paragraph 1A
-Subparagraph (SX 210.13-01(a)(5))
-Publisher FASB
-URI https://asc.fasb.org//1943274/2147480097/470-10-S99-1A
Reference 18: http://www.xbrl.org/2003/role/disclosureRef
-Topic 470
-SubTopic 10
-Name Accounting Standards Codification
-Section S99
-Paragraph 1B
-Subparagraph (SX 210.13-02(a)(4)(i))
-Publisher FASB
-URI https://asc.fasb.org//1943274/2147480097/470-10-S99-1B
Reference 19: http://www.xbrl.org/2003/role/disclosureRef
-Topic 470
-SubTopic 10
-Name Accounting Standards Codification
-Section S99
-Paragraph 1B
-Subparagraph (SX 210.13-02(a)(4)(iii)(A))
-Publisher FASB
-URI https://asc.fasb.org//1943274/2147480097/470-10-S99-1B
Reference 20: http://www.xbrl.org/2003/role/disclosureRef
-Topic 470
-SubTopic 10
-Name Accounting Standards Codification
-Section S99
-Paragraph 1B
-Subparagraph (SX 210.13-02(a)(4)(iii)(B))
-Publisher FASB
-URI https://asc.fasb.org//1943274/2147480097/470-10-S99-1B
Reference 21: http://www.xbrl.org/2003/role/disclosureRef
-Topic 470
-SubTopic 10
-Name Accounting Standards Codification
-Section S99
-Paragraph 1B
-Subparagraph (SX 210.13-02(a)(4)(iv))
-Publisher FASB
-URI https://asc.fasb.org//1943274/2147480097/470-10-S99-1B
Reference 22: http://www.xbrl.org/2003/role/disclosureRef
-Topic 470
-SubTopic 10
-Name Accounting Standards Codification
-Section S99
-Paragraph 1B
-Subparagraph (SX 210.13-02(a)(5))
-Publisher FASB
-URI https://asc.fasb.org//1943274/2147480097/470-10-S99-1B
Reference 23: http://www.xbrl.org/2009/role/commonPracticeRef
-Topic 852
-SubTopic 10
-Name Accounting Standards Codification
-Section 50
-Paragraph 7
-Subparagraph (a)
-Publisher FASB
-URI https://asc.fasb.org//1943274/2147481404/852-10-50-7
Reference 24: http://www.xbrl.org/2003/role/disclosureRef
-Topic 280
-SubTopic 10
-Name Accounting Standards Codification
-Section 50
-Paragraph 30
-Subparagraph (c)
-Publisher FASB
-URI https://asc.fasb.org//1943274/2147482810/280-10-50-30
Reference 25: http://www.xbrl.org/2003/role/disclosureRef
-Topic 280
-SubTopic 10
-Name Accounting Standards Codification
-Section 50
-Paragraph 32
-Subparagraph (d)
-Publisher FASB
-URI https://asc.fasb.org//1943274/2147482810/280-10-50-32
Reference 26: http://fasb.org/us-gaap/role/ref/legacyRef
-Topic 942
-SubTopic 210
-Name Accounting Standards Codification
-Section S99
-Paragraph 1
-Subparagraph (SX 210.9-03(11))
-Publisher FASB
-URI https://asc.fasb.org//1943274/2147479853/942-210-S99-1
| Name: |
us-gaap_Assets |
| Namespace Prefix: |
us-gaap_ |
| Data Type: |
xbrli:monetaryItemType |
| Balance Type: |
debit |
| Period Type: |
instant |
|
| X |
- DefinitionSum of the carrying amounts as of the balance sheet date of all assets that are expected to be realized in cash, sold, or consumed within one year (or the normal operating cycle, if longer). Assets are probable future economic benefits obtained or controlled by an entity as a result of past transactions or events. Reference 1: http://www.xbrl.org/2003/role/disclosureRef
-Topic 810
-SubTopic 10
-Name Accounting Standards Codification
-Section 50
-Paragraph 3
-Subparagraph (bb)
-Publisher FASB
-URI https://asc.fasb.org//1943274/2147481203/810-10-50-3
Reference 2: http://www.xbrl.org/2003/role/disclosureRef
-Topic 810
-SubTopic 10
-Name Accounting Standards Codification
-Section 45
-Paragraph 25
-Subparagraph (a)
-Publisher FASB
-URI https://asc.fasb.org//1943274/2147481231/810-10-45-25
Reference 3: http://www.xbrl.org/2003/role/disclosureRef
-Topic 235
-SubTopic 10
-Name Accounting Standards Codification
-Section S99
-Paragraph 1
-Subparagraph (SX 210.4-08(g)(1)(ii))
-Publisher FASB
-URI https://asc.fasb.org//1943274/2147480678/235-10-S99-1
Reference 4: http://www.xbrl.org/2003/role/disclosureRef
-Topic 323
-SubTopic 10
-Name Accounting Standards Codification
-Section 50
-Paragraph 3
-Subparagraph (c)
-Publisher FASB
-URI https://asc.fasb.org//1943274/2147481687/323-10-50-3
Reference 5: http://www.xbrl.org/2003/role/disclosureRef
-Topic 825
-SubTopic 10
-Name Accounting Standards Codification
-Section 50
-Paragraph 28
-Subparagraph (f)
-Publisher FASB
-URI https://asc.fasb.org//1943274/2147482907/825-10-50-28
Reference 6: http://www.xbrl.org/2003/role/exampleRef
-Topic 852
-SubTopic 10
-Name Accounting Standards Codification
-Section 55
-Paragraph 10
-Publisher FASB
-URI https://asc.fasb.org//1943274/2147481372/852-10-55-10
Reference 7: http://www.xbrl.org/2003/role/disclosureRef
-Topic 210
-SubTopic 10
-Name Accounting Standards Codification
-Section 45
-Paragraph 1
-Publisher FASB
-URI https://asc.fasb.org//1943274/2147483467/210-10-45-1
Reference 8: http://www.xbrl.org/2003/role/disclosureRef
-Topic 210
-SubTopic 10
-Name Accounting Standards Codification
-Section S99
-Paragraph 1
-Subparagraph (SX 210.5-02(9))
-Publisher FASB
-URI https://asc.fasb.org//1943274/2147480566/210-10-S99-1
Reference 9: http://www.xbrl.org/2003/role/disclosureRef
-Topic 470
-SubTopic 10
-Name Accounting Standards Codification
-Section S99
-Paragraph 1A
-Subparagraph (SX 210.13-01(a)(4)(i))
-Publisher FASB
-URI https://asc.fasb.org//1943274/2147480097/470-10-S99-1A
Reference 10: http://www.xbrl.org/2009/role/commonPracticeRef
-Topic 470
-SubTopic 10
-Name Accounting Standards Codification
-Section S99
-Paragraph 1A
-Subparagraph (SX 210.13-01(a)(4)(ii))
-Publisher FASB
-URI https://asc.fasb.org//1943274/2147480097/470-10-S99-1A
Reference 11: http://www.xbrl.org/2009/role/commonPracticeRef
-Topic 470
-SubTopic 10
-Name Accounting Standards Codification
-Section S99
-Paragraph 1A
-Subparagraph (SX 210.13-01(a)(4)(iii))
-Publisher FASB
-URI https://asc.fasb.org//1943274/2147480097/470-10-S99-1A
Reference 12: http://www.xbrl.org/2003/role/disclosureRef
-Topic 470
-SubTopic 10
-Name Accounting Standards Codification
-Section S99
-Paragraph 1A
-Subparagraph (SX 210.13-01(a)(4)(iii)(A))
-Publisher FASB
-URI https://asc.fasb.org//1943274/2147480097/470-10-S99-1A
Reference 13: http://www.xbrl.org/2003/role/disclosureRef
-Topic 470
-SubTopic 10
-Name Accounting Standards Codification
-Section S99
-Paragraph 1A
-Subparagraph (SX 210.13-01(a)(4)(iv))
-Publisher FASB
-URI https://asc.fasb.org//1943274/2147480097/470-10-S99-1A
Reference 14: http://www.xbrl.org/2003/role/disclosureRef
-Topic 470
-SubTopic 10
-Name Accounting Standards Codification
-Section S99
-Paragraph 1A
-Subparagraph (SX 210.13-01(a)(5))
-Publisher FASB
-URI https://asc.fasb.org//1943274/2147480097/470-10-S99-1A
Reference 15: http://www.xbrl.org/2003/role/disclosureRef
-Topic 470
-SubTopic 10
-Name Accounting Standards Codification
-Section S99
-Paragraph 1B
-Subparagraph (SX 210.13-02(a)(4)(i))
-Publisher FASB
-URI https://asc.fasb.org//1943274/2147480097/470-10-S99-1B
Reference 16: http://www.xbrl.org/2003/role/disclosureRef
-Topic 470
-SubTopic 10
-Name Accounting Standards Codification
-Section S99
-Paragraph 1B
-Subparagraph (SX 210.13-02(a)(4)(iii)(A))
-Publisher FASB
-URI https://asc.fasb.org//1943274/2147480097/470-10-S99-1B
Reference 17: http://www.xbrl.org/2003/role/disclosureRef
-Topic 470
-SubTopic 10
-Name Accounting Standards Codification
-Section S99
-Paragraph 1B
-Subparagraph (SX 210.13-02(a)(4)(iii)(B))
-Publisher FASB
-URI https://asc.fasb.org//1943274/2147480097/470-10-S99-1B
Reference 18: http://www.xbrl.org/2003/role/disclosureRef
-Topic 470
-SubTopic 10
-Name Accounting Standards Codification
-Section S99
-Paragraph 1B
-Subparagraph (SX 210.13-02(a)(4)(iv))
-Publisher FASB
-URI https://asc.fasb.org//1943274/2147480097/470-10-S99-1B
Reference 19: http://www.xbrl.org/2003/role/disclosureRef
-Topic 470
-SubTopic 10
-Name Accounting Standards Codification
-Section S99
-Paragraph 1B
-Subparagraph (SX 210.13-02(a)(5))
-Publisher FASB
-URI https://asc.fasb.org//1943274/2147480097/470-10-S99-1B
Reference 20: http://www.xbrl.org/2009/role/commonPracticeRef
-Topic 852
-SubTopic 10
-Name Accounting Standards Codification
-Section 50
-Paragraph 7
-Subparagraph (a)
-Publisher FASB
-URI https://asc.fasb.org//1943274/2147481404/852-10-50-7
| Name: |
us-gaap_AssetsCurrent |
| Namespace Prefix: |
us-gaap_ |
| Data Type: |
xbrli:monetaryItemType |
| Balance Type: |
debit |
| Period Type: |
instant |
|
| X |
- References
+ Details
| Name: |
us-gaap_AssetsCurrentAbstract |
| Namespace Prefix: |
us-gaap_ |
| Data Type: |
xbrli:stringItemType |
| Balance Type: |
na |
| Period Type: |
duration |
|
| X |
- DefinitionAmount of currency on hand as well as demand deposits with banks or financial institutions. Includes other kinds of accounts that have the general characteristics of demand deposits. Excludes cash and cash equivalents within disposal group and discontinued operation. Reference 1: http://www.xbrl.org/2003/role/exampleRef
-Topic 852
-SubTopic 10
-Name Accounting Standards Codification
-Section 55
-Paragraph 10
-Publisher FASB
-URI https://asc.fasb.org//1943274/2147481372/852-10-55-10
Reference 2: http://www.xbrl.org/2003/role/exampleRef
-Topic 946
-SubTopic 830
-Name Accounting Standards Codification
-Section 55
-Paragraph 12
-Publisher FASB
-URI https://asc.fasb.org//1943274/2147480167/946-830-55-12
Reference 3: http://www.xbrl.org/2003/role/disclosureRef
-Topic 944
-SubTopic 210
-Name Accounting Standards Codification
-Section S99
-Paragraph 1
-Subparagraph (SX 210.7-03(a)(2))
-Publisher FASB
-URI https://asc.fasb.org//1943274/2147479440/944-210-S99-1
Reference 4: http://www.xbrl.org/2003/role/disclosureRef
-Topic 946
-SubTopic 210
-Name Accounting Standards Codification
-Section S99
-Paragraph 1
-Subparagraph (SX 210.6-04(4))
-Publisher FASB
-URI https://asc.fasb.org//1943274/2147479617/946-210-S99-1
Reference 5: http://www.xbrl.org/2003/role/disclosureRef
-Topic 946
-SubTopic 210
-Name Accounting Standards Codification
-Section 45
-Paragraph 21
-Publisher FASB
-URI https://asc.fasb.org//1943274/2147480555/946-210-45-21
Reference 6: http://www.xbrl.org/2009/role/commonPracticeRef
-Topic 210
-SubTopic 10
-Name Accounting Standards Codification
-Section S99
-Paragraph 1
-Subparagraph (SX 210.5-02(1))
-Publisher FASB
-URI https://asc.fasb.org//1943274/2147480566/210-10-S99-1
Reference 7: http://www.xbrl.org/2003/role/disclosureRef
-Name Accounting Standards Codification
-Section 45
-Paragraph 20
-SubTopic 210
-Topic 946
-Publisher FASB
-URI https://asc.fasb.org//1943274/2147480555/946-210-45-20
| Name: |
us-gaap_Cash |
| Namespace Prefix: |
us-gaap_ |
| Data Type: |
xbrli:monetaryItemType |
| Balance Type: |
debit |
| Period Type: |
instant |
|
| X |
- DefinitionRepresents the caption on the face of the balance sheet to indicate that the entity has entered into (1) purchase or supply arrangements that will require expending a portion of its resources to meet the terms thereof, and (2) is exposed to potential losses or, less frequently, gains, arising from (a) possible claims against a company's resources due to future performance under contract terms, and (b) possible losses or likely gains from uncertainties that will ultimately be resolved when one or more future events that are deemed likely to occur do occur or fail to occur. Reference 1: http://www.xbrl.org/2003/role/disclosureRef
-Topic 944
-SubTopic 210
-Name Accounting Standards Codification
-Section S99
-Paragraph 1
-Subparagraph (SX 210.7-03(a)(19))
-Publisher FASB
-URI https://asc.fasb.org//1943274/2147479440/944-210-S99-1
Reference 2: http://www.xbrl.org/2003/role/disclosureRef
-Topic 946
-SubTopic 210
-Name Accounting Standards Codification
-Section S99
-Paragraph 1
-Subparagraph (SX 210.6-04(15))
-Publisher FASB
-URI https://asc.fasb.org//1943274/2147479617/946-210-S99-1
Reference 3: http://fasb.org/us-gaap/role/ref/legacyRef
-Name Accounting Standards Codification
-Topic 942
-SubTopic 210
-Section S99
-Paragraph 1
-Subparagraph (SX 210.9-03.17)
-Publisher FASB
-URI https://asc.fasb.org//1943274/2147479853/942-210-S99-1
Reference 4: http://fasb.org/us-gaap/role/ref/legacyRef
-Name Accounting Standards Codification
-Topic 210
-SubTopic 10
-Section S99
-Paragraph 1
-Subparagraph (SX 210.5-02.25)
-Publisher FASB
-URI https://asc.fasb.org//1943274/2147480566/210-10-S99-1
| Name: |
us-gaap_CommitmentsAndContingencies |
| Namespace Prefix: |
us-gaap_ |
| Data Type: |
xbrli:monetaryItemType |
| Balance Type: |
credit |
| Period Type: |
instant |
|
| X |
- DefinitionAggregate par or stated value of issued nonredeemable common stock (or common stock redeemable solely at the option of the issuer). This item includes treasury stock repurchased by the entity. Note: elements for number of nonredeemable common shares, par value and other disclosure concepts are in another section within stockholders' equity. Reference 1: http://www.xbrl.org/2003/role/exampleRef
-Topic 852
-SubTopic 10
-Name Accounting Standards Codification
-Section 55
-Paragraph 10
-Publisher FASB
-URI https://asc.fasb.org//1943274/2147481372/852-10-55-10
Reference 2: http://www.xbrl.org/2003/role/disclosureRef
-Topic 944
-SubTopic 210
-Name Accounting Standards Codification
-Section S99
-Paragraph 1
-Subparagraph (SX 210.7-03(a)(22))
-Publisher FASB
-URI https://asc.fasb.org//1943274/2147479440/944-210-S99-1
Reference 3: http://fasb.org/us-gaap/role/ref/legacyRef
-Topic 210
-SubTopic 10
-Name Accounting Standards Codification
-Section S99
-Paragraph 1
-Subparagraph (SX 210.5-02(29))
-Publisher FASB
-URI https://asc.fasb.org//1943274/2147480566/210-10-S99-1
| Name: |
us-gaap_CommonStockValue |
| Namespace Prefix: |
us-gaap_ |
| Data Type: |
xbrli:monetaryItemType |
| Balance Type: |
credit |
| Period Type: |
instant |
|
| X |
- DefinitionAmount of deferred cost, excluding capitalized cost related to contract with customer; classified as noncurrent. Reference 1: http://www.xbrl.org/2009/role/commonPracticeRef
-Topic 210
-SubTopic 10
-Name Accounting Standards Codification
-Section S99
-Paragraph 1
-Subparagraph (SX 210.5-02(17))
-Publisher FASB
-URI https://asc.fasb.org//1943274/2147480566/210-10-S99-1
Reference 2: http://fasb.org/us-gaap/role/ref/legacyRef
-Topic 942
-SubTopic 210
-Name Accounting Standards Codification
-Section S99
-Paragraph 1
-Subparagraph (SX 210.9-03(10))
-Publisher FASB
-URI https://asc.fasb.org//1943274/2147479853/942-210-S99-1
| Name: |
us-gaap_DeferredCosts |
| Namespace Prefix: |
us-gaap_ |
| Data Type: |
xbrli:monetaryItemType |
| Balance Type: |
debit |
| Period Type: |
instant |
|
| X |
- DefinitionSum of the carrying amounts as of the balance sheet date of deferred costs capitalized at the end of the reporting period that are expected to be charged against earnings within one year or the normal operating cycle, if longer. Reference 1: http://www.xbrl.org/2009/role/commonPracticeRef
-Topic 210
-SubTopic 10
-Name Accounting Standards Codification
-Section S99
-Paragraph 1
-Subparagraph (SX 210.5-02(8))
-Publisher FASB
-URI https://asc.fasb.org//1943274/2147480566/210-10-S99-1
| Name: |
us-gaap_DeferredCostsCurrent |
| Namespace Prefix: |
us-gaap_ |
| Data Type: |
xbrli:monetaryItemType |
| Balance Type: |
debit |
| Period Type: |
instant |
|
| X |
- DefinitionAmount of deferred income and obligation to transfer product and service to customer for which consideration has been received or is receivable. Reference 1: http://www.xbrl.org/2009/role/commonPracticeRef
-Topic 210
-SubTopic 10
-Name Accounting Standards Codification
-Section S99
-Paragraph 1
-Subparagraph (SX 210.5-02(26)(c))
-Publisher FASB
-URI https://asc.fasb.org//1943274/2147480566/210-10-S99-1
| Name: |
us-gaap_DeferredRevenue |
| Namespace Prefix: |
us-gaap_ |
| Data Type: |
xbrli:monetaryItemType |
| Balance Type: |
credit |
| Period Type: |
instant |
|
| X |
- DefinitionAmount of deferred income and obligation to transfer product and service to customer for which consideration has been received or is receivable, classified as current. Reference 1: http://www.xbrl.org/2009/role/commonPracticeRef
-Topic 210
-SubTopic 10
-Name Accounting Standards Codification
-Section S99
-Paragraph 1
-Subparagraph (SX 210.5-02(20))
-Publisher FASB
-URI https://asc.fasb.org//1943274/2147480566/210-10-S99-1
| Name: |
us-gaap_DeferredRevenueCurrent |
| Namespace Prefix: |
us-gaap_ |
| Data Type: |
xbrli:monetaryItemType |
| Balance Type: |
credit |
| Period Type: |
instant |
|
| X |
- DefinitionAmount after valuation and LIFO reserves of inventory expected to be sold, or consumed within one year or operating cycle, if longer. Reference 1: http://www.xbrl.org/2003/role/exampleRef
-Topic 852
-SubTopic 10
-Name Accounting Standards Codification
-Section 55
-Paragraph 10
-Publisher FASB
-URI https://asc.fasb.org//1943274/2147481372/852-10-55-10
Reference 2: http://www.xbrl.org/2003/role/exampleRef
-Topic 210
-SubTopic 10
-Name Accounting Standards Codification
-Section 45
-Paragraph 1
-Subparagraph (b)
-Publisher FASB
-URI https://asc.fasb.org//1943274/2147483467/210-10-45-1
Reference 3: http://www.xbrl.org/2003/role/disclosureRef
-Topic 210
-SubTopic 10
-Name Accounting Standards Codification
-Section S99
-Paragraph 1
-Subparagraph (SX 210.5-02(6))
-Publisher FASB
-URI https://asc.fasb.org//1943274/2147480566/210-10-S99-1
| Name: |
us-gaap_InventoryNet |
| Namespace Prefix: |
us-gaap_ |
| Data Type: |
xbrli:monetaryItemType |
| Balance Type: |
debit |
| Period Type: |
instant |
|
| X |
- DefinitionAmount of liabilities and equity items, including the portion of equity attributable to noncontrolling interests, if any. Reference 1: http://www.xbrl.org/2003/role/exampleRef
-Topic 852
-SubTopic 10
-Name Accounting Standards Codification
-Section 55
-Paragraph 10
-Publisher FASB
-URI https://asc.fasb.org//1943274/2147481372/852-10-55-10
Reference 2: http://www.xbrl.org/2003/role/disclosureRef
-Topic 944
-SubTopic 210
-Name Accounting Standards Codification
-Section S99
-Paragraph 1
-Subparagraph (SX 210.7-03(a)(25))
-Publisher FASB
-URI https://asc.fasb.org//1943274/2147479440/944-210-S99-1
Reference 3: http://www.xbrl.org/2009/role/commonPracticeRef
-Topic 235
-SubTopic 10
-Name Accounting Standards Codification
-Section S99
-Paragraph 1
-Subparagraph (SX 210.4-08(g)(1)(ii))
-Publisher FASB
-URI https://asc.fasb.org//1943274/2147480678/235-10-S99-1
Reference 4: http://www.xbrl.org/2009/role/commonPracticeRef
-Topic 323
-SubTopic 10
-Name Accounting Standards Codification
-Section 50
-Paragraph 3
-Subparagraph (c)
-Publisher FASB
-URI https://asc.fasb.org//1943274/2147481687/323-10-50-3
Reference 5: http://www.xbrl.org/2009/role/commonPracticeRef
-Topic 825
-SubTopic 10
-Name Accounting Standards Codification
-Section 50
-Paragraph 28
-Subparagraph (f)
-Publisher FASB
-URI https://asc.fasb.org//1943274/2147482907/825-10-50-28
Reference 6: http://fasb.org/us-gaap/role/ref/legacyRef
-Topic 942
-SubTopic 210
-Name Accounting Standards Codification
-Section S99
-Paragraph 1
-Subparagraph (SX 210.9-03(23))
-Publisher FASB
-URI https://asc.fasb.org//1943274/2147479853/942-210-S99-1
Reference 7: http://fasb.org/us-gaap/role/ref/legacyRef
-Topic 210
-SubTopic 10
-Name Accounting Standards Codification
-Section S99
-Paragraph 1
-Subparagraph (SX 210.5-02(32))
-Publisher FASB
-URI https://asc.fasb.org//1943274/2147480566/210-10-S99-1
| Name: |
us-gaap_LiabilitiesAndStockholdersEquity |
| Namespace Prefix: |
us-gaap_ |
| Data Type: |
xbrli:monetaryItemType |
| Balance Type: |
credit |
| Period Type: |
instant |
|
| X |
- DefinitionTotal obligations incurred as part of normal operations that are expected to be paid during the following twelve months or within one business cycle, if longer. Reference 1: http://www.xbrl.org/2003/role/disclosureRef
-Topic 810
-SubTopic 10
-Name Accounting Standards Codification
-Section 50
-Paragraph 3
-Subparagraph (c)
-Publisher FASB
-URI https://asc.fasb.org//1943274/2147481203/810-10-50-3
Reference 2: http://www.xbrl.org/2003/role/disclosureRef
-Topic 810
-SubTopic 10
-Name Accounting Standards Codification
-Section 45
-Paragraph 25
-Subparagraph (b)
-Publisher FASB
-URI https://asc.fasb.org//1943274/2147481231/810-10-45-25
Reference 3: http://www.xbrl.org/2003/role/disclosureRef
-Topic 810
-SubTopic 10
-Name Accounting Standards Codification
-Section 50
-Paragraph 3
-Subparagraph (bb)
-Publisher FASB
-URI https://asc.fasb.org//1943274/2147481203/810-10-50-3
Reference 4: http://www.xbrl.org/2003/role/disclosureRef
-Topic 235
-SubTopic 10
-Name Accounting Standards Codification
-Section S99
-Paragraph 1
-Subparagraph (SX 210.4-08(g)(1)(ii))
-Publisher FASB
-URI https://asc.fasb.org//1943274/2147480678/235-10-S99-1
Reference 5: http://www.xbrl.org/2003/role/disclosureRef
-Topic 323
-SubTopic 10
-Name Accounting Standards Codification
-Section 50
-Paragraph 3
-Subparagraph (c)
-Publisher FASB
-URI https://asc.fasb.org//1943274/2147481687/323-10-50-3
Reference 6: http://www.xbrl.org/2003/role/disclosureRef
-Topic 825
-SubTopic 10
-Name Accounting Standards Codification
-Section 50
-Paragraph 28
-Subparagraph (f)
-Publisher FASB
-URI https://asc.fasb.org//1943274/2147482907/825-10-50-28
Reference 7: http://www.xbrl.org/2003/role/exampleRef
-Topic 852
-SubTopic 10
-Name Accounting Standards Codification
-Section 55
-Paragraph 10
-Publisher FASB
-URI https://asc.fasb.org//1943274/2147481372/852-10-55-10
Reference 8: http://www.xbrl.org/2003/role/disclosureRef
-Topic 210
-SubTopic 10
-Name Accounting Standards Codification
-Section 45
-Paragraph 5
-Publisher FASB
-URI https://asc.fasb.org//1943274/2147483467/210-10-45-5
Reference 9: http://www.xbrl.org/2003/role/disclosureRef
-Topic 470
-SubTopic 10
-Name Accounting Standards Codification
-Section S99
-Paragraph 1A
-Subparagraph (SX 210.13-01(a)(4)(i))
-Publisher FASB
-URI https://asc.fasb.org//1943274/2147480097/470-10-S99-1A
Reference 10: http://www.xbrl.org/2009/role/commonPracticeRef
-Topic 470
-SubTopic 10
-Name Accounting Standards Codification
-Section S99
-Paragraph 1A
-Subparagraph (SX 210.13-01(a)(4)(ii))
-Publisher FASB
-URI https://asc.fasb.org//1943274/2147480097/470-10-S99-1A
Reference 11: http://www.xbrl.org/2003/role/disclosureRef
-Topic 470
-SubTopic 10
-Name Accounting Standards Codification
-Section S99
-Paragraph 1A
-Subparagraph (SX 210.13-01(a)(4)(iii)(A))
-Publisher FASB
-URI https://asc.fasb.org//1943274/2147480097/470-10-S99-1A
Reference 12: http://www.xbrl.org/2003/role/disclosureRef
-Topic 470
-SubTopic 10
-Name Accounting Standards Codification
-Section S99
-Paragraph 1A
-Subparagraph (SX 210.13-01(a)(4)(iv))
-Publisher FASB
-URI https://asc.fasb.org//1943274/2147480097/470-10-S99-1A
Reference 13: http://www.xbrl.org/2003/role/disclosureRef
-Topic 470
-SubTopic 10
-Name Accounting Standards Codification
-Section S99
-Paragraph 1A
-Subparagraph (SX 210.13-01(a)(5))
-Publisher FASB
-URI https://asc.fasb.org//1943274/2147480097/470-10-S99-1A
Reference 14: http://www.xbrl.org/2003/role/disclosureRef
-Topic 470
-SubTopic 10
-Name Accounting Standards Codification
-Section S99
-Paragraph 1B
-Subparagraph (SX 210.13-02(a)(4)(i))
-Publisher FASB
-URI https://asc.fasb.org//1943274/2147480097/470-10-S99-1B
Reference 15: http://www.xbrl.org/2003/role/disclosureRef
-Topic 470
-SubTopic 10
-Name Accounting Standards Codification
-Section S99
-Paragraph 1B
-Subparagraph (SX 210.13-02(a)(4)(iii)(A))
-Publisher FASB
-URI https://asc.fasb.org//1943274/2147480097/470-10-S99-1B
Reference 16: http://www.xbrl.org/2003/role/disclosureRef
-Topic 470
-SubTopic 10
-Name Accounting Standards Codification
-Section S99
-Paragraph 1B
-Subparagraph (SX 210.13-02(a)(4)(iii)(B))
-Publisher FASB
-URI https://asc.fasb.org//1943274/2147480097/470-10-S99-1B
Reference 17: http://www.xbrl.org/2003/role/disclosureRef
-Topic 470
-SubTopic 10
-Name Accounting Standards Codification
-Section S99
-Paragraph 1B
-Subparagraph (SX 210.13-02(a)(4)(iv))
-Publisher FASB
-URI https://asc.fasb.org//1943274/2147480097/470-10-S99-1B
Reference 18: http://www.xbrl.org/2003/role/disclosureRef
-Topic 470
-SubTopic 10
-Name Accounting Standards Codification
-Section S99
-Paragraph 1B
-Subparagraph (SX 210.13-02(a)(5))
-Publisher FASB
-URI https://asc.fasb.org//1943274/2147480097/470-10-S99-1B
Reference 19: http://www.xbrl.org/2009/role/commonPracticeRef
-Topic 852
-SubTopic 10
-Name Accounting Standards Codification
-Section 50
-Paragraph 7
-Subparagraph (a)
-Publisher FASB
-URI https://asc.fasb.org//1943274/2147481404/852-10-50-7
Reference 20: http://www.xbrl.org/2009/role/commonPracticeRef
-Topic 852
-SubTopic 10
-Name Accounting Standards Codification
-Section 50
-Paragraph 7
-Subparagraph (b)
-Publisher FASB
-URI https://asc.fasb.org//1943274/2147481404/852-10-50-7
Reference 21: http://fasb.org/us-gaap/role/ref/legacyRef
-Name Accounting Standards Codification
-Topic 210
-SubTopic 10
-Section S99
-Paragraph 1
-Subparagraph (SX 210.5-02.21)
-Publisher FASB
-URI https://asc.fasb.org//1943274/2147480566/210-10-S99-1
| Name: |
us-gaap_LiabilitiesCurrent |
| Namespace Prefix: |
us-gaap_ |
| Data Type: |
xbrli:monetaryItemType |
| Balance Type: |
credit |
| Period Type: |
instant |
|
| X |
- References
+ Details
| Name: |
us-gaap_LiabilitiesCurrentAbstract |
| Namespace Prefix: |
us-gaap_ |
| Data Type: |
xbrli:stringItemType |
| Balance Type: |
na |
| Period Type: |
duration |
|
| X |
- DefinitionAmount of obligation due after one year or beyond the normal operating cycle, if longer. Reference 1: http://fasb.org/us-gaap/role/ref/legacyRef
-Name Accounting Standards Codification
-Section S99
-Paragraph 1
-Subparagraph (SX 210.5-02(22))
-SubTopic 10
-Topic 210
-Publisher FASB
-URI https://asc.fasb.org//1943274/2147480566/210-10-S99-1
Reference 2: http://www.xbrl.org/2003/role/disclosureRef
-Topic 810
-SubTopic 10
-Name Accounting Standards Codification
-Section 50
-Paragraph 3
-Subparagraph (c)
-Publisher FASB
-URI https://asc.fasb.org//1943274/2147481203/810-10-50-3
Reference 3: http://www.xbrl.org/2003/role/disclosureRef
-Topic 810
-SubTopic 10
-Name Accounting Standards Codification
-Section 45
-Paragraph 25
-Subparagraph (b)
-Publisher FASB
-URI https://asc.fasb.org//1943274/2147481231/810-10-45-25
Reference 4: http://www.xbrl.org/2003/role/disclosureRef
-Topic 810
-SubTopic 10
-Name Accounting Standards Codification
-Section 50
-Paragraph 3
-Subparagraph (bb)
-Publisher FASB
-URI https://asc.fasb.org//1943274/2147481203/810-10-50-3
Reference 5: http://www.xbrl.org/2003/role/disclosureRef
-Topic 235
-SubTopic 10
-Name Accounting Standards Codification
-Section S99
-Paragraph 1
-Subparagraph (SX 210.4-08(g)(1)(ii))
-Publisher FASB
-URI https://asc.fasb.org//1943274/2147480678/235-10-S99-1
Reference 6: http://www.xbrl.org/2003/role/disclosureRef
-Topic 323
-SubTopic 10
-Name Accounting Standards Codification
-Section 50
-Paragraph 3
-Subparagraph (c)
-Publisher FASB
-URI https://asc.fasb.org//1943274/2147481687/323-10-50-3
Reference 7: http://www.xbrl.org/2003/role/disclosureRef
-Topic 825
-SubTopic 10
-Name Accounting Standards Codification
-Section 50
-Paragraph 28
-Subparagraph (f)
-Publisher FASB
-URI https://asc.fasb.org//1943274/2147482907/825-10-50-28
Reference 8: http://www.xbrl.org/2003/role/disclosureRef
-Topic 470
-SubTopic 10
-Name Accounting Standards Codification
-Section S99
-Paragraph 1A
-Subparagraph (SX 210.13-01(a)(4)(i))
-Publisher FASB
-URI https://asc.fasb.org//1943274/2147480097/470-10-S99-1A
Reference 9: http://www.xbrl.org/2009/role/commonPracticeRef
-Topic 470
-SubTopic 10
-Name Accounting Standards Codification
-Section S99
-Paragraph 1A
-Subparagraph (SX 210.13-01(a)(4)(ii))
-Publisher FASB
-URI https://asc.fasb.org//1943274/2147480097/470-10-S99-1A
Reference 10: http://www.xbrl.org/2003/role/disclosureRef
-Topic 470
-SubTopic 10
-Name Accounting Standards Codification
-Section S99
-Paragraph 1A
-Subparagraph (SX 210.13-01(a)(4)(iii)(A))
-Publisher FASB
-URI https://asc.fasb.org//1943274/2147480097/470-10-S99-1A
Reference 11: http://www.xbrl.org/2003/role/disclosureRef
-Topic 470
-SubTopic 10
-Name Accounting Standards Codification
-Section S99
-Paragraph 1A
-Subparagraph (SX 210.13-01(a)(4)(iv))
-Publisher FASB
-URI https://asc.fasb.org//1943274/2147480097/470-10-S99-1A
Reference 12: http://www.xbrl.org/2003/role/disclosureRef
-Topic 470
-SubTopic 10
-Name Accounting Standards Codification
-Section S99
-Paragraph 1A
-Subparagraph (SX 210.13-01(a)(5))
-Publisher FASB
-URI https://asc.fasb.org//1943274/2147480097/470-10-S99-1A
Reference 13: http://www.xbrl.org/2003/role/disclosureRef
-Topic 470
-SubTopic 10
-Name Accounting Standards Codification
-Section S99
-Paragraph 1B
-Subparagraph (SX 210.13-02(a)(4)(i))
-Publisher FASB
-URI https://asc.fasb.org//1943274/2147480097/470-10-S99-1B
Reference 14: http://www.xbrl.org/2003/role/disclosureRef
-Topic 470
-SubTopic 10
-Name Accounting Standards Codification
-Section S99
-Paragraph 1B
-Subparagraph (SX 210.13-02(a)(4)(iii)(A))
-Publisher FASB
-URI https://asc.fasb.org//1943274/2147480097/470-10-S99-1B
Reference 15: http://www.xbrl.org/2003/role/disclosureRef
-Topic 470
-SubTopic 10
-Name Accounting Standards Codification
-Section S99
-Paragraph 1B
-Subparagraph (SX 210.13-02(a)(4)(iii)(B))
-Publisher FASB
-URI https://asc.fasb.org//1943274/2147480097/470-10-S99-1B
Reference 16: http://www.xbrl.org/2003/role/disclosureRef
-Topic 470
-SubTopic 10
-Name Accounting Standards Codification
-Section S99
-Paragraph 1B
-Subparagraph (SX 210.13-02(a)(4)(iv))
-Publisher FASB
-URI https://asc.fasb.org//1943274/2147480097/470-10-S99-1B
Reference 17: http://www.xbrl.org/2003/role/disclosureRef
-Topic 470
-SubTopic 10
-Name Accounting Standards Codification
-Section S99
-Paragraph 1B
-Subparagraph (SX 210.13-02(a)(5))
-Publisher FASB
-URI https://asc.fasb.org//1943274/2147480097/470-10-S99-1B
Reference 18: http://www.xbrl.org/2009/role/commonPracticeRef
-Topic 852
-SubTopic 10
-Name Accounting Standards Codification
-Section 50
-Paragraph 7
-Subparagraph (a)
-Publisher FASB
-URI https://asc.fasb.org//1943274/2147481404/852-10-50-7
Reference 19: http://www.xbrl.org/2009/role/commonPracticeRef
-Topic 852
-SubTopic 10
-Name Accounting Standards Codification
-Section 50
-Paragraph 7
-Subparagraph (b)
-Publisher FASB
-URI https://asc.fasb.org//1943274/2147481404/852-10-50-7
Reference 20: http://fasb.org/us-gaap/role/ref/legacyRef
-Topic 210
-SubTopic 10
-Name Accounting Standards Codification
-Section S99
-Paragraph 1
-Subparagraph (SX 210.5-02(23))
-Publisher FASB
-URI https://asc.fasb.org//1943274/2147480566/210-10-S99-1
Reference 21: http://fasb.org/us-gaap/role/ref/legacyRef
-Topic 210
-SubTopic 10
-Name Accounting Standards Codification
-Section S99
-Paragraph 1
-Subparagraph (SX 201.5-02(24))
-Publisher FASB
-URI https://asc.fasb.org//1943274/2147480566/210-10-S99-1
Reference 22: http://fasb.org/us-gaap/role/ref/legacyRef
-Topic 210
-SubTopic 10
-Name Accounting Standards Codification
-Section S99
-Paragraph 1
-Subparagraph (SX 201.5-02(25))
-Publisher FASB
-URI https://asc.fasb.org//1943274/2147480566/210-10-S99-1
Reference 23: http://fasb.org/us-gaap/role/ref/legacyRef
-Topic 210
-SubTopic 10
-Name Accounting Standards Codification
-Section S99
-Paragraph 1
-Subparagraph (SX 201.5-02(26))
-Publisher FASB
-URI https://asc.fasb.org//1943274/2147480566/210-10-S99-1
| Name: |
us-gaap_LiabilitiesNoncurrent |
| Namespace Prefix: |
us-gaap_ |
| Data Type: |
xbrli:monetaryItemType |
| Balance Type: |
credit |
| Period Type: |
instant |
|
| X |
- References
+ Details
| Name: |
us-gaap_LiabilitiesNoncurrentAbstract |
| Namespace Prefix: |
us-gaap_ |
| Data Type: |
xbrli:stringItemType |
| Balance Type: |
na |
| Period Type: |
duration |
|
| X |
- DefinitionAmount of equity (deficit) attributable to noncontrolling interest. Excludes temporary equity. Reference 1: http://www.xbrl.org/2003/role/disclosureRef
-Topic 235
-SubTopic 10
-Name Accounting Standards Codification
-Section S99
-Paragraph 1
-Subparagraph (SX 210.4-08(g)(1)(ii))
-Publisher FASB
-URI https://asc.fasb.org//1943274/2147480678/235-10-S99-1
Reference 2: http://www.xbrl.org/2003/role/disclosureRef
-Topic 323
-SubTopic 10
-Name Accounting Standards Codification
-Section 50
-Paragraph 3
-Subparagraph (c)
-Publisher FASB
-URI https://asc.fasb.org//1943274/2147481687/323-10-50-3
Reference 3: http://www.xbrl.org/2003/role/disclosureRef
-Topic 825
-SubTopic 10
-Name Accounting Standards Codification
-Section 50
-Paragraph 28
-Subparagraph (f)
-Publisher FASB
-URI https://asc.fasb.org//1943274/2147482907/825-10-50-28
Reference 4: http://www.xbrl.org/2003/role/disclosureRef
-Topic 944
-SubTopic 210
-Name Accounting Standards Codification
-Section S99
-Paragraph 1
-Subparagraph (SX 210.7-03(a)(24))
-Publisher FASB
-URI https://asc.fasb.org//1943274/2147479440/944-210-S99-1
Reference 5: http://www.xbrl.org/2003/role/disclosureRef
-Topic 946
-SubTopic 210
-Name Accounting Standards Codification
-Section S99
-Paragraph 1
-Subparagraph (SX 210.6-04(19))
-Publisher FASB
-URI https://asc.fasb.org//1943274/2147479617/946-210-S99-1
Reference 6: http://www.xbrl.org/2003/role/disclosureRef
-Topic 470
-SubTopic 10
-Name Accounting Standards Codification
-Section S99
-Paragraph 1A
-Subparagraph (SX 210.13-01(a)(4)(i))
-Publisher FASB
-URI https://asc.fasb.org//1943274/2147480097/470-10-S99-1A
Reference 7: http://www.xbrl.org/2003/role/disclosureRef
-Topic 470
-SubTopic 10
-Name Accounting Standards Codification
-Section S99
-Paragraph 1A
-Subparagraph (SX 210.13-01(a)(4)(iv))
-Publisher FASB
-URI https://asc.fasb.org//1943274/2147480097/470-10-S99-1A
Reference 8: http://www.xbrl.org/2003/role/disclosureRef
-Topic 470
-SubTopic 10
-Name Accounting Standards Codification
-Section S99
-Paragraph 1A
-Subparagraph (SX 210.13-01(a)(5))
-Publisher FASB
-URI https://asc.fasb.org//1943274/2147480097/470-10-S99-1A
Reference 9: http://www.xbrl.org/2003/role/disclosureRef
-Topic 470
-SubTopic 10
-Name Accounting Standards Codification
-Section S99
-Paragraph 1B
-Subparagraph (SX 210.13-02(a)(4)(i))
-Publisher FASB
-URI https://asc.fasb.org//1943274/2147480097/470-10-S99-1B
Reference 10: http://www.xbrl.org/2003/role/disclosureRef
-Topic 470
-SubTopic 10
-Name Accounting Standards Codification
-Section S99
-Paragraph 1B
-Subparagraph (SX 210.13-02(a)(4)(iv))
-Publisher FASB
-URI https://asc.fasb.org//1943274/2147480097/470-10-S99-1B
Reference 11: http://www.xbrl.org/2003/role/disclosureRef
-Topic 470
-SubTopic 10
-Name Accounting Standards Codification
-Section S99
-Paragraph 1B
-Subparagraph (SX 210.13-02(a)(5))
-Publisher FASB
-URI https://asc.fasb.org//1943274/2147480097/470-10-S99-1B
Reference 12: http://fasb.org/us-gaap/role/ref/legacyRef
-Topic 942
-SubTopic 210
-Name Accounting Standards Codification
-Section S99
-Paragraph 1
-Subparagraph (SX 210.9-03(22))
-Publisher FASB
-URI https://asc.fasb.org//1943274/2147479853/942-210-S99-1
Reference 13: http://fasb.org/us-gaap/role/ref/legacyRef
-Name Accounting Standards Codification
-Topic 210
-SubTopic 10
-Section S99
-Paragraph 1
-Subparagraph (SX 210.5-02.31)
-Publisher FASB
-URI https://asc.fasb.org//1943274/2147480566/210-10-S99-1
| Name: |
us-gaap_MinorityInterest |
| Namespace Prefix: |
us-gaap_ |
| Data Type: |
xbrli:monetaryItemType |
| Balance Type: |
credit |
| Period Type: |
instant |
|
| X |
- DefinitionPresent value of lessee's discounted obligation for lease payments from operating lease, classified as current. Reference 1: http://www.xbrl.org/2003/role/disclosureRef
-Topic 842
-SubTopic 20
-Name Accounting Standards Codification
-Section 45
-Paragraph 1
-Subparagraph (b)
-Publisher FASB
-URI https://asc.fasb.org//1943274/2147479041/842-20-45-1
| Name: |
us-gaap_OperatingLeaseLiabilityCurrent |
| Namespace Prefix: |
us-gaap_ |
| Data Type: |
xbrli:monetaryItemType |
| Balance Type: |
credit |
| Period Type: |
instant |
|
| X |
- DefinitionPresent value of lessee's discounted obligation for lease payments from operating lease, classified as noncurrent. Reference 1: http://www.xbrl.org/2003/role/disclosureRef
-Topic 842
-SubTopic 20
-Name Accounting Standards Codification
-Section 45
-Paragraph 1
-Subparagraph (b)
-Publisher FASB
-URI https://asc.fasb.org//1943274/2147479041/842-20-45-1
| Name: |
us-gaap_OperatingLeaseLiabilityNoncurrent |
| Namespace Prefix: |
us-gaap_ |
| Data Type: |
xbrli:monetaryItemType |
| Balance Type: |
credit |
| Period Type: |
instant |
|
| X |
- DefinitionAmount of lessee's right to use underlying asset under operating lease. Reference 1: http://www.xbrl.org/2003/role/disclosureRef
-Topic 842
-SubTopic 20
-Name Accounting Standards Codification
-Section 45
-Paragraph 1
-Subparagraph (a)
-Publisher FASB
-URI https://asc.fasb.org//1943274/2147479041/842-20-45-1
| Name: |
us-gaap_OperatingLeaseRightOfUseAsset |
| Namespace Prefix: |
us-gaap_ |
| Data Type: |
xbrli:monetaryItemType |
| Balance Type: |
debit |
| Period Type: |
instant |
|
| X |
- DefinitionAmount of current assets classified as other. Reference 1: http://www.xbrl.org/2003/role/exampleRef
-Topic 852
-SubTopic 10
-Name Accounting Standards Codification
-Section 55
-Paragraph 10
-Publisher FASB
-URI https://asc.fasb.org//1943274/2147481372/852-10-55-10
Reference 2: http://www.xbrl.org/2003/role/disclosureRef
-Topic 210
-SubTopic 10
-Name Accounting Standards Codification
-Section S99
-Paragraph 1
-Subparagraph (SX 210.5-02(8))
-Publisher FASB
-URI https://asc.fasb.org//1943274/2147480566/210-10-S99-1
| Name: |
us-gaap_OtherAssetsCurrent |
| Namespace Prefix: |
us-gaap_ |
| Data Type: |
xbrli:monetaryItemType |
| Balance Type: |
debit |
| Period Type: |
instant |
|
| X |
- DefinitionAmount of noncurrent assets classified as other. Reference 1: http://www.xbrl.org/2003/role/disclosureRef
-Topic 210
-SubTopic 10
-Name Accounting Standards Codification
-Section S99
-Paragraph 1
-Subparagraph (SX 210.5-02(17))
-Publisher FASB
-URI https://asc.fasb.org//1943274/2147480566/210-10-S99-1
| Name: |
us-gaap_OtherAssetsNoncurrent |
| Namespace Prefix: |
us-gaap_ |
| Data Type: |
xbrli:monetaryItemType |
| Balance Type: |
debit |
| Period Type: |
instant |
|
| X |
- DefinitionAmount of liabilities classified as other, due within one year or the normal operating cycle, if longer. Reference 1: http://www.xbrl.org/2003/role/exampleRef
-Topic 852
-SubTopic 10
-Name Accounting Standards Codification
-Section 55
-Paragraph 10
-Publisher FASB
-URI https://asc.fasb.org//1943274/2147481372/852-10-55-10
Reference 2: http://fasb.org/us-gaap/role/ref/legacyRef
-Name Accounting Standards Codification
-Topic 210
-SubTopic 10
-Section S99
-Paragraph 1
-Subparagraph (SX 210.5-02.20)
-Publisher FASB
-URI https://asc.fasb.org//1943274/2147480566/210-10-S99-1
| Name: |
us-gaap_OtherLiabilitiesCurrent |
| Namespace Prefix: |
us-gaap_ |
| Data Type: |
xbrli:monetaryItemType |
| Balance Type: |
credit |
| Period Type: |
instant |
|
| X |
- DefinitionAmount of liabilities classified as other, due after one year or the normal operating cycle, if longer. Reference 1: http://fasb.org/us-gaap/role/ref/legacyRef
-Name Accounting Standards Codification
-Topic 210
-SubTopic 10
-Section S99
-Paragraph 1
-Subparagraph (SX 210.5-02.24)
-Publisher FASB
-URI https://asc.fasb.org//1943274/2147480566/210-10-S99-1
| Name: |
us-gaap_OtherLiabilitiesNoncurrent |
| Namespace Prefix: |
us-gaap_ |
| Data Type: |
xbrli:monetaryItemType |
| Balance Type: |
credit |
| Period Type: |
instant |
|
| X |
- DefinitionAmount after accumulated depreciation, depletion and amortization of physical assets used in the normal conduct of business to produce goods and services and not intended for resale. Examples include, but are not limited to, land, buildings, machinery and equipment, office equipment, and furniture and fixtures. Reference 1: http://fasb.org/us-gaap/role/ref/legacyRef
-Name Accounting Standards Codification
-Section 50
-Paragraph 1
-SubTopic 10
-Topic 360
-Publisher FASB
-URI https://asc.fasb.org//1943274/2147482099/360-10-50-1
Reference 2: http://www.xbrl.org/2003/role/exampleRef
-Topic 852
-SubTopic 10
-Name Accounting Standards Codification
-Section 55
-Paragraph 10
-Publisher FASB
-URI https://asc.fasb.org//1943274/2147481372/852-10-55-10
Reference 3: http://www.xbrl.org/2003/role/disclosureRef
-Topic 944
-SubTopic 210
-Name Accounting Standards Codification
-Section S99
-Paragraph 1
-Subparagraph (SX 210.7-03(a)(8))
-Publisher FASB
-URI https://asc.fasb.org//1943274/2147479440/944-210-S99-1
Reference 4: http://www.xbrl.org/2003/role/disclosureRef
-Topic 942
-SubTopic 360
-Name Accounting Standards Codification
-Section 50
-Paragraph 1
-Publisher FASB
-URI https://asc.fasb.org//1943274/2147480842/942-360-50-1
| Name: |
us-gaap_PropertyPlantAndEquipmentNet |
| Namespace Prefix: |
us-gaap_ |
| Data Type: |
xbrli:monetaryItemType |
| Balance Type: |
debit |
| Period Type: |
instant |
|
| X |
- DefinitionAmount of accumulated undistributed earnings (deficit). Reference 1: http://www.xbrl.org/2003/role/exampleRef
-Topic 852
-SubTopic 10
-Name Accounting Standards Codification
-Section 55
-Paragraph 10
-Publisher FASB
-URI https://asc.fasb.org//1943274/2147481372/852-10-55-10
Reference 2: http://www.xbrl.org/2003/role/disclosureRef
-Topic 944
-SubTopic 40
-Name Accounting Standards Codification
-Section 65
-Paragraph 2
-Subparagraph (g)(2)(i)
-Publisher FASB
-URI https://asc.fasb.org//1943274/2147480016/944-40-65-2
Reference 3: http://www.xbrl.org/2003/role/disclosureRef
-Topic 944
-SubTopic 40
-Name Accounting Standards Codification
-Section 65
-Paragraph 2
-Subparagraph (h)(2)
-Publisher FASB
-URI https://asc.fasb.org//1943274/2147480016/944-40-65-2
Reference 4: http://www.xbrl.org/2003/role/disclosureRef
-Topic 946
-SubTopic 20
-Name Accounting Standards Codification
-Section 50
-Paragraph 11
-Publisher FASB
-URI https://asc.fasb.org//1943274/2147480990/946-20-50-11
Reference 5: http://www.xbrl.org/2003/role/disclosureRef
-Topic 944
-SubTopic 210
-Name Accounting Standards Codification
-Section S99
-Paragraph 1
-Subparagraph (SX 210.7-03(a)(23)(a)(4))
-Publisher FASB
-URI https://asc.fasb.org//1943274/2147479440/944-210-S99-1
Reference 6: http://www.xbrl.org/2003/role/disclosureRef
-Topic 946
-SubTopic 210
-Name Accounting Standards Codification
-Section S99
-Paragraph 1
-Subparagraph (SX 210.6-04(17))
-Publisher FASB
-URI https://asc.fasb.org//1943274/2147479617/946-210-S99-1
Reference 7: http://fasb.org/us-gaap/role/ref/legacyRef
-Topic 505
-SubTopic 10
-Name Accounting Standards Codification
-Section S99
-Paragraph 1
-Subparagraph (SX 210.3-04)
-Publisher FASB
-URI https://asc.fasb.org//1943274/2147480008/505-10-S99-1
Reference 8: http://fasb.org/us-gaap/role/ref/legacyRef
-Topic 210
-SubTopic 10
-Name Accounting Standards Codification
-Section S99
-Paragraph 1
-Subparagraph (SX 210.5-02(30)(a)(3))
-Publisher FASB
-URI https://asc.fasb.org//1943274/2147480566/210-10-S99-1
| Name: |
us-gaap_RetainedEarningsAccumulatedDeficit |
| Namespace Prefix: |
us-gaap_ |
| Data Type: |
xbrli:monetaryItemType |
| Balance Type: |
credit |
| Period Type: |
instant |
|
| X |
- DefinitionAmount of equity (deficit) attributable to parent. Excludes temporary equity and equity attributable to noncontrolling interest. Reference 1: http://www.xbrl.org/2003/role/exampleRef
-Topic 852
-SubTopic 10
-Name Accounting Standards Codification
-Section 55
-Paragraph 10
-Publisher FASB
-URI https://asc.fasb.org//1943274/2147481372/852-10-55-10
Reference 2: http://www.xbrl.org/2003/role/exampleRef
-Topic 946
-SubTopic 830
-Name Accounting Standards Codification
-Section 55
-Paragraph 12
-Publisher FASB
-URI https://asc.fasb.org//1943274/2147480167/946-830-55-12
Reference 3: http://www.xbrl.org/2003/role/disclosureRef
-Topic 946
-SubTopic 210
-Name Accounting Standards Codification
-Section S99
-Paragraph 1
-Subparagraph (SX 210.6-04(19))
-Publisher FASB
-URI https://asc.fasb.org//1943274/2147479617/946-210-S99-1
Reference 4: http://www.xbrl.org/2003/role/disclosureRef
-Topic 946
-SubTopic 210
-Name Accounting Standards Codification
-Section S99
-Paragraph 2
-Subparagraph (SX 210.6-05(4))
-Publisher FASB
-URI https://asc.fasb.org//1943274/2147479617/946-210-S99-2
Reference 5: http://www.xbrl.org/2009/role/commonPracticeRef
-Topic 946
-SubTopic 220
-Name Accounting Standards Codification
-Section S99
-Paragraph 3
-Subparagraph (SX 210.6-09(4)(b))
-Publisher FASB
-URI https://asc.fasb.org//1943274/2147483575/946-220-S99-3
Reference 6: http://www.xbrl.org/2003/role/disclosureRef
-Topic 946
-SubTopic 220
-Name Accounting Standards Codification
-Section S99
-Paragraph 3
-Subparagraph (SX 210.6-09(6))
-Publisher FASB
-URI https://asc.fasb.org//1943274/2147483575/946-220-S99-3
Reference 7: http://www.xbrl.org/2003/role/disclosureRef
-Topic 946
-SubTopic 220
-Name Accounting Standards Codification
-Section S99
-Paragraph 3
-Subparagraph (SX 210.6-09(7))
-Publisher FASB
-URI https://asc.fasb.org//1943274/2147483575/946-220-S99-3
Reference 8: http://www.xbrl.org/2009/role/commonPracticeRef
-Topic 235
-SubTopic 10
-Name Accounting Standards Codification
-Section S99
-Paragraph 1
-Subparagraph (SX 210.4-08(g)(1)(ii))
-Publisher FASB
-URI https://asc.fasb.org//1943274/2147480678/235-10-S99-1
Reference 9: http://www.xbrl.org/2009/role/commonPracticeRef
-Topic 323
-SubTopic 10
-Name Accounting Standards Codification
-Section 50
-Paragraph 3
-Subparagraph (c)
-Publisher FASB
-URI https://asc.fasb.org//1943274/2147481687/323-10-50-3
Reference 10: http://www.xbrl.org/2009/role/commonPracticeRef
-Topic 825
-SubTopic 10
-Name Accounting Standards Codification
-Section 50
-Paragraph 28
-Subparagraph (f)
-Publisher FASB
-URI https://asc.fasb.org//1943274/2147482907/825-10-50-28
Reference 11: http://fasb.org/us-gaap/role/ref/legacyRef
-Topic 210
-SubTopic 10
-Name Accounting Standards Codification
-Section S99
-Paragraph 1
-Subparagraph (SX 210.5-02(29))
-Publisher FASB
-URI https://asc.fasb.org//1943274/2147480566/210-10-S99-1
Reference 12: http://fasb.org/us-gaap/role/ref/legacyRef
-Topic 210
-SubTopic 10
-Name Accounting Standards Codification
-Section S99
-Paragraph 1
-Subparagraph (SX 210.5-02(31))
-Publisher FASB
-URI https://asc.fasb.org//1943274/2147480566/210-10-S99-1
Reference 13: http://fasb.org/us-gaap/role/ref/legacyRef
-Topic 210
-SubTopic 10
-Name Accounting Standards Codification
-Section S99
-Paragraph 1
-Subparagraph (SX 210.5-02(30))
-Publisher FASB
-URI https://asc.fasb.org//1943274/2147480566/210-10-S99-1
Reference 14: http://fasb.org/us-gaap/role/ref/legacyRef
-Topic 310
-SubTopic 10
-Name Accounting Standards Codification
-Section S99
-Paragraph 2
-Subparagraph (SAB Topic 4.E)
-Publisher FASB
-URI https://asc.fasb.org//1943274/2147480418/310-10-S99-2
| Name: |
us-gaap_StockholdersEquity |
| Namespace Prefix: |
us-gaap_ |
| Data Type: |
xbrli:monetaryItemType |
| Balance Type: |
credit |
| Period Type: |
instant |
|
| X |
- DefinitionAmount of equity (deficit) attributable to parent and noncontrolling interest. Excludes temporary equity. Reference 1: http://www.xbrl.org/2003/role/disclosureRef
-Topic 250
-SubTopic 10
-Name Accounting Standards Codification
-Section 45
-Paragraph 24
-Publisher FASB
-URI https://asc.fasb.org//1943274/2147483421/250-10-45-24
Reference 2: http://www.xbrl.org/2003/role/disclosureRef
-Topic 250
-SubTopic 10
-Name Accounting Standards Codification
-Section 45
-Paragraph 23
-Subparagraph (b)
-Publisher FASB
-URI https://asc.fasb.org//1943274/2147483421/250-10-45-23
Reference 3: http://www.xbrl.org/2003/role/disclosureRef
-Topic 250
-SubTopic 10
-Name Accounting Standards Codification
-Section 45
-Paragraph 5
-Subparagraph (b)
-Publisher FASB
-URI https://asc.fasb.org//1943274/2147483421/250-10-45-5
Reference 4: http://www.xbrl.org/2003/role/disclosureRef
-Topic 326
-SubTopic 10
-Name Accounting Standards Codification
-Section 65
-Paragraph 5
-Subparagraph (c)(2)
-Publisher FASB
-URI https://asc.fasb.org//1943274/2147479654/326-10-65-5
Reference 5: http://www.xbrl.org/2003/role/disclosureRef
-Topic 815
-SubTopic 20
-Name Accounting Standards Codification
-Section 65
-Paragraph 6
-Subparagraph (e)
-Publisher FASB
-URI https://asc.fasb.org//1943274/2147480528/815-20-65-6
Reference 6: http://www.xbrl.org/2003/role/disclosureRef
-Topic 815
-SubTopic 20
-Name Accounting Standards Codification
-Section 65
-Paragraph 6
-Subparagraph (h)(1)
-Publisher FASB
-URI https://asc.fasb.org//1943274/2147480528/815-20-65-6
Reference 7: http://www.xbrl.org/2003/role/disclosureRef
-Topic 815
-SubTopic 20
-Name Accounting Standards Codification
-Section 65
-Paragraph 6
-Subparagraph (h)(1)(i)
-Publisher FASB
-URI https://asc.fasb.org//1943274/2147480528/815-20-65-6
Reference 8: http://www.xbrl.org/2003/role/disclosureRef
-Topic 815
-SubTopic 20
-Name Accounting Standards Codification
-Section 65
-Paragraph 6
-Subparagraph (h)(1)(iii)
-Publisher FASB
-URI https://asc.fasb.org//1943274/2147480528/815-20-65-6
Reference 9: http://www.xbrl.org/2003/role/disclosureRef
-Topic 815
-SubTopic 20
-Name Accounting Standards Codification
-Section 65
-Paragraph 6
-Subparagraph (h)(1)(iv)
-Publisher FASB
-URI https://asc.fasb.org//1943274/2147480528/815-20-65-6
Reference 10: http://www.xbrl.org/2003/role/disclosureRef
-Topic 815
-SubTopic 20
-Name Accounting Standards Codification
-Section 65
-Paragraph 6
-Subparagraph (i)(3)
-Publisher FASB
-URI https://asc.fasb.org//1943274/2147480528/815-20-65-6
Reference 11: http://www.xbrl.org/2003/role/disclosureRef
-Topic 848
-SubTopic 10
-Name Accounting Standards Codification
-Section 65
-Paragraph 2
-Subparagraph (a)(3)(iii)(03)
-Publisher FASB
-URI https://asc.fasb.org//1943274/2147483550/848-10-65-2
Reference 12: http://www.xbrl.org/2003/role/disclosureRef
-Topic 105
-SubTopic 10
-Name Accounting Standards Codification
-Section 65
-Paragraph 6
-Subparagraph (c)
-Publisher FASB
-URI https://asc.fasb.org//1943274/2147479343/105-10-65-6
Reference 13: http://www.xbrl.org/2003/role/disclosureRef
-Topic 105
-SubTopic 10
-Name Accounting Standards Codification
-Section 65
-Paragraph 6
-Subparagraph (d)
-Publisher FASB
-URI https://asc.fasb.org//1943274/2147479343/105-10-65-6
Reference 14: http://www.xbrl.org/2003/role/disclosureRef
-Topic 944
-SubTopic 40
-Name Accounting Standards Codification
-Section 65
-Paragraph 2
-Subparagraph (f)(1)
-Publisher FASB
-URI https://asc.fasb.org//1943274/2147480016/944-40-65-2
Reference 15: http://www.xbrl.org/2003/role/disclosureRef
-Topic 944
-SubTopic 40
-Name Accounting Standards Codification
-Section 65
-Paragraph 2
-Subparagraph (f)(2)
-Publisher FASB
-URI https://asc.fasb.org//1943274/2147480016/944-40-65-2
Reference 16: http://www.xbrl.org/2003/role/disclosureRef
-Topic 740
-SubTopic 10
-Name Accounting Standards Codification
-Section 65
-Paragraph 8
-Subparagraph (d)(2)
-Publisher FASB
-URI https://asc.fasb.org//1943274/2147482615/740-10-65-8
Reference 17: http://www.xbrl.org/2003/role/disclosureRef
-Topic 740
-SubTopic 10
-Name Accounting Standards Codification
-Section 65
-Paragraph 8
-Subparagraph (d)(3)
-Publisher FASB
-URI https://asc.fasb.org//1943274/2147482615/740-10-65-8
Reference 18: http://www.xbrl.org/2003/role/disclosureRef
-Topic 326
-SubTopic 10
-Name Accounting Standards Codification
-Section 65
-Paragraph 4
-Subparagraph (d)
-Publisher FASB
-URI https://asc.fasb.org//1943274/2147479654/326-10-65-4
Reference 19: http://www.xbrl.org/2003/role/disclosureRef
-Topic 718
-SubTopic 10
-Name Accounting Standards Codification
-Section 65
-Paragraph 15
-Subparagraph (e)
-Publisher FASB
-URI https://asc.fasb.org//1943274/2147480336/718-10-65-15
Reference 20: http://www.xbrl.org/2003/role/disclosureRef
-Topic 718
-SubTopic 10
-Name Accounting Standards Codification
-Section 65
-Paragraph 15
-Subparagraph (f)(1)
-Publisher FASB
-URI https://asc.fasb.org//1943274/2147480336/718-10-65-15
Reference 21: http://www.xbrl.org/2003/role/disclosureRef
-Topic 718
-SubTopic 10
-Name Accounting Standards Codification
-Section 65
-Paragraph 15
-Subparagraph (f)(2)
-Publisher FASB
-URI https://asc.fasb.org//1943274/2147480336/718-10-65-15
Reference 22: http://www.xbrl.org/2003/role/disclosureRef
-Topic 250
-SubTopic 10
-Name Accounting Standards Codification
-Section 50
-Paragraph 1
-Subparagraph (b)(3)
-Publisher FASB
-URI https://asc.fasb.org//1943274/2147483443/250-10-50-1
Reference 23: http://www.xbrl.org/2003/role/disclosureRef
-Topic 815
-SubTopic 40
-Name Accounting Standards Codification
-Section 65
-Paragraph 1
-Subparagraph (e)(3)
-Publisher FASB
-URI https://asc.fasb.org//1943274/2147480175/815-40-65-1
Reference 24: http://www.xbrl.org/2003/role/disclosureRef
-Topic 250
-SubTopic 10
-Name Accounting Standards Codification
-Section 50
-Paragraph 7
-Subparagraph (b)
-Publisher FASB
-URI https://asc.fasb.org//1943274/2147483443/250-10-50-7
Reference 25: http://www.xbrl.org/2003/role/disclosureRef
-Topic 220
-SubTopic 10
-Name Accounting Standards Codification
-Section 50
-Paragraph 5
-Publisher FASB
-URI https://asc.fasb.org//1943274/2147482765/220-10-50-5
Reference 26: http://www.xbrl.org/2003/role/disclosureRef
-Topic 830
-SubTopic 30
-Name Accounting Standards Codification
-Section 50
-Paragraph 1
-Publisher FASB
-URI https://asc.fasb.org//1943274/2147481674/830-30-50-1
Reference 27: http://www.xbrl.org/2003/role/disclosureRef
-Topic 830
-SubTopic 30
-Name Accounting Standards Codification
-Section 45
-Paragraph 17
-Publisher FASB
-URI https://asc.fasb.org//1943274/2147481694/830-30-45-17
Reference 28: http://www.xbrl.org/2003/role/disclosureRef
-Topic 830
-SubTopic 30
-Name Accounting Standards Codification
-Section 45
-Paragraph 20
-Subparagraph (a)
-Publisher FASB
-URI https://asc.fasb.org//1943274/2147481694/830-30-45-20
Reference 29: http://www.xbrl.org/2003/role/exampleRef
-Topic 946
-SubTopic 830
-Name Accounting Standards Codification
-Section 55
-Paragraph 11
-Publisher FASB
-URI https://asc.fasb.org//1943274/2147480167/946-830-55-11
Reference 30: http://www.xbrl.org/2003/role/disclosureRef
-Topic 946
-SubTopic 205
-Name Accounting Standards Codification
-Section 45
-Paragraph 3
-Publisher FASB
-URI https://asc.fasb.org//1943274/2147480767/946-205-45-3
Reference 31: http://www.xbrl.org/2003/role/disclosureRef
-Topic 946
-SubTopic 505
-Name Accounting Standards Codification
-Section 50
-Paragraph 3
-Publisher FASB
-URI https://asc.fasb.org//1943274/2147481004/946-505-50-3
Reference 32: http://www.xbrl.org/2003/role/disclosureRef
-Topic 946
-SubTopic 210
-Name Accounting Standards Codification
-Section S99
-Paragraph 1
-Subparagraph (SX 210.6-04(19))
-Publisher FASB
-URI https://asc.fasb.org//1943274/2147479617/946-210-S99-1
Reference 33: http://www.xbrl.org/2003/role/disclosureRef
-Topic 946
-SubTopic 210
-Name Accounting Standards Codification
-Section S99
-Paragraph 2
-Subparagraph (SX 210.6-05(4))
-Publisher FASB
-URI https://asc.fasb.org//1943274/2147479617/946-210-S99-2
Reference 34: http://www.xbrl.org/2009/role/commonPracticeRef
-Topic 946
-SubTopic 220
-Name Accounting Standards Codification
-Section S99
-Paragraph 3
-Subparagraph (SX 210.6-09(4)(b))
-Publisher FASB
-URI https://asc.fasb.org//1943274/2147483575/946-220-S99-3
Reference 35: http://www.xbrl.org/2003/role/disclosureRef
-Topic 946
-SubTopic 220
-Name Accounting Standards Codification
-Section S99
-Paragraph 3
-Subparagraph (SX 210.6-09(6))
-Publisher FASB
-URI https://asc.fasb.org//1943274/2147483575/946-220-S99-3
Reference 36: http://www.xbrl.org/2003/role/disclosureRef
-Topic 946
-SubTopic 220
-Name Accounting Standards Codification
-Section S99
-Paragraph 3
-Subparagraph (SX 210.6-09(7))
-Publisher FASB
-URI https://asc.fasb.org//1943274/2147483575/946-220-S99-3
Reference 37: http://www.xbrl.org/2003/role/disclosureRef
-Topic 505
-SubTopic 10
-Name Accounting Standards Codification
-Section S99
-Paragraph 1
-Subparagraph (SX 210.3-04)
-Publisher FASB
-URI https://asc.fasb.org//1943274/2147480008/505-10-S99-1
Reference 38: http://www.xbrl.org/2009/role/commonPracticeRef
-Topic 235
-SubTopic 10
-Name Accounting Standards Codification
-Section S99
-Paragraph 1
-Subparagraph (SX 210.4-08(g)(1)(ii))
-Publisher FASB
-URI https://asc.fasb.org//1943274/2147480678/235-10-S99-1
Reference 39: http://www.xbrl.org/2009/role/commonPracticeRef
-Topic 323
-SubTopic 10
-Name Accounting Standards Codification
-Section 50
-Paragraph 3
-Subparagraph (c)
-Publisher FASB
-URI https://asc.fasb.org//1943274/2147481687/323-10-50-3
Reference 40: http://www.xbrl.org/2009/role/commonPracticeRef
-Topic 825
-SubTopic 10
-Name Accounting Standards Codification
-Section 50
-Paragraph 28
-Subparagraph (f)
-Publisher FASB
-URI https://asc.fasb.org//1943274/2147482907/825-10-50-28
Reference 41: http://fasb.org/us-gaap/role/ref/legacyRef
-Name Accounting Standards Codification
-Topic 810
-SubTopic 10
-Section 45
-Paragraph 15
-Publisher FASB
-URI https://asc.fasb.org//1943274/2147481231/810-10-45-15
Reference 42: http://fasb.org/us-gaap/role/ref/legacyRef
-Name Accounting Standards Codification
-Topic 810
-SubTopic 10
-Section 45
-Paragraph 16
-Publisher FASB
-URI https://asc.fasb.org//1943274/2147481231/810-10-45-16
Reference 43: http://fasb.org/us-gaap/role/ref/legacyRef
-Name Accounting Standards Codification
-Topic 810
-SubTopic 10
-Section 55
-Paragraph 4I
-Publisher FASB
-URI https://asc.fasb.org//1943274/2147481175/810-10-55-4I
| Name: |
us-gaap_StockholdersEquityIncludingPortionAttributableToNoncontrollingInterest |
| Namespace Prefix: |
us-gaap_ |
| Data Type: |
xbrli:monetaryItemType |
| Balance Type: |
credit |
| Period Type: |
instant |
|
| X |
- References
+ Details
| Name: |
us-gaap_StockholdersEquityIncludingPortionAttributableToNoncontrollingInterestAbstract |
| Namespace Prefix: |
us-gaap_ |
| Data Type: |
xbrli:stringItemType |
| Balance Type: |
na |
| Period Type: |
duration |
|
| X |
- DefinitionThe amount allocated to treasury stock. Treasury stock is common and preferred shares of an entity that were issued, repurchased by the entity, and are held in its treasury. Reference 1: http://fasb.org/us-gaap/role/ref/legacyRef
-Name Accounting Standards Codification
-Topic 505
-SubTopic 30
-Section 50
-Paragraph 4
-Publisher FASB
-URI https://asc.fasb.org//1943274/2147481520/505-30-50-4
Reference 2: http://fasb.org/us-gaap/role/ref/legacyRef
-Name Accounting Standards Codification
-Topic 505
-SubTopic 30
-Section 45
-Paragraph 1
-Publisher FASB
-URI https://asc.fasb.org//1943274/2147481549/505-30-45-1
Reference 3: http://fasb.org/us-gaap/role/ref/legacyRef
-Name Accounting Standards Codification
-Topic 210
-SubTopic 10
-Section S99
-Paragraph 1
-Subparagraph (SX 210.5-02.29,30)
-Publisher FASB
-URI https://asc.fasb.org//1943274/2147480566/210-10-S99-1
| Name: |
us-gaap_TreasuryStockValue |
| Namespace Prefix: |
us-gaap_ |
| Data Type: |
xbrli:monetaryItemType |
| Balance Type: |
debit |
| Period Type: |
instant |
|
v3.23.3
Condensed Consolidated Balance Sheets (Parenthetical) - $ / shares
|
Sep. 30, 2023 |
Dec. 31, 2022 |
| Statement of Financial Position [Abstract] |
|
|
| Common stock, par value |
$ 0.01
|
$ 0.01
|
| Common stock, shares authorized |
42,000,000
|
42,000,000
|
| Common stock, shares issued |
2,484,791
|
2,482,604
|
| Common stock, shares outstanding |
2,484,791
|
2,482,604
|
| Treasury stock, shares |
50,178
|
50,178
|
| X |
- DefinitionFace amount or stated value per share of common stock. Reference 1: http://fasb.org/us-gaap/role/ref/legacyRef
-Topic 210
-SubTopic 10
-Name Accounting Standards Codification
-Section S99
-Paragraph 1
-Subparagraph (SX 210.5-02(29))
-Publisher FASB
-URI https://asc.fasb.org//1943274/2147480566/210-10-S99-1
| Name: |
us-gaap_CommonStockParOrStatedValuePerShare |
| Namespace Prefix: |
us-gaap_ |
| Data Type: |
dtr-types:perShareItemType |
| Balance Type: |
na |
| Period Type: |
instant |
|
| X |
- DefinitionThe maximum number of common shares permitted to be issued by an entity's charter and bylaws. Reference 1: http://www.xbrl.org/2003/role/disclosureRef
-Topic 946
-SubTopic 210
-Name Accounting Standards Codification
-Section S99
-Paragraph 1
-Subparagraph (SX 210.6-04(16)(a))
-Publisher FASB
-URI https://asc.fasb.org//1943274/2147479617/946-210-S99-1
Reference 2: http://fasb.org/us-gaap/role/ref/legacyRef
-Topic 210
-SubTopic 10
-Name Accounting Standards Codification
-Section S99
-Paragraph 1
-Subparagraph (SX 210.5-02(29))
-Publisher FASB
-URI https://asc.fasb.org//1943274/2147480566/210-10-S99-1
| Name: |
us-gaap_CommonStockSharesAuthorized |
| Namespace Prefix: |
us-gaap_ |
| Data Type: |
xbrli:sharesItemType |
| Balance Type: |
na |
| Period Type: |
instant |
|
| X |
- DefinitionTotal number of common shares of an entity that have been sold or granted to shareholders (includes common shares that were issued, repurchased and remain in the treasury). These shares represent capital invested by the firm's shareholders and owners, and may be all or only a portion of the number of shares authorized. Shares issued include shares outstanding and shares held in the treasury. Reference 1: http://fasb.org/us-gaap/role/ref/legacyRef
-Topic 210
-SubTopic 10
-Name Accounting Standards Codification
-Section S99
-Paragraph 1
-Subparagraph (SX 210.5-02(29))
-Publisher FASB
-URI https://asc.fasb.org//1943274/2147480566/210-10-S99-1
| Name: |
us-gaap_CommonStockSharesIssued |
| Namespace Prefix: |
us-gaap_ |
| Data Type: |
xbrli:sharesItemType |
| Balance Type: |
na |
| Period Type: |
instant |
|
| X |
- DefinitionNumber of shares of common stock outstanding. Common stock represent the ownership interest in a corporation. Reference 1: http://fasb.org/us-gaap/role/ref/legacyRef
-Name Accounting Standards Codification
-Section 50
-Paragraph 2
-SubTopic 10
-Topic 505
-Publisher FASB
-URI https://asc.fasb.org//1943274/2147481112/505-10-50-2
Reference 2: http://www.xbrl.org/2003/role/disclosureRef
-Topic 946
-SubTopic 210
-Name Accounting Standards Codification
-Section S99
-Paragraph 2
-Subparagraph (SX 210.6-05(4))
-Publisher FASB
-URI https://asc.fasb.org//1943274/2147479617/946-210-S99-2
Reference 3: http://www.xbrl.org/2009/role/commonPracticeRef
-Topic 946
-SubTopic 220
-Name Accounting Standards Codification
-Section S99
-Paragraph 3
-Subparagraph (SX 210.6-09(4)(b))
-Publisher FASB
-URI https://asc.fasb.org//1943274/2147483575/946-220-S99-3
Reference 4: http://www.xbrl.org/2003/role/disclosureRef
-Topic 946
-SubTopic 210
-Name Accounting Standards Codification
-Section S99
-Paragraph 1
-Subparagraph (SX 210.6-04(16)(a))
-Publisher FASB
-URI https://asc.fasb.org//1943274/2147479617/946-210-S99-1
Reference 5: http://www.xbrl.org/2009/role/commonPracticeRef
-Topic 946
-SubTopic 220
-Name Accounting Standards Codification
-Section S99
-Paragraph 3
-Subparagraph (SX 210.6-09(7))
-Publisher FASB
-URI https://asc.fasb.org//1943274/2147483575/946-220-S99-3
Reference 6: http://fasb.org/us-gaap/role/ref/legacyRef
-Topic 210
-SubTopic 10
-Name Accounting Standards Codification
-Section S99
-Paragraph 1
-Subparagraph (SX 210.5-02(29))
-Publisher FASB
-URI https://asc.fasb.org//1943274/2147480566/210-10-S99-1
| Name: |
us-gaap_CommonStockSharesOutstanding |
| Namespace Prefix: |
us-gaap_ |
| Data Type: |
xbrli:sharesItemType |
| Balance Type: |
na |
| Period Type: |
instant |
|
| X |
- References
+ Details
| Name: |
us-gaap_StatementOfFinancialPositionAbstract |
| Namespace Prefix: |
us-gaap_ |
| Data Type: |
xbrli:stringItemType |
| Balance Type: |
na |
| Period Type: |
duration |
|
| X |
- DefinitionNumber of previously issued common shares repurchased by the issuing entity and held in treasury. Reference 1: http://fasb.org/us-gaap/role/ref/legacyRef
-Name Accounting Standards Codification
-Topic 505
-SubTopic 30
-Section 45
-Paragraph 1
-Publisher FASB
-URI https://asc.fasb.org//1943274/2147481549/505-30-45-1
| Name: |
us-gaap_TreasuryStockCommonShares |
| Namespace Prefix: |
us-gaap_ |
| Data Type: |
xbrli:sharesItemType |
| Balance Type: |
na |
| Period Type: |
instant |
|
v3.23.3
Condensed Consolidated Statements of Operations (Unaudited) - USD ($)
shares in Thousands, $ in Thousands |
3 Months Ended |
9 Months Ended |
Sep. 30, 2023 |
Sep. 30, 2022 |
Sep. 30, 2023 |
Sep. 30, 2022 |
| Income Statement [Abstract] |
|
|
|
|
|
| Revenue |
|
$ 2,087
|
$ 1,783
|
$ 5,809
|
$ 5,155
|
| COGS |
|
537
|
568
|
1,453
|
1,436
|
| Gross profit |
|
1,550
|
1,215
|
4,356
|
3,719
|
| Operating expenses: |
|
|
|
|
|
| Research and development (R&D) expense |
|
212
|
227
|
614
|
637
|
| Selling, general and administrative (SG&A) expense |
|
1,330
|
1,198
|
3,746
|
3,585
|
| Impairment of software |
|
|
|
|
51
|
| Total operating expenses |
|
1,542
|
1,425
|
4,360
|
4,273
|
| Operating (loss) income |
|
8
|
(210)
|
(4)
|
(554)
|
| Interest income (expense), net |
|
19
|
|
46
|
(1)
|
| Income (loss) before income taxes |
|
27
|
(210)
|
42
|
(555)
|
| Income tax expense |
|
|
|
|
|
| Net income (loss) |
|
27
|
(210)
|
42
|
(555)
|
| Non-controlling interest share of net income |
|
(3)
|
|
(7)
|
(1)
|
| Net income (loss) attributable to Acorn Energy, Inc. stockholders |
|
$ 24
|
$ (210)
|
$ 35
|
$ (556)
|
| Basic net income (loss) per share |
[1] |
$ 0.01
|
$ (0.08)
|
$ 0.01
|
$ (0.22)
|
| Diluted net income (loss) per share |
[1] |
$ 0.01
|
$ (0.08)
|
$ 0.01
|
$ (0.22)
|
| Weighted average number of shares outstanding attributable to Acorn Energy, Inc. stockholders – basic and diluted |
|
|
|
|
|
| Basic |
[1] |
2,485
|
2,481
|
2,484
|
2,481
|
| Diluted |
[1] |
2,532
|
2,481
|
2,506
|
2,481
|
|
|
| X |
- DefinitionAmount of impairment loss from capitalized computer software costs. Reference 1: http://fasb.org/us-gaap/role/ref/legacyRef
-Topic 985
-SubTopic 20
-Name Accounting Standards Codification
-Section 50
-Paragraph 2
-Publisher FASB
-URI https://asc.fasb.org//1943274/2147481283/985-20-50-2
Reference 2: http://fasb.org/us-gaap/role/ref/legacyRef
-Name Accounting Standards Codification
-Section 50
-Paragraph 1
-Subparagraph (b)(2)
-SubTopic 20
-Topic 985
-Publisher FASB
-URI https://asc.fasb.org//1943274/2147481283/985-20-50-1
| Name: |
us-gaap_CapitalizedComputerSoftwareImpairments1 |
| Namespace Prefix: |
us-gaap_ |
| Data Type: |
xbrli:monetaryItemType |
| Balance Type: |
debit |
| Period Type: |
duration |
|
| X |
- DefinitionThe aggregate costs related to goods produced and sold and services rendered by an entity during the reporting period. This excludes costs incurred during the reporting period related to financial services rendered and other revenue generating activities. Reference 1: http://www.xbrl.org/2003/role/disclosureRef
-Topic 924
-SubTopic 10
-Name Accounting Standards Codification
-Section S99
-Paragraph 1
-Subparagraph (SAB Topic 11.L)
-Publisher FASB
-URI https://asc.fasb.org//1943274/2147479941/924-10-S99-1
Reference 2: http://fasb.org/us-gaap/role/ref/legacyRef
-Topic 220
-SubTopic 10
-Name Accounting Standards Codification
-Section S99
-Paragraph 2
-Subparagraph (SX 210.5-03.2(a),(d))
-Publisher FASB
-URI https://asc.fasb.org//1943274/2147483621/220-10-S99-2
| Name: |
us-gaap_CostOfGoodsAndServicesSold |
| Namespace Prefix: |
us-gaap_ |
| Data Type: |
xbrli:monetaryItemType |
| Balance Type: |
debit |
| Period Type: |
duration |
|
| X |
- DefinitionThe amount of net income (loss) for the period per each share of common stock or unit outstanding during the reporting period. Reference 1: http://www.xbrl.org/2003/role/disclosureRef
-Topic 250
-SubTopic 10
-Name Accounting Standards Codification
-Section 50
-Paragraph 3
-Publisher FASB
-URI https://asc.fasb.org//1943274/2147483443/250-10-50-3
Reference 2: http://www.xbrl.org/2003/role/disclosureRef
-Topic 260
-SubTopic 10
-Name Accounting Standards Codification
-Section 55
-Paragraph 15
-Publisher FASB
-URI https://asc.fasb.org//1943274/2147482635/260-10-55-15
Reference 3: http://www.xbrl.org/2003/role/disclosureRef
-Topic 815
-SubTopic 40
-Name Accounting Standards Codification
-Section 65
-Paragraph 1
-Subparagraph (e)(4)
-Publisher FASB
-URI https://asc.fasb.org//1943274/2147480175/815-40-65-1
Reference 4: http://www.xbrl.org/2003/role/disclosureRef
-Topic 815
-SubTopic 40
-Name Accounting Standards Codification
-Section 65
-Paragraph 1
-Subparagraph (f)
-Publisher FASB
-URI https://asc.fasb.org//1943274/2147480175/815-40-65-1
Reference 5: http://www.xbrl.org/2003/role/disclosureRef
-Topic 250
-SubTopic 10
-Name Accounting Standards Codification
-Section 50
-Paragraph 11
-Subparagraph (a)
-Publisher FASB
-URI https://asc.fasb.org//1943274/2147483443/250-10-50-11
Reference 6: http://www.xbrl.org/2003/role/disclosureRef
-Topic 250
-SubTopic 10
-Name Accounting Standards Codification
-Section 50
-Paragraph 11
-Subparagraph (b)
-Publisher FASB
-URI https://asc.fasb.org//1943274/2147483443/250-10-50-11
Reference 7: http://www.xbrl.org/2003/role/disclosureRef
-Topic 250
-SubTopic 10
-Name Accounting Standards Codification
-Section 50
-Paragraph 7
-Subparagraph (a)
-Publisher FASB
-URI https://asc.fasb.org//1943274/2147483443/250-10-50-7
Reference 8: http://www.xbrl.org/2003/role/disclosureRef
-Topic 260
-SubTopic 10
-Name Accounting Standards Codification
-Section 45
-Paragraph 2
-Publisher FASB
-URI https://asc.fasb.org//1943274/2147482689/260-10-45-2
Reference 9: http://www.xbrl.org/2003/role/disclosureRef
-Topic 260
-SubTopic 10
-Name Accounting Standards Codification
-Section 45
-Paragraph 60B
-Subparagraph (d)
-Publisher FASB
-URI https://asc.fasb.org//1943274/2147482689/260-10-45-60B
Reference 10: http://www.xbrl.org/2003/role/disclosureRef
-Topic 250
-SubTopic 10
-Name Accounting Standards Codification
-Section 50
-Paragraph 4
-Publisher FASB
-URI https://asc.fasb.org//1943274/2147483443/250-10-50-4
Reference 11: http://www.xbrl.org/2003/role/disclosureRef
-Topic 260
-SubTopic 10
-Name Accounting Standards Codification
-Section 50
-Paragraph 1
-Subparagraph (a)
-Publisher FASB
-URI https://asc.fasb.org//1943274/2147482662/260-10-50-1
Reference 12: http://www.xbrl.org/2003/role/disclosureRef
-Topic 260
-SubTopic 10
-Name Accounting Standards Codification
-Section 45
-Paragraph 10
-Publisher FASB
-URI https://asc.fasb.org//1943274/2147482689/260-10-45-10
Reference 13: http://www.xbrl.org/2003/role/disclosureRef
-Topic 220
-SubTopic 10
-Name Accounting Standards Codification
-Section S99
-Paragraph 2
-Subparagraph (SX 210.5-03(25))
-Publisher FASB
-URI https://asc.fasb.org//1943274/2147483621/220-10-S99-2
Reference 14: http://www.xbrl.org/2003/role/disclosureRef
-Topic 942
-SubTopic 220
-Name Accounting Standards Codification
-Section S99
-Paragraph 1
-Subparagraph (SX 210.9-04(27))
-Publisher FASB
-URI https://asc.fasb.org//1943274/2147483589/942-220-S99-1
Reference 15: http://www.xbrl.org/2003/role/disclosureRef
-Topic 944
-SubTopic 220
-Name Accounting Standards Codification
-Section S99
-Paragraph 1
-Subparagraph (SX 210.7-04(23))
-Publisher FASB
-URI https://asc.fasb.org//1943274/2147483586/944-220-S99-1
Reference 16: http://www.xbrl.org/2003/role/exampleRef
-Topic 260
-SubTopic 10
-Name Accounting Standards Codification
-Section 55
-Paragraph 52
-Publisher FASB
-URI https://asc.fasb.org//1943274/2147482635/260-10-55-52
Reference 17: http://www.xbrl.org/2003/role/disclosureRef
-Topic 260
-SubTopic 10
-Name Accounting Standards Codification
-Section 45
-Paragraph 7
-Publisher FASB
-URI https://asc.fasb.org//1943274/2147482689/260-10-45-7
| Name: |
us-gaap_EarningsPerShareBasic |
| Namespace Prefix: |
us-gaap_ |
| Data Type: |
dtr-types:perShareItemType |
| Balance Type: |
na |
| Period Type: |
duration |
|
| X |
- DefinitionThe amount of net income (loss) for the period available to each share of common stock or common unit outstanding during the reporting period and to each share or unit that would have been outstanding assuming the issuance of common shares or units for all dilutive potential common shares or units outstanding during the reporting period. Reference 1: http://www.xbrl.org/2003/role/disclosureRef
-Topic 250
-SubTopic 10
-Name Accounting Standards Codification
-Section 50
-Paragraph 3
-Publisher FASB
-URI https://asc.fasb.org//1943274/2147483443/250-10-50-3
Reference 2: http://www.xbrl.org/2003/role/disclosureRef
-Topic 260
-SubTopic 10
-Name Accounting Standards Codification
-Section 55
-Paragraph 15
-Publisher FASB
-URI https://asc.fasb.org//1943274/2147482635/260-10-55-15
Reference 3: http://www.xbrl.org/2003/role/disclosureRef
-Topic 815
-SubTopic 40
-Name Accounting Standards Codification
-Section 65
-Paragraph 1
-Subparagraph (e)(4)
-Publisher FASB
-URI https://asc.fasb.org//1943274/2147480175/815-40-65-1
Reference 4: http://www.xbrl.org/2003/role/disclosureRef
-Topic 815
-SubTopic 40
-Name Accounting Standards Codification
-Section 65
-Paragraph 1
-Subparagraph (f)
-Publisher FASB
-URI https://asc.fasb.org//1943274/2147480175/815-40-65-1
Reference 5: http://www.xbrl.org/2003/role/disclosureRef
-Topic 250
-SubTopic 10
-Name Accounting Standards Codification
-Section 50
-Paragraph 11
-Subparagraph (a)
-Publisher FASB
-URI https://asc.fasb.org//1943274/2147483443/250-10-50-11
Reference 6: http://www.xbrl.org/2003/role/disclosureRef
-Topic 250
-SubTopic 10
-Name Accounting Standards Codification
-Section 50
-Paragraph 11
-Subparagraph (b)
-Publisher FASB
-URI https://asc.fasb.org//1943274/2147483443/250-10-50-11
Reference 7: http://www.xbrl.org/2003/role/disclosureRef
-Topic 250
-SubTopic 10
-Name Accounting Standards Codification
-Section 50
-Paragraph 7
-Subparagraph (a)
-Publisher FASB
-URI https://asc.fasb.org//1943274/2147483443/250-10-50-7
Reference 8: http://www.xbrl.org/2003/role/disclosureRef
-Topic 260
-SubTopic 10
-Name Accounting Standards Codification
-Section 45
-Paragraph 2
-Publisher FASB
-URI https://asc.fasb.org//1943274/2147482689/260-10-45-2
Reference 9: http://www.xbrl.org/2003/role/disclosureRef
-Topic 260
-SubTopic 10
-Name Accounting Standards Codification
-Section 45
-Paragraph 60B
-Subparagraph (d)
-Publisher FASB
-URI https://asc.fasb.org//1943274/2147482689/260-10-45-60B
Reference 10: http://www.xbrl.org/2003/role/disclosureRef
-Topic 250
-SubTopic 10
-Name Accounting Standards Codification
-Section 50
-Paragraph 4
-Publisher FASB
-URI https://asc.fasb.org//1943274/2147483443/250-10-50-4
Reference 11: http://www.xbrl.org/2003/role/disclosureRef
-Topic 260
-SubTopic 10
-Name Accounting Standards Codification
-Section 50
-Paragraph 1
-Subparagraph (a)
-Publisher FASB
-URI https://asc.fasb.org//1943274/2147482662/260-10-50-1
Reference 12: http://www.xbrl.org/2003/role/disclosureRef
-Topic 220
-SubTopic 10
-Name Accounting Standards Codification
-Section S99
-Paragraph 2
-Subparagraph (SX 210.5-03(25))
-Publisher FASB
-URI https://asc.fasb.org//1943274/2147483621/220-10-S99-2
Reference 13: http://www.xbrl.org/2003/role/disclosureRef
-Topic 942
-SubTopic 220
-Name Accounting Standards Codification
-Section S99
-Paragraph 1
-Subparagraph (SX 210.9-04(27))
-Publisher FASB
-URI https://asc.fasb.org//1943274/2147483589/942-220-S99-1
Reference 14: http://www.xbrl.org/2003/role/disclosureRef
-Topic 944
-SubTopic 220
-Name Accounting Standards Codification
-Section S99
-Paragraph 1
-Subparagraph (SX 210.7-04(23))
-Publisher FASB
-URI https://asc.fasb.org//1943274/2147483586/944-220-S99-1
Reference 15: http://www.xbrl.org/2003/role/exampleRef
-Topic 260
-SubTopic 10
-Name Accounting Standards Codification
-Section 55
-Paragraph 52
-Publisher FASB
-URI https://asc.fasb.org//1943274/2147482635/260-10-55-52
Reference 16: http://www.xbrl.org/2003/role/disclosureRef
-Topic 260
-SubTopic 10
-Name Accounting Standards Codification
-Section 45
-Paragraph 7
-Publisher FASB
-URI https://asc.fasb.org//1943274/2147482689/260-10-45-7
| Name: |
us-gaap_EarningsPerShareDiluted |
| Namespace Prefix: |
us-gaap_ |
| Data Type: |
dtr-types:perShareItemType |
| Balance Type: |
na |
| Period Type: |
duration |
|
| X |
- DefinitionAggregate revenue less cost of goods and services sold or operating expenses directly attributable to the revenue generation activity. Reference 1: http://www.xbrl.org/2003/role/disclosureRef
-Topic 235
-SubTopic 10
-Name Accounting Standards Codification
-Section S99
-Paragraph 1
-Subparagraph (SX 210.4-08(g)(1)(ii))
-Publisher FASB
-URI https://asc.fasb.org//1943274/2147480678/235-10-S99-1
Reference 2: http://www.xbrl.org/2003/role/disclosureRef
-Topic 323
-SubTopic 10
-Name Accounting Standards Codification
-Section 50
-Paragraph 3
-Subparagraph (c)
-Publisher FASB
-URI https://asc.fasb.org//1943274/2147481687/323-10-50-3
Reference 3: http://www.xbrl.org/2003/role/disclosureRef
-Topic 825
-SubTopic 10
-Name Accounting Standards Codification
-Section 50
-Paragraph 28
-Subparagraph (f)
-Publisher FASB
-URI https://asc.fasb.org//1943274/2147482907/825-10-50-28
Reference 4: http://www.xbrl.org/2003/role/disclosureRef
-Topic 280
-SubTopic 10
-Name Accounting Standards Codification
-Section 50
-Paragraph 22
-Publisher FASB
-URI https://asc.fasb.org//1943274/2147482810/280-10-50-22
Reference 5: http://www.xbrl.org/2003/role/disclosureRef
-Topic 470
-SubTopic 10
-Name Accounting Standards Codification
-Section S99
-Paragraph 1A
-Subparagraph (SX 210.13-01(a)(4)(i))
-Publisher FASB
-URI https://asc.fasb.org//1943274/2147480097/470-10-S99-1A
Reference 6: http://www.xbrl.org/2009/role/commonPracticeRef
-Topic 470
-SubTopic 10
-Name Accounting Standards Codification
-Section S99
-Paragraph 1A
-Subparagraph (SX 210.13-01(a)(4)(ii))
-Publisher FASB
-URI https://asc.fasb.org//1943274/2147480097/470-10-S99-1A
Reference 7: http://www.xbrl.org/2003/role/disclosureRef
-Topic 470
-SubTopic 10
-Name Accounting Standards Codification
-Section S99
-Paragraph 1A
-Subparagraph (SX 210.13-01(a)(4)(iii)(A))
-Publisher FASB
-URI https://asc.fasb.org//1943274/2147480097/470-10-S99-1A
Reference 8: http://www.xbrl.org/2003/role/disclosureRef
-Topic 470
-SubTopic 10
-Name Accounting Standards Codification
-Section S99
-Paragraph 1A
-Subparagraph (SX 210.13-01(a)(4)(iv))
-Publisher FASB
-URI https://asc.fasb.org//1943274/2147480097/470-10-S99-1A
Reference 9: http://www.xbrl.org/2003/role/disclosureRef
-Topic 470
-SubTopic 10
-Name Accounting Standards Codification
-Section S99
-Paragraph 1A
-Subparagraph (SX 210.13-01(a)(5))
-Publisher FASB
-URI https://asc.fasb.org//1943274/2147480097/470-10-S99-1A
Reference 10: http://www.xbrl.org/2003/role/disclosureRef
-Topic 470
-SubTopic 10
-Name Accounting Standards Codification
-Section S99
-Paragraph 1B
-Subparagraph (SX 210.13-02(a)(4)(i))
-Publisher FASB
-URI https://asc.fasb.org//1943274/2147480097/470-10-S99-1B
Reference 11: http://www.xbrl.org/2003/role/disclosureRef
-Topic 470
-SubTopic 10
-Name Accounting Standards Codification
-Section S99
-Paragraph 1B
-Subparagraph (SX 210.13-02(a)(4)(iii)(A))
-Publisher FASB
-URI https://asc.fasb.org//1943274/2147480097/470-10-S99-1B
Reference 12: http://www.xbrl.org/2003/role/disclosureRef
-Topic 470
-SubTopic 10
-Name Accounting Standards Codification
-Section S99
-Paragraph 1B
-Subparagraph (SX 210.13-02(a)(4)(iii)(B))
-Publisher FASB
-URI https://asc.fasb.org//1943274/2147480097/470-10-S99-1B
Reference 13: http://www.xbrl.org/2003/role/disclosureRef
-Topic 470
-SubTopic 10
-Name Accounting Standards Codification
-Section S99
-Paragraph 1B
-Subparagraph (SX 210.13-02(a)(4)(iv))
-Publisher FASB
-URI https://asc.fasb.org//1943274/2147480097/470-10-S99-1B
Reference 14: http://www.xbrl.org/2003/role/disclosureRef
-Topic 470
-SubTopic 10
-Name Accounting Standards Codification
-Section S99
-Paragraph 1B
-Subparagraph (SX 210.13-02(a)(5))
-Publisher FASB
-URI https://asc.fasb.org//1943274/2147480097/470-10-S99-1B
Reference 15: http://www.xbrl.org/2003/role/disclosureRef
-Topic 280
-SubTopic 10
-Name Accounting Standards Codification
-Section 50
-Paragraph 30
-Subparagraph (b)
-Publisher FASB
-URI https://asc.fasb.org//1943274/2147482810/280-10-50-30
Reference 16: http://www.xbrl.org/2003/role/disclosureRef
-Topic 280
-SubTopic 10
-Name Accounting Standards Codification
-Section 50
-Paragraph 32
-Subparagraph (f)
-Publisher FASB
-URI https://asc.fasb.org//1943274/2147482810/280-10-50-32
Reference 17: http://www.xbrl.org/2003/role/exampleRef
-Topic 280
-SubTopic 10
-Name Accounting Standards Codification
-Section 50
-Paragraph 31
-Publisher FASB
-URI https://asc.fasb.org//1943274/2147482810/280-10-50-31
Reference 18: http://www.xbrl.org/2003/role/disclosureRef
-Topic 280
-SubTopic 10
-Name Accounting Standards Codification
-Section 50
-Paragraph 32
-Subparagraph (c)
-Publisher FASB
-URI https://asc.fasb.org//1943274/2147482810/280-10-50-32
Reference 19: http://fasb.org/us-gaap/role/ref/legacyRef
-Topic 220
-SubTopic 10
-Name Accounting Standards Codification
-Section S99
-Paragraph 2
-Subparagraph (SX 210.5-03.1,2)
-Publisher FASB
-URI https://asc.fasb.org//1943274/2147483621/220-10-S99-2
| Name: |
us-gaap_GrossProfit |
| Namespace Prefix: |
us-gaap_ |
| Data Type: |
xbrli:monetaryItemType |
| Balance Type: |
credit |
| Period Type: |
duration |
|
| X |
- References
+ Details
| Name: |
us-gaap_IncomeStatementAbstract |
| Namespace Prefix: |
us-gaap_ |
| Data Type: |
xbrli:stringItemType |
| Balance Type: |
na |
| Period Type: |
duration |
|
| X |
- DefinitionThe net amount of operating interest income (expense). Reference 1: http://fasb.org/us-gaap/role/ref/legacyRef
-Topic 942
-SubTopic 220
-Name Accounting Standards Codification
-Section S99
-Paragraph 1
-Subparagraph (SX 210.9-04.10)
-Publisher FASB
-URI https://asc.fasb.org//1943274/2147483589/942-220-S99-1
| Name: |
us-gaap_InterestIncomeExpenseNet |
| Namespace Prefix: |
us-gaap_ |
| Data Type: |
xbrli:monetaryItemType |
| Balance Type: |
credit |
| Period Type: |
duration |
|
| X |
- DefinitionThe portion of profit or loss for the period, net of income taxes, which is attributable to the parent. Reference 1: http://www.xbrl.org/2003/role/disclosureRef
-Topic 235
-SubTopic 10
-Name Accounting Standards Codification
-Section S99
-Paragraph 1
-Subparagraph (SX 210.4-08(g)(1)(ii))
-Publisher FASB
-URI https://asc.fasb.org//1943274/2147480678/235-10-S99-1
Reference 2: http://www.xbrl.org/2003/role/disclosureRef
-Topic 323
-SubTopic 10
-Name Accounting Standards Codification
-Section 50
-Paragraph 3
-Subparagraph (c)
-Publisher FASB
-URI https://asc.fasb.org//1943274/2147481687/323-10-50-3
Reference 3: http://www.xbrl.org/2003/role/disclosureRef
-Topic 825
-SubTopic 10
-Name Accounting Standards Codification
-Section 50
-Paragraph 28
-Subparagraph (f)
-Publisher FASB
-URI https://asc.fasb.org//1943274/2147482907/825-10-50-28
Reference 4: http://www.xbrl.org/2003/role/disclosureRef
-Topic 220
-SubTopic 10
-Name Accounting Standards Codification
-Section 50
-Paragraph 6
-Publisher FASB
-URI https://asc.fasb.org//1943274/2147482765/220-10-50-6
Reference 5: http://www.xbrl.org/2003/role/disclosureRef
-Topic 250
-SubTopic 10
-Name Accounting Standards Codification
-Section 50
-Paragraph 3
-Publisher FASB
-URI https://asc.fasb.org//1943274/2147483443/250-10-50-3
Reference 6: http://www.xbrl.org/2003/role/disclosureRef
-Topic 250
-SubTopic 10
-Name Accounting Standards Codification
-Section 50
-Paragraph 1
-Subparagraph (b)(2)
-Publisher FASB
-URI https://asc.fasb.org//1943274/2147483443/250-10-50-1
Reference 7: http://www.xbrl.org/2003/role/disclosureRef
-Topic 815
-SubTopic 40
-Name Accounting Standards Codification
-Section 65
-Paragraph 1
-Subparagraph (f)
-Publisher FASB
-URI https://asc.fasb.org//1943274/2147480175/815-40-65-1
Reference 8: http://www.xbrl.org/2003/role/disclosureRef
-Topic 250
-SubTopic 10
-Name Accounting Standards Codification
-Section 50
-Paragraph 8
-Publisher FASB
-URI https://asc.fasb.org//1943274/2147483443/250-10-50-8
Reference 9: http://www.xbrl.org/2003/role/disclosureRef
-Topic 250
-SubTopic 10
-Name Accounting Standards Codification
-Section 50
-Paragraph 9
-Publisher FASB
-URI https://asc.fasb.org//1943274/2147483443/250-10-50-9
Reference 10: http://www.xbrl.org/2003/role/disclosureRef
-Topic 250
-SubTopic 10
-Name Accounting Standards Codification
-Section 50
-Paragraph 11
-Subparagraph (a)
-Publisher FASB
-URI https://asc.fasb.org//1943274/2147483443/250-10-50-11
Reference 11: http://www.xbrl.org/2003/role/disclosureRef
-Topic 250
-SubTopic 10
-Name Accounting Standards Codification
-Section 50
-Paragraph 11
-Subparagraph (b)
-Publisher FASB
-URI https://asc.fasb.org//1943274/2147483443/250-10-50-11
Reference 12: http://www.xbrl.org/2003/role/disclosureRef
-Topic 250
-SubTopic 10
-Name Accounting Standards Codification
-Section 50
-Paragraph 4
-Publisher FASB
-URI https://asc.fasb.org//1943274/2147483443/250-10-50-4
Reference 13: http://www.xbrl.org/2003/role/exampleRef
-Topic 946
-SubTopic 830
-Name Accounting Standards Codification
-Section 55
-Paragraph 10
-Publisher FASB
-URI https://asc.fasb.org//1943274/2147480167/946-830-55-10
Reference 14: http://www.xbrl.org/2003/role/disclosureRef
-Topic 946
-SubTopic 220
-Name Accounting Standards Codification
-Section 45
-Paragraph 7
-Publisher FASB
-URI https://asc.fasb.org//1943274/2147483581/946-220-45-7
Reference 15: http://www.xbrl.org/2003/role/disclosureRef
-Topic 944
-SubTopic 220
-Name Accounting Standards Codification
-Section S99
-Paragraph 1
-Subparagraph (SX 210.7-04(18))
-Publisher FASB
-URI https://asc.fasb.org//1943274/2147483586/944-220-S99-1
Reference 16: http://www.xbrl.org/2003/role/disclosureRef
-Topic 280
-SubTopic 10
-Name Accounting Standards Codification
-Section 50
-Paragraph 22
-Publisher FASB
-URI https://asc.fasb.org//1943274/2147482810/280-10-50-22
Reference 17: http://www.xbrl.org/2003/role/disclosureRef
-Topic 946
-SubTopic 220
-Name Accounting Standards Codification
-Section S99
-Paragraph 1
-Subparagraph (SX 210.6-07(9))
-Publisher FASB
-URI https://asc.fasb.org//1943274/2147483575/946-220-S99-1
Reference 18: http://www.xbrl.org/2003/role/disclosureRef
-Topic 946
-SubTopic 220
-Name Accounting Standards Codification
-Section S99
-Paragraph 3
-Subparagraph (SX 210.6-09(1)(d))
-Publisher FASB
-URI https://asc.fasb.org//1943274/2147483575/946-220-S99-3
Reference 19: http://www.xbrl.org/2003/role/disclosureRef
-Topic 470
-SubTopic 10
-Name Accounting Standards Codification
-Section S99
-Paragraph 1A
-Subparagraph (SX 210.13-01(a)(4)(i))
-Publisher FASB
-URI https://asc.fasb.org//1943274/2147480097/470-10-S99-1A
Reference 20: http://www.xbrl.org/2009/role/commonPracticeRef
-Topic 470
-SubTopic 10
-Name Accounting Standards Codification
-Section S99
-Paragraph 1A
-Subparagraph (SX 210.13-01(a)(4)(ii))
-Publisher FASB
-URI https://asc.fasb.org//1943274/2147480097/470-10-S99-1A
Reference 21: http://www.xbrl.org/2003/role/disclosureRef
-Topic 470
-SubTopic 10
-Name Accounting Standards Codification
-Section S99
-Paragraph 1A
-Subparagraph (SX 210.13-01(a)(4)(iii)(A))
-Publisher FASB
-URI https://asc.fasb.org//1943274/2147480097/470-10-S99-1A
Reference 22: http://www.xbrl.org/2003/role/disclosureRef
-Topic 470
-SubTopic 10
-Name Accounting Standards Codification
-Section S99
-Paragraph 1A
-Subparagraph (SX 210.13-01(a)(4)(iv))
-Publisher FASB
-URI https://asc.fasb.org//1943274/2147480097/470-10-S99-1A
Reference 23: http://www.xbrl.org/2003/role/disclosureRef
-Topic 470
-SubTopic 10
-Name Accounting Standards Codification
-Section S99
-Paragraph 1A
-Subparagraph (SX 210.13-01(a)(5))
-Publisher FASB
-URI https://asc.fasb.org//1943274/2147480097/470-10-S99-1A
Reference 24: http://www.xbrl.org/2003/role/disclosureRef
-Topic 470
-SubTopic 10
-Name Accounting Standards Codification
-Section S99
-Paragraph 1B
-Subparagraph (SX 210.13-02(a)(4)(i))
-Publisher FASB
-URI https://asc.fasb.org//1943274/2147480097/470-10-S99-1B
Reference 25: http://www.xbrl.org/2003/role/disclosureRef
-Topic 470
-SubTopic 10
-Name Accounting Standards Codification
-Section S99
-Paragraph 1B
-Subparagraph (SX 210.13-02(a)(4)(iii)(A))
-Publisher FASB
-URI https://asc.fasb.org//1943274/2147480097/470-10-S99-1B
Reference 26: http://www.xbrl.org/2003/role/disclosureRef
-Topic 470
-SubTopic 10
-Name Accounting Standards Codification
-Section S99
-Paragraph 1B
-Subparagraph (SX 210.13-02(a)(4)(iii)(B))
-Publisher FASB
-URI https://asc.fasb.org//1943274/2147480097/470-10-S99-1B
Reference 27: http://www.xbrl.org/2003/role/disclosureRef
-Topic 470
-SubTopic 10
-Name Accounting Standards Codification
-Section S99
-Paragraph 1B
-Subparagraph (SX 210.13-02(a)(4)(iv))
-Publisher FASB
-URI https://asc.fasb.org//1943274/2147480097/470-10-S99-1B
Reference 28: http://www.xbrl.org/2003/role/disclosureRef
-Topic 470
-SubTopic 10
-Name Accounting Standards Codification
-Section S99
-Paragraph 1B
-Subparagraph (SX 210.13-02(a)(5))
-Publisher FASB
-URI https://asc.fasb.org//1943274/2147480097/470-10-S99-1B
Reference 29: http://www.xbrl.org/2003/role/disclosureRef
-Topic 280
-SubTopic 10
-Name Accounting Standards Codification
-Section 50
-Paragraph 30
-Subparagraph (b)
-Publisher FASB
-URI https://asc.fasb.org//1943274/2147482810/280-10-50-30
Reference 30: http://www.xbrl.org/2003/role/disclosureRef
-Topic 280
-SubTopic 10
-Name Accounting Standards Codification
-Section 50
-Paragraph 32
-Subparagraph (f)
-Publisher FASB
-URI https://asc.fasb.org//1943274/2147482810/280-10-50-32
Reference 31: http://www.xbrl.org/2003/role/disclosureRef
-Topic 260
-SubTopic 10
-Name Accounting Standards Codification
-Section 45
-Paragraph 60B
-Subparagraph (a)
-Publisher FASB
-URI https://asc.fasb.org//1943274/2147482689/260-10-45-60B
Reference 32: http://www.xbrl.org/2003/role/exampleRef
-Topic 280
-SubTopic 10
-Name Accounting Standards Codification
-Section 50
-Paragraph 31
-Publisher FASB
-URI https://asc.fasb.org//1943274/2147482810/280-10-50-31
Reference 33: http://www.xbrl.org/2003/role/disclosureRef
-Topic 280
-SubTopic 10
-Name Accounting Standards Codification
-Section 50
-Paragraph 32
-Subparagraph (c)
-Publisher FASB
-URI https://asc.fasb.org//1943274/2147482810/280-10-50-32
Reference 34: http://www.xbrl.org/2003/role/disclosureRef
-Topic 205
-SubTopic 20
-Name Accounting Standards Codification
-Section 50
-Paragraph 7
-Publisher FASB
-URI https://asc.fasb.org//1943274/2147483499/205-20-50-7
Reference 35: http://fasb.org/us-gaap/role/ref/legacyRef
-Topic 230
-SubTopic 10
-Name Accounting Standards Codification
-Section 45
-Paragraph 28
-Publisher FASB
-URI https://asc.fasb.org//1943274/2147482740/230-10-45-28
Reference 36: http://www.xbrl.org/2003/role/disclosureRef
-Topic 220
-SubTopic 10
-Name Accounting Standards Codification
-Section 45
-Paragraph 1A
-Subparagraph (a)
-Publisher FASB
-URI https://asc.fasb.org//1943274/2147482790/220-10-45-1A
Reference 37: http://www.xbrl.org/2003/role/disclosureRef
-Topic 220
-SubTopic 10
-Name Accounting Standards Codification
-Section 45
-Paragraph 1B
-Subparagraph (a)
-Publisher FASB
-URI https://asc.fasb.org//1943274/2147482790/220-10-45-1B
Reference 38: http://fasb.org/us-gaap/role/ref/legacyRef
-Topic 220
-SubTopic 10
-Name Accounting Standards Codification
-Section S99
-Paragraph 2
-Subparagraph (SX 210.5-03(20))
-Publisher FASB
-URI https://asc.fasb.org//1943274/2147483621/220-10-S99-2
Reference 39: http://fasb.org/us-gaap/role/ref/legacyRef
-Topic 942
-SubTopic 220
-Name Accounting Standards Codification
-Section S99
-Paragraph 1
-Subparagraph (SX 210.9-04(22))
-Publisher FASB
-URI https://asc.fasb.org//1943274/2147483589/942-220-S99-1
| Name: |
us-gaap_NetIncomeLoss |
| Namespace Prefix: |
us-gaap_ |
| Data Type: |
xbrli:monetaryItemType |
| Balance Type: |
credit |
| Period Type: |
duration |
|
| X |
- DefinitionAmount of Net Income (Loss) attributable to noncontrolling interest. Reference 1: http://www.xbrl.org/2003/role/disclosureRef
-Topic 250
-SubTopic 10
-Name Accounting Standards Codification
-Section 50
-Paragraph 8
-Publisher FASB
-URI https://asc.fasb.org//1943274/2147483443/250-10-50-8
Reference 2: http://www.xbrl.org/2003/role/disclosureRef
-Topic 250
-SubTopic 10
-Name Accounting Standards Codification
-Section 50
-Paragraph 9
-Publisher FASB
-URI https://asc.fasb.org//1943274/2147483443/250-10-50-9
Reference 3: http://www.xbrl.org/2003/role/disclosureRef
-Topic 944
-SubTopic 220
-Name Accounting Standards Codification
-Section S99
-Paragraph 1
-Subparagraph (SX 210.7-04(17))
-Publisher FASB
-URI https://asc.fasb.org//1943274/2147483586/944-220-S99-1
Reference 4: http://www.xbrl.org/2009/role/commonPracticeRef
-Topic 220
-SubTopic 10
-Name Accounting Standards Codification
-Section 50
-Paragraph 6
-Publisher FASB
-URI https://asc.fasb.org//1943274/2147482765/220-10-50-6
Reference 5: http://fasb.org/us-gaap/role/ref/legacyRef
-Topic 810
-SubTopic 10
-Name Accounting Standards Codification
-Section 50
-Paragraph 1A
-Subparagraph (a)(2)
-Publisher FASB
-URI https://asc.fasb.org//1943274/2147481203/810-10-50-1A
Reference 6: http://fasb.org/us-gaap/role/ref/legacyRef
-Name Accounting Standards Codification
-Topic 810
-SubTopic 10
-Section 55
-Paragraph 4J
-Publisher FASB
-URI https://asc.fasb.org//1943274/2147481175/810-10-55-4J
Reference 7: http://www.xbrl.org/2003/role/disclosureRef
-Topic 220
-SubTopic 10
-Name Accounting Standards Codification
-Section 45
-Paragraph 1A
-Subparagraph (a)
-Publisher FASB
-URI https://asc.fasb.org//1943274/2147482790/220-10-45-1A
Reference 8: http://www.xbrl.org/2003/role/disclosureRef
-Topic 220
-SubTopic 10
-Name Accounting Standards Codification
-Section 45
-Paragraph 1B
-Subparagraph (a)
-Publisher FASB
-URI https://asc.fasb.org//1943274/2147482790/220-10-45-1B
| Name: |
us-gaap_NetIncomeLossAttributableToNoncontrollingInterest |
| Namespace Prefix: |
us-gaap_ |
| Data Type: |
xbrli:monetaryItemType |
| Balance Type: |
debit |
| Period Type: |
duration |
|
| X |
- DefinitionGenerally recurring costs associated with normal operations except for the portion of these expenses which can be clearly related to production and included in cost of sales or services. Includes selling, general and administrative expense.
| Name: |
us-gaap_OperatingExpenses |
| Namespace Prefix: |
us-gaap_ |
| Data Type: |
xbrli:monetaryItemType |
| Balance Type: |
debit |
| Period Type: |
duration |
|
| X |
- References
+ Details
| Name: |
us-gaap_OperatingExpensesAbstract |
| Namespace Prefix: |
us-gaap_ |
| Data Type: |
xbrli:stringItemType |
| Balance Type: |
na |
| Period Type: |
duration |
|
| X |
- DefinitionThe net result for the period of deducting operating expenses from operating revenues. Reference 1: http://www.xbrl.org/2003/role/disclosureRef
-Topic 280
-SubTopic 10
-Name Accounting Standards Codification
-Section 50
-Paragraph 22
-Publisher FASB
-URI https://asc.fasb.org//1943274/2147482810/280-10-50-22
Reference 2: http://www.xbrl.org/2003/role/disclosureRef
-Topic 280
-SubTopic 10
-Name Accounting Standards Codification
-Section 50
-Paragraph 30
-Subparagraph (b)
-Publisher FASB
-URI https://asc.fasb.org//1943274/2147482810/280-10-50-30
Reference 3: http://www.xbrl.org/2003/role/disclosureRef
-Topic 280
-SubTopic 10
-Name Accounting Standards Codification
-Section 50
-Paragraph 32
-Subparagraph (f)
-Publisher FASB
-URI https://asc.fasb.org//1943274/2147482810/280-10-50-32
Reference 4: http://www.xbrl.org/2003/role/exampleRef
-Topic 280
-SubTopic 10
-Name Accounting Standards Codification
-Section 50
-Paragraph 31
-Publisher FASB
-URI https://asc.fasb.org//1943274/2147482810/280-10-50-31
Reference 5: http://www.xbrl.org/2003/role/disclosureRef
-Topic 280
-SubTopic 10
-Name Accounting Standards Codification
-Section 50
-Paragraph 32
-Subparagraph (c)
-Publisher FASB
-URI https://asc.fasb.org//1943274/2147482810/280-10-50-32
| Name: |
us-gaap_OperatingIncomeLoss |
| Namespace Prefix: |
us-gaap_ |
| Data Type: |
xbrli:monetaryItemType |
| Balance Type: |
credit |
| Period Type: |
duration |
|
| X |
- DefinitionThe consolidated profit or loss for the period, net of income taxes, including the portion attributable to the noncontrolling interest. Reference 1: http://www.xbrl.org/2003/role/disclosureRef
-Topic 235
-SubTopic 10
-Name Accounting Standards Codification
-Section S99
-Paragraph 1
-Subparagraph (SX 210.4-08(g)(1)(ii))
-Publisher FASB
-URI https://asc.fasb.org//1943274/2147480678/235-10-S99-1
Reference 2: http://www.xbrl.org/2003/role/disclosureRef
-Topic 323
-SubTopic 10
-Name Accounting Standards Codification
-Section 50
-Paragraph 3
-Subparagraph (c)
-Publisher FASB
-URI https://asc.fasb.org//1943274/2147481687/323-10-50-3
Reference 3: http://www.xbrl.org/2003/role/disclosureRef
-Topic 825
-SubTopic 10
-Name Accounting Standards Codification
-Section 50
-Paragraph 28
-Subparagraph (f)
-Publisher FASB
-URI https://asc.fasb.org//1943274/2147482907/825-10-50-28
Reference 4: http://www.xbrl.org/2003/role/disclosureRef
-Topic 250
-SubTopic 10
-Name Accounting Standards Codification
-Section 50
-Paragraph 1
-Subparagraph (b)(2)
-Publisher FASB
-URI https://asc.fasb.org//1943274/2147483443/250-10-50-1
Reference 5: http://www.xbrl.org/2003/role/disclosureRef
-Topic 815
-SubTopic 40
-Name Accounting Standards Codification
-Section 65
-Paragraph 1
-Subparagraph (f)
-Publisher FASB
-URI https://asc.fasb.org//1943274/2147480175/815-40-65-1
Reference 6: http://www.xbrl.org/2003/role/disclosureRef
-Topic 250
-SubTopic 10
-Name Accounting Standards Codification
-Section 50
-Paragraph 8
-Publisher FASB
-URI https://asc.fasb.org//1943274/2147483443/250-10-50-8
Reference 7: http://www.xbrl.org/2003/role/disclosureRef
-Topic 250
-SubTopic 10
-Name Accounting Standards Codification
-Section 50
-Paragraph 9
-Publisher FASB
-URI https://asc.fasb.org//1943274/2147483443/250-10-50-9
Reference 8: http://www.xbrl.org/2003/role/exampleRef
-Topic 946
-SubTopic 830
-Name Accounting Standards Codification
-Section 55
-Paragraph 11
-Publisher FASB
-URI https://asc.fasb.org//1943274/2147480167/946-830-55-11
Reference 9: http://www.xbrl.org/2003/role/disclosureRef
-Topic 946
-SubTopic 205
-Name Accounting Standards Codification
-Section 45
-Paragraph 3
-Subparagraph (a)
-Publisher FASB
-URI https://asc.fasb.org//1943274/2147480767/946-205-45-3
Reference 10: http://www.xbrl.org/2003/role/disclosureRef
-Topic 946
-SubTopic 220
-Name Accounting Standards Codification
-Section 45
-Paragraph 7
-Publisher FASB
-URI https://asc.fasb.org//1943274/2147483581/946-220-45-7
Reference 11: http://www.xbrl.org/2003/role/disclosureRef
-Topic 944
-SubTopic 220
-Name Accounting Standards Codification
-Section S99
-Paragraph 1
-Subparagraph (SX 210.7-04(16))
-Publisher FASB
-URI https://asc.fasb.org//1943274/2147483586/944-220-S99-1
Reference 12: http://www.xbrl.org/2003/role/disclosureRef
-Topic 280
-SubTopic 10
-Name Accounting Standards Codification
-Section 50
-Paragraph 22
-Publisher FASB
-URI https://asc.fasb.org//1943274/2147482810/280-10-50-22
Reference 13: http://www.xbrl.org/2003/role/disclosureRef
-Topic 946
-SubTopic 220
-Name Accounting Standards Codification
-Section S99
-Paragraph 1
-Subparagraph (SX 210.6-07(9))
-Publisher FASB
-URI https://asc.fasb.org//1943274/2147483575/946-220-S99-1
Reference 14: http://www.xbrl.org/2003/role/disclosureRef
-Topic 946
-SubTopic 220
-Name Accounting Standards Codification
-Section S99
-Paragraph 3
-Subparagraph (SX 210.6-09(1)(d))
-Publisher FASB
-URI https://asc.fasb.org//1943274/2147483575/946-220-S99-3
Reference 15: http://www.xbrl.org/2003/role/disclosureRef
-Topic 810
-SubTopic 10
-Name Accounting Standards Codification
-Section 45
-Paragraph 19
-Publisher FASB
-URI https://asc.fasb.org//1943274/2147481231/810-10-45-19
Reference 16: http://www.xbrl.org/2009/role/commonPracticeRef
-Topic 220
-SubTopic 10
-Name Accounting Standards Codification
-Section 50
-Paragraph 6
-Publisher FASB
-URI https://asc.fasb.org//1943274/2147482765/220-10-50-6
Reference 17: http://www.xbrl.org/2003/role/disclosureRef
-Topic 470
-SubTopic 10
-Name Accounting Standards Codification
-Section S99
-Paragraph 1A
-Subparagraph (SX 210.13-01(a)(4)(i))
-Publisher FASB
-URI https://asc.fasb.org//1943274/2147480097/470-10-S99-1A
Reference 18: http://www.xbrl.org/2009/role/commonPracticeRef
-Topic 470
-SubTopic 10
-Name Accounting Standards Codification
-Section S99
-Paragraph 1A
-Subparagraph (SX 210.13-01(a)(4)(ii))
-Publisher FASB
-URI https://asc.fasb.org//1943274/2147480097/470-10-S99-1A
Reference 19: http://www.xbrl.org/2003/role/disclosureRef
-Topic 470
-SubTopic 10
-Name Accounting Standards Codification
-Section S99
-Paragraph 1A
-Subparagraph (SX 210.13-01(a)(4)(iii)(A))
-Publisher FASB
-URI https://asc.fasb.org//1943274/2147480097/470-10-S99-1A
Reference 20: http://www.xbrl.org/2003/role/disclosureRef
-Topic 470
-SubTopic 10
-Name Accounting Standards Codification
-Section S99
-Paragraph 1A
-Subparagraph (SX 210.13-01(a)(4)(iv))
-Publisher FASB
-URI https://asc.fasb.org//1943274/2147480097/470-10-S99-1A
Reference 21: http://www.xbrl.org/2003/role/disclosureRef
-Topic 470
-SubTopic 10
-Name Accounting Standards Codification
-Section S99
-Paragraph 1A
-Subparagraph (SX 210.13-01(a)(5))
-Publisher FASB
-URI https://asc.fasb.org//1943274/2147480097/470-10-S99-1A
Reference 22: http://www.xbrl.org/2003/role/disclosureRef
-Topic 470
-SubTopic 10
-Name Accounting Standards Codification
-Section S99
-Paragraph 1B
-Subparagraph (SX 210.13-02(a)(4)(i))
-Publisher FASB
-URI https://asc.fasb.org//1943274/2147480097/470-10-S99-1B
Reference 23: http://www.xbrl.org/2003/role/disclosureRef
-Topic 470
-SubTopic 10
-Name Accounting Standards Codification
-Section S99
-Paragraph 1B
-Subparagraph (SX 210.13-02(a)(4)(iii)(A))
-Publisher FASB
-URI https://asc.fasb.org//1943274/2147480097/470-10-S99-1B
Reference 24: http://www.xbrl.org/2003/role/disclosureRef
-Topic 470
-SubTopic 10
-Name Accounting Standards Codification
-Section S99
-Paragraph 1B
-Subparagraph (SX 210.13-02(a)(4)(iii)(B))
-Publisher FASB
-URI https://asc.fasb.org//1943274/2147480097/470-10-S99-1B
Reference 25: http://www.xbrl.org/2003/role/disclosureRef
-Topic 470
-SubTopic 10
-Name Accounting Standards Codification
-Section S99
-Paragraph 1B
-Subparagraph (SX 210.13-02(a)(4)(iv))
-Publisher FASB
-URI https://asc.fasb.org//1943274/2147480097/470-10-S99-1B
Reference 26: http://www.xbrl.org/2003/role/disclosureRef
-Topic 470
-SubTopic 10
-Name Accounting Standards Codification
-Section S99
-Paragraph 1B
-Subparagraph (SX 210.13-02(a)(5))
-Publisher FASB
-URI https://asc.fasb.org//1943274/2147480097/470-10-S99-1B
Reference 27: http://www.xbrl.org/2003/role/disclosureRef
-Topic 280
-SubTopic 10
-Name Accounting Standards Codification
-Section 50
-Paragraph 30
-Subparagraph (b)
-Publisher FASB
-URI https://asc.fasb.org//1943274/2147482810/280-10-50-30
Reference 28: http://www.xbrl.org/2003/role/disclosureRef
-Topic 280
-SubTopic 10
-Name Accounting Standards Codification
-Section 50
-Paragraph 32
-Subparagraph (f)
-Publisher FASB
-URI https://asc.fasb.org//1943274/2147482810/280-10-50-32
Reference 29: http://www.xbrl.org/2003/role/exampleRef
-Topic 280
-SubTopic 10
-Name Accounting Standards Codification
-Section 50
-Paragraph 31
-Publisher FASB
-URI https://asc.fasb.org//1943274/2147482810/280-10-50-31
Reference 30: http://www.xbrl.org/2003/role/disclosureRef
-Topic 280
-SubTopic 10
-Name Accounting Standards Codification
-Section 50
-Paragraph 32
-Subparagraph (c)
-Publisher FASB
-URI https://asc.fasb.org//1943274/2147482810/280-10-50-32
Reference 31: http://www.xbrl.org/2003/role/disclosureRef
-Topic 942
-SubTopic 235
-Name Accounting Standards Codification
-Section S99
-Paragraph 1
-Subparagraph (SX 210.9-05(b)(2))
-Publisher FASB
-URI https://asc.fasb.org//1943274/2147479557/942-235-S99-1
Reference 32: http://www.xbrl.org/2003/role/disclosureRef
-Topic 205
-SubTopic 20
-Name Accounting Standards Codification
-Section 50
-Paragraph 7
-Publisher FASB
-URI https://asc.fasb.org//1943274/2147483499/205-20-50-7
Reference 33: http://www.xbrl.org/2003/role/exampleRef
-Topic 810
-SubTopic 10
-Name Accounting Standards Codification
-Section 55
-Paragraph 4J
-Publisher FASB
-URI https://asc.fasb.org//1943274/2147481175/810-10-55-4J
Reference 34: http://www.xbrl.org/2003/role/exampleRef
-Topic 810
-SubTopic 10
-Name Accounting Standards Codification
-Section 55
-Paragraph 4K
-Publisher FASB
-URI https://asc.fasb.org//1943274/2147481175/810-10-55-4K
Reference 35: http://www.xbrl.org/2003/role/disclosureRef
-Topic 220
-SubTopic 10
-Name Accounting Standards Codification
-Section 45
-Paragraph 1A
-Subparagraph (a)
-Publisher FASB
-URI https://asc.fasb.org//1943274/2147482790/220-10-45-1A
Reference 36: http://www.xbrl.org/2003/role/disclosureRef
-Topic 220
-SubTopic 10
-Name Accounting Standards Codification
-Section 45
-Paragraph 1B
-Subparagraph (a)
-Publisher FASB
-URI https://asc.fasb.org//1943274/2147482790/220-10-45-1B
Reference 37: http://www.xbrl.org/2003/role/disclosureRef
-Topic 230
-SubTopic 10
-Name Accounting Standards Codification
-Section 45
-Paragraph 2
-Publisher FASB
-URI https://asc.fasb.org//1943274/2147482740/230-10-45-2
Reference 38: http://www.xbrl.org/2003/role/disclosureRef
-Topic 810
-SubTopic 10
-Name Accounting Standards Codification
-Section 50
-Paragraph 1A
-Subparagraph (a)(1)
-Publisher FASB
-URI https://asc.fasb.org//1943274/2147481203/810-10-50-1A
Reference 39: http://www.xbrl.org/2003/role/disclosureRef
-Topic 810
-SubTopic 10
-Name Accounting Standards Codification
-Section 50
-Paragraph 1A
-Subparagraph (c)(1)
-Publisher FASB
-URI https://asc.fasb.org//1943274/2147481203/810-10-50-1A
| Name: |
us-gaap_ProfitLoss |
| Namespace Prefix: |
us-gaap_ |
| Data Type: |
xbrli:monetaryItemType |
| Balance Type: |
credit |
| Period Type: |
duration |
|
| X |
- DefinitionThe aggregate costs incurred (1) in a planned search or critical investigation aimed at discovery of new knowledge with the hope that such knowledge will be useful in developing a new product or service, a new process or technique, or in bringing about a significant improvement to an existing product or process; or (2) to translate research findings or other knowledge into a plan or design for a new product or process or for a significant improvement to an existing product or process whether intended for sale or the entity's use, during the reporting period charged to research and development projects, including the costs of developing computer software up to the point in time of achieving technological feasibility, and costs allocated in accounting for a business combination to in-process projects deemed to have no alternative future use. Reference 1: http://www.xbrl.org/2003/role/disclosureRef
-Topic 730
-SubTopic 10
-Name Accounting Standards Codification
-Section 50
-Paragraph 1
-Publisher FASB
-URI https://asc.fasb.org//1943274/2147482916/730-10-50-1
Reference 2: http://www.xbrl.org/2009/role/commonPracticeRef
-Topic 912
-SubTopic 730
-Name Accounting Standards Codification
-Section 25
-Paragraph 1
-Publisher FASB
-URI https://asc.fasb.org//1943274/2147482517/912-730-25-1
Reference 3: http://fasb.org/us-gaap/role/ref/legacyRef
-Name Accounting Standards Codification
-Topic 985
-SubTopic 20
-Section 50
-Paragraph 1
-Publisher FASB
-URI https://asc.fasb.org//1943274/2147481283/985-20-50-1
| Name: |
us-gaap_ResearchAndDevelopmentExpense |
| Namespace Prefix: |
us-gaap_ |
| Data Type: |
xbrli:monetaryItemType |
| Balance Type: |
debit |
| Period Type: |
duration |
|
| X |
- DefinitionAmount, excluding tax collected from customer, of revenue from satisfaction of performance obligation by transferring promised good or service to customer. Tax collected from customer is tax assessed by governmental authority that is both imposed on and concurrent with specific revenue-producing transaction, including, but not limited to, sales, use, value added and excise. Reference 1: http://www.xbrl.org/2003/role/disclosureRef
-Topic 924
-SubTopic 10
-Name Accounting Standards Codification
-Section S99
-Paragraph 1
-Subparagraph (SAB Topic 11.L)
-Publisher FASB
-URI https://asc.fasb.org//1943274/2147479941/924-10-S99-1
Reference 2: http://www.xbrl.org/2003/role/disclosureRef
-Topic 606
-SubTopic 10
-Name Accounting Standards Codification
-Section 50
-Paragraph 5
-Publisher FASB
-URI https://asc.fasb.org//1943274/2147479806/606-10-50-5
Reference 3: http://www.xbrl.org/2003/role/disclosureRef
-Topic 280
-SubTopic 10
-Name Accounting Standards Codification
-Section 50
-Paragraph 30
-Subparagraph (a)
-Publisher FASB
-URI https://asc.fasb.org//1943274/2147482810/280-10-50-30
Reference 4: http://www.xbrl.org/2003/role/disclosureRef
-Topic 280
-SubTopic 10
-Name Accounting Standards Codification
-Section 50
-Paragraph 42
-Publisher FASB
-URI https://asc.fasb.org//1943274/2147482810/280-10-50-42
Reference 5: http://www.xbrl.org/2003/role/disclosureRef
-Topic 280
-SubTopic 10
-Name Accounting Standards Codification
-Section 50
-Paragraph 22
-Subparagraph (b)
-Publisher FASB
-URI https://asc.fasb.org//1943274/2147482810/280-10-50-22
Reference 6: http://www.xbrl.org/2003/role/disclosureRef
-Topic 280
-SubTopic 10
-Name Accounting Standards Codification
-Section 50
-Paragraph 32
-Subparagraph (b)
-Publisher FASB
-URI https://asc.fasb.org//1943274/2147482810/280-10-50-32
Reference 7: http://www.xbrl.org/2003/role/disclosureRef
-Topic 280
-SubTopic 10
-Name Accounting Standards Codification
-Section 50
-Paragraph 40
-Publisher FASB
-URI https://asc.fasb.org//1943274/2147482810/280-10-50-40
Reference 8: http://www.xbrl.org/2003/role/disclosureRef
-Topic 280
-SubTopic 10
-Name Accounting Standards Codification
-Section 50
-Paragraph 22
-Subparagraph (a)
-Publisher FASB
-URI https://asc.fasb.org//1943274/2147482810/280-10-50-22
Reference 9: http://www.xbrl.org/2003/role/disclosureRef
-Topic 280
-SubTopic 10
-Name Accounting Standards Codification
-Section 50
-Paragraph 32
-Subparagraph (a)
-Publisher FASB
-URI https://asc.fasb.org//1943274/2147482810/280-10-50-32
Reference 10: http://www.xbrl.org/2003/role/disclosureRef
-Topic 280
-SubTopic 10
-Name Accounting Standards Codification
-Section 50
-Paragraph 41
-Subparagraph (a)
-Publisher FASB
-URI https://asc.fasb.org//1943274/2147482810/280-10-50-41
Reference 11: http://www.xbrl.org/2003/role/disclosureRef
-Topic 606
-SubTopic 10
-Name Accounting Standards Codification
-Section 50
-Paragraph 4
-Subparagraph (a)
-Publisher FASB
-URI https://asc.fasb.org//1943274/2147479806/606-10-50-4
| Name: |
us-gaap_RevenueFromContractWithCustomerExcludingAssessedTax |
| Namespace Prefix: |
us-gaap_ |
| Data Type: |
xbrli:monetaryItemType |
| Balance Type: |
credit |
| Period Type: |
duration |
|
| X |
- DefinitionThe aggregate total costs related to selling a firm's product and services, as well as all other general and administrative expenses. Direct selling expenses (for example, credit, warranty, and advertising) are expenses that can be directly linked to the sale of specific products. Indirect selling expenses are expenses that cannot be directly linked to the sale of specific products, for example telephone expenses, Internet, and postal charges. General and administrative expenses include salaries of non-sales personnel, rent, utilities, communication, etc. Reference 1: http://fasb.org/us-gaap/role/ref/legacyRef
-Topic 220
-SubTopic 10
-Name Accounting Standards Codification
-Section S99
-Paragraph 2
-Subparagraph (SX 210.5-03.4)
-Publisher FASB
-URI https://asc.fasb.org//1943274/2147483621/220-10-S99-2
| Name: |
us-gaap_SellingGeneralAndAdministrativeExpense |
| Namespace Prefix: |
us-gaap_ |
| Data Type: |
xbrli:monetaryItemType |
| Balance Type: |
debit |
| Period Type: |
duration |
|
| X |
- DefinitionThe average number of shares or units issued and outstanding that are used in calculating diluted EPS or earnings per unit (EPU), determined based on the timing of issuance of shares or units in the period. Reference 1: http://www.xbrl.org/2003/role/disclosureRef
-Topic 260
-SubTopic 10
-Name Accounting Standards Codification
-Section 50
-Paragraph 1
-Subparagraph (a)
-Publisher FASB
-URI https://asc.fasb.org//1943274/2147482662/260-10-50-1
Reference 2: http://www.xbrl.org/2003/role/disclosureRef
-Topic 260
-SubTopic 10
-Name Accounting Standards Codification
-Section 45
-Paragraph 16
-Publisher FASB
-URI https://asc.fasb.org//1943274/2147482689/260-10-45-16
| Name: |
us-gaap_WeightedAverageNumberOfDilutedSharesOutstanding |
| Namespace Prefix: |
us-gaap_ |
| Data Type: |
xbrli:sharesItemType |
| Balance Type: |
na |
| Period Type: |
duration |
|
| X |
- DefinitionNumber of [basic] shares or units, after adjustment for contingently issuable shares or units and other shares or units not deemed outstanding, determined by relating the portion of time within a reporting period that common shares or units have been outstanding to the total time in that period. Reference 1: http://www.xbrl.org/2003/role/disclosureRef
-Topic 260
-SubTopic 10
-Name Accounting Standards Codification
-Section 50
-Paragraph 1
-Subparagraph (a)
-Publisher FASB
-URI https://asc.fasb.org//1943274/2147482662/260-10-50-1
Reference 2: http://www.xbrl.org/2003/role/disclosureRef
-Topic 260
-SubTopic 10
-Name Accounting Standards Codification
-Section 45
-Paragraph 10
-Publisher FASB
-URI https://asc.fasb.org//1943274/2147482689/260-10-45-10
| Name: |
us-gaap_WeightedAverageNumberOfSharesOutstandingBasic |
| Namespace Prefix: |
us-gaap_ |
| Data Type: |
xbrli:sharesItemType |
| Balance Type: |
na |
| Period Type: |
duration |
|
| X |
- References
+ Details
| Name: |
us-gaap_WeightedAverageNumberOfSharesOutstandingBasicAbstract |
| Namespace Prefix: |
us-gaap_ |
| Data Type: |
xbrli:stringItemType |
| Balance Type: |
na |
| Period Type: |
duration |
|
v3.23.3
Condensed Consolidated Statements of Changes in Stockholders' Deficit (Unaudited) - USD ($)
shares in Thousands, $ in Thousands |
Common Stock [Member] |
Additional Paid-in Capital [Member] |
[1] |
Retained Earnings [Member] |
Treasury Stock, Common [Member] |
Parent [Member] |
Noncontrolling Interest [Member] |
Total |
| Balance at Dec. 31, 2021 |
|
$ 25
|
[1] |
$ 103,176
|
$ (100,634)
|
$ (3,036)
|
[1] |
$ (469)
|
$ 8
|
|
$ (461)
|
| Balance, shares at Dec. 31, 2021 |
[1] |
2,480
|
|
|
|
50
|
|
|
|
|
|
| Net income (loss) |
|
|
[1] |
|
(123)
|
|
[1] |
(123)
|
1
|
|
(122)
|
| Accrued dividend on OmniMetrix preferred shares |
|
|
[1] |
|
|
|
[1] |
|
(1)
|
|
(1)
|
| Stock option compensation |
|
|
[1] |
31
|
|
|
[1] |
31
|
|
|
31
|
| Balance at Mar. 31, 2022 |
|
$ 25
|
[1] |
103,207
|
(100,757)
|
$ (3,036)
|
[1] |
(561)
|
8
|
|
(553)
|
| Balance, shares at Mar. 31, 2022 |
[1] |
2,480
|
|
|
|
50
|
|
|
|
|
|
| Balance at Dec. 31, 2021 |
|
$ 25
|
[1] |
103,176
|
(100,634)
|
$ (3,036)
|
[1] |
(469)
|
8
|
|
(461)
|
| Balance, shares at Dec. 31, 2021 |
[1] |
2,480
|
|
|
|
50
|
|
|
|
|
|
| Net income (loss) |
|
|
|
|
|
|
|
|
|
|
(555)
|
| Balance at Sep. 30, 2022 |
|
$ 25
|
[1] |
103,250
|
(101,190)
|
$ (3,036)
|
[1] |
(951)
|
6
|
|
(945)
|
| Balance, shares at Sep. 30, 2022 |
[1] |
2,482
|
|
|
|
50
|
|
|
|
|
|
| Balance at Mar. 31, 2022 |
|
$ 25
|
[1] |
103,207
|
(100,757)
|
$ (3,036)
|
[1] |
(561)
|
8
|
|
(553)
|
| Balance, shares at Mar. 31, 2022 |
[1] |
2,480
|
|
|
|
50
|
|
|
|
|
|
| Net income (loss) |
|
|
[1] |
|
(223)
|
|
[1] |
(223)
|
|
[2] |
(223)
|
| Accrued dividend on OmniMetrix preferred shares |
|
|
[1] |
|
|
|
[1] |
|
(1)
|
|
(1)
|
| Stock option compensation |
|
|
[1] |
22
|
|
|
[1] |
22
|
|
|
22
|
| Balance at Jun. 30, 2022 |
|
$ 25
|
[1] |
103,229
|
(100,980)
|
$ (3,036)
|
[1] |
(762)
|
7
|
|
(755)
|
| Balance, shares at Jun. 30, 2022 |
[1] |
2,480
|
|
|
|
50
|
|
|
|
|
|
| Net income (loss) |
|
|
[1] |
|
(210)
|
|
[1] |
(210)
|
|
|
(210)
|
| Accrued dividend on OmniMetrix preferred shares |
|
|
[1] |
|
|
|
[1] |
|
(1)
|
|
(1)
|
| Stock option compensation |
|
|
[1] |
16
|
|
|
[1] |
16
|
|
|
16
|
| Proceeds from stock option exercise |
|
|
[1],[2] |
5
|
|
|
[1] |
5
|
|
|
5
|
| Balance, shares |
[1] |
2
|
|
|
|
|
|
|
|
|
|
| Balance at Sep. 30, 2022 |
|
$ 25
|
[1] |
103,250
|
(101,190)
|
$ (3,036)
|
[1] |
(951)
|
6
|
|
(945)
|
| Balance, shares at Sep. 30, 2022 |
[1] |
2,482
|
|
|
|
50
|
|
|
|
|
|
| Balance at Dec. 31, 2022 |
|
$ 25
|
[1] |
103,261
|
(101,267)
|
$ (3,036)
|
[1] |
(1,017)
|
6
|
|
(1,011)
|
| Balance, shares at Dec. 31, 2022 |
[1] |
2,483
|
|
|
|
50
|
|
|
|
|
|
| Net income (loss) |
|
|
[1] |
|
(85)
|
|
[1] |
(85)
|
1
|
|
(84)
|
| Proceeds from warrant exercise |
|
|
[1],[2] |
5
|
|
|
[1] |
5
|
|
|
5
|
| Balance, shares |
[1] |
2
|
|
|
|
|
|
|
|
|
|
| Accrued dividend on OmniMetrix preferred shares |
|
|
[1] |
|
|
|
[1] |
|
(1)
|
|
(1)
|
| Stock option compensation |
|
|
[1] |
17
|
|
|
[1] |
17
|
|
|
17
|
| Balance at Mar. 31, 2023 |
|
$ 25
|
[1] |
103,283
|
(101,352)
|
$ (3,036)
|
[1] |
(1,080)
|
6
|
|
(1,074)
|
| Balance, shares at Mar. 31, 2023 |
[1] |
2,485
|
|
|
|
50
|
|
|
|
|
|
| Balance at Dec. 31, 2022 |
|
$ 25
|
[1] |
103,261
|
(101,267)
|
$ (3,036)
|
[1] |
(1,017)
|
6
|
|
(1,011)
|
| Balance, shares at Dec. 31, 2022 |
[1] |
2,483
|
|
|
|
50
|
|
|
|
|
|
| Net income (loss) |
|
|
|
|
|
|
|
|
|
|
42
|
| Balance at Sep. 30, 2023 |
|
$ 25
|
[1] |
103,312
|
(101,232)
|
$ (3,036)
|
[1] |
(931)
|
10
|
|
(921)
|
| Balance, shares at Sep. 30, 2023 |
[1] |
2,485
|
|
|
|
50
|
|
|
|
|
|
| Balance at Mar. 31, 2023 |
|
$ 25
|
[1] |
103,283
|
(101,352)
|
$ (3,036)
|
[1] |
(1,080)
|
6
|
|
(1,074)
|
| Balance, shares at Mar. 31, 2023 |
[1] |
2,485
|
|
|
|
50
|
|
|
|
|
|
| Net income (loss) |
|
|
[1] |
|
96
|
|
[1] |
96
|
3
|
|
99
|
| Accrued dividend on OmniMetrix preferred shares |
|
|
[1] |
|
|
|
[1] |
|
(1)
|
|
(1)
|
| Stock option compensation |
|
|
[1] |
13
|
|
|
[1] |
13
|
|
|
13
|
| Balance at Jun. 30, 2023 |
|
$ 25
|
[1] |
103,296
|
(101,256)
|
$ (3,036)
|
[1] |
(971)
|
8
|
|
(963)
|
| Balance, shares at Jun. 30, 2023 |
[1] |
2,485
|
|
|
|
50
|
|
|
|
|
|
| Net income (loss) |
|
|
[1] |
|
24
|
|
[1] |
24
|
3
|
|
27
|
| Accrued dividend on OmniMetrix preferred shares |
|
|
[1] |
|
|
|
[1] |
|
(1)
|
|
(1)
|
| Stock option compensation |
|
|
[1] |
16
|
|
|
[1] |
16
|
|
|
16
|
| Balance at Sep. 30, 2023 |
|
$ 25
|
[1] |
$ 103,312
|
$ (101,232)
|
$ (3,036)
|
[1] |
$ (931)
|
$ 10
|
|
$ (921)
|
| Balance, shares at Sep. 30, 2023 |
[1] |
2,485
|
|
|
|
50
|
|
|
|
|
|
|
|
| X |
- DefinitionStock issued during period shares stock option exercised
| Name: |
ACFN_StockIssuedDuringPeriodSharesStockOptionExercised |
| Namespace Prefix: |
ACFN_ |
| Data Type: |
xbrli:sharesItemType |
| Balance Type: |
na |
| Period Type: |
duration |
|
| X |
- DefinitionStock issued during period shares stock warrant exercised.
| Name: |
ACFN_StockIssuedDuringPeriodSharesStockWarrantExercised |
| Namespace Prefix: |
ACFN_ |
| Data Type: |
xbrli:sharesItemType |
| Balance Type: |
na |
| Period Type: |
duration |
|
| X |
- DefinitionStock issued during period value stock option exercised
| Name: |
ACFN_StockIssuedDuringPeriodValueStockOptionExercised |
| Namespace Prefix: |
ACFN_ |
| Data Type: |
xbrli:monetaryItemType |
| Balance Type: |
credit |
| Period Type: |
duration |
|
| X |
- DefinitionStock issued during period value stock warrant exercised.
| Name: |
ACFN_StockIssuedDuringPeriodValueStockWarrantExercised |
| Namespace Prefix: |
ACFN_ |
| Data Type: |
xbrli:monetaryItemType |
| Balance Type: |
credit |
| Period Type: |
duration |
|
| X |
- DefinitionAmount of increase to additional paid-in capital (APIC) for recognition of cost for award under share-based payment arrangement. Reference 1: http://www.xbrl.org/2003/role/disclosureRef
-Topic 718
-SubTopic 10
-Name Accounting Standards Codification
-Section 35
-Paragraph 2
-Publisher FASB
-URI https://asc.fasb.org//1943274/2147480483/718-10-35-2
Reference 2: http://fasb.org/us-gaap/role/ref/legacyRef
-Name Accounting Standards Codification
-Topic 718
-SubTopic 20
-Section 55
-Paragraph 13
-Publisher FASB
-URI https://asc.fasb.org//1943274/2147481089/718-20-55-13
Reference 3: http://fasb.org/us-gaap/role/ref/legacyRef
-Name Accounting Standards Codification
-Topic 718
-SubTopic 20
-Section 55
-Paragraph 12
-Publisher FASB
-URI https://asc.fasb.org//1943274/2147481089/718-20-55-12
| Name: |
us-gaap_AdjustmentsToAdditionalPaidInCapitalSharebasedCompensationRequisiteServicePeriodRecognitionValue |
| Namespace Prefix: |
us-gaap_ |
| Data Type: |
xbrli:monetaryItemType |
| Balance Type: |
credit |
| Period Type: |
duration |
|
| X |
- DefinitionAmount of paid and unpaid preferred stock dividends declared with the form of settlement in cash, stock and payment-in-kind (PIK). Reference 1: http://fasb.org/us-gaap/role/ref/legacyRef
-Topic 505
-SubTopic 10
-Name Accounting Standards Codification
-Section S99
-Paragraph 1
-Subparagraph (SX 210.3-04)
-Publisher FASB
-URI https://asc.fasb.org//1943274/2147480008/505-10-S99-1
Reference 2: http://fasb.org/us-gaap/role/ref/legacyRef
-Name Accounting Standards Codification
-Section 45
-Paragraph 2
-SubTopic 405
-Topic 942
-Publisher FASB
-URI https://asc.fasb.org//1943274/2147481071/942-405-45-2
| Name: |
us-gaap_DividendsPreferredStock |
| Namespace Prefix: |
us-gaap_ |
| Data Type: |
xbrli:monetaryItemType |
| Balance Type: |
debit |
| Period Type: |
duration |
|
| X |
- DefinitionThe consolidated profit or loss for the period, net of income taxes, including the portion attributable to the noncontrolling interest. Reference 1: http://www.xbrl.org/2003/role/disclosureRef
-Topic 235
-SubTopic 10
-Name Accounting Standards Codification
-Section S99
-Paragraph 1
-Subparagraph (SX 210.4-08(g)(1)(ii))
-Publisher FASB
-URI https://asc.fasb.org//1943274/2147480678/235-10-S99-1
Reference 2: http://www.xbrl.org/2003/role/disclosureRef
-Topic 323
-SubTopic 10
-Name Accounting Standards Codification
-Section 50
-Paragraph 3
-Subparagraph (c)
-Publisher FASB
-URI https://asc.fasb.org//1943274/2147481687/323-10-50-3
Reference 3: http://www.xbrl.org/2003/role/disclosureRef
-Topic 825
-SubTopic 10
-Name Accounting Standards Codification
-Section 50
-Paragraph 28
-Subparagraph (f)
-Publisher FASB
-URI https://asc.fasb.org//1943274/2147482907/825-10-50-28
Reference 4: http://www.xbrl.org/2003/role/disclosureRef
-Topic 250
-SubTopic 10
-Name Accounting Standards Codification
-Section 50
-Paragraph 1
-Subparagraph (b)(2)
-Publisher FASB
-URI https://asc.fasb.org//1943274/2147483443/250-10-50-1
Reference 5: http://www.xbrl.org/2003/role/disclosureRef
-Topic 815
-SubTopic 40
-Name Accounting Standards Codification
-Section 65
-Paragraph 1
-Subparagraph (f)
-Publisher FASB
-URI https://asc.fasb.org//1943274/2147480175/815-40-65-1
Reference 6: http://www.xbrl.org/2003/role/disclosureRef
-Topic 250
-SubTopic 10
-Name Accounting Standards Codification
-Section 50
-Paragraph 8
-Publisher FASB
-URI https://asc.fasb.org//1943274/2147483443/250-10-50-8
Reference 7: http://www.xbrl.org/2003/role/disclosureRef
-Topic 250
-SubTopic 10
-Name Accounting Standards Codification
-Section 50
-Paragraph 9
-Publisher FASB
-URI https://asc.fasb.org//1943274/2147483443/250-10-50-9
Reference 8: http://www.xbrl.org/2003/role/exampleRef
-Topic 946
-SubTopic 830
-Name Accounting Standards Codification
-Section 55
-Paragraph 11
-Publisher FASB
-URI https://asc.fasb.org//1943274/2147480167/946-830-55-11
Reference 9: http://www.xbrl.org/2003/role/disclosureRef
-Topic 946
-SubTopic 205
-Name Accounting Standards Codification
-Section 45
-Paragraph 3
-Subparagraph (a)
-Publisher FASB
-URI https://asc.fasb.org//1943274/2147480767/946-205-45-3
Reference 10: http://www.xbrl.org/2003/role/disclosureRef
-Topic 946
-SubTopic 220
-Name Accounting Standards Codification
-Section 45
-Paragraph 7
-Publisher FASB
-URI https://asc.fasb.org//1943274/2147483581/946-220-45-7
Reference 11: http://www.xbrl.org/2003/role/disclosureRef
-Topic 944
-SubTopic 220
-Name Accounting Standards Codification
-Section S99
-Paragraph 1
-Subparagraph (SX 210.7-04(16))
-Publisher FASB
-URI https://asc.fasb.org//1943274/2147483586/944-220-S99-1
Reference 12: http://www.xbrl.org/2003/role/disclosureRef
-Topic 280
-SubTopic 10
-Name Accounting Standards Codification
-Section 50
-Paragraph 22
-Publisher FASB
-URI https://asc.fasb.org//1943274/2147482810/280-10-50-22
Reference 13: http://www.xbrl.org/2003/role/disclosureRef
-Topic 946
-SubTopic 220
-Name Accounting Standards Codification
-Section S99
-Paragraph 1
-Subparagraph (SX 210.6-07(9))
-Publisher FASB
-URI https://asc.fasb.org//1943274/2147483575/946-220-S99-1
Reference 14: http://www.xbrl.org/2003/role/disclosureRef
-Topic 946
-SubTopic 220
-Name Accounting Standards Codification
-Section S99
-Paragraph 3
-Subparagraph (SX 210.6-09(1)(d))
-Publisher FASB
-URI https://asc.fasb.org//1943274/2147483575/946-220-S99-3
Reference 15: http://www.xbrl.org/2003/role/disclosureRef
-Topic 810
-SubTopic 10
-Name Accounting Standards Codification
-Section 45
-Paragraph 19
-Publisher FASB
-URI https://asc.fasb.org//1943274/2147481231/810-10-45-19
Reference 16: http://www.xbrl.org/2009/role/commonPracticeRef
-Topic 220
-SubTopic 10
-Name Accounting Standards Codification
-Section 50
-Paragraph 6
-Publisher FASB
-URI https://asc.fasb.org//1943274/2147482765/220-10-50-6
Reference 17: http://www.xbrl.org/2003/role/disclosureRef
-Topic 470
-SubTopic 10
-Name Accounting Standards Codification
-Section S99
-Paragraph 1A
-Subparagraph (SX 210.13-01(a)(4)(i))
-Publisher FASB
-URI https://asc.fasb.org//1943274/2147480097/470-10-S99-1A
Reference 18: http://www.xbrl.org/2009/role/commonPracticeRef
-Topic 470
-SubTopic 10
-Name Accounting Standards Codification
-Section S99
-Paragraph 1A
-Subparagraph (SX 210.13-01(a)(4)(ii))
-Publisher FASB
-URI https://asc.fasb.org//1943274/2147480097/470-10-S99-1A
Reference 19: http://www.xbrl.org/2003/role/disclosureRef
-Topic 470
-SubTopic 10
-Name Accounting Standards Codification
-Section S99
-Paragraph 1A
-Subparagraph (SX 210.13-01(a)(4)(iii)(A))
-Publisher FASB
-URI https://asc.fasb.org//1943274/2147480097/470-10-S99-1A
Reference 20: http://www.xbrl.org/2003/role/disclosureRef
-Topic 470
-SubTopic 10
-Name Accounting Standards Codification
-Section S99
-Paragraph 1A
-Subparagraph (SX 210.13-01(a)(4)(iv))
-Publisher FASB
-URI https://asc.fasb.org//1943274/2147480097/470-10-S99-1A
Reference 21: http://www.xbrl.org/2003/role/disclosureRef
-Topic 470
-SubTopic 10
-Name Accounting Standards Codification
-Section S99
-Paragraph 1A
-Subparagraph (SX 210.13-01(a)(5))
-Publisher FASB
-URI https://asc.fasb.org//1943274/2147480097/470-10-S99-1A
Reference 22: http://www.xbrl.org/2003/role/disclosureRef
-Topic 470
-SubTopic 10
-Name Accounting Standards Codification
-Section S99
-Paragraph 1B
-Subparagraph (SX 210.13-02(a)(4)(i))
-Publisher FASB
-URI https://asc.fasb.org//1943274/2147480097/470-10-S99-1B
Reference 23: http://www.xbrl.org/2003/role/disclosureRef
-Topic 470
-SubTopic 10
-Name Accounting Standards Codification
-Section S99
-Paragraph 1B
-Subparagraph (SX 210.13-02(a)(4)(iii)(A))
-Publisher FASB
-URI https://asc.fasb.org//1943274/2147480097/470-10-S99-1B
Reference 24: http://www.xbrl.org/2003/role/disclosureRef
-Topic 470
-SubTopic 10
-Name Accounting Standards Codification
-Section S99
-Paragraph 1B
-Subparagraph (SX 210.13-02(a)(4)(iii)(B))
-Publisher FASB
-URI https://asc.fasb.org//1943274/2147480097/470-10-S99-1B
Reference 25: http://www.xbrl.org/2003/role/disclosureRef
-Topic 470
-SubTopic 10
-Name Accounting Standards Codification
-Section S99
-Paragraph 1B
-Subparagraph (SX 210.13-02(a)(4)(iv))
-Publisher FASB
-URI https://asc.fasb.org//1943274/2147480097/470-10-S99-1B
Reference 26: http://www.xbrl.org/2003/role/disclosureRef
-Topic 470
-SubTopic 10
-Name Accounting Standards Codification
-Section S99
-Paragraph 1B
-Subparagraph (SX 210.13-02(a)(5))
-Publisher FASB
-URI https://asc.fasb.org//1943274/2147480097/470-10-S99-1B
Reference 27: http://www.xbrl.org/2003/role/disclosureRef
-Topic 280
-SubTopic 10
-Name Accounting Standards Codification
-Section 50
-Paragraph 30
-Subparagraph (b)
-Publisher FASB
-URI https://asc.fasb.org//1943274/2147482810/280-10-50-30
Reference 28: http://www.xbrl.org/2003/role/disclosureRef
-Topic 280
-SubTopic 10
-Name Accounting Standards Codification
-Section 50
-Paragraph 32
-Subparagraph (f)
-Publisher FASB
-URI https://asc.fasb.org//1943274/2147482810/280-10-50-32
Reference 29: http://www.xbrl.org/2003/role/exampleRef
-Topic 280
-SubTopic 10
-Name Accounting Standards Codification
-Section 50
-Paragraph 31
-Publisher FASB
-URI https://asc.fasb.org//1943274/2147482810/280-10-50-31
Reference 30: http://www.xbrl.org/2003/role/disclosureRef
-Topic 280
-SubTopic 10
-Name Accounting Standards Codification
-Section 50
-Paragraph 32
-Subparagraph (c)
-Publisher FASB
-URI https://asc.fasb.org//1943274/2147482810/280-10-50-32
Reference 31: http://www.xbrl.org/2003/role/disclosureRef
-Topic 942
-SubTopic 235
-Name Accounting Standards Codification
-Section S99
-Paragraph 1
-Subparagraph (SX 210.9-05(b)(2))
-Publisher FASB
-URI https://asc.fasb.org//1943274/2147479557/942-235-S99-1
Reference 32: http://www.xbrl.org/2003/role/disclosureRef
-Topic 205
-SubTopic 20
-Name Accounting Standards Codification
-Section 50
-Paragraph 7
-Publisher FASB
-URI https://asc.fasb.org//1943274/2147483499/205-20-50-7
Reference 33: http://www.xbrl.org/2003/role/exampleRef
-Topic 810
-SubTopic 10
-Name Accounting Standards Codification
-Section 55
-Paragraph 4J
-Publisher FASB
-URI https://asc.fasb.org//1943274/2147481175/810-10-55-4J
Reference 34: http://www.xbrl.org/2003/role/exampleRef
-Topic 810
-SubTopic 10
-Name Accounting Standards Codification
-Section 55
-Paragraph 4K
-Publisher FASB
-URI https://asc.fasb.org//1943274/2147481175/810-10-55-4K
Reference 35: http://www.xbrl.org/2003/role/disclosureRef
-Topic 220
-SubTopic 10
-Name Accounting Standards Codification
-Section 45
-Paragraph 1A
-Subparagraph (a)
-Publisher FASB
-URI https://asc.fasb.org//1943274/2147482790/220-10-45-1A
Reference 36: http://www.xbrl.org/2003/role/disclosureRef
-Topic 220
-SubTopic 10
-Name Accounting Standards Codification
-Section 45
-Paragraph 1B
-Subparagraph (a)
-Publisher FASB
-URI https://asc.fasb.org//1943274/2147482790/220-10-45-1B
Reference 37: http://www.xbrl.org/2003/role/disclosureRef
-Topic 230
-SubTopic 10
-Name Accounting Standards Codification
-Section 45
-Paragraph 2
-Publisher FASB
-URI https://asc.fasb.org//1943274/2147482740/230-10-45-2
Reference 38: http://www.xbrl.org/2003/role/disclosureRef
-Topic 810
-SubTopic 10
-Name Accounting Standards Codification
-Section 50
-Paragraph 1A
-Subparagraph (a)(1)
-Publisher FASB
-URI https://asc.fasb.org//1943274/2147481203/810-10-50-1A
Reference 39: http://www.xbrl.org/2003/role/disclosureRef
-Topic 810
-SubTopic 10
-Name Accounting Standards Codification
-Section 50
-Paragraph 1A
-Subparagraph (c)(1)
-Publisher FASB
-URI https://asc.fasb.org//1943274/2147481203/810-10-50-1A
| Name: |
us-gaap_ProfitLoss |
| Namespace Prefix: |
us-gaap_ |
| Data Type: |
xbrli:monetaryItemType |
| Balance Type: |
credit |
| Period Type: |
duration |
|
| X |
- DefinitionNumber of shares issued which are neither cancelled nor held in the treasury.
| Name: |
us-gaap_SharesOutstanding |
| Namespace Prefix: |
us-gaap_ |
| Data Type: |
xbrli:sharesItemType |
| Balance Type: |
na |
| Period Type: |
instant |
|
| X |
- DefinitionAmount of equity (deficit) attributable to parent and noncontrolling interest. Excludes temporary equity. Reference 1: http://www.xbrl.org/2003/role/disclosureRef
-Topic 250
-SubTopic 10
-Name Accounting Standards Codification
-Section 45
-Paragraph 24
-Publisher FASB
-URI https://asc.fasb.org//1943274/2147483421/250-10-45-24
Reference 2: http://www.xbrl.org/2003/role/disclosureRef
-Topic 250
-SubTopic 10
-Name Accounting Standards Codification
-Section 45
-Paragraph 23
-Subparagraph (b)
-Publisher FASB
-URI https://asc.fasb.org//1943274/2147483421/250-10-45-23
Reference 3: http://www.xbrl.org/2003/role/disclosureRef
-Topic 250
-SubTopic 10
-Name Accounting Standards Codification
-Section 45
-Paragraph 5
-Subparagraph (b)
-Publisher FASB
-URI https://asc.fasb.org//1943274/2147483421/250-10-45-5
Reference 4: http://www.xbrl.org/2003/role/disclosureRef
-Topic 326
-SubTopic 10
-Name Accounting Standards Codification
-Section 65
-Paragraph 5
-Subparagraph (c)(2)
-Publisher FASB
-URI https://asc.fasb.org//1943274/2147479654/326-10-65-5
Reference 5: http://www.xbrl.org/2003/role/disclosureRef
-Topic 815
-SubTopic 20
-Name Accounting Standards Codification
-Section 65
-Paragraph 6
-Subparagraph (e)
-Publisher FASB
-URI https://asc.fasb.org//1943274/2147480528/815-20-65-6
Reference 6: http://www.xbrl.org/2003/role/disclosureRef
-Topic 815
-SubTopic 20
-Name Accounting Standards Codification
-Section 65
-Paragraph 6
-Subparagraph (h)(1)
-Publisher FASB
-URI https://asc.fasb.org//1943274/2147480528/815-20-65-6
Reference 7: http://www.xbrl.org/2003/role/disclosureRef
-Topic 815
-SubTopic 20
-Name Accounting Standards Codification
-Section 65
-Paragraph 6
-Subparagraph (h)(1)(i)
-Publisher FASB
-URI https://asc.fasb.org//1943274/2147480528/815-20-65-6
Reference 8: http://www.xbrl.org/2003/role/disclosureRef
-Topic 815
-SubTopic 20
-Name Accounting Standards Codification
-Section 65
-Paragraph 6
-Subparagraph (h)(1)(iii)
-Publisher FASB
-URI https://asc.fasb.org//1943274/2147480528/815-20-65-6
Reference 9: http://www.xbrl.org/2003/role/disclosureRef
-Topic 815
-SubTopic 20
-Name Accounting Standards Codification
-Section 65
-Paragraph 6
-Subparagraph (h)(1)(iv)
-Publisher FASB
-URI https://asc.fasb.org//1943274/2147480528/815-20-65-6
Reference 10: http://www.xbrl.org/2003/role/disclosureRef
-Topic 815
-SubTopic 20
-Name Accounting Standards Codification
-Section 65
-Paragraph 6
-Subparagraph (i)(3)
-Publisher FASB
-URI https://asc.fasb.org//1943274/2147480528/815-20-65-6
Reference 11: http://www.xbrl.org/2003/role/disclosureRef
-Topic 848
-SubTopic 10
-Name Accounting Standards Codification
-Section 65
-Paragraph 2
-Subparagraph (a)(3)(iii)(03)
-Publisher FASB
-URI https://asc.fasb.org//1943274/2147483550/848-10-65-2
Reference 12: http://www.xbrl.org/2003/role/disclosureRef
-Topic 105
-SubTopic 10
-Name Accounting Standards Codification
-Section 65
-Paragraph 6
-Subparagraph (c)
-Publisher FASB
-URI https://asc.fasb.org//1943274/2147479343/105-10-65-6
Reference 13: http://www.xbrl.org/2003/role/disclosureRef
-Topic 105
-SubTopic 10
-Name Accounting Standards Codification
-Section 65
-Paragraph 6
-Subparagraph (d)
-Publisher FASB
-URI https://asc.fasb.org//1943274/2147479343/105-10-65-6
Reference 14: http://www.xbrl.org/2003/role/disclosureRef
-Topic 944
-SubTopic 40
-Name Accounting Standards Codification
-Section 65
-Paragraph 2
-Subparagraph (f)(1)
-Publisher FASB
-URI https://asc.fasb.org//1943274/2147480016/944-40-65-2
Reference 15: http://www.xbrl.org/2003/role/disclosureRef
-Topic 944
-SubTopic 40
-Name Accounting Standards Codification
-Section 65
-Paragraph 2
-Subparagraph (f)(2)
-Publisher FASB
-URI https://asc.fasb.org//1943274/2147480016/944-40-65-2
Reference 16: http://www.xbrl.org/2003/role/disclosureRef
-Topic 740
-SubTopic 10
-Name Accounting Standards Codification
-Section 65
-Paragraph 8
-Subparagraph (d)(2)
-Publisher FASB
-URI https://asc.fasb.org//1943274/2147482615/740-10-65-8
Reference 17: http://www.xbrl.org/2003/role/disclosureRef
-Topic 740
-SubTopic 10
-Name Accounting Standards Codification
-Section 65
-Paragraph 8
-Subparagraph (d)(3)
-Publisher FASB
-URI https://asc.fasb.org//1943274/2147482615/740-10-65-8
Reference 18: http://www.xbrl.org/2003/role/disclosureRef
-Topic 326
-SubTopic 10
-Name Accounting Standards Codification
-Section 65
-Paragraph 4
-Subparagraph (d)
-Publisher FASB
-URI https://asc.fasb.org//1943274/2147479654/326-10-65-4
Reference 19: http://www.xbrl.org/2003/role/disclosureRef
-Topic 718
-SubTopic 10
-Name Accounting Standards Codification
-Section 65
-Paragraph 15
-Subparagraph (e)
-Publisher FASB
-URI https://asc.fasb.org//1943274/2147480336/718-10-65-15
Reference 20: http://www.xbrl.org/2003/role/disclosureRef
-Topic 718
-SubTopic 10
-Name Accounting Standards Codification
-Section 65
-Paragraph 15
-Subparagraph (f)(1)
-Publisher FASB
-URI https://asc.fasb.org//1943274/2147480336/718-10-65-15
Reference 21: http://www.xbrl.org/2003/role/disclosureRef
-Topic 718
-SubTopic 10
-Name Accounting Standards Codification
-Section 65
-Paragraph 15
-Subparagraph (f)(2)
-Publisher FASB
-URI https://asc.fasb.org//1943274/2147480336/718-10-65-15
Reference 22: http://www.xbrl.org/2003/role/disclosureRef
-Topic 250
-SubTopic 10
-Name Accounting Standards Codification
-Section 50
-Paragraph 1
-Subparagraph (b)(3)
-Publisher FASB
-URI https://asc.fasb.org//1943274/2147483443/250-10-50-1
Reference 23: http://www.xbrl.org/2003/role/disclosureRef
-Topic 815
-SubTopic 40
-Name Accounting Standards Codification
-Section 65
-Paragraph 1
-Subparagraph (e)(3)
-Publisher FASB
-URI https://asc.fasb.org//1943274/2147480175/815-40-65-1
Reference 24: http://www.xbrl.org/2003/role/disclosureRef
-Topic 250
-SubTopic 10
-Name Accounting Standards Codification
-Section 50
-Paragraph 7
-Subparagraph (b)
-Publisher FASB
-URI https://asc.fasb.org//1943274/2147483443/250-10-50-7
Reference 25: http://www.xbrl.org/2003/role/disclosureRef
-Topic 220
-SubTopic 10
-Name Accounting Standards Codification
-Section 50
-Paragraph 5
-Publisher FASB
-URI https://asc.fasb.org//1943274/2147482765/220-10-50-5
Reference 26: http://www.xbrl.org/2003/role/disclosureRef
-Topic 830
-SubTopic 30
-Name Accounting Standards Codification
-Section 50
-Paragraph 1
-Publisher FASB
-URI https://asc.fasb.org//1943274/2147481674/830-30-50-1
Reference 27: http://www.xbrl.org/2003/role/disclosureRef
-Topic 830
-SubTopic 30
-Name Accounting Standards Codification
-Section 45
-Paragraph 17
-Publisher FASB
-URI https://asc.fasb.org//1943274/2147481694/830-30-45-17
Reference 28: http://www.xbrl.org/2003/role/disclosureRef
-Topic 830
-SubTopic 30
-Name Accounting Standards Codification
-Section 45
-Paragraph 20
-Subparagraph (a)
-Publisher FASB
-URI https://asc.fasb.org//1943274/2147481694/830-30-45-20
Reference 29: http://www.xbrl.org/2003/role/exampleRef
-Topic 946
-SubTopic 830
-Name Accounting Standards Codification
-Section 55
-Paragraph 11
-Publisher FASB
-URI https://asc.fasb.org//1943274/2147480167/946-830-55-11
Reference 30: http://www.xbrl.org/2003/role/disclosureRef
-Topic 946
-SubTopic 205
-Name Accounting Standards Codification
-Section 45
-Paragraph 3
-Publisher FASB
-URI https://asc.fasb.org//1943274/2147480767/946-205-45-3
Reference 31: http://www.xbrl.org/2003/role/disclosureRef
-Topic 946
-SubTopic 505
-Name Accounting Standards Codification
-Section 50
-Paragraph 3
-Publisher FASB
-URI https://asc.fasb.org//1943274/2147481004/946-505-50-3
Reference 32: http://www.xbrl.org/2003/role/disclosureRef
-Topic 946
-SubTopic 210
-Name Accounting Standards Codification
-Section S99
-Paragraph 1
-Subparagraph (SX 210.6-04(19))
-Publisher FASB
-URI https://asc.fasb.org//1943274/2147479617/946-210-S99-1
Reference 33: http://www.xbrl.org/2003/role/disclosureRef
-Topic 946
-SubTopic 210
-Name Accounting Standards Codification
-Section S99
-Paragraph 2
-Subparagraph (SX 210.6-05(4))
-Publisher FASB
-URI https://asc.fasb.org//1943274/2147479617/946-210-S99-2
Reference 34: http://www.xbrl.org/2009/role/commonPracticeRef
-Topic 946
-SubTopic 220
-Name Accounting Standards Codification
-Section S99
-Paragraph 3
-Subparagraph (SX 210.6-09(4)(b))
-Publisher FASB
-URI https://asc.fasb.org//1943274/2147483575/946-220-S99-3
Reference 35: http://www.xbrl.org/2003/role/disclosureRef
-Topic 946
-SubTopic 220
-Name Accounting Standards Codification
-Section S99
-Paragraph 3
-Subparagraph (SX 210.6-09(6))
-Publisher FASB
-URI https://asc.fasb.org//1943274/2147483575/946-220-S99-3
Reference 36: http://www.xbrl.org/2003/role/disclosureRef
-Topic 946
-SubTopic 220
-Name Accounting Standards Codification
-Section S99
-Paragraph 3
-Subparagraph (SX 210.6-09(7))
-Publisher FASB
-URI https://asc.fasb.org//1943274/2147483575/946-220-S99-3
Reference 37: http://www.xbrl.org/2003/role/disclosureRef
-Topic 505
-SubTopic 10
-Name Accounting Standards Codification
-Section S99
-Paragraph 1
-Subparagraph (SX 210.3-04)
-Publisher FASB
-URI https://asc.fasb.org//1943274/2147480008/505-10-S99-1
Reference 38: http://www.xbrl.org/2009/role/commonPracticeRef
-Topic 235
-SubTopic 10
-Name Accounting Standards Codification
-Section S99
-Paragraph 1
-Subparagraph (SX 210.4-08(g)(1)(ii))
-Publisher FASB
-URI https://asc.fasb.org//1943274/2147480678/235-10-S99-1
Reference 39: http://www.xbrl.org/2009/role/commonPracticeRef
-Topic 323
-SubTopic 10
-Name Accounting Standards Codification
-Section 50
-Paragraph 3
-Subparagraph (c)
-Publisher FASB
-URI https://asc.fasb.org//1943274/2147481687/323-10-50-3
Reference 40: http://www.xbrl.org/2009/role/commonPracticeRef
-Topic 825
-SubTopic 10
-Name Accounting Standards Codification
-Section 50
-Paragraph 28
-Subparagraph (f)
-Publisher FASB
-URI https://asc.fasb.org//1943274/2147482907/825-10-50-28
Reference 41: http://fasb.org/us-gaap/role/ref/legacyRef
-Name Accounting Standards Codification
-Topic 810
-SubTopic 10
-Section 45
-Paragraph 15
-Publisher FASB
-URI https://asc.fasb.org//1943274/2147481231/810-10-45-15
Reference 42: http://fasb.org/us-gaap/role/ref/legacyRef
-Name Accounting Standards Codification
-Topic 810
-SubTopic 10
-Section 45
-Paragraph 16
-Publisher FASB
-URI https://asc.fasb.org//1943274/2147481231/810-10-45-16
Reference 43: http://fasb.org/us-gaap/role/ref/legacyRef
-Name Accounting Standards Codification
-Topic 810
-SubTopic 10
-Section 55
-Paragraph 4I
-Publisher FASB
-URI https://asc.fasb.org//1943274/2147481175/810-10-55-4I
| Name: |
us-gaap_StockholdersEquityIncludingPortionAttributableToNoncontrollingInterest |
| Namespace Prefix: |
us-gaap_ |
| Data Type: |
xbrli:monetaryItemType |
| Balance Type: |
credit |
| Period Type: |
instant |
|
v3.23.3
| X |
- DefinitionAccrued preferred dividends to former Acorn director.
| Name: |
ACFN_AccruedPreferredDividends |
| Namespace Prefix: |
ACFN_ |
| Data Type: |
xbrli:monetaryItemType |
| Balance Type: |
credit |
| Period Type: |
duration |
|
| X |
- DefinitionIncrease decrease in deferred cost of goods sold.
| Name: |
ACFN_IncreaseDecreaseInDeferredCostOfGoodsSold |
| Namespace Prefix: |
ACFN_ |
| Data Type: |
xbrli:monetaryItemType |
| Balance Type: |
credit |
| Period Type: |
duration |
|
| X |
- DefinitionAmount of write-down of assets recognized in the income statement. Includes, but is not limited to, losses from tangible assets, intangible assets and goodwill. Reference 1: http://fasb.org/us-gaap/role/ref/legacyRef
-Name Accounting Standards Codification
-Section 45
-Paragraph 28
-Subparagraph (b)
-SubTopic 10
-Topic 230
-Publisher FASB
-URI https://asc.fasb.org//1943274/2147482740/230-10-45-28
Reference 2: http://fasb.org/us-gaap/role/ref/legacyRef
-Name Accounting Standards Codification
-Topic 360
-SubTopic 10
-Section 45
-Paragraph 4
-Publisher FASB
-URI https://asc.fasb.org//1943274/2147482130/360-10-45-4
| Name: |
us-gaap_AssetImpairmentCharges |
| Namespace Prefix: |
us-gaap_ |
| Data Type: |
xbrli:monetaryItemType |
| Balance Type: |
debit |
| Period Type: |
duration |
|
| X |
- DefinitionAmount of cash and cash equivalents, and cash and cash equivalents restricted to withdrawal or usage; including, but not limited to, disposal group and discontinued operations. Cash includes, but is not limited to, currency on hand, demand deposits with banks or financial institutions, and other accounts with general characteristics of demand deposits. Cash equivalents include, but are not limited to, short-term, highly liquid investments that are both readily convertible to known amounts of cash and so near their maturity that they present insignificant risk of changes in value because of changes in interest rates. Reference 1: http://www.xbrl.org/2003/role/disclosureRef
-Topic 230
-SubTopic 10
-Name Accounting Standards Codification
-Section 50
-Paragraph 8
-Publisher FASB
-URI https://asc.fasb.org//1943274/2147482913/230-10-50-8
Reference 2: http://fasb.org/us-gaap/role/ref/legacyRef
-Topic 230
-SubTopic 10
-Name Accounting Standards Codification
-Section 45
-Paragraph 24
-Publisher FASB
-URI https://asc.fasb.org//1943274/2147482740/230-10-45-24
Reference 3: http://fasb.org/us-gaap/role/ref/legacyRef
-Name Accounting Standards Codification
-Topic 230
-SubTopic 10
-Section 45
-Paragraph 4
-Publisher FASB
-URI https://asc.fasb.org//1943274/2147482740/230-10-45-4
| Name: |
us-gaap_CashCashEquivalentsRestrictedCashAndRestrictedCashEquivalentsIncludingDisposalGroupAndDiscontinuedOperations |
| Namespace Prefix: |
us-gaap_ |
| Data Type: |
xbrli:monetaryItemType |
| Balance Type: |
debit |
| Period Type: |
instant |
|
| X |
- DefinitionAmount of increase (decrease) in cash, cash equivalents, and cash and cash equivalents restricted to withdrawal or usage; including effect from exchange rate change. Cash includes, but is not limited to, currency on hand, demand deposits with banks or financial institutions, and other accounts with general characteristics of demand deposits. Cash equivalents include, but are not limited to, short-term, highly liquid investments that are both readily convertible to known amounts of cash and so near their maturity that they present insignificant risk of changes in value because of changes in interest rates. Reference 1: http://fasb.org/us-gaap/role/ref/legacyRef
-Topic 230
-SubTopic 10
-Name Accounting Standards Codification
-Section 45
-Paragraph 24
-Publisher FASB
-URI https://asc.fasb.org//1943274/2147482740/230-10-45-24
Reference 2: http://fasb.org/us-gaap/role/ref/legacyRef
-Name Accounting Standards Codification
-Section 45
-Paragraph 1
-SubTopic 230
-Topic 830
-Publisher FASB
-URI https://asc.fasb.org//1943274/2147481877/830-230-45-1
| Name: |
us-gaap_CashCashEquivalentsRestrictedCashAndRestrictedCashEquivalentsPeriodIncreaseDecreaseIncludingExchangeRateEffect |
| Namespace Prefix: |
us-gaap_ |
| Data Type: |
xbrli:monetaryItemType |
| Balance Type: |
debit |
| Period Type: |
duration |
|
| X |
- References
+ Details
| Name: |
us-gaap_CashFlowNoncashInvestingAndFinancingActivitiesDisclosureAbstract |
| Namespace Prefix: |
us-gaap_ |
| Data Type: |
xbrli:stringItemType |
| Balance Type: |
na |
| Period Type: |
duration |
|
| X |
- DefinitionThe current period expense charged against earnings on long-lived, physical assets not used in production, and which are not intended for resale, to allocate or recognize the cost of such assets over their useful lives; or to record the reduction in book value of an intangible asset over the benefit period of such asset; or to reflect consumption during the period of an asset that is not used in production. Reference 1: http://fasb.org/us-gaap/role/ref/legacyRef
-Name Accounting Standards Codification
-Section 45
-Paragraph 28
-Subparagraph (b)
-SubTopic 10
-Topic 230
-Publisher FASB
-URI https://asc.fasb.org//1943274/2147482740/230-10-45-28
Reference 2: http://fasb.org/us-gaap/role/ref/legacyRef
-Name Accounting Standards Codification
-Topic 360
-SubTopic 10
-Section 50
-Paragraph 1
-Subparagraph (a)
-Publisher FASB
-URI https://asc.fasb.org//1943274/2147482099/360-10-50-1
| Name: |
us-gaap_DepreciationAndAmortization |
| Namespace Prefix: |
us-gaap_ |
| Data Type: |
xbrli:monetaryItemType |
| Balance Type: |
debit |
| Period Type: |
duration |
|
| X |
- DefinitionThe increase (decrease) during the reporting period in the amounts payable to vendors for goods and services received and the amount of obligations and expenses incurred but not paid. Reference 1: http://fasb.org/us-gaap/role/ref/legacyRef
-Name Accounting Standards Codification
-Section 45
-Paragraph 28
-Subparagraph (a)
-SubTopic 10
-Topic 230
-Publisher FASB
-URI https://asc.fasb.org//1943274/2147482740/230-10-45-28
| Name: |
us-gaap_IncreaseDecreaseInAccountsPayableAndAccruedLiabilities |
| Namespace Prefix: |
us-gaap_ |
| Data Type: |
xbrli:monetaryItemType |
| Balance Type: |
debit |
| Period Type: |
duration |
|
| X |
- DefinitionThe increase (decrease) during the reporting period in amount due within one year (or one business cycle) from customers for the credit sale of goods and services. Reference 1: http://fasb.org/us-gaap/role/ref/legacyRef
-Name Accounting Standards Codification
-Section 45
-Paragraph 28
-Subparagraph (a)
-SubTopic 10
-Topic 230
-Publisher FASB
-URI https://asc.fasb.org//1943274/2147482740/230-10-45-28
| Name: |
us-gaap_IncreaseDecreaseInAccountsReceivable |
| Namespace Prefix: |
us-gaap_ |
| Data Type: |
xbrli:monetaryItemType |
| Balance Type: |
credit |
| Period Type: |
duration |
|
| X |
- DefinitionAmount of increase (decrease) in deferred income and obligation to transfer product and service to customer for which consideration has been received or is receivable. Reference 1: http://www.xbrl.org/2003/role/exampleRef
-Name Accounting Standards Codification
-Section 45
-Paragraph 28
-Subparagraph (a)
-SubTopic 10
-Topic 230
-Publisher FASB
-URI https://asc.fasb.org//1943274/2147482740/230-10-45-28
| Name: |
us-gaap_IncreaseDecreaseInDeferredRevenue |
| Namespace Prefix: |
us-gaap_ |
| Data Type: |
xbrli:monetaryItemType |
| Balance Type: |
debit |
| Period Type: |
duration |
|
| X |
- DefinitionThe increase (decrease) during the reporting period in the aggregate value of all inventory held by the reporting entity, associated with underlying transactions that are classified as operating activities. Reference 1: http://fasb.org/us-gaap/role/ref/legacyRef
-Name Accounting Standards Codification
-Section 45
-Paragraph 28
-Subparagraph (a)
-SubTopic 10
-Topic 230
-Publisher FASB
-URI https://asc.fasb.org//1943274/2147482740/230-10-45-28
| Name: |
us-gaap_IncreaseDecreaseInInventories |
| Namespace Prefix: |
us-gaap_ |
| Data Type: |
xbrli:monetaryItemType |
| Balance Type: |
credit |
| Period Type: |
duration |
|
| X |
- References
+ Details
| Name: |
us-gaap_IncreaseDecreaseInOperatingCapitalAbstract |
| Namespace Prefix: |
us-gaap_ |
| Data Type: |
xbrli:stringItemType |
| Balance Type: |
na |
| Period Type: |
duration |
|
| X |
- DefinitionAmount of increase (decrease) in obligation for operating lease. Reference 1: http://www.xbrl.org/2009/role/commonPracticeRef
-Topic 230
-SubTopic 10
-Name Accounting Standards Codification
-Section 45
-Paragraph 28
-Subparagraph (a)
-Publisher FASB
-URI https://asc.fasb.org//1943274/2147482740/230-10-45-28
Reference 2: http://www.xbrl.org/2009/role/commonPracticeRef
-Name Accounting Standards Codification
-Section 50
-Paragraph 4
-Subparagraph (g)(1)
-SubTopic 20
-Topic 842
-Publisher FASB
-URI https://asc.fasb.org//1943274/2147478964/842-20-50-4
| Name: |
us-gaap_IncreaseDecreaseInOperatingLeaseLiability |
| Namespace Prefix: |
us-gaap_ |
| Data Type: |
xbrli:monetaryItemType |
| Balance Type: |
debit |
| Period Type: |
duration |
|
| X |
- DefinitionAmount of increase (decrease) in current assets classified as other. Reference 1: http://www.xbrl.org/2009/role/commonPracticeRef
-Topic 230
-SubTopic 10
-Name Accounting Standards Codification
-Section 45
-Paragraph 28
-Subparagraph (a)
-Publisher FASB
-URI https://asc.fasb.org//1943274/2147482740/230-10-45-28
| Name: |
us-gaap_IncreaseDecreaseInOtherCurrentAssets |
| Namespace Prefix: |
us-gaap_ |
| Data Type: |
xbrli:monetaryItemType |
| Balance Type: |
credit |
| Period Type: |
duration |
|
| X |
- DefinitionAmount of increase (decrease) in operating liabilities classified as other. Reference 1: http://fasb.org/us-gaap/role/ref/legacyRef
-Name Accounting Standards Codification
-Section 45
-Paragraph 28
-Subparagraph (a)
-SubTopic 10
-Topic 230
-Publisher FASB
-URI https://asc.fasb.org//1943274/2147482740/230-10-45-28
| Name: |
us-gaap_IncreaseDecreaseInOtherOperatingLiabilities |
| Namespace Prefix: |
us-gaap_ |
| Data Type: |
xbrli:monetaryItemType |
| Balance Type: |
debit |
| Period Type: |
duration |
|
| X |
- References
+ Details
| Name: |
us-gaap_InterestPaidAbstract |
| Namespace Prefix: |
us-gaap_ |
| Data Type: |
xbrli:stringItemType |
| Balance Type: |
na |
| Period Type: |
duration |
|
| X |
- DefinitionAmount of cash paid for interest, excluding capitalized interest, classified as operating activity. Includes, but is not limited to, payment to settle zero-coupon bond for accreted interest of debt discount and debt instrument with insignificant coupon interest rate in relation to effective interest rate of borrowing attributable to accreted interest of debt discount. Reference 1: http://www.xbrl.org/2003/role/disclosureRef
-Topic 230
-SubTopic 10
-Name Accounting Standards Codification
-Section 45
-Paragraph 17
-Subparagraph (d)
-Publisher FASB
-URI https://asc.fasb.org//1943274/2147482740/230-10-45-17
Reference 2: http://www.xbrl.org/2003/role/disclosureRef
-Topic 230
-SubTopic 10
-Name Accounting Standards Codification
-Section 45
-Paragraph 25
-Subparagraph (e)
-Publisher FASB
-URI https://asc.fasb.org//1943274/2147482740/230-10-45-25
Reference 3: http://www.xbrl.org/2003/role/disclosureRef
-Topic 230
-SubTopic 10
-Name Accounting Standards Codification
-Section 50
-Paragraph 2
-Publisher FASB
-URI https://asc.fasb.org//1943274/2147482913/230-10-50-2
| Name: |
us-gaap_InterestPaidNet |
| Namespace Prefix: |
us-gaap_ |
| Data Type: |
xbrli:monetaryItemType |
| Balance Type: |
credit |
| Period Type: |
duration |
|
| X |
- DefinitionAmount of cash inflow (outflow) from financing activities, including discontinued operations. Financing activity cash flows include obtaining resources from owners and providing them with a return on, and a return of, their investment; borrowing money and repaying amounts borrowed, or settling the obligation; and obtaining and paying for other resources obtained from creditors on long-term credit. Reference 1: http://www.xbrl.org/2003/role/disclosureRef
-Topic 230
-SubTopic 10
-Name Accounting Standards Codification
-Section 45
-Paragraph 24
-Publisher FASB
-URI https://asc.fasb.org//1943274/2147482740/230-10-45-24
| Name: |
us-gaap_NetCashProvidedByUsedInFinancingActivities |
| Namespace Prefix: |
us-gaap_ |
| Data Type: |
xbrli:monetaryItemType |
| Balance Type: |
debit |
| Period Type: |
duration |
|
| X |
- References
+ Details
| Name: |
us-gaap_NetCashProvidedByUsedInFinancingActivitiesAbstract |
| Namespace Prefix: |
us-gaap_ |
| Data Type: |
xbrli:stringItemType |
| Balance Type: |
na |
| Period Type: |
duration |
|
| X |
- DefinitionAmount of cash inflow (outflow) from investing activities, including discontinued operations. Investing activity cash flows include making and collecting loans and acquiring and disposing of debt or equity instruments and property, plant, and equipment and other productive assets. Reference 1: http://www.xbrl.org/2003/role/disclosureRef
-Topic 230
-SubTopic 10
-Name Accounting Standards Codification
-Section 45
-Paragraph 24
-Publisher FASB
-URI https://asc.fasb.org//1943274/2147482740/230-10-45-24
| Name: |
us-gaap_NetCashProvidedByUsedInInvestingActivities |
| Namespace Prefix: |
us-gaap_ |
| Data Type: |
xbrli:monetaryItemType |
| Balance Type: |
debit |
| Period Type: |
duration |
|
| X |
- References
+ Details
| Name: |
us-gaap_NetCashProvidedByUsedInInvestingActivitiesAbstract |
| Namespace Prefix: |
us-gaap_ |
| Data Type: |
xbrli:stringItemType |
| Balance Type: |
na |
| Period Type: |
duration |
|
| X |
- DefinitionAmount of cash inflow (outflow) from operating activities, including discontinued operations. Operating activity cash flows include transactions, adjustments, and changes in value not defined as investing or financing activities. Reference 1: http://fasb.org/us-gaap/role/ref/legacyRef
-Topic 230
-SubTopic 10
-Name Accounting Standards Codification
-Section 45
-Paragraph 28
-Publisher FASB
-URI https://asc.fasb.org//1943274/2147482740/230-10-45-28
Reference 2: http://fasb.org/us-gaap/role/ref/legacyRef
-Topic 230
-SubTopic 10
-Name Accounting Standards Codification
-Section 45
-Paragraph 24
-Publisher FASB
-URI https://asc.fasb.org//1943274/2147482740/230-10-45-24
Reference 3: http://fasb.org/us-gaap/role/ref/legacyRef
-Topic 230
-SubTopic 10
-Name Accounting Standards Codification
-Section 45
-Paragraph 25
-Publisher FASB
-URI https://asc.fasb.org//1943274/2147482740/230-10-45-25
| Name: |
us-gaap_NetCashProvidedByUsedInOperatingActivities |
| Namespace Prefix: |
us-gaap_ |
| Data Type: |
xbrli:monetaryItemType |
| Balance Type: |
na |
| Period Type: |
duration |
|
| X |
- References
+ Details
| Name: |
us-gaap_NetCashProvidedByUsedInOperatingActivitiesAbstract |
| Namespace Prefix: |
us-gaap_ |
| Data Type: |
xbrli:stringItemType |
| Balance Type: |
na |
| Period Type: |
duration |
|
| X |
- DefinitionThe net cash paid (received) associated with the acquisition or disposal of all investments, including securities and other assets.
| Name: |
us-gaap_PaymentsForProceedsFromInvestments |
| Namespace Prefix: |
us-gaap_ |
| Data Type: |
xbrli:monetaryItemType |
| Balance Type: |
credit |
| Period Type: |
duration |
|
| X |
- DefinitionThe cash outflow associated with the development, modification or acquisition of software programs or applications for internal use (that is, not to be sold, leased or otherwise marketed to others) that qualify for capitalization. Reference 1: http://fasb.org/us-gaap/role/ref/legacyRef
-Topic 230
-SubTopic 10
-Name Accounting Standards Codification
-Section 45
-Paragraph 13
-Subparagraph (c)
-Publisher FASB
-URI https://asc.fasb.org//1943274/2147482740/230-10-45-13
| Name: |
us-gaap_PaymentsForSoftware |
| Namespace Prefix: |
us-gaap_ |
| Data Type: |
xbrli:monetaryItemType |
| Balance Type: |
credit |
| Period Type: |
duration |
|
| X |
- DefinitionAmount of cash inflow from exercise of option under share-based payment arrangement. Reference 1: http://fasb.org/us-gaap/role/ref/legacyRef
-Name Accounting Standards Codification
-Section 45
-Paragraph 14
-Subparagraph (a)
-SubTopic 10
-Topic 230
-Publisher FASB
-URI https://asc.fasb.org//1943274/2147482740/230-10-45-14
Reference 2: http://fasb.org/us-gaap/role/ref/legacyRef
-Name Accounting Standards Codification
-Section 50
-Paragraph 2A
-Subparagraph (a)
-SubTopic 10
-Topic 718
-Publisher FASB
-URI https://asc.fasb.org//1943274/2147480429/718-10-50-2A
| Name: |
us-gaap_ProceedsFromStockOptionsExercised |
| Namespace Prefix: |
us-gaap_ |
| Data Type: |
xbrli:monetaryItemType |
| Balance Type: |
debit |
| Period Type: |
duration |
|
| X |
- DefinitionThe cash inflow associated with the amount received from holders exercising their stock warrants. Reference 1: http://www.xbrl.org/2009/role/commonPracticeRef
-Topic 230
-SubTopic 10
-Name Accounting Standards Codification
-Section 45
-Paragraph 14
-Subparagraph (a)
-Publisher FASB
-URI https://asc.fasb.org//1943274/2147482740/230-10-45-14
| Name: |
us-gaap_ProceedsFromWarrantExercises |
| Namespace Prefix: |
us-gaap_ |
| Data Type: |
xbrli:monetaryItemType |
| Balance Type: |
debit |
| Period Type: |
duration |
|
| X |
- DefinitionThe consolidated profit or loss for the period, net of income taxes, including the portion attributable to the noncontrolling interest. Reference 1: http://www.xbrl.org/2003/role/disclosureRef
-Topic 235
-SubTopic 10
-Name Accounting Standards Codification
-Section S99
-Paragraph 1
-Subparagraph (SX 210.4-08(g)(1)(ii))
-Publisher FASB
-URI https://asc.fasb.org//1943274/2147480678/235-10-S99-1
Reference 2: http://www.xbrl.org/2003/role/disclosureRef
-Topic 323
-SubTopic 10
-Name Accounting Standards Codification
-Section 50
-Paragraph 3
-Subparagraph (c)
-Publisher FASB
-URI https://asc.fasb.org//1943274/2147481687/323-10-50-3
Reference 3: http://www.xbrl.org/2003/role/disclosureRef
-Topic 825
-SubTopic 10
-Name Accounting Standards Codification
-Section 50
-Paragraph 28
-Subparagraph (f)
-Publisher FASB
-URI https://asc.fasb.org//1943274/2147482907/825-10-50-28
Reference 4: http://www.xbrl.org/2003/role/disclosureRef
-Topic 250
-SubTopic 10
-Name Accounting Standards Codification
-Section 50
-Paragraph 1
-Subparagraph (b)(2)
-Publisher FASB
-URI https://asc.fasb.org//1943274/2147483443/250-10-50-1
Reference 5: http://www.xbrl.org/2003/role/disclosureRef
-Topic 815
-SubTopic 40
-Name Accounting Standards Codification
-Section 65
-Paragraph 1
-Subparagraph (f)
-Publisher FASB
-URI https://asc.fasb.org//1943274/2147480175/815-40-65-1
Reference 6: http://www.xbrl.org/2003/role/disclosureRef
-Topic 250
-SubTopic 10
-Name Accounting Standards Codification
-Section 50
-Paragraph 8
-Publisher FASB
-URI https://asc.fasb.org//1943274/2147483443/250-10-50-8
Reference 7: http://www.xbrl.org/2003/role/disclosureRef
-Topic 250
-SubTopic 10
-Name Accounting Standards Codification
-Section 50
-Paragraph 9
-Publisher FASB
-URI https://asc.fasb.org//1943274/2147483443/250-10-50-9
Reference 8: http://www.xbrl.org/2003/role/exampleRef
-Topic 946
-SubTopic 830
-Name Accounting Standards Codification
-Section 55
-Paragraph 11
-Publisher FASB
-URI https://asc.fasb.org//1943274/2147480167/946-830-55-11
Reference 9: http://www.xbrl.org/2003/role/disclosureRef
-Topic 946
-SubTopic 205
-Name Accounting Standards Codification
-Section 45
-Paragraph 3
-Subparagraph (a)
-Publisher FASB
-URI https://asc.fasb.org//1943274/2147480767/946-205-45-3
Reference 10: http://www.xbrl.org/2003/role/disclosureRef
-Topic 946
-SubTopic 220
-Name Accounting Standards Codification
-Section 45
-Paragraph 7
-Publisher FASB
-URI https://asc.fasb.org//1943274/2147483581/946-220-45-7
Reference 11: http://www.xbrl.org/2003/role/disclosureRef
-Topic 944
-SubTopic 220
-Name Accounting Standards Codification
-Section S99
-Paragraph 1
-Subparagraph (SX 210.7-04(16))
-Publisher FASB
-URI https://asc.fasb.org//1943274/2147483586/944-220-S99-1
Reference 12: http://www.xbrl.org/2003/role/disclosureRef
-Topic 280
-SubTopic 10
-Name Accounting Standards Codification
-Section 50
-Paragraph 22
-Publisher FASB
-URI https://asc.fasb.org//1943274/2147482810/280-10-50-22
Reference 13: http://www.xbrl.org/2003/role/disclosureRef
-Topic 946
-SubTopic 220
-Name Accounting Standards Codification
-Section S99
-Paragraph 1
-Subparagraph (SX 210.6-07(9))
-Publisher FASB
-URI https://asc.fasb.org//1943274/2147483575/946-220-S99-1
Reference 14: http://www.xbrl.org/2003/role/disclosureRef
-Topic 946
-SubTopic 220
-Name Accounting Standards Codification
-Section S99
-Paragraph 3
-Subparagraph (SX 210.6-09(1)(d))
-Publisher FASB
-URI https://asc.fasb.org//1943274/2147483575/946-220-S99-3
Reference 15: http://www.xbrl.org/2003/role/disclosureRef
-Topic 810
-SubTopic 10
-Name Accounting Standards Codification
-Section 45
-Paragraph 19
-Publisher FASB
-URI https://asc.fasb.org//1943274/2147481231/810-10-45-19
Reference 16: http://www.xbrl.org/2009/role/commonPracticeRef
-Topic 220
-SubTopic 10
-Name Accounting Standards Codification
-Section 50
-Paragraph 6
-Publisher FASB
-URI https://asc.fasb.org//1943274/2147482765/220-10-50-6
Reference 17: http://www.xbrl.org/2003/role/disclosureRef
-Topic 470
-SubTopic 10
-Name Accounting Standards Codification
-Section S99
-Paragraph 1A
-Subparagraph (SX 210.13-01(a)(4)(i))
-Publisher FASB
-URI https://asc.fasb.org//1943274/2147480097/470-10-S99-1A
Reference 18: http://www.xbrl.org/2009/role/commonPracticeRef
-Topic 470
-SubTopic 10
-Name Accounting Standards Codification
-Section S99
-Paragraph 1A
-Subparagraph (SX 210.13-01(a)(4)(ii))
-Publisher FASB
-URI https://asc.fasb.org//1943274/2147480097/470-10-S99-1A
Reference 19: http://www.xbrl.org/2003/role/disclosureRef
-Topic 470
-SubTopic 10
-Name Accounting Standards Codification
-Section S99
-Paragraph 1A
-Subparagraph (SX 210.13-01(a)(4)(iii)(A))
-Publisher FASB
-URI https://asc.fasb.org//1943274/2147480097/470-10-S99-1A
Reference 20: http://www.xbrl.org/2003/role/disclosureRef
-Topic 470
-SubTopic 10
-Name Accounting Standards Codification
-Section S99
-Paragraph 1A
-Subparagraph (SX 210.13-01(a)(4)(iv))
-Publisher FASB
-URI https://asc.fasb.org//1943274/2147480097/470-10-S99-1A
Reference 21: http://www.xbrl.org/2003/role/disclosureRef
-Topic 470
-SubTopic 10
-Name Accounting Standards Codification
-Section S99
-Paragraph 1A
-Subparagraph (SX 210.13-01(a)(5))
-Publisher FASB
-URI https://asc.fasb.org//1943274/2147480097/470-10-S99-1A
Reference 22: http://www.xbrl.org/2003/role/disclosureRef
-Topic 470
-SubTopic 10
-Name Accounting Standards Codification
-Section S99
-Paragraph 1B
-Subparagraph (SX 210.13-02(a)(4)(i))
-Publisher FASB
-URI https://asc.fasb.org//1943274/2147480097/470-10-S99-1B
Reference 23: http://www.xbrl.org/2003/role/disclosureRef
-Topic 470
-SubTopic 10
-Name Accounting Standards Codification
-Section S99
-Paragraph 1B
-Subparagraph (SX 210.13-02(a)(4)(iii)(A))
-Publisher FASB
-URI https://asc.fasb.org//1943274/2147480097/470-10-S99-1B
Reference 24: http://www.xbrl.org/2003/role/disclosureRef
-Topic 470
-SubTopic 10
-Name Accounting Standards Codification
-Section S99
-Paragraph 1B
-Subparagraph (SX 210.13-02(a)(4)(iii)(B))
-Publisher FASB
-URI https://asc.fasb.org//1943274/2147480097/470-10-S99-1B
Reference 25: http://www.xbrl.org/2003/role/disclosureRef
-Topic 470
-SubTopic 10
-Name Accounting Standards Codification
-Section S99
-Paragraph 1B
-Subparagraph (SX 210.13-02(a)(4)(iv))
-Publisher FASB
-URI https://asc.fasb.org//1943274/2147480097/470-10-S99-1B
Reference 26: http://www.xbrl.org/2003/role/disclosureRef
-Topic 470
-SubTopic 10
-Name Accounting Standards Codification
-Section S99
-Paragraph 1B
-Subparagraph (SX 210.13-02(a)(5))
-Publisher FASB
-URI https://asc.fasb.org//1943274/2147480097/470-10-S99-1B
Reference 27: http://www.xbrl.org/2003/role/disclosureRef
-Topic 280
-SubTopic 10
-Name Accounting Standards Codification
-Section 50
-Paragraph 30
-Subparagraph (b)
-Publisher FASB
-URI https://asc.fasb.org//1943274/2147482810/280-10-50-30
Reference 28: http://www.xbrl.org/2003/role/disclosureRef
-Topic 280
-SubTopic 10
-Name Accounting Standards Codification
-Section 50
-Paragraph 32
-Subparagraph (f)
-Publisher FASB
-URI https://asc.fasb.org//1943274/2147482810/280-10-50-32
Reference 29: http://www.xbrl.org/2003/role/exampleRef
-Topic 280
-SubTopic 10
-Name Accounting Standards Codification
-Section 50
-Paragraph 31
-Publisher FASB
-URI https://asc.fasb.org//1943274/2147482810/280-10-50-31
Reference 30: http://www.xbrl.org/2003/role/disclosureRef
-Topic 280
-SubTopic 10
-Name Accounting Standards Codification
-Section 50
-Paragraph 32
-Subparagraph (c)
-Publisher FASB
-URI https://asc.fasb.org//1943274/2147482810/280-10-50-32
Reference 31: http://www.xbrl.org/2003/role/disclosureRef
-Topic 942
-SubTopic 235
-Name Accounting Standards Codification
-Section S99
-Paragraph 1
-Subparagraph (SX 210.9-05(b)(2))
-Publisher FASB
-URI https://asc.fasb.org//1943274/2147479557/942-235-S99-1
Reference 32: http://www.xbrl.org/2003/role/disclosureRef
-Topic 205
-SubTopic 20
-Name Accounting Standards Codification
-Section 50
-Paragraph 7
-Publisher FASB
-URI https://asc.fasb.org//1943274/2147483499/205-20-50-7
Reference 33: http://www.xbrl.org/2003/role/exampleRef
-Topic 810
-SubTopic 10
-Name Accounting Standards Codification
-Section 55
-Paragraph 4J
-Publisher FASB
-URI https://asc.fasb.org//1943274/2147481175/810-10-55-4J
Reference 34: http://www.xbrl.org/2003/role/exampleRef
-Topic 810
-SubTopic 10
-Name Accounting Standards Codification
-Section 55
-Paragraph 4K
-Publisher FASB
-URI https://asc.fasb.org//1943274/2147481175/810-10-55-4K
Reference 35: http://www.xbrl.org/2003/role/disclosureRef
-Topic 220
-SubTopic 10
-Name Accounting Standards Codification
-Section 45
-Paragraph 1A
-Subparagraph (a)
-Publisher FASB
-URI https://asc.fasb.org//1943274/2147482790/220-10-45-1A
Reference 36: http://www.xbrl.org/2003/role/disclosureRef
-Topic 220
-SubTopic 10
-Name Accounting Standards Codification
-Section 45
-Paragraph 1B
-Subparagraph (a)
-Publisher FASB
-URI https://asc.fasb.org//1943274/2147482790/220-10-45-1B
Reference 37: http://www.xbrl.org/2003/role/disclosureRef
-Topic 230
-SubTopic 10
-Name Accounting Standards Codification
-Section 45
-Paragraph 2
-Publisher FASB
-URI https://asc.fasb.org//1943274/2147482740/230-10-45-2
Reference 38: http://www.xbrl.org/2003/role/disclosureRef
-Topic 810
-SubTopic 10
-Name Accounting Standards Codification
-Section 50
-Paragraph 1A
-Subparagraph (a)(1)
-Publisher FASB
-URI https://asc.fasb.org//1943274/2147481203/810-10-50-1A
Reference 39: http://www.xbrl.org/2003/role/disclosureRef
-Topic 810
-SubTopic 10
-Name Accounting Standards Codification
-Section 50
-Paragraph 1A
-Subparagraph (c)(1)
-Publisher FASB
-URI https://asc.fasb.org//1943274/2147481203/810-10-50-1A
| Name: |
us-gaap_ProfitLoss |
| Namespace Prefix: |
us-gaap_ |
| Data Type: |
xbrli:monetaryItemType |
| Balance Type: |
credit |
| Period Type: |
duration |
|
| X |
- DefinitionAmount of noncash expense for share-based payment arrangement. Reference 1: http://fasb.org/us-gaap/role/ref/legacyRef
-Name Accounting Standards Codification
-Section 45
-Paragraph 28
-Subparagraph (a)
-SubTopic 10
-Topic 230
-Publisher FASB
-URI https://asc.fasb.org//1943274/2147482740/230-10-45-28
| Name: |
us-gaap_ShareBasedCompensation |
| Namespace Prefix: |
us-gaap_ |
| Data Type: |
xbrli:monetaryItemType |
| Balance Type: |
debit |
| Period Type: |
duration |
|
v3.23.3
BASIS OF PRESENTATION
|
9 Months Ended |
Sep. 30, 2023 |
|---|
| Organization, Consolidation and Presentation of Financial Statements [Abstract] |
|
| BASIS OF PRESENTATION |
NOTE
1— BASIS OF PRESENTATION
The
accompanying unaudited condensed consolidated financial statements of Acorn Energy, Inc. (“Acorn”) and its subsidiaries,
OmniMetrix, LLC (“OmniMetrix”) and OMX Holdings, Inc. (collectively, with Acorn and OmniMetrix, “the Company”)
have been prepared in accordance with accounting principles generally accepted in the United States of America for interim financial
information and with the instructions to Article 8 of Regulation S-X. Accordingly, they do not include all of the information and footnotes
required by accounting principles generally accepted in the United States of America for complete consolidated financial statements.
In the opinion of management, all adjustments (consisting of normal recurring adjustments) considered necessary for a fair presentation
have been included. Operating results for the nine- and three-month periods ended September 30, 2023 and 2022 are not necessarily indicative
of the results that may be expected for the year ending December 31, 2023. All dollar amounts are rounded to the nearest thousand and,
thus, are approximate.
These
unaudited condensed consolidated financial statements should be read in conjunction with the consolidated financial statements and footnotes
thereto included in the Company’s Annual Report on Form 10-K for the year ended December 31, 2022, filed with the Securities and
Exchange Commission on March 16, 2023.
Reverse
Stock Split
On
September 5, 2023, the Board of Directors of Acorn approved a Certificate of Amendment to Acorn’s Restated Certificate of Incorporation
(the “Certificate of Amendment”) that provided for a 1-for-16 reverse stock split of Acorn’s Common Stock (the “Reverse
Stock Split”). Acorn filed the Certificate of Amendment with the Secretary of State of the State of Delaware on September 6, 2023,
and the Reverse Stock Split became effective at 5:00 p.m. EDT on September 7, 2023. At the effective time of the Reverse Stock Split,
every sixteen issued and outstanding shares of Acorn’s Common Stock were automatically combined into one issued and outstanding
share of Common Stock, without any change in the par value per share. Stockholders who would have otherwise been entitled to fractional
shares of Common Stock, as a result of the Reverse Stock Split, received a cash payment in lieu of receiving fractional shares. The value
of the fractional shares repurchased was $347 and equated to fifty-eight shares. All share and per share amounts of common stock, options
and warrants contained in this Quarterly Report on Form 10-Q and the accompanying unaudited condensed consolidated financial statements
and related footnotes have been restated for all periods to give retroactive effect to the Reverse Stock Split and the related fractional
share repurchase for all prior periods presented. Accordingly, the unaudited Condensed Consolidated Statement of Stockholders’
Deficit reflects the impact of the Reverse Stock Split by reclassifying from “Common Stock” to “Additional paid in
capital” an amount equal to the aggregate par value of the number of shares by which the total number of shares outstanding decreased
as a result of the Reverse Stock Split.
|
| X |
- DefinitionThe entire disclosure for the nature of an entity's business, major products or services, principal markets including location, and the relative importance of its operations in each business and the basis for the determination, including but not limited to, assets, revenues, or earnings. For an entity that has not commenced principal operations, disclosures about the risks and uncertainties related to the activities in which the entity is currently engaged and an understanding of what those activities are being directed toward. Reference 1: http://www.xbrl.org/2003/role/disclosureRef
-Name Accounting Standards Codification
-Topic 275
-Publisher FASB
-URI https://asc.fasb.org//275/tableOfContent
Reference 2: http://www.xbrl.org/2003/role/disclosureRef
-Name Accounting Standards Codification
-Section 50
-Paragraph 1
-Subparagraph (a)
-SubTopic 10
-Topic 275
-Publisher FASB
-URI https://asc.fasb.org//1943274/2147482861/275-10-50-1
| Name: |
us-gaap_NatureOfOperations |
| Namespace Prefix: |
us-gaap_ |
| Data Type: |
dtr-types:textBlockItemType |
| Balance Type: |
na |
| Period Type: |
duration |
|
| X |
- References
+ Details
| Name: |
us-gaap_OrganizationConsolidationAndPresentationOfFinancialStatementsAbstract |
| Namespace Prefix: |
us-gaap_ |
| Data Type: |
xbrli:stringItemType |
| Balance Type: |
na |
| Period Type: |
duration |
|
v3.23.3
ACCOUNTING POLICIES
|
9 Months Ended |
Sep. 30, 2023 |
|---|
| Accounting Policies [Abstract] |
|
| ACCOUNTING POLICIES |
NOTE
2—ACCOUNTING POLICIES
Use
of Estimates in Preparation of Financial Statements
The
preparation of unaudited condensed consolidated financial statements requires management to make estimates and assumptions that affect
the reported amounts of assets and liabilities and the disclosure of contingent assets and liabilities as of the date of the unaudited
condensed consolidated financial statements, and the reported amounts of revenues and expenses during the reporting periods. Actual results
could differ from those estimates.
As
applicable to these unaudited condensed consolidated financial statements, the most significant estimates and assumptions relate to uncertainties
with respect to revenue recognition and management’s projections related to the going concern analysis.
Concentrations
of Credit Risk
Financial
instruments, which potentially subject the Company to concentrations of credit risk, consist principally of cash and trade accounts receivable.
The Company’s cash was deposited with a U.S. bank and amounted to $1,749,000 at September 30, 2023. The Company does not believe
there is a significant risk of non-performance by its counterparties. For the three-month period ended September 30, 2023, there were
no customers that represented greater than 10% of the Company’s total invoiced sales. For the nine-month period ended September
30, 2023, there was one customer that represented 11% of the Company’s total invoiced sales. At September 30, 2023, the Company
did not have any customers that represented greater than 10% of our total accounts receivable. Approximately 12% of the accounts receivable
at December 31, 2022 was due from one customer which was subsequently collected in full. Credit risk with respect to the balance of trade
receivables is generally diversified due to the number of entities comprising the Company’s customer base. Although we do not believe
there is significant risk of non-performance by these counterparties, any failures or defaults on their part could negatively impact
the value of our financial instruments and could have a material adverse effect on our business, operations or financial condition.
Inventory
Inventories
are comprised of components (raw materials), work-in-process and finished goods, which are measured at the lower of cost or net realizable
value.
Raw
materials inventory is generally comprised of radios, cables, antennas, and electrical components. Finished goods inventory consists
of fully assembled systems ready for final shipment to the customer. Costs are determined at cost of acquisition on a weighted average
basis and include all outside production and applicable shipping costs.
All
inventories are periodically reviewed to identify slow-moving and obsolete inventory. Management conducted an assessment and wrote-off
inventory carried at $9,000 for the nine months ended September 30, 2023, of which $1,000 was written off in the three months ended September
30, 2023.
Revenue
Recognition
On
September 1, 2023, OmniMetrix launched an updated version of its products that includes new functionality in its TrueGuard,
AIRGuard, Patriot and Hero products that allows its customers to have options as it relates to obtaining and utilizing the data that
is provided by its hardware devices. This new functionality allows for SIM card options, configuration options regarding IP address
endpoints and DNS routes, and access to OmniMetrix’s over-the-air data protocol. This product update allows customers to have
the option to purchase OmniMetrix’s monitoring service, monitor the products themselves if they have the ability in-house, or
choose another monitoring provider if they so desire. OmniMetrix’s prior hardware product version could not function as a
distinct product from its monitoring services. This new version’s functionality results in OmniMetrix’s hardware and
monitoring services being capable of being two distinct products and services. OmniMetrix recognizes revenue, COGS and commissions
from the sale of the new version of its hardware products sold when the product is shipped rather than over the estimated time that
the unit is in service for the customer. Monitoring revenue continues to be deferred and amortized over the period that the
monitoring services are rendered. The remaining balance of deferred revenue from the prior version of these products will continue
to be amortized each period until it is fully amortized. The modification to the circuit boards and embedded firmware of hardware
enclosures in inventory as of August 31, 2023 were made such that only the new version of these products was sold subsequent to this
date.
Basic
and Diluted Net Income (Loss) Per Share
Basic
net income (loss) per share is computed by dividing the net income (loss) attributable to Acorn Energy, Inc. by the weighted average
number of shares outstanding during the period, excluding treasury stock. Diluted net income (loss) per share is computed by dividing
the net income (loss) by the weighted average number of shares outstanding plus the dilutive potential of common shares which would result
from the exercise of stock options. The dilutive effects of stock options are excluded from the computation of diluted net income (loss)
per share if doing so would be antidilutive. For the nine-month period ending September 30, 2023, the weighted average number of options
that were excluded from the computation of diluted net loss, as they had an antidilutive effect, was 6,000 (which have a weighted average
exercise price of $8.49). For the three-month period ending September 30, 2023, there were no options that were excluded from the computation
of diluted net loss due to having an antidilutive effect. For both the nine- and three-month periods ending September 30, 2022, the number
of options that were excluded from the computation of diluted net loss, as they had an antidilutive effect, was 60,000 (which have a
weighted average exercise price of $6.72) and the number of warrants that were excluded from the computation of diluted net loss, as
they had an antidilutive effect, was 2,187 (which had a weighted average exercise price of $2.08).
The
following data represents the amounts used in computing EPS and the effect on net income (loss) and the weighted average number of shares
of dilutive potential common stock (in thousands):
SCHEDULE OF EFFECT ON NET INCOME LOSS AND WEIGHTED AVERAGE NUMBER OF SHARES
| | |
2023 | | |
2022 | | |
2023 | | |
2022 | |
| | |
Nine
months ended September
30, | | |
Three
months ended September
30, | |
| | |
2023 | | |
2022 | | |
2023 | | |
2022 | |
| Net income
(loss) available to common stockholders | |
$ | 35 | | |
$ | (556 | ) | |
$ | 24 | | |
$ | (210 | ) |
| | |
| | | |
| | | |
| | | |
| | |
| Weighted average share outstanding: | |
| | | |
| | | |
| | | |
| | |
| Basic | |
| 2,484 | | |
| 2,481 | | |
| 2,485 | | |
| 2,481 | |
| Add:
Stock options | |
| 22 | | |
| — | | |
| 47 | | |
| — | |
| Diluted | |
| 2,506 | | |
| 2,481 | | |
| 2,532 | | |
| 2,481 | |
| | |
| | | |
| | | |
| | | |
| | |
| Basic and diluted net income (loss) per share | |
$ | 0.01 | | |
$ | (0.22 | ) | |
$ | 0.01 | | |
$ | (0.08 | ) |
Recently
Adopted Accounting Standards
Other
than the pronouncement noted below, there have been no recent accounting pronouncements or changes in accounting standards during
the nine-month period ended September 30, 2023 that would affect the Company’s condensed consolidated financial
statements.
On
January 1, 2023, the Company adopted ASU 2016-13, “Financial Instruments – Credit Losses (Topic 326): Measurement of Credit
Losses on Financial Instruments.” This guidance was issued to provide financial statement users with more useful information about
the expected credit losses on financial instruments and other commitments to extend credit held by a reporting entity at each reporting
date. Specifically, this guidance requires entities to utilize a new “expected loss” model as it relates to trade and other
receivables. The adoption of the standard impacts the way the Company estimates the allowance for doubtful accounts on its trade and
other receivables. Refer to Note 4, “Allowance for Credit Losses,” for further information regarding the Company’s
allowance for expected credit losses.
|
| X |
- References
+ Details
| Name: |
us-gaap_AccountingPoliciesAbstract |
| Namespace Prefix: |
us-gaap_ |
| Data Type: |
xbrli:stringItemType |
| Balance Type: |
na |
| Period Type: |
duration |
|
| X |
- DefinitionThe entire disclosure for all significant accounting policies of the reporting entity. Reference 1: http://www.xbrl.org/2003/role/disclosureRef
-Topic 235
-SubTopic 10
-Name Accounting Standards Codification
-Section 50
-Paragraph 1
-Publisher FASB
-URI https://asc.fasb.org//1943274/2147483426/235-10-50-1
Reference 2: http://fasb.org/us-gaap/role/ref/legacyRef
-Topic 235
-Name Accounting Standards Codification
-Publisher FASB
-URI https://asc.fasb.org//235/tableOfContent
| Name: |
us-gaap_SignificantAccountingPoliciesTextBlock |
| Namespace Prefix: |
us-gaap_ |
| Data Type: |
dtr-types:textBlockItemType |
| Balance Type: |
na |
| Period Type: |
duration |
|
v3.23.3
LIQUIDITY
|
9 Months Ended |
Sep. 30, 2023 |
|---|
| Liquidity |
|
| LIQUIDITY |
NOTE
3—LIQUIDITY
As
of September 30, 2023, the Company had cash of $1,749,000.
At
September 30, 2023, the Company had negative working capital of $513,000. The Company’s working capital includes $1,749,000 of
cash and deferred revenue of $4,270,000. Such deferred revenue does not require a significant cash outlay for the revenue to be recognized.
Net cash increased during the nine months ended September 30, 2023 by $299,000, of which $366,000 was provided by operating activities,
$72,000 was used in investing activities and $5,000 was provided by financing activities.
As
of November 7, 2023, the Company had cash of $1,684,000. The Company believes that such cash, plus the cash generated from operations,
will provide sufficient liquidity to finance the operating activities of the Company at its current level of operations for the twelve
months from the issuance of these unaudited condensed consolidated financial statements. The Company may, at some point, elect to obtain
a new line of credit or other source of financing to fund additional investments in the business.
|
| X |
- References
+ Details
| Name: |
ACFN_DisclosureLiquidityAbstract |
| Namespace Prefix: |
ACFN_ |
| Data Type: |
xbrli:stringItemType |
| Balance Type: |
na |
| Period Type: |
duration |
|
| X |
- Definition
+ References
+ Details
| Name: |
ACFN_LiquidityTextBlock |
| Namespace Prefix: |
ACFN_ |
| Data Type: |
dtr-types:textBlockItemType |
| Balance Type: |
na |
| Period Type: |
duration |
|
v3.23.3
ALLOWANCE FOR CREDIT LOSSES
|
9 Months Ended |
Sep. 30, 2023 |
|---|
| Receivables [Abstract] |
|
| ALLOWANCE FOR CREDIT LOSSES |
NOTE
4—ALLOWANCE FOR CREDIT LOSSES
For
the Company, ASU 2016-13, “Financial Instruments – Credit Losses (Topic 326): Measurement of Credit Losses on Financial Instruments,”
applies to its contract assets (deferred COGS and deferred sales commissions), lease receivables (sublease, see Note 6) and trade receivables.
There are no expected or estimated credit losses on the Company’s contract assets or its lease receivable based on the Company’s
implementation of ASU 2016-13.
The
Company’s trade receivables primarily arise from the sale of our products to independent residential dealers, industrial distributors
and dealers, national and regional retailers, equipment distributors, and certain end users with payment terms generally ranging from
30 to 60 days. The Company evaluates the credit risk of a customer when extending credit based on a combination of various financial
and qualitative factors that may affect the customer’s ability to pay. These factors include the customer’s financial condition
and past payment experience.
The
Company maintains an allowance for credit losses, which represents an estimate of expected losses over the remaining contractual life
of its receivables considering current market conditions and estimates for supportable forecasts when appropriate. The Company measures
expected credit losses on its trade receivables on an entity-by-entity basis. The estimate of expected credit losses considers a historical
loss experience rate that is adjusted for delinquency trends, collection experience, and/or economic risk where appropriate. Additionally,
management develops a specific allowance for trade receivables known to have a high risk of expected future credit loss.
The
Company has historically experienced immaterial write-offs given the nature of the customers that receive credit. As of September 30,
2023, the Company had gross receivables of $590,000 and an allowance for credit losses of $7,000.
The
following is a tabular reconciliation of the Company’s allowance for credit losses:
SCHEDULE
OF ALLOWANCES FOR CREDIT LOSSES
| | |
September
30, 2023 | | |
December
31, 2022 | |
| | |
As
of | |
| | |
September
30, 2023 | | |
December
31, 2022 | |
| | |
(in thousands) | |
| Balance at beginning of period | |
$ | 10 | | |
$ | 6 | |
| Provision for credit losses | |
| 3 | | |
| 3 | |
| Net (charge-offs) credits | |
| (6 | ) | |
| 1 | |
| Balance at end of period | |
$ | 7 | | |
$ | 10 | |
|
| X |
- DefinitionThe entire disclosure for allowance for credit losses. Reference 1: http://fasb.org/us-gaap/role/ref/legacyRef
-Name Accounting Standards Codification
-Topic 310
-Publisher FASB
-URI https://asc.fasb.org//310/tableOfContent
| Name: |
us-gaap_AllowanceForCreditLossesTextBlock |
| Namespace Prefix: |
us-gaap_ |
| Data Type: |
dtr-types:textBlockItemType |
| Balance Type: |
na |
| Period Type: |
duration |
|
| X |
- References
+ Details
| Name: |
us-gaap_ReceivablesAbstract |
| Namespace Prefix: |
us-gaap_ |
| Data Type: |
xbrli:stringItemType |
| Balance Type: |
na |
| Period Type: |
duration |
|
v3.23.3
INVENTORY
|
9 Months Ended |
Sep. 30, 2023 |
|---|
| Inventory Disclosure [Abstract] |
|
| INVENTORY |
NOTE
5—INVENTORY
SCHEDULE
OF INVENTORY
| | |
September
30, 2023 | | |
December
31, 2022 | |
| | |
As
of | |
| | |
September
30, 2023 | | |
December
31, 2022 | |
| | |
(in thousands) | |
| Raw materials | |
$ | 859 | | |
$ | 684 | |
| Finished goods | |
| 50 | | |
| 105 | |
| Inventory net | |
$ | 909 | | |
$ | 789 | |
At
September 30, 2023 and December 31, 2022, the Company’s inventory reserve was $9,000 and $4,000, respectively.
All
inventories are periodically reviewed to identify slow-moving and obsolete inventory. Management conducted an assessment and wrote-off
inventory carried at $9,000 for the nine months ended September 30, 2023, of which $1,000 was written off in the three months ended September
30, 2023.
|
| X |
- References
+ Details
| Name: |
us-gaap_InventoryDisclosureAbstract |
| Namespace Prefix: |
us-gaap_ |
| Data Type: |
xbrli:stringItemType |
| Balance Type: |
na |
| Period Type: |
duration |
|
| X |
- DefinitionThe entire disclosure for inventory. Includes, but is not limited to, the basis of stating inventory, the method of determining inventory cost, the classes of inventory, and the nature of the cost elements included in inventory. Reference 1: http://www.xbrl.org/2003/role/disclosureRef
-Topic 330
-Name Accounting Standards Codification
-Publisher FASB
-URI https://asc.fasb.org//330/tableOfContent
| Name: |
us-gaap_InventoryDisclosureTextBlock |
| Namespace Prefix: |
us-gaap_ |
| Data Type: |
dtr-types:textBlockItemType |
| Balance Type: |
na |
| Period Type: |
duration |
|
v3.23.3
LEASES
|
9 Months Ended |
Sep. 30, 2023 |
|---|
| Leases |
|
| LEASES |
NOTE
6—LEASES
OmniMetrix
leases office space and office equipment under operating lease agreements. The office lease has an expiration date of September 30, 2025.
The office equipment lease was entered into in April 2019 and has a sixty-month term. Operating lease payments for the nine months ended
September 30, 2023 and 2022 were $96,000 and $93,000, respectively. Operating lease payments for the three months ended September 30,
2023 and 2022 were $33,000 and $31,000, respectively. The future minimum lease payments on non-cancellable operating leases as of September
30, 2023 using a discount rate of 4.5% are $250,000. The 4.5% discount rate used is the incremental borrowing rate which, as defined
in ASC 842, is the rate of interest that a lessee would have to pay to borrow, on a collateralized basis, over a similar term and in
a similar economic environment, an amount equal to the lease payments.
Supplemental
cash flow information related to leases consisted of the following (in thousands):
SCHEDULE
OF SUPPLEMENTAL CASH FLOW INFORMATION RELATED TO LEASES
| | |
For
the Nine Months Ending
September 30, | |
| | |
2023 | | |
2022 | |
| Cash paid for operating lease liabilities | |
$ | 96 | | |
$ | 93 | |
| | |
| | | |
| | |
Supplemental
balance sheet information related to leases consisted of the following:
SCHEDULE
OF SUPPLEMENTAL BALANCE SHEET INFORMATION RELATED TO LEASES
| | |
| 2023 | |
| Weighted average remaining lease
terms for operating leases | |
| 1.99
years | |
| | |
| | |
The
table below reconciles the undiscounted future minimum lease payments under non-cancelable lease agreements having initial terms of more
than one year to the total operating lease liabilities recognized on the unaudited condensed consolidated balance sheet as of September
30, 2023 (in thousands):
SCHEDULE
OF FUTURE MINIMUM LEASE PAYMENTS
| | |
Year
ended September
30, | |
| 2024 | |
$ | 129 | |
| 2025 | |
| 132 | |
| Total undiscounted cash flows | |
| 261 | |
| Less: Imputed interest | |
| (11 | ) |
| Present value of
operating lease liabilities (a) | |
$ | 250 | |
| |
(a) |
Includes
current portion of $121,000 for operating leases. |
On
July 6, 2021, the Company entered into an agreement with King Industrial Realty, Inc., to sublease from the Company 1,900 square feet
of office space of the Company’s 21,000 square feet of office and production space in the Hamilton Mill Business Park located in
Buford, Georgia, for a monthly sublease payment of $2,375 (plus an annual escalator each year of 3%) which includes the base rent plus
a pro-rata share of utilities, property taxes and insurance. Fifty percent of any excess rent received above the per square foot amount
that the Company pays will be remitted to the Company’s landlord less the allocation of any shared expenses and leasehold improvements
specific to the sublease. The estimated amount the Company expects to remit to the landlord each future year of the sublease is $6,100
per year. The sublease commenced on October 1, 2021 and will run through September 30, 2025 which is the end of the Company’s lease
term with its landlord. Below are the future payments (in thousands) expected under the sublease net of the estimated annual service
cost of $2,220:
SCHEDULE
OF SUB LEASES
| | |
Year
ended
September
30, | |
| 2024 | |
$ | 28 | |
| 2025 | |
| 29 | |
| Total
undiscounted cash flows | |
$ | 57 | |
|
| X |
- References
+ Details
| Name: |
ACFN_DisclosureLeasesAbstract |
| Namespace Prefix: |
ACFN_ |
| Data Type: |
xbrli:stringItemType |
| Balance Type: |
na |
| Period Type: |
duration |
|
| X |
- DefinitionThe entire disclosure for operating leases of lessee. Includes, but is not limited to, description of operating lease and maturity analysis of operating lease liability. Reference 1: http://www.xbrl.org/2003/role/disclosureRef
-Topic 842
-SubTopic 20
-Name Accounting Standards Codification
-Publisher FASB
-URI https://asc.fasb.org//842-20/tableOfContent
| Name: |
us-gaap_LesseeOperatingLeasesTextBlock |
| Namespace Prefix: |
us-gaap_ |
| Data Type: |
dtr-types:textBlockItemType |
| Balance Type: |
na |
| Period Type: |
duration |
|
v3.23.3
| X |
- References
+ Details
| Name: |
us-gaap_CommitmentsAndContingenciesDisclosureAbstract |
| Namespace Prefix: |
us-gaap_ |
| Data Type: |
xbrli:stringItemType |
| Balance Type: |
na |
| Period Type: |
duration |
|
| X |
- DefinitionThe entire disclosure for commitments and contingencies. Reference 1: http://www.xbrl.org/2003/role/disclosureRef
-Topic 440
-SubTopic 10
-Name Accounting Standards Codification
-Section 50
-Paragraph 4
-Subparagraph (a)
-Publisher FASB
-URI https://asc.fasb.org//1943274/2147482648/440-10-50-4
Reference 2: http://www.xbrl.org/2009/role/commonPracticeRef
-Topic 450
-Name Accounting Standards Codification
-Publisher FASB
-URI https://asc.fasb.org//450/tableOfContent
Reference 3: http://www.xbrl.org/2003/role/disclosureRef
-Topic 954
-SubTopic 440
-Name Accounting Standards Codification
-Section 50
-Paragraph 1
-Subparagraph (a)
-Publisher FASB
-URI https://asc.fasb.org//1943274/2147480327/954-440-50-1
Reference 4: http://www.xbrl.org/2003/role/disclosureRef
-Topic 440
-SubTopic 10
-Name Accounting Standards Codification
-Section 50
-Paragraph 4
-Subparagraph (c)
-Publisher FASB
-URI https://asc.fasb.org//1943274/2147482648/440-10-50-4
Reference 5: http://fasb.org/us-gaap/role/ref/legacyRef
-Topic 440
-Name Accounting Standards Codification
-Publisher FASB
-URI https://asc.fasb.org//440/tableOfContent
| Name: |
us-gaap_CommitmentsAndContingenciesDisclosureTextBlock |
| Namespace Prefix: |
us-gaap_ |
| Data Type: |
dtr-types:textBlockItemType |
| Balance Type: |
na |
| Period Type: |
duration |
|
v3.23.3
EQUITY
|
9 Months Ended |
Sep. 30, 2023 |
|---|
| Equity [Abstract] |
|
| EQUITY |
NOTE
8—EQUITY
(a)
General
Reverse
Stock Split
On
September 5, 2023, the Board of Directors of Acorn approved a Certificate of Amendment to Acorn’s Restated Certificate of Incorporation
that provided for a 1-for-16 reverse stock split of Acorn’s Common Stock. See Note 1 for related details. At September 30, 2023,
Acorn had issued and outstanding 2,484,791 shares of its common stock, par value $0.01 per share. Holders of outstanding common stock
are entitled to receive dividends when and if declared by the Board and to share ratably in the assets of the Company legally available
for distribution in the event of a liquidation, dissolution or winding up of the Company.
The
Company is not authorized to issue preferred stock. Accordingly, no preferred stock is issued or outstanding.
(b)
Summary Employee Option Information
The
Company’s stock option plans provide for the grant to officers, directors and employees of options to purchase shares of common
stock. The purchase price may be paid in cash or, if the option is “in-the-money” at the end of the option term, it is automatically
exercised “net”. In a net exercise of an option, the Company does not require a payment of the exercise price of the option
from the optionee but reduces the number of shares of common stock issued upon the exercise of the option by the smallest number of whole
shares that has an aggregate fair market value equal to or in excess of the aggregate exercise price for the option shares covered by
the option exercised. Each option is exercisable for one share of the Company’s common stock. Most options expire within five to
ten years from the date of the grant, and generally vest over a three-year period from the date of the grant.
At
September 30, 2023, 77,540 options were available for grant under the Amended and Restated 2006 Stock Incentive Plan and no options were
available for grant under the 2006 Stock Option Plan for Non-Employee Directors. During the nine
months ended September 30, 2023, 13,436 options were issued. No options were issued in the three months ended September 30, 2023. The
options were issued as follows: an aggregate of 3,437 to directors (excluding the CEO), 2,187 to the CEO, 6,250 to the CFO and an aggregate
of 1,562 to employees. In the nine and three months ended September 30, 2023, there were no grants to non-employees (other than the directors,
CEO and CFO).
No
options were exercised in the nine and three months ended September 30, 2023. The intrinsic value of options outstanding and of options
exercisable at September 30, 2023 was $38,000. The Company utilized the Black-Scholes option-pricing model to estimate fair value, utilizing
the following assumptions for the respective years (all in weighted averages):
SCHEDULE
OF BLACK-SCHOLES OPTION PRICING ESTIMATE FAIR VALUE
| | |
Number of
Options (in
shares) | | |
Weighted Average Exercise Price
Per Share | | |
Weighted Average Remaining Contractual
Life | | |
Aggregate Intrinsic Value | |
| Outstanding at December 31, 2022 | |
| 58,966 | | |
$ | 6.71 | | |
| 4.3
years | | |
$ | 16,000 | |
| Granted | |
| 13,436 | | |
| 5.24 | | |
| | | |
| | |
| Exercised | |
| — | | |
| — | | |
| | | |
| | |
| Forfeited or expired | |
| (1,280 | ) | |
| 6.48 | | |
| | | |
| | |
| Outstanding at September 30, 2023 | |
| 71,122 | | |
$ | 6.44 | | |
| 4.2
years | | |
$ | 46,000 | |
| Exercisable at September 30, 2023 | |
| 61,786 | | |
$ | 6.49 | | |
| 3.9
years | | |
$ | 38,000 | |
The
fair value of the options granted of $46,000 was estimated on the grant date using the Black-Scholes option-pricing model with the following
weighted average assumptions:
SCHEDULE
OF STOCK OPTIONS FAIR VALUE ASSUMPTIONS ESTIMATED USING BLACK-SCHOLES
| Risk-free interest rate | |
| 3.9 | % |
| Expected term of options | |
| 4.1
years | |
| Expected annual volatility | |
| 94.5 | % |
| Expected dividend yield | |
| — | % |
(c)
Stock-based Compensation Expense
Stock-based
compensation expense included in SG&A expenses in the Company’s unaudited condensed consolidated statements of operations was
$46,000 and $69,000 for the nine-month periods ended September 30, 2023 and 2022, respectively, and $16,000 and $16,000 for the three-month
periods ended September 30, 2023 and 2022, respectively.
The
total compensation cost related to non-vested awards not yet recognized was $17,000 and $43,000 as of September 30, 2023 and 2022, respectively.
(d)
Warrants
The
Company previously issued warrants at exercise prices equal to or greater than the market value of the Company’s common stock at
the date of issuance. A summary of warrant activity follows:
SUMMARY
OF WARRANT ACTIVITY
| | |
Number of
Warrants (in
shares) | | |
Weighted Average Exercise Price
Per Share | | |
Weighted Average Remaining Contractual Life | |
| Outstanding at December 31, 2022 | |
| 2,187 | | |
$ | 2.08 | | |
| 2.5
months | |
| Granted | |
| — | | |
| — | | |
| | |
| Exercised | |
| (2,187 | ) | |
| 2.08 | | |
| | |
| Forfeited or expired | |
| — | | |
| — | | |
| | |
| Outstanding at September 30, 2023 | |
| — | | |
$ | — | | |
| — | |
|
| X |
- References
+ Details
| Name: |
us-gaap_EquityAbstract |
| Namespace Prefix: |
us-gaap_ |
| Data Type: |
xbrli:stringItemType |
| Balance Type: |
na |
| Period Type: |
duration |
|
| X |
- DefinitionThe entire disclosure for equity. Reference 1: http://www.xbrl.org/2003/role/disclosureRef
-Topic 505
-SubTopic 10
-Name Accounting Standards Codification
-Section 50
-Paragraph 13
-Subparagraph (b)
-Publisher FASB
-URI https://asc.fasb.org//1943274/2147481112/505-10-50-13
Reference 2: http://www.xbrl.org/2003/role/disclosureRef
-Topic 505
-SubTopic 10
-Name Accounting Standards Codification
-Section 50
-Paragraph 13
-Subparagraph (h)
-Publisher FASB
-URI https://asc.fasb.org//1943274/2147481112/505-10-50-13
Reference 3: http://www.xbrl.org/2003/role/disclosureRef
-Topic 505
-SubTopic 10
-Name Accounting Standards Codification
-Section 50
-Paragraph 14
-Subparagraph (b)
-Publisher FASB
-URI https://asc.fasb.org//1943274/2147481112/505-10-50-14
Reference 4: http://www.xbrl.org/2003/role/disclosureRef
-Topic 946
-SubTopic 235
-Name Accounting Standards Codification
-Section 50
-Paragraph 2
-Subparagraph (a)
-Publisher FASB
-URI https://asc.fasb.org//1943274/2147481062/946-235-50-2
Reference 5: http://www.xbrl.org/2003/role/disclosureRef
-Topic 946
-SubTopic 235
-Name Accounting Standards Codification
-Section 50
-Paragraph 2
-Subparagraph (d)
-Publisher FASB
-URI https://asc.fasb.org//1943274/2147481062/946-235-50-2
Reference 6: http://www.xbrl.org/2003/role/disclosureRef
-Topic 946
-SubTopic 505
-Name Accounting Standards Codification
-Section 50
-Paragraph 6
-Publisher FASB
-URI https://asc.fasb.org//1943274/2147481004/946-505-50-6
Reference 7: http://www.xbrl.org/2003/role/disclosureRef
-Topic 815
-SubTopic 40
-Name Accounting Standards Codification
-Section 50
-Paragraph 6
-Subparagraph (a)
-Publisher FASB
-URI https://asc.fasb.org//1943274/2147480237/815-40-50-6
Reference 8: http://www.xbrl.org/2003/role/disclosureRef
-Topic 505
-SubTopic 10
-Name Accounting Standards Codification
-Section S99
-Paragraph 1
-Subparagraph (SX 210.3-04)
-Publisher FASB
-URI https://asc.fasb.org//1943274/2147480008/505-10-S99-1
Reference 9: http://www.xbrl.org/2003/role/disclosureRef
-Topic 235
-SubTopic 10
-Name Accounting Standards Codification
-Section S99
-Paragraph 1
-Subparagraph (SX 210.4-08(e)(1))
-Publisher FASB
-URI https://asc.fasb.org//1943274/2147480678/235-10-S99-1
Reference 10: http://fasb.org/us-gaap/role/ref/legacyRef
-Topic 505
-Name Accounting Standards Codification
-Publisher FASB
-URI https://asc.fasb.org//505/tableOfContent
Reference 11: http://www.xbrl.org/2003/role/disclosureRef
-Topic 505
-SubTopic 10
-Name Accounting Standards Codification
-Section 50
-Paragraph 13
-Publisher FASB
-URI https://asc.fasb.org//1943274/2147481112/505-10-50-13
Reference 12: http://www.xbrl.org/2003/role/disclosureRef
-Topic 505
-SubTopic 10
-Name Accounting Standards Codification
-Section 50
-Paragraph 13
-Subparagraph (g)
-Publisher FASB
-URI https://asc.fasb.org//1943274/2147481112/505-10-50-13
Reference 13: http://www.xbrl.org/2003/role/disclosureRef
-Topic 505
-SubTopic 10
-Name Accounting Standards Codification
-Section 50
-Paragraph 13
-Subparagraph (i)
-Publisher FASB
-URI https://asc.fasb.org//1943274/2147481112/505-10-50-13
Reference 14: http://www.xbrl.org/2003/role/disclosureRef
-Topic 505
-SubTopic 10
-Name Accounting Standards Codification
-Section 50
-Paragraph 14
-Subparagraph (a)
-Publisher FASB
-URI https://asc.fasb.org//1943274/2147481112/505-10-50-14
Reference 15: http://www.xbrl.org/2003/role/disclosureRef
-Topic 505
-SubTopic 10
-Name Accounting Standards Codification
-Section 50
-Paragraph 14
-Subparagraph (c)
-Publisher FASB
-URI https://asc.fasb.org//1943274/2147481112/505-10-50-14
Reference 16: http://www.xbrl.org/2003/role/disclosureRef
-Topic 505
-SubTopic 10
-Name Accounting Standards Codification
-Section 50
-Paragraph 16
-Subparagraph (b)
-Publisher FASB
-URI https://asc.fasb.org//1943274/2147481112/505-10-50-16
Reference 17: http://www.xbrl.org/2003/role/disclosureRef
-Topic 505
-SubTopic 10
-Name Accounting Standards Codification
-Section 50
-Paragraph 18
-Subparagraph (a)
-Publisher FASB
-URI https://asc.fasb.org//1943274/2147481112/505-10-50-18
Reference 18: http://www.xbrl.org/2003/role/disclosureRef
-Topic 505
-SubTopic 10
-Name Accounting Standards Codification
-Section 50
-Paragraph 18
-Subparagraph (b)
-Publisher FASB
-URI https://asc.fasb.org//1943274/2147481112/505-10-50-18
Reference 19: http://www.xbrl.org/2003/role/disclosureRef
-Topic 505
-SubTopic 10
-Name Accounting Standards Codification
-Section 50
-Paragraph 18
-Subparagraph (d)
-Publisher FASB
-URI https://asc.fasb.org//1943274/2147481112/505-10-50-18
| Name: |
us-gaap_StockholdersEquityNoteDisclosureTextBlock |
| Namespace Prefix: |
us-gaap_ |
| Data Type: |
dtr-types:textBlockItemType |
| Balance Type: |
na |
| Period Type: |
duration |
|
v3.23.3
SEGMENT REPORTING
|
9 Months Ended |
Sep. 30, 2023 |
|---|
| Segment Reporting [Abstract] |
|
| SEGMENT REPORTING |
NOTE
9— SEGMENT REPORTING
As
of September 30, 2023, the Company operates in two reportable operating segments, both of which are performed through the Company’s
OmniMetrix subsidiary:
| |
● |
Power
Generation (“PG”). OmniMetrix’s PG services provide wireless remote monitoring and control systems and IoT
applications for residential and commercial/industrial power generation equipment. This includes OmniMetrix’s AIRGuard product,
which remotely monitors and controls industrial air compressors, and its Smart Annunciator product, which is typically sold to commercial
customers that require a visual representation of the generator’s status and has a touchscreen display that indicates the current
state of that generator. |
| |
|
|
| |
● |
Cathodic
Protection (“CP”). OmniMetrix’s CP services provide remote monitoring and control products for cathodic protection
systems on oil and gas pipelines serving the gas utilities market and pipeline operators. The CP product lineup includes solutions
to remotely monitor and control rectifiers, test stations and bonds. OmniMetrix also offers the industry’s first RADTM
(Remote AC Mitigation Disconnect) that mounts onto existing Solid-state Decouplers in the field and can remotely disconnect/connect
these AC mitigation tools, which can drastically reduce a company’s expense while increasing employee safety. |
The
Company’s reportable segments are strategic business units, offering different products and services, and are managed separately
as each business requires different technology and marketing strategies.
The
following tables represent segmented data for the nine-month and three-month periods ended September 30, 2023 and 2022 (in thousands):
SUMMARY
OF SEGMENTED DATA
| | |
PG | | |
CP | | |
Total | |
| Nine months ended September 30, 2023: | |
| | | |
| | | |
| | |
| Revenues from
external customers | |
$ | 4,994 | | |
$ | 815 | | |
$ | 5,809 | |
| Segment gross profit | |
| 3,876 | | |
| 480 | | |
| 4,356 | |
| Depreciation and amortization | |
| 99 | | |
| 16 | | |
| 115 | |
| Segment income (loss) before
income taxes | |
$ | 891 | | |
$ | (35 | ) | |
$ | 856 | |
| | |
| | | |
| | | |
| | |
| Nine months ended September 30, 2022: | |
| | | |
| | | |
| | |
| Revenues from external
customers | |
$ | 4,335 | | |
$ | 820 | | |
$ | 5,155 | |
| Segment gross profit | |
| 3,256 | | |
| 463 | | |
| 3,719 | |
| Depreciation and amortization | |
| 72 | | |
| 13 | | |
| 85 | |
| Segment income (loss) before
income taxes* | |
$ | 340 | | |
$ | (103 | ) | |
$ | 237 | |
| | |
| | | |
| | | |
| | |
| Three months ended September 30, 2023: | |
| | | |
| | | |
| | |
| Revenues from external
customers | |
$ | 1,798 | | |
$ | 289 | | |
$ | 2,087 | |
| Segment gross profit | |
| 1,381 | | |
| 169 | | |
| 1,550 | |
| Depreciation and amortization | |
| 36 | | |
| 5 | | |
| 41 | |
| Segment income before income
taxes | |
$ | 361 | | |
$ | 5 | | |
$ | 366 | |
| | |
| | | |
| | | |
| | |
| Three months ended September 30, 2022: | |
| | | |
| | | |
| | |
| Revenues from external
customers | |
$ | 1,510 | | |
$ | 273 | | |
$ | 1,783 | |
| Segment gross profit | |
| 1,092 | | |
| 123 | | |
| 1,215 | |
| Depreciation and amortization | |
| 31 | | |
| 5 | | |
| 36 | |
| Segment income (loss) before
income taxes | |
$ | 78 | | |
$ | (58 | ) | |
$ | 20 | |
| * | Software impairment of
$51,000 is
not related to a specific segment and, thus, is not included in the “Total net income before income taxes for reportable
segments” for the nine months ended September 30, 2022 |
The
Company does not currently break out total assets by reportable segment as there is a high level of shared utilization between the segments.
Further, the Chief Decision Maker does not review the assets by segment.
Reconciliation
of Segment Income (Loss) to Consolidated Net Income (Loss) Before Income Taxes
SCHEDULE
OF RECONCILIATION OF SEGMENT DATA TO CONSOLIDATED STATEMENT OF OPERATIONS
| | |
2023 | | |
2022 | | |
2023 | | |
2022 | |
| | |
Nine
months ended September
30, | | |
Three
months ended September
30, | |
| | |
2023 | | |
2022 | | |
2023 | | |
2022 | |
| Total net income before income
taxes for reportable segments | |
$ | 856 | | |
$ | 237 | | |
$ | 366 | | |
$ | 20 | |
| Unallocated software impairment | |
| | | |
| (51 | ) | |
| | | |
| | |
| Unallocated cost of
corporate headquarters | |
| (814 | ) | |
| (741 | ) | |
| (339 | ) | |
| (230 | ) |
| Consolidated net income (loss) before income
taxes | |
$ | 42 | | |
$ | (555 | ) | |
$ | 27 | | |
$ | (210 | ) |
|
| X |
- References
+ Details
| Name: |
us-gaap_SegmentReportingAbstract |
| Namespace Prefix: |
us-gaap_ |
| Data Type: |
xbrli:stringItemType |
| Balance Type: |
na |
| Period Type: |
duration |
|
| X |
- DefinitionThe entire disclosure for reporting segments including data and tables. Reportable segments include those that meet any of the following quantitative thresholds a) it's reported revenue, including sales to external customers and intersegment sales or transfers is 10 percent or more of the combined revenue, internal and external, of all operating segments b) the absolute amount of its reported profit or loss is 10 percent or more of the greater, in absolute amount of 1) the combined reported profit of all operating segments that did not report a loss or 2) the combined reported loss of all operating segments that did report a loss c) its assets are 10 percent or more of the combined assets of all operating segments. Reference 1: http://www.xbrl.org/2003/role/disclosureRef
-Topic 280
-SubTopic 10
-Name Accounting Standards Codification
-Section 50
-Paragraph 22
-Publisher FASB
-URI https://asc.fasb.org//1943274/2147482810/280-10-50-22
Reference 2: http://www.xbrl.org/2003/role/disclosureRef
-Topic 280
-SubTopic 10
-Name Accounting Standards Codification
-Section 50
-Paragraph 15
-Publisher FASB
-URI https://asc.fasb.org//1943274/2147482810/280-10-50-15
Reference 3: http://www.xbrl.org/2003/role/disclosureRef
-Topic 280
-SubTopic 10
-Name Accounting Standards Codification
-Section 50
-Paragraph 31
-Publisher FASB
-URI https://asc.fasb.org//1943274/2147482810/280-10-50-31
Reference 4: http://www.xbrl.org/2003/role/disclosureRef
-Topic 280
-SubTopic 10
-Name Accounting Standards Codification
-Section 50
-Paragraph 32
-Subparagraph (d)
-Publisher FASB
-URI https://asc.fasb.org//1943274/2147482810/280-10-50-32
Reference 5: http://www.xbrl.org/2003/role/disclosureRef
-Topic 280
-SubTopic 10
-Name Accounting Standards Codification
-Section 50
-Paragraph 42
-Publisher FASB
-URI https://asc.fasb.org//1943274/2147482810/280-10-50-42
Reference 6: http://www.xbrl.org/2003/role/disclosureRef
-Topic 280
-SubTopic 10
-Name Accounting Standards Codification
-Section 50
-Paragraph 32
-Subparagraph (f)
-Publisher FASB
-URI https://asc.fasb.org//1943274/2147482810/280-10-50-32
Reference 7: http://www.xbrl.org/2003/role/disclosureRef
-Topic 280
-SubTopic 10
-Name Accounting Standards Codification
-Section 50
-Paragraph 40
-Publisher FASB
-URI https://asc.fasb.org//1943274/2147482810/280-10-50-40
Reference 8: http://www.xbrl.org/2003/role/disclosureRef
-Topic 280
-Name Accounting Standards Codification
-Publisher FASB
-URI https://asc.fasb.org//280/tableOfContent
Reference 9: http://www.xbrl.org/2003/role/disclosureRef
-Topic 280
-SubTopic 10
-Name Accounting Standards Codification
-Section 50
-Paragraph 26
-Publisher FASB
-URI https://asc.fasb.org//1943274/2147482810/280-10-50-26
Reference 10: http://www.xbrl.org/2003/role/disclosureRef
-Topic 280
-SubTopic 10
-Name Accounting Standards Codification
-Section 50
-Paragraph 34
-Publisher FASB
-URI https://asc.fasb.org//1943274/2147482810/280-10-50-34
Reference 11: http://www.xbrl.org/2003/role/disclosureRef
-Topic 280
-SubTopic 10
-Name Accounting Standards Codification
-Section 50
-Paragraph 41
-Publisher FASB
-URI https://asc.fasb.org//1943274/2147482810/280-10-50-41
Reference 12: http://www.xbrl.org/2003/role/disclosureRef
-Topic 280
-SubTopic 10
-Name Accounting Standards Codification
-Section 50
-Paragraph 21
-Subparagraph (a)
-Publisher FASB
-URI https://asc.fasb.org//1943274/2147482810/280-10-50-21
Reference 13: http://www.xbrl.org/2003/role/disclosureRef
-Topic 280
-SubTopic 10
-Name Accounting Standards Codification
-Section 50
-Paragraph 21
-Subparagraph (b)
-Publisher FASB
-URI https://asc.fasb.org//1943274/2147482810/280-10-50-21
Reference 14: http://www.xbrl.org/2003/role/disclosureRef
-Topic 280
-SubTopic 10
-Name Accounting Standards Codification
-Section 50
-Paragraph 32
-Subparagraph (e)
-Publisher FASB
-URI https://asc.fasb.org//1943274/2147482810/280-10-50-32
| Name: |
us-gaap_SegmentReportingDisclosureTextBlock |
| Namespace Prefix: |
us-gaap_ |
| Data Type: |
dtr-types:textBlockItemType |
| Balance Type: |
na |
| Period Type: |
duration |
|
v3.23.3
REVENUE
|
9 Months Ended |
Sep. 30, 2023 |
|---|
| Revenue from Contract with Customer [Abstract] |
|
| REVENUE |
NOTE
10—REVENUE
The
following table disaggregates the Company’s revenue for the nine-month and three-month periods ended September 30, 2023 and 2022
(in thousands):
SCHEDULE
OF DISAGGREGATES OF REVENUE
| | |
Hardware | | |
Monitoring | | |
Total | |
| Nine months ended September 30, 2023: | |
| | | |
| | | |
| | |
| PG Segment | |
$ | 2,017 | | |
$ | 2,977 | | |
$ | 4,994 | |
| CP
Segment | |
| 620 | | |
| 195 | | |
| 815 | |
| Total
Revenue | |
$ | 2,637 | | |
$ | 3,172 | | |
$ | 5,809 | |
| | |
Hardware | | |
Monitoring | | |
Total | |
| Nine months ended September 30, 2022: | |
| | | |
| | | |
| | |
| PG Segment | |
$ | 1,610 | | |
$ | 2,725 | | |
$ | 4,335 | |
| CP
Segment | |
| 631 | | |
| 189 | | |
| 820 | |
| Total
Revenue | |
$ | 2,241 | | |
$ | 2,914 | | |
$ | 5,155 | |
| | |
Hardware | | |
Monitoring | | |
Total | |
| Three months ended September 30, 2023: | |
| | | |
| | | |
| | |
| PG Segment | |
$ | 780 | | |
$ | 1,018 | | |
$ | 1,798 | |
| CP
Segment | |
| 224 | | |
| 65 | | |
| 289 | |
| Total
Revenue | |
$ | 1,004 | | |
$ | 1,083 | | |
$ | 2,087 | |
| | |
Hardware | | |
Monitoring | | |
Total | |
| Three months ended September 30, 2022: | |
| | | |
| | | |
| | |
| PG Segment | |
$ | 608 | | |
$ | 902 | | |
$ | 1,510 | |
| CP
Segment | |
| 217 | | |
| 56 | | |
| 273 | |
| Total
Revenue | |
$ | 825 | | |
$ | 958 | | |
$ | 1,783 | |
Deferred
revenue activity for the nine months ended September 30, 2023 can be seen in the table below (in thousands):
SCHEDULE
OF DEFERRED REVENUE ACTIVITY
| |
|
Hardware |
|
|
Monitoring |
|
|
Total |
|
| Balance
at December 31, 2022 |
|
$ |
3,751 |
|
|
$ |
2,420 |
|
|
$ |
6,171 |
|
| Additions
during the period |
|
|
1,597 |
|
|
|
3,436 |
|
|
|
5,033 |
|
| Recognized
as revenue |
|
|
(1,821 |
) |
|
|
(3,172 |
) |
|
|
(4,993 |
) |
| Balance
at September 30, 2023 |
|
$ |
3,527 |
|
|
$ |
2,684 |
|
|
$ |
6,211 |
|
| |
|
|
|
|
|
|
|
|
|
|
|
|
| Amounts
to be recognized as revenue in the twelve-month-period ending: |
|
|
|
|
|
|
|
|
|
|
|
|
| September
30, 2024 |
|
$ |
2,023 |
|
|
$ |
2,247 |
|
|
$
|
4,270 |
|
| September
30, 2025 |
|
|
1,179 |
|
|
|
433 |
|
|
|
1,612 |
|
| September
30, 2026 and thereafter |
|
|
325 |
|
|
|
4 |
|
|
|
329 |
|
| |
|
$ |
3,527 |
|
|
$ |
2,684 |
|
|
$ |
6,211 |
|
The
amount of hardware revenue recognized during the nine months ended September 30, 2023 that was included in deferred revenue at the beginning
of the fiscal year was $1,469,000. The amount of monitoring revenue during the nine months ended September 30, 2023 that was included
in deferred revenue at the beginning of the fiscal year was $1,890,000.
SCHEDULE
OF RECONCILIATION OF HARDWARE REVENUE
| Reconciliation of Hardware
Revenue | |
2023 | | |
2022 | | |
2023 | | |
2022 | |
| | |
Nine
months ended September
30, | | |
Three
months ended September
30, | |
| Reconciliation of Hardware
Revenue | |
2023 | | |
2022 | | |
2023 | | |
2022 | |
| Amortization of deferred revenue | |
$ | 1,821 | | |
$ | 1,658 | | |
$ | 629 | | |
$ | 631 | |
| Sales of custom designed units and related
accessories | |
| 135 | | |
| — | | |
| 43 | | |
| — | |
| Hardware sales (new product versions) | |
| 150 | | |
| — | | |
| 150 | | |
| — | |
| Other accessories, services,
shipping and miscellaneous charges | |
| 531 | | |
| 583 | | |
| 182 | | |
| 194 | |
| Total hardware revenue | |
$ | 2,637 | | |
$ | 2,241 | | |
$ | 1,004 | | |
$ | 825 | |
Deferred
charges relate only to the sale of equipment. Deferred charges activity for the nine months ended September 30, 2023 can be seen in the
table below (in thousands):
SCHEDULE
OF DEFERRED CHARGES ACTIVITY
| | |
| | |
| Balance at December 31, 2022 | |
$ | 1,694 | |
| Additions, net of adjustments,
during the period | |
| 655 | |
| Recognized as COGS | |
| (817 | ) |
| Balance at September 30, 2023 | |
$ | 1,532 | |
| | |
| | |
| Amounts to be recognized as COGS in the twelve-month-period
ending: | |
| | |
| September 30, 2024 | |
$ | 890 | |
| September 30, 2025 | |
| 507 | |
| September 30, 2026
and thereafter | |
| 135 | |
| | |
$ | 1,532 | |
SCHEDULE
OF RECONCILIATION OF COGS EXPENSE
| Reconciliation of COGS
Expense | |
2023 | | |
2022 | | |
2023 | | |
2022 | |
| | |
Nine
months ended September
30, | | |
Three
months ended September
30, | |
| Reconciliation of COGS
Expense | |
2023 | | |
2022 | | |
2023 | | |
2022 | |
| Amortization of deferred COGS | |
$ | 817 | | |
$ | 793 | | |
$ | 277 | | |
$ | 309 | |
| COGS of custom designed units and related accessories | |
| 34 | | |
| — | | |
| 11 | | |
| — | |
| COGS of hardware sales (new product versions) | |
| 66 | | |
| — | | |
| 66 | | |
| — | |
| Data costs for monitoring | |
| 224 | | |
| 250 | | |
| 76 | | |
| 93 | |
| Other COGS of accessories,
services, shipping and miscellaneous charges | |
| 312 | | |
| 393 | | |
| 107 | | |
| 166 | |
| Total COGS expense | |
$ | 1,453 | | |
$ | 1,436 | | |
$ | 537 | | |
$ | 568 | |
The
following table provides a reconciliation of the Company’s sales commissions contract assets for the nine-month period ended September
30, 2023 (in thousands):
SCHEDULE
OF SALES COMMISSIONS CONTRACT ASSETS
| | |
Hardware | | |
Monitoring | | |
Total | |
| Balance at December 31, 2022 | |
$ | 319 | | |
$ | 80 | | |
$ | 399 | |
| Additions during the period | |
| 148 | | |
| 43 | | |
| 191 | |
| Amortization of sales
commissions | |
| (149 | ) | |
| (27 | ) | |
| (176 | ) |
| Balance at September 30, 2023 | |
$ | 318 | | |
| 96 | | |
| 414 | |
The
capitalized sales commissions are included in other current assets ($218,000) and other assets ($196,000) in the Company’s unaudited
condensed consolidated balance sheets as of September 30, 2023. The capitalized sales commissions are included in other current assets
($196,000) and other assets ($203,000) in the Company’s condensed consolidated balance sheet at December 31, 2022.
Amounts
to be recognized as sales commission expense in the twelve-month-period ending:
SCHEDULE
OF SALES COMMISSIONS EXPENSE
| |
|
|
|
|
| September
30, 2024 |
|
$ |
218 |
|
| September
30, 2025 |
|
|
138 |
|
| September
30, 2026 and thereafter |
|
|
58 |
|
| Total |
|
$ |
414 |
|
The
contract assets of deferred COGS and deferred sales commissions are subject to review under ASU 2016-13, see Notes 2 and 4; however,
no credit losses on contract assets are expected based on the Company’s implementation of ASU 2016-13.
Commissions
earned from the sales of the new hardware products will be recognized when the product is shipped.
|
| X |
- References
+ Details
| Name: |
us-gaap_RevenueFromContractWithCustomerAbstract |
| Namespace Prefix: |
us-gaap_ |
| Data Type: |
xbrli:stringItemType |
| Balance Type: |
na |
| Period Type: |
duration |
|
| X |
- DefinitionThe entire disclosure of revenue from contract with customer to transfer good or service and to transfer nonfinancial asset. Includes, but is not limited to, disaggregation of revenue, credit loss recognized from contract with customer, judgment and change in judgment related to contract with customer, and asset recognized from cost incurred to obtain or fulfill contract with customer. Excludes insurance and lease contracts. Reference 1: http://www.xbrl.org/2003/role/disclosureRef
-Topic 606
-SubTopic 10
-Name Accounting Standards Codification
-Section 50
-Paragraph 9
-Publisher FASB
-URI https://asc.fasb.org//1943274/2147479806/606-10-50-9
Reference 2: http://www.xbrl.org/2003/role/disclosureRef
-Topic 606
-SubTopic 10
-Name Accounting Standards Codification
-Section 50
-Paragraph 10
-Publisher FASB
-URI https://asc.fasb.org//1943274/2147479806/606-10-50-10
Reference 3: http://www.xbrl.org/2003/role/disclosureRef
-Topic 606
-SubTopic 10
-Name Accounting Standards Codification
-Section 50
-Paragraph 15
-Publisher FASB
-URI https://asc.fasb.org//1943274/2147479806/606-10-50-15
Reference 4: http://www.xbrl.org/2003/role/disclosureRef
-Topic 606
-SubTopic 10
-Name Accounting Standards Codification
-Section 50
-Paragraph 12
-Subparagraph (a)
-Publisher FASB
-URI https://asc.fasb.org//1943274/2147479806/606-10-50-12
Reference 5: http://www.xbrl.org/2003/role/disclosureRef
-Topic 606
-SubTopic 10
-Name Accounting Standards Codification
-Section 50
-Paragraph 12
-Subparagraph (b)
-Publisher FASB
-URI https://asc.fasb.org//1943274/2147479806/606-10-50-12
Reference 6: http://www.xbrl.org/2003/role/disclosureRef
-Topic 606
-SubTopic 10
-Name Accounting Standards Codification
-Section 50
-Paragraph 12
-Subparagraph (c)
-Publisher FASB
-URI https://asc.fasb.org//1943274/2147479806/606-10-50-12
Reference 7: http://www.xbrl.org/2003/role/disclosureRef
-Topic 606
-SubTopic 10
-Name Accounting Standards Codification
-Section 50
-Paragraph 12
-Subparagraph (d)
-Publisher FASB
-URI https://asc.fasb.org//1943274/2147479806/606-10-50-12
Reference 8: http://www.xbrl.org/2003/role/disclosureRef
-Topic 606
-SubTopic 10
-Name Accounting Standards Codification
-Section 50
-Paragraph 12
-Subparagraph (e)
-Publisher FASB
-URI https://asc.fasb.org//1943274/2147479806/606-10-50-12
Reference 9: http://www.xbrl.org/2003/role/disclosureRef
-Topic 606
-SubTopic 10
-Name Accounting Standards Codification
-Section 50
-Paragraph 13
-Subparagraph (b)(2)
-Publisher FASB
-URI https://asc.fasb.org//1943274/2147479806/606-10-50-13
Reference 10: http://www.xbrl.org/2003/role/disclosureRef
-Name Accounting Standards Codification
-Topic 606
-Publisher FASB
-URI https://asc.fasb.org//606/tableOfContent
| Name: |
us-gaap_RevenueFromContractWithCustomerTextBlock |
| Namespace Prefix: |
us-gaap_ |
| Data Type: |
dtr-types:textBlockItemType |
| Balance Type: |
na |
| Period Type: |
duration |
|
v3.23.3
RELATED PARTY BALANCES AND TRANSACTIONS
|
9 Months Ended |
Sep. 30, 2023 |
|---|
| Related Party Transactions [Abstract] |
|
| RELATED PARTY BALANCES AND TRANSACTIONS |
NOTE
11—RELATED PARTY BALANCES AND TRANSACTIONS
Officer
and Director Fees
The
Company recorded fees to officers of $391,000 and $391,000 for the nine months ended September 30, 2023 and 2022, respectively, and $131,000
and $130,000 for the three months ended September 30, 2023 and 2022, respectively, which are included in SG&A expenses.
The
Company recorded fees to directors of $52,000 and $44,000 for the nine months ended September 30, 2023 and 2022, respectively, and $18,000
and $15,000 for the three months ended September 30, 2023 and 2022, respectively, which are included in SG&A expenses.
Intercompany
The
intercompany balance due to Acorn from OmniMetrix for amounts loaned, accrued interest and expenses paid by Acorn on
OmniMetrix’s behalf was $2,928,000
as of September 30, 2023 as compared to $3,677,000
as of December 31, 2022. During the nine months ended September 30, 2023, the intercompany amount due to Acorn from OmniMetrix
decreased by $749,000.
This included repayments of $961,000
offset by interest of $134,000
and dividends of $57,000
due to Acorn and $21,000
in shared expenses paid by Acorn. During the nine
months ended September 30, 2022, the intercompany amount due to Acorn from OmniMetrix decreased by $447,000.
This included repayments of $780,000
offset by interest of $134,000,
dividends of $57,000
due to Acorn and $142,000
in shared expenses paid by Acorn. The intercompany balances are eliminated in consolidation.
|
| X |
- DefinitionThe entire disclosure for related party transactions. Examples of related party transactions include transactions between (a) a parent company and its subsidiary; (b) subsidiaries of a common parent; (c) and entity and its principal owners; and (d) affiliates. Reference 1: http://www.xbrl.org/2003/role/disclosureRef
-Topic 946
-SubTopic 20
-Name Accounting Standards Codification
-Section 50
-Paragraph 2
-Publisher FASB
-URI https://asc.fasb.org//1943274/2147480990/946-20-50-2
Reference 2: http://www.xbrl.org/2003/role/disclosureRef
-Topic 946
-SubTopic 20
-Name Accounting Standards Codification
-Section 50
-Paragraph 5
-Publisher FASB
-URI https://asc.fasb.org//1943274/2147480990/946-20-50-5
Reference 3: http://www.xbrl.org/2003/role/disclosureRef
-Topic 946
-SubTopic 20
-Name Accounting Standards Codification
-Section 50
-Paragraph 6
-Publisher FASB
-URI https://asc.fasb.org//1943274/2147480990/946-20-50-6
Reference 4: http://www.xbrl.org/2003/role/disclosureRef
-Topic 946
-SubTopic 235
-Name Accounting Standards Codification
-Section 50
-Paragraph 2
-Subparagraph (c)
-Publisher FASB
-URI https://asc.fasb.org//1943274/2147481062/946-235-50-2
Reference 5: http://www.xbrl.org/2003/role/disclosureRef
-Topic 946
-SubTopic 235
-Name Accounting Standards Codification
-Section 50
-Paragraph 2
-Subparagraph (e)
-Publisher FASB
-URI https://asc.fasb.org//1943274/2147481062/946-235-50-2
Reference 6: http://www.xbrl.org/2003/role/disclosureRef
-Topic 850
-SubTopic 10
-Name Accounting Standards Codification
-Section 50
-Paragraph 1
-Subparagraph (d)
-Publisher FASB
-URI https://asc.fasb.org//1943274/2147483326/850-10-50-1
Reference 7: http://www.xbrl.org/2003/role/disclosureRef
-Topic 946
-SubTopic 220
-Name Accounting Standards Codification
-Section S99
-Paragraph 1
-Subparagraph (SX 210.6-07(2)(g)(3))
-Publisher FASB
-URI https://asc.fasb.org//1943274/2147483575/946-220-S99-1
Reference 8: http://www.xbrl.org/2003/role/disclosureRef
-Topic 946
-SubTopic 220
-Name Accounting Standards Codification
-Section S99
-Paragraph 1
-Subparagraph (SX 210.6-07(2)(c))
-Publisher FASB
-URI https://asc.fasb.org//1943274/2147483575/946-220-S99-1
Reference 9: http://www.xbrl.org/2003/role/disclosureRef
-Topic 946
-SubTopic 220
-Name Accounting Standards Codification
-Section S99
-Paragraph 1
-Subparagraph (SX 210.6-07(2)(e))
-Publisher FASB
-URI https://asc.fasb.org//1943274/2147483575/946-220-S99-1
Reference 10: http://www.xbrl.org/2003/role/disclosureRef
-Topic 850
-Name Accounting Standards Codification
-Publisher FASB
-URI https://asc.fasb.org//850/tableOfContent
Reference 11: http://www.xbrl.org/2003/role/disclosureRef
-Topic 850
-SubTopic 10
-Name Accounting Standards Codification
-Section 50
-Paragraph 6
-Publisher FASB
-URI https://asc.fasb.org//1943274/2147483326/850-10-50-6
Reference 12: http://www.xbrl.org/2003/role/disclosureRef
-Topic 850
-SubTopic 10
-Name Accounting Standards Codification
-Section 50
-Paragraph 1
-Subparagraph (a)
-Publisher FASB
-URI https://asc.fasb.org//1943274/2147483326/850-10-50-1
Reference 13: http://www.xbrl.org/2003/role/disclosureRef
-Topic 850
-SubTopic 10
-Name Accounting Standards Codification
-Section 50
-Paragraph 1
-Subparagraph (b)
-Publisher FASB
-URI https://asc.fasb.org//1943274/2147483326/850-10-50-1
| Name: |
us-gaap_RelatedPartyTransactionsDisclosureTextBlock |
| Namespace Prefix: |
us-gaap_ |
| Data Type: |
dtr-types:textBlockItemType |
| Balance Type: |
na |
| Period Type: |
duration |
|
v3.23.3
ACCOUNTING POLICIES (Policies)
|
9 Months Ended |
Sep. 30, 2023 |
|---|
| Accounting Policies [Abstract] |
|
| Use of Estimates in Preparation of Financial Statements |
Use
of Estimates in Preparation of Financial Statements
The
preparation of unaudited condensed consolidated financial statements requires management to make estimates and assumptions that affect
the reported amounts of assets and liabilities and the disclosure of contingent assets and liabilities as of the date of the unaudited
condensed consolidated financial statements, and the reported amounts of revenues and expenses during the reporting periods. Actual results
could differ from those estimates.
As
applicable to these unaudited condensed consolidated financial statements, the most significant estimates and assumptions relate to uncertainties
with respect to revenue recognition and management’s projections related to the going concern analysis.
|
| Concentrations of Credit Risk |
Concentrations
of Credit Risk
Financial
instruments, which potentially subject the Company to concentrations of credit risk, consist principally of cash and trade accounts receivable.
The Company’s cash was deposited with a U.S. bank and amounted to $1,749,000 at September 30, 2023. The Company does not believe
there is a significant risk of non-performance by its counterparties. For the three-month period ended September 30, 2023, there were
no customers that represented greater than 10% of the Company’s total invoiced sales. For the nine-month period ended September
30, 2023, there was one customer that represented 11% of the Company’s total invoiced sales. At September 30, 2023, the Company
did not have any customers that represented greater than 10% of our total accounts receivable. Approximately 12% of the accounts receivable
at December 31, 2022 was due from one customer which was subsequently collected in full. Credit risk with respect to the balance of trade
receivables is generally diversified due to the number of entities comprising the Company’s customer base. Although we do not believe
there is significant risk of non-performance by these counterparties, any failures or defaults on their part could negatively impact
the value of our financial instruments and could have a material adverse effect on our business, operations or financial condition.
|
| Inventory |
Inventory
Inventories
are comprised of components (raw materials), work-in-process and finished goods, which are measured at the lower of cost or net realizable
value.
Raw
materials inventory is generally comprised of radios, cables, antennas, and electrical components. Finished goods inventory consists
of fully assembled systems ready for final shipment to the customer. Costs are determined at cost of acquisition on a weighted average
basis and include all outside production and applicable shipping costs.
All
inventories are periodically reviewed to identify slow-moving and obsolete inventory. Management conducted an assessment and wrote-off
inventory carried at $9,000 for the nine months ended September 30, 2023, of which $1,000 was written off in the three months ended September
30, 2023.
|
| Revenue Recognition |
Revenue
Recognition
On
September 1, 2023, OmniMetrix launched an updated version of its products that includes new functionality in its TrueGuard,
AIRGuard, Patriot and Hero products that allows its customers to have options as it relates to obtaining and utilizing the data that
is provided by its hardware devices. This new functionality allows for SIM card options, configuration options regarding IP address
endpoints and DNS routes, and access to OmniMetrix’s over-the-air data protocol. This product update allows customers to have
the option to purchase OmniMetrix’s monitoring service, monitor the products themselves if they have the ability in-house, or
choose another monitoring provider if they so desire. OmniMetrix’s prior hardware product version could not function as a
distinct product from its monitoring services. This new version’s functionality results in OmniMetrix’s hardware and
monitoring services being capable of being two distinct products and services. OmniMetrix recognizes revenue, COGS and commissions
from the sale of the new version of its hardware products sold when the product is shipped rather than over the estimated time that
the unit is in service for the customer. Monitoring revenue continues to be deferred and amortized over the period that the
monitoring services are rendered. The remaining balance of deferred revenue from the prior version of these products will continue
to be amortized each period until it is fully amortized. The modification to the circuit boards and embedded firmware of hardware
enclosures in inventory as of August 31, 2023 were made such that only the new version of these products was sold subsequent to this
date.
|
| Basic and Diluted Net Income (Loss) Per Share |
Basic
and Diluted Net Income (Loss) Per Share
Basic
net income (loss) per share is computed by dividing the net income (loss) attributable to Acorn Energy, Inc. by the weighted average
number of shares outstanding during the period, excluding treasury stock. Diluted net income (loss) per share is computed by dividing
the net income (loss) by the weighted average number of shares outstanding plus the dilutive potential of common shares which would result
from the exercise of stock options. The dilutive effects of stock options are excluded from the computation of diluted net income (loss)
per share if doing so would be antidilutive. For the nine-month period ending September 30, 2023, the weighted average number of options
that were excluded from the computation of diluted net loss, as they had an antidilutive effect, was 6,000 (which have a weighted average
exercise price of $8.49). For the three-month period ending September 30, 2023, there were no options that were excluded from the computation
of diluted net loss due to having an antidilutive effect. For both the nine- and three-month periods ending September 30, 2022, the number
of options that were excluded from the computation of diluted net loss, as they had an antidilutive effect, was 60,000 (which have a
weighted average exercise price of $6.72) and the number of warrants that were excluded from the computation of diluted net loss, as
they had an antidilutive effect, was 2,187 (which had a weighted average exercise price of $2.08).
The
following data represents the amounts used in computing EPS and the effect on net income (loss) and the weighted average number of shares
of dilutive potential common stock (in thousands):
SCHEDULE OF EFFECT ON NET INCOME LOSS AND WEIGHTED AVERAGE NUMBER OF SHARES
| | |
2023 | | |
2022 | | |
2023 | | |
2022 | |
| | |
Nine
months ended September
30, | | |
Three
months ended September
30, | |
| | |
2023 | | |
2022 | | |
2023 | | |
2022 | |
| Net income
(loss) available to common stockholders | |
$ | 35 | | |
$ | (556 | ) | |
$ | 24 | | |
$ | (210 | ) |
| | |
| | | |
| | | |
| | | |
| | |
| Weighted average share outstanding: | |
| | | |
| | | |
| | | |
| | |
| Basic | |
| 2,484 | | |
| 2,481 | | |
| 2,485 | | |
| 2,481 | |
| Add:
Stock options | |
| 22 | | |
| — | | |
| 47 | | |
| — | |
| Diluted | |
| 2,506 | | |
| 2,481 | | |
| 2,532 | | |
| 2,481 | |
| | |
| | | |
| | | |
| | | |
| | |
| Basic and diluted net income (loss) per share | |
$ | 0.01 | | |
$ | (0.22 | ) | |
$ | 0.01 | | |
$ | (0.08 | ) |
|
| Recently Adopted Accounting Standards |
Recently
Adopted Accounting Standards
Other
than the pronouncement noted below, there have been no recent accounting pronouncements or changes in accounting standards during
the nine-month period ended September 30, 2023 that would affect the Company’s condensed consolidated financial
statements.
On
January 1, 2023, the Company adopted ASU 2016-13, “Financial Instruments – Credit Losses (Topic 326): Measurement of Credit
Losses on Financial Instruments.” This guidance was issued to provide financial statement users with more useful information about
the expected credit losses on financial instruments and other commitments to extend credit held by a reporting entity at each reporting
date. Specifically, this guidance requires entities to utilize a new “expected loss” model as it relates to trade and other
receivables. The adoption of the standard impacts the way the Company estimates the allowance for doubtful accounts on its trade and
other receivables. Refer to Note 4, “Allowance for Credit Losses,” for further information regarding the Company’s
allowance for expected credit losses.
|
| X |
- DefinitionRecently adopted accounting principles [Policy Text Block]
| Name: |
ACFN_RecentlyAdoptedAccountingPrinciplesPolicyTextBlock |
| Namespace Prefix: |
ACFN_ |
| Data Type: |
dtr-types:textBlockItemType |
| Balance Type: |
na |
| Period Type: |
duration |
|
| X |
- References
+ Details
| Name: |
us-gaap_AccountingPoliciesAbstract |
| Namespace Prefix: |
us-gaap_ |
| Data Type: |
xbrli:stringItemType |
| Balance Type: |
na |
| Period Type: |
duration |
|
| X |
- DefinitionDisclosure of accounting policy for credit risk. Reference 1: http://fasb.org/us-gaap/role/ref/legacyRef
-Name Accounting Standards Codification
-Topic 942
-SubTopic 825
-Section 50
-Paragraph 1
-Publisher FASB
-URI https://asc.fasb.org//1943274/2147480981/942-825-50-1
Reference 2: http://www.xbrl.org/2003/role/disclosureRef
-Name Accounting Standards Codification
-Section 50
-Paragraph 1
-Subparagraph (d)
-SubTopic 10
-Topic 275
-Publisher FASB
-URI https://asc.fasb.org//1943274/2147482861/275-10-50-1
| Name: |
us-gaap_ConcentrationRiskCreditRisk |
| Namespace Prefix: |
us-gaap_ |
| Data Type: |
dtr-types:textBlockItemType |
| Balance Type: |
na |
| Period Type: |
duration |
|
| X |
- DefinitionDisclosure of accounting policy for computing basic and diluted earnings or loss per share for each class of common stock and participating security. Addresses all significant policy factors, including any antidilutive items that have been excluded from the computation and takes into account stock dividends, splits and reverse splits that occur after the balance sheet date of the latest reporting period but before the issuance of the financial statements. Reference 1: http://fasb.org/us-gaap/role/ref/legacyRef
-Name Accounting Standards Codification
-Topic 260
-SubTopic 10
-Section 50
-Paragraph 1
-Subparagraph (c)
-Publisher FASB
-URI https://asc.fasb.org//1943274/2147482662/260-10-50-1
Reference 2: http://fasb.org/us-gaap/role/ref/legacyRef
-Name Accounting Standards Codification
-Topic 260
-SubTopic 10
-Section 50
-Paragraph 2
-Publisher FASB
-URI https://asc.fasb.org//1943274/2147482662/260-10-50-2
| Name: |
us-gaap_EarningsPerSharePolicyTextBlock |
| Namespace Prefix: |
us-gaap_ |
| Data Type: |
dtr-types:textBlockItemType |
| Balance Type: |
na |
| Period Type: |
duration |
|
| X |
- DefinitionDisclosure of inventory accounting policy for inventory classes, including, but not limited to, basis for determining inventory amounts, methods by which amounts are added and removed from inventory classes, loss recognition on impairment of inventories, and situations in which inventories are stated above cost. Reference 1: http://www.xbrl.org/2003/role/disclosureRef
-Topic 210
-SubTopic 10
-Name Accounting Standards Codification
-Section 50
-Paragraph 1
-Publisher FASB
-URI https://asc.fasb.org//1943274/2147483489/210-10-50-1
Reference 2: http://www.xbrl.org/2003/role/disclosureRef
-Topic 210
-SubTopic 10
-Name Accounting Standards Codification
-Section S99
-Paragraph 1
-Subparagraph (SX 210.5-02(6)(b))
-Publisher FASB
-URI https://asc.fasb.org//1943274/2147480566/210-10-S99-1
Reference 3: http://www.xbrl.org/2003/role/exampleRef
-Topic 235
-SubTopic 10
-Name Accounting Standards Codification
-Section 50
-Paragraph 4
-Subparagraph (d)
-Publisher FASB
-URI https://asc.fasb.org//1943274/2147483426/235-10-50-4
Reference 4: http://www.xbrl.org/2003/role/disclosureRef
-Topic 912
-SubTopic 330
-Name Accounting Standards Codification
-Section 50
-Paragraph 1
-Publisher FASB
-URI https://asc.fasb.org//1943274/2147482105/912-330-50-1
Reference 5: http://www.xbrl.org/2003/role/disclosureRef
-Topic 330
-Name Accounting Standards Codification
-Publisher FASB
-URI https://asc.fasb.org//330/tableOfContent
Reference 6: http://www.xbrl.org/2003/role/disclosureRef
-Topic 330
-SubTopic 10
-Name Accounting Standards Codification
-Section 50
-Paragraph 1
-Publisher FASB
-URI https://asc.fasb.org//1943274/2147483080/330-10-50-1
Reference 7: http://www.xbrl.org/2003/role/disclosureRef
-Topic 330
-SubTopic 10
-Name Accounting Standards Codification
-Section 50
-Paragraph 4
-Publisher FASB
-URI https://asc.fasb.org//1943274/2147483080/330-10-50-4
Reference 8: http://www.xbrl.org/2003/role/disclosureRef
-Name Accounting Standards Codification
-Section 45
-Paragraph 6
-Subparagraph (a)
-SubTopic 10
-Topic 270
-Publisher FASB
-URI https://asc.fasb.org//1943274/2147482989/270-10-45-6
| Name: |
us-gaap_InventoryPolicyTextBlock |
| Namespace Prefix: |
us-gaap_ |
| Data Type: |
dtr-types:textBlockItemType |
| Balance Type: |
na |
| Period Type: |
duration |
|
| X |
- DefinitionDisclosure of accounting policy for revenue. Includes revenue from contract with customer and from other sources. Reference 1: http://www.xbrl.org/2003/role/disclosureRef
-Topic 946
-SubTopic 220
-Name Accounting Standards Codification
-Section S99
-Paragraph 1
-Subparagraph (SX 210.6-07(1))
-Publisher FASB
-URI https://asc.fasb.org//1943274/2147483575/946-220-S99-1
Reference 2: http://www.xbrl.org/2003/role/exampleRef
-Topic 235
-SubTopic 10
-Name Accounting Standards Codification
-Section 50
-Paragraph 4
-Subparagraph (f)
-Publisher FASB
-URI https://asc.fasb.org//1943274/2147483426/235-10-50-4
Reference 3: http://www.xbrl.org/2003/role/exampleRef
-Name Accounting Standards Codification
-Section 50
-Paragraph 4
-Subparagraph (e)
-SubTopic 10
-Topic 235
-Publisher FASB
-URI https://asc.fasb.org//1943274/2147483426/235-10-50-4
| Name: |
us-gaap_RevenueRecognitionPolicyTextBlock |
| Namespace Prefix: |
us-gaap_ |
| Data Type: |
dtr-types:textBlockItemType |
| Balance Type: |
na |
| Period Type: |
duration |
|
| X |
- DefinitionDisclosure of accounting policy for the use of estimates in the preparation of financial statements in conformity with generally accepted accounting principles. Reference 1: http://fasb.org/us-gaap/role/ref/legacyRef
-Name Accounting Standards Codification
-Topic 275
-SubTopic 10
-Section 50
-Paragraph 9
-Publisher FASB
-URI https://asc.fasb.org//1943274/2147482861/275-10-50-9
Reference 2: http://fasb.org/us-gaap/role/ref/legacyRef
-Name Accounting Standards Codification
-Topic 275
-SubTopic 10
-Section 50
-Paragraph 4
-Publisher FASB
-URI https://asc.fasb.org//1943274/2147482861/275-10-50-4
Reference 3: http://www.xbrl.org/2003/role/disclosureRef
-Name Accounting Standards Codification
-Section 50
-Paragraph 1
-Subparagraph (b)
-SubTopic 10
-Topic 275
-Publisher FASB
-URI https://asc.fasb.org//1943274/2147482861/275-10-50-1
Reference 4: http://www.xbrl.org/2003/role/disclosureRef
-Name Accounting Standards Codification
-Section 50
-Paragraph 1
-Subparagraph (c)
-SubTopic 10
-Topic 275
-Publisher FASB
-URI https://asc.fasb.org//1943274/2147482861/275-10-50-1
Reference 5: http://www.xbrl.org/2003/role/disclosureRef
-Name Accounting Standards Codification
-Section 50
-Paragraph 11
-SubTopic 10
-Topic 275
-Publisher FASB
-URI https://asc.fasb.org//1943274/2147482861/275-10-50-11
Reference 6: http://www.xbrl.org/2003/role/disclosureRef
-Name Accounting Standards Codification
-Section 50
-Paragraph 12
-SubTopic 10
-Topic 275
-Publisher FASB
-URI https://asc.fasb.org//1943274/2147482861/275-10-50-12
Reference 7: http://fasb.org/us-gaap/role/ref/legacyRef
-Name Accounting Standards Codification
-Topic 275
-SubTopic 10
-Section 50
-Paragraph 8
-Publisher FASB
-URI https://asc.fasb.org//1943274/2147482861/275-10-50-8
| Name: |
us-gaap_UseOfEstimates |
| Namespace Prefix: |
us-gaap_ |
| Data Type: |
dtr-types:textBlockItemType |
| Balance Type: |
na |
| Period Type: |
duration |
|
v3.23.3
ACCOUNTING POLICIES (Tables)
|
9 Months Ended |
Sep. 30, 2023 |
|---|
| Accounting Policies [Abstract] |
|
| SCHEDULE OF EFFECT ON NET INCOME LOSS AND WEIGHTED AVERAGE NUMBER OF SHARES |
The
following data represents the amounts used in computing EPS and the effect on net income (loss) and the weighted average number of shares
of dilutive potential common stock (in thousands):
SCHEDULE OF EFFECT ON NET INCOME LOSS AND WEIGHTED AVERAGE NUMBER OF SHARES
| | |
2023 | | |
2022 | | |
2023 | | |
2022 | |
| | |
Nine
months ended September
30, | | |
Three
months ended September
30, | |
| | |
2023 | | |
2022 | | |
2023 | | |
2022 | |
| Net income
(loss) available to common stockholders | |
$ | 35 | | |
$ | (556 | ) | |
$ | 24 | | |
$ | (210 | ) |
| | |
| | | |
| | | |
| | | |
| | |
| Weighted average share outstanding: | |
| | | |
| | | |
| | | |
| | |
| Basic | |
| 2,484 | | |
| 2,481 | | |
| 2,485 | | |
| 2,481 | |
| Add:
Stock options | |
| 22 | | |
| — | | |
| 47 | | |
| — | |
| Diluted | |
| 2,506 | | |
| 2,481 | | |
| 2,532 | | |
| 2,481 | |
| | |
| | | |
| | | |
| | | |
| | |
| Basic and diluted net income (loss) per share | |
$ | 0.01 | | |
$ | (0.22 | ) | |
$ | 0.01 | | |
$ | (0.08 | ) |
|
| X |
- References
+ Details
| Name: |
us-gaap_AccountingPoliciesAbstract |
| Namespace Prefix: |
us-gaap_ |
| Data Type: |
xbrli:stringItemType |
| Balance Type: |
na |
| Period Type: |
duration |
|
| X |
- DefinitionTabular disclosure of an entity's basic and diluted earnings per share calculations, including a reconciliation of numerators and denominators of the basic and diluted per-share computations for income from continuing operations. Reference 1: http://www.xbrl.org/2009/role/commonPracticeRef
-Topic 260
-SubTopic 10
-Name Accounting Standards Codification
-Section 50
-Paragraph 1
-Subparagraph (a)
-Publisher FASB
-URI https://asc.fasb.org//1943274/2147482662/260-10-50-1
| Name: |
us-gaap_ScheduleOfEarningsPerShareBasicAndDilutedTableTextBlock |
| Namespace Prefix: |
us-gaap_ |
| Data Type: |
dtr-types:textBlockItemType |
| Balance Type: |
na |
| Period Type: |
duration |
|
v3.23.3
ALLOWANCE FOR CREDIT LOSSES (Tables)
|
9 Months Ended |
Sep. 30, 2023 |
|---|
| Receivables [Abstract] |
|
| SCHEDULE OF ALLOWANCES FOR CREDIT LOSSES |
The
following is a tabular reconciliation of the Company’s allowance for credit losses:
SCHEDULE
OF ALLOWANCES FOR CREDIT LOSSES
| | |
September
30, 2023 | | |
December
31, 2022 | |
| | |
As
of | |
| | |
September
30, 2023 | | |
December
31, 2022 | |
| | |
(in thousands) | |
| Balance at beginning of period | |
$ | 10 | | |
$ | 6 | |
| Provision for credit losses | |
| 3 | | |
| 3 | |
| Net (charge-offs) credits | |
| (6 | ) | |
| 1 | |
| Balance at end of period | |
$ | 7 | | |
$ | 10 | |
|
| X |
- References
+ Details
| Name: |
us-gaap_ReceivablesAbstract |
| Namespace Prefix: |
us-gaap_ |
| Data Type: |
xbrli:stringItemType |
| Balance Type: |
na |
| Period Type: |
duration |
|
| X |
- DefinitionTabular disclosure of allowance for credit loss of financing receivable, classified as current. Reference 1: http://www.xbrl.org/2009/role/commonPracticeRef
-Topic 326
-SubTopic 20
-Name Accounting Standards Codification
-Section 50
-Paragraph 13
-Publisher FASB
-URI https://asc.fasb.org//1943274/2147479319/326-20-50-13
Reference 2: http://fasb.org/us-gaap/role/ref/legacyRef
-Name Accounting Standards Codification
-Topic 310
-SubTopic 10
-Section 50
-Paragraph 11B
-Subparagraph (c)
-Publisher FASB
-URI https://asc.fasb.org//1943274/2147481962/310-10-50-11B
| Name: |
us-gaap_ScheduleOfCreditLossesForFinancingReceivablesCurrentTableTextBlock |
| Namespace Prefix: |
us-gaap_ |
| Data Type: |
dtr-types:textBlockItemType |
| Balance Type: |
na |
| Period Type: |
duration |
|
v3.23.3
INVENTORY (Tables)
|
9 Months Ended |
Sep. 30, 2023 |
|---|
| Inventory Disclosure [Abstract] |
|
| SCHEDULE OF INVENTORY |
SCHEDULE
OF INVENTORY
| | |
September
30, 2023 | | |
December
31, 2022 | |
| | |
As
of | |
| | |
September
30, 2023 | | |
December
31, 2022 | |
| | |
(in thousands) | |
| Raw materials | |
$ | 859 | | |
$ | 684 | |
| Finished goods | |
| 50 | | |
| 105 | |
| Inventory net | |
$ | 909 | | |
$ | 789 | |
|
| X |
- References
+ Details
| Name: |
us-gaap_InventoryDisclosureAbstract |
| Namespace Prefix: |
us-gaap_ |
| Data Type: |
xbrli:stringItemType |
| Balance Type: |
na |
| Period Type: |
duration |
|
| X |
- DefinitionTabular disclosure of the carrying amount as of the balance sheet date of merchandise, goods, commodities, or supplies held for future sale or to be used in manufacturing, servicing or production process. Reference 1: http://fasb.org/us-gaap/role/ref/legacyRef
-Topic 210
-SubTopic 10
-Name Accounting Standards Codification
-Section S99
-Paragraph 1
-Subparagraph (SX 210.5-02(6)(a))
-Publisher FASB
-URI https://asc.fasb.org//1943274/2147480566/210-10-S99-1
Reference 2: http://fasb.org/us-gaap/role/ref/legacyRef
-Topic 210
-SubTopic 10
-Name Accounting Standards Codification
-Section S99
-Paragraph 1
-Subparagraph (SX 210.5-02(6)(b))
-Publisher FASB
-URI https://asc.fasb.org//1943274/2147480566/210-10-S99-1
Reference 3: http://fasb.org/us-gaap/role/ref/legacyRef
-Topic 210
-SubTopic 10
-Name Accounting Standards Codification
-Section S99
-Paragraph 1
-Subparagraph (SX 210.5-02(6)(c))
-Publisher FASB
-URI https://asc.fasb.org//1943274/2147480566/210-10-S99-1
Reference 4: http://fasb.org/us-gaap/role/ref/legacyRef
-Name Accounting Standards Codification
-Topic 210
-SubTopic 10
-Section 50
-Paragraph 1
-Publisher FASB
-URI https://asc.fasb.org//1943274/2147483489/210-10-50-1
| Name: |
us-gaap_ScheduleOfInventoryCurrentTableTextBlock |
| Namespace Prefix: |
us-gaap_ |
| Data Type: |
dtr-types:textBlockItemType |
| Balance Type: |
na |
| Period Type: |
duration |
|
v3.23.3
LEASES (Tables)
|
9 Months Ended |
Sep. 30, 2023 |
|---|
| Leases |
|
| SCHEDULE OF SUPPLEMENTAL CASH FLOW INFORMATION RELATED TO LEASES |
Supplemental
cash flow information related to leases consisted of the following (in thousands):
SCHEDULE
OF SUPPLEMENTAL CASH FLOW INFORMATION RELATED TO LEASES
| | |
For
the Nine Months Ending
September 30, | |
| | |
2023 | | |
2022 | |
| Cash paid for operating lease liabilities | |
$ | 96 | | |
$ | 93 | |
| | |
| | | |
| | |
|
| SCHEDULE OF SUPPLEMENTAL BALANCE SHEET INFORMATION RELATED TO LEASES |
Supplemental
balance sheet information related to leases consisted of the following:
SCHEDULE
OF SUPPLEMENTAL BALANCE SHEET INFORMATION RELATED TO LEASES
| | |
| 2023 | |
| Weighted average remaining lease
terms for operating leases | |
| 1.99
years | |
| | |
| | |
|
| SCHEDULE OF FUTURE MINIMUM LEASE PAYMENTS |
The
table below reconciles the undiscounted future minimum lease payments under non-cancelable lease agreements having initial terms of more
than one year to the total operating lease liabilities recognized on the unaudited condensed consolidated balance sheet as of September
30, 2023 (in thousands):
SCHEDULE
OF FUTURE MINIMUM LEASE PAYMENTS
| | |
Year
ended September
30, | |
| 2024 | |
$ | 129 | |
| 2025 | |
| 132 | |
| Total undiscounted cash flows | |
| 261 | |
| Less: Imputed interest | |
| (11 | ) |
| Present value of
operating lease liabilities (a) | |
$ | 250 | |
| |
(a) |
Includes
current portion of $121,000 for operating leases. |
|
| SCHEDULE OF SUB LEASES |
SCHEDULE
OF SUB LEASES
| | |
Year
ended
September
30, | |
| 2024 | |
$ | 28 | |
| 2025 | |
| 29 | |
| Total
undiscounted cash flows | |
$ | 57 | |
|
| X |
- References
+ Details
| Name: |
ACFN_DisclosureLeasesAbstract |
| Namespace Prefix: |
ACFN_ |
| Data Type: |
xbrli:stringItemType |
| Balance Type: |
na |
| Period Type: |
duration |
|
| X |
- DefinitionSchedule of Sublease Payments [Table Text Block]
| Name: |
ACFN_ScheduleOfSubleasePaymentsTableTextBlock |
| Namespace Prefix: |
ACFN_ |
| Data Type: |
dtr-types:textBlockItemType |
| Balance Type: |
na |
| Period Type: |
duration |
|
| X |
- DefinitionSchedule of supplemental balance sheet information related to leases [Table Text Block]
| Name: |
ACFN_ScheduleOfSupplementalBalanceSheetInformationRelatedToLeasesTableTextBlock |
| Namespace Prefix: |
ACFN_ |
| Data Type: |
dtr-types:textBlockItemType |
| Balance Type: |
na |
| Period Type: |
duration |
|
| X |
- DefinitionSchedule Of Supplemental Cash Flow Information Related To Leases [Table Text Block]
| Name: |
ACFN_ScheduleOfSupplementalCashFlowInformationRelatedToLeasesTableTextBlock |
| Namespace Prefix: |
ACFN_ |
| Data Type: |
dtr-types:textBlockItemType |
| Balance Type: |
na |
| Period Type: |
duration |
|
| X |
- DefinitionTabular disclosure of undiscounted cash flows of lessee's operating lease liability. Includes, but is not limited to, reconciliation of undiscounted cash flows to operating lease liability recognized in statement of financial position. Reference 1: http://www.xbrl.org/2009/role/commonPracticeRef
-Topic 842
-SubTopic 20
-Name Accounting Standards Codification
-Section 50
-Paragraph 6
-Publisher FASB
-URI https://asc.fasb.org//1943274/2147478964/842-20-50-6
| Name: |
us-gaap_LesseeOperatingLeaseLiabilityMaturityTableTextBlock |
| Namespace Prefix: |
us-gaap_ |
| Data Type: |
dtr-types:textBlockItemType |
| Balance Type: |
na |
| Period Type: |
duration |
|
v3.23.3
EQUITY (Tables)
|
9 Months Ended |
Sep. 30, 2023 |
|---|
| Equity [Abstract] |
|
| SCHEDULE OF BLACK-SCHOLES OPTION PRICING ESTIMATE FAIR VALUE |
SCHEDULE
OF BLACK-SCHOLES OPTION PRICING ESTIMATE FAIR VALUE
| | |
Number of
Options (in
shares) | | |
Weighted Average Exercise Price
Per Share | | |
Weighted Average Remaining Contractual
Life | | |
Aggregate Intrinsic Value | |
| Outstanding at December 31, 2022 | |
| 58,966 | | |
$ | 6.71 | | |
| 4.3
years | | |
$ | 16,000 | |
| Granted | |
| 13,436 | | |
| 5.24 | | |
| | | |
| | |
| Exercised | |
| — | | |
| — | | |
| | | |
| | |
| Forfeited or expired | |
| (1,280 | ) | |
| 6.48 | | |
| | | |
| | |
| Outstanding at September 30, 2023 | |
| 71,122 | | |
$ | 6.44 | | |
| 4.2
years | | |
$ | 46,000 | |
| Exercisable at September 30, 2023 | |
| 61,786 | | |
$ | 6.49 | | |
| 3.9
years | | |
$ | 38,000 | |
|
| SCHEDULE OF STOCK OPTIONS FAIR VALUE ASSUMPTIONS ESTIMATED USING BLACK-SCHOLES |
The
fair value of the options granted of $46,000 was estimated on the grant date using the Black-Scholes option-pricing model with the following
weighted average assumptions:
SCHEDULE
OF STOCK OPTIONS FAIR VALUE ASSUMPTIONS ESTIMATED USING BLACK-SCHOLES
| Risk-free interest rate | |
| 3.9 | % |
| Expected term of options | |
| 4.1
years | |
| Expected annual volatility | |
| 94.5 | % |
| Expected dividend yield | |
| — | % |
|
| SUMMARY OF WARRANT ACTIVITY |
The
Company previously issued warrants at exercise prices equal to or greater than the market value of the Company’s common stock at
the date of issuance. A summary of warrant activity follows:
SUMMARY
OF WARRANT ACTIVITY
| | |
Number of
Warrants (in
shares) | | |
Weighted Average Exercise Price
Per Share | | |
Weighted Average Remaining Contractual Life | |
| Outstanding at December 31, 2022 | |
| 2,187 | | |
$ | 2.08 | | |
| 2.5
months | |
| Granted | |
| — | | |
| — | | |
| | |
| Exercised | |
| (2,187 | ) | |
| 2.08 | | |
| | |
| Forfeited or expired | |
| — | | |
| — | | |
| | |
| Outstanding at September 30, 2023 | |
| — | | |
$ | — | | |
| — | |
|
| X |
- References
+ Details
| Name: |
us-gaap_EquityAbstract |
| Namespace Prefix: |
us-gaap_ |
| Data Type: |
xbrli:stringItemType |
| Balance Type: |
na |
| Period Type: |
duration |
|
| X |
- DefinitionTabular disclosure for stock option plans. Includes, but is not limited to, outstanding awards at beginning and end of year, grants, exercises, forfeitures, and weighted-average grant date fair value. Reference 1: http://fasb.org/us-gaap/role/ref/legacyRef
-Name Accounting Standards Codification
-Topic 718
-SubTopic 10
-Section 50
-Paragraph 2
-Subparagraph (c)(1)
-Publisher FASB
-URI https://asc.fasb.org//1943274/2147480429/718-10-50-2
Reference 2: http://fasb.org/us-gaap/role/ref/legacyRef
-Name Accounting Standards Codification
-Section 50
-Paragraph 2
-Subparagraph (d)
-SubTopic 10
-Topic 718
-Publisher FASB
-URI https://asc.fasb.org//1943274/2147480429/718-10-50-2
Reference 3: http://fasb.org/us-gaap/role/ref/legacyRef
-Name Accounting Standards Codification
-Section 50
-Paragraph 2
-Subparagraph (e)
-SubTopic 10
-Topic 718
-Publisher FASB
-URI https://asc.fasb.org//1943274/2147480429/718-10-50-2
| Name: |
us-gaap_ScheduleOfShareBasedCompensationStockOptionsActivityTableTextBlock |
| Namespace Prefix: |
us-gaap_ |
| Data Type: |
dtr-types:textBlockItemType |
| Balance Type: |
na |
| Period Type: |
duration |
|
| X |
- DefinitionTabular disclosure of the significant assumptions used during the year to estimate the fair value of stock options, including, but not limited to: (a) expected term of share options and similar instruments, (b) expected volatility of the entity's shares, (c) expected dividends, (d) risk-free rate(s), and (e) discount for post-vesting restrictions. Reference 1: http://fasb.org/us-gaap/role/ref/legacyRef
-Topic 718
-SubTopic 10
-Subparagraph (f)(2)
-Name Accounting Standards Codification
-Paragraph 2
-Section 50
-Publisher FASB
-URI https://asc.fasb.org//1943274/2147480429/718-10-50-2
| Name: |
us-gaap_ScheduleOfShareBasedPaymentAwardStockOptionsValuationAssumptionsTableTextBlock |
| Namespace Prefix: |
us-gaap_ |
| Data Type: |
dtr-types:textBlockItemType |
| Balance Type: |
na |
| Period Type: |
duration |
|
| X |
- DefinitionTabular disclosure of warrants or rights issued. Warrants and rights outstanding are derivative securities that give the holder the right to purchase securities (usually equity) from the issuer at a specific price within a certain time frame. Warrants are often included in a new debt issue to entice investors by a higher return potential. The main difference between warrants and call options is that warrants are issued and guaranteed by the company, whereas options are exchange instruments and are not issued by the company. Also, the lifetime of a warrant is often measured in years, while the lifetime of a typical option is measured in months. Disclose the title of issue of securities called for by warrants and rights outstanding, the aggregate amount of securities called for by warrants and rights outstanding, the date from which the warrants or rights are exercisable, and the price at which the warrant or right is exercisable. Reference 1: http://fasb.org/us-gaap/role/ref/legacyRef
-Name Accounting Standards Codification
-Topic 718
-SubTopic 10
-Section 50
-Paragraph 1
-Subparagraph (a)
-Publisher FASB
-URI https://asc.fasb.org//1943274/2147480429/718-10-50-1
| Name: |
us-gaap_ScheduleOfStockholdersEquityNoteWarrantsOrRightsTextBlock |
| Namespace Prefix: |
us-gaap_ |
| Data Type: |
dtr-types:textBlockItemType |
| Balance Type: |
na |
| Period Type: |
duration |
|
v3.23.3
SEGMENT REPORTING (Tables)
|
9 Months Ended |
Sep. 30, 2023 |
|---|
| Segment Reporting [Abstract] |
|
| SUMMARY OF SEGMENTED DATA |
The
following tables represent segmented data for the nine-month and three-month periods ended September 30, 2023 and 2022 (in thousands):
SUMMARY
OF SEGMENTED DATA
| | |
PG | | |
CP | | |
Total | |
| Nine months ended September 30, 2023: | |
| | | |
| | | |
| | |
| Revenues from
external customers | |
$ | 4,994 | | |
$ | 815 | | |
$ | 5,809 | |
| Segment gross profit | |
| 3,876 | | |
| 480 | | |
| 4,356 | |
| Depreciation and amortization | |
| 99 | | |
| 16 | | |
| 115 | |
| Segment income (loss) before
income taxes | |
$ | 891 | | |
$ | (35 | ) | |
$ | 856 | |
| | |
| | | |
| | | |
| | |
| Nine months ended September 30, 2022: | |
| | | |
| | | |
| | |
| Revenues from external
customers | |
$ | 4,335 | | |
$ | 820 | | |
$ | 5,155 | |
| Segment gross profit | |
| 3,256 | | |
| 463 | | |
| 3,719 | |
| Depreciation and amortization | |
| 72 | | |
| 13 | | |
| 85 | |
| Segment income (loss) before
income taxes* | |
$ | 340 | | |
$ | (103 | ) | |
$ | 237 | |
| | |
| | | |
| | | |
| | |
| Three months ended September 30, 2023: | |
| | | |
| | | |
| | |
| Revenues from external
customers | |
$ | 1,798 | | |
$ | 289 | | |
$ | 2,087 | |
| Segment gross profit | |
| 1,381 | | |
| 169 | | |
| 1,550 | |
| Depreciation and amortization | |
| 36 | | |
| 5 | | |
| 41 | |
| Segment income before income
taxes | |
$ | 361 | | |
$ | 5 | | |
$ | 366 | |
| | |
| | | |
| | | |
| | |
| Three months ended September 30, 2022: | |
| | | |
| | | |
| | |
| Revenues from external
customers | |
$ | 1,510 | | |
$ | 273 | | |
$ | 1,783 | |
| Segment gross profit | |
| 1,092 | | |
| 123 | | |
| 1,215 | |
| Depreciation and amortization | |
| 31 | | |
| 5 | | |
| 36 | |
| Segment income (loss) before
income taxes | |
$ | 78 | | |
$ | (58 | ) | |
$ | 20 | |
| * | Software impairment of
$51,000 is
not related to a specific segment and, thus, is not included in the “Total net income before income taxes for reportable
segments” for the nine months ended September 30, 2022 |
|
| SCHEDULE OF RECONCILIATION OF SEGMENT DATA TO CONSOLIDATED STATEMENT OF OPERATIONS |
Reconciliation
of Segment Income (Loss) to Consolidated Net Income (Loss) Before Income Taxes
SCHEDULE
OF RECONCILIATION OF SEGMENT DATA TO CONSOLIDATED STATEMENT OF OPERATIONS
| | |
2023 | | |
2022 | | |
2023 | | |
2022 | |
| | |
Nine
months ended September
30, | | |
Three
months ended September
30, | |
| | |
2023 | | |
2022 | | |
2023 | | |
2022 | |
| Total net income before income
taxes for reportable segments | |
$ | 856 | | |
$ | 237 | | |
$ | 366 | | |
$ | 20 | |
| Unallocated software impairment | |
| | | |
| (51 | ) | |
| | | |
| | |
| Unallocated cost of
corporate headquarters | |
| (814 | ) | |
| (741 | ) | |
| (339 | ) | |
| (230 | ) |
| Consolidated net income (loss) before income
taxes | |
$ | 42 | | |
$ | (555 | ) | |
$ | 27 | | |
$ | (210 | ) |
|
| X |
- DefinitionTabular disclosure of the reconciliation of profit (loss) from reportable segments to the consolidated income (loss) before income tax expense (benefit) and discontinued operations. Includes, but is not limited to, reconciliation after income tax if income tax is allocated to the reportable segment. Reference 1: http://fasb.org/us-gaap/role/ref/legacyRef
-Name Accounting Standards Codification
-Topic 280
-SubTopic 10
-Section 50
-Paragraph 31
-Publisher FASB
-URI https://asc.fasb.org//1943274/2147482810/280-10-50-31
Reference 2: http://fasb.org/us-gaap/role/ref/legacyRef
-Name Accounting Standards Codification
-Topic 280
-SubTopic 10
-Section 50
-Paragraph 30
-Subparagraph (b)
-Publisher FASB
-URI https://asc.fasb.org//1943274/2147482810/280-10-50-30
| Name: |
us-gaap_ReconciliationOfOperatingProfitLossFromSegmentsToConsolidatedTextBlock |
| Namespace Prefix: |
us-gaap_ |
| Data Type: |
dtr-types:textBlockItemType |
| Balance Type: |
na |
| Period Type: |
duration |
|
| X |
- DefinitionTabular disclosure of the profit or loss and total assets for each reportable segment. An entity discloses certain information on each reportable segment if the amounts (a) are included in the measure of segment profit or loss reviewed by the chief operating decision maker or (b) are otherwise regularly provided to the chief operating decision maker, even if not included in that measure of segment profit or loss. Reference 1: http://fasb.org/us-gaap/role/ref/legacyRef
-Name Accounting Standards Codification
-Topic 350
-SubTopic 20
-Section 50
-Paragraph 1
-Publisher FASB
-URI https://asc.fasb.org//1943274/2147482573/350-20-50-1
Reference 2: http://fasb.org/us-gaap/role/ref/legacyRef
-Name Accounting Standards Codification
-Topic 280
-SubTopic 10
-Section 50
-Paragraph 25
-Publisher FASB
-URI https://asc.fasb.org//1943274/2147482810/280-10-50-25
Reference 3: http://fasb.org/us-gaap/role/ref/legacyRef
-Name Accounting Standards Codification
-Topic 280
-SubTopic 10
-Section 50
-Paragraph 22
-Publisher FASB
-URI https://asc.fasb.org//1943274/2147482810/280-10-50-22
Reference 4: http://fasb.org/us-gaap/role/ref/legacyRef
-Name Accounting Standards Codification
-Topic 280
-SubTopic 10
-Section 50
-Paragraph 30
-Publisher FASB
-URI https://asc.fasb.org//1943274/2147482810/280-10-50-30
| Name: |
us-gaap_ScheduleOfSegmentReportingInformationBySegmentTextBlock |
| Namespace Prefix: |
us-gaap_ |
| Data Type: |
dtr-types:textBlockItemType |
| Balance Type: |
na |
| Period Type: |
duration |
|
| X |
- References
+ Details
| Name: |
us-gaap_SegmentReportingAbstract |
| Namespace Prefix: |
us-gaap_ |
| Data Type: |
xbrli:stringItemType |
| Balance Type: |
na |
| Period Type: |
duration |
|
v3.23.3
REVENUE (Tables)
|
9 Months Ended |
Sep. 30, 2023 |
|---|
| Revenue from Contract with Customer [Abstract] |
|
| SCHEDULE OF DISAGGREGATES OF REVENUE |
The
following table disaggregates the Company’s revenue for the nine-month and three-month periods ended September 30, 2023 and 2022
(in thousands):
SCHEDULE
OF DISAGGREGATES OF REVENUE
| | |
Hardware | | |
Monitoring | | |
Total | |
| Nine months ended September 30, 2023: | |
| | | |
| | | |
| | |
| PG Segment | |
$ | 2,017 | | |
$ | 2,977 | | |
$ | 4,994 | |
| CP
Segment | |
| 620 | | |
| 195 | | |
| 815 | |
| Total
Revenue | |
$ | 2,637 | | |
$ | 3,172 | | |
$ | 5,809 | |
| | |
Hardware | | |
Monitoring | | |
Total | |
| Nine months ended September 30, 2022: | |
| | | |
| | | |
| | |
| PG Segment | |
$ | 1,610 | | |
$ | 2,725 | | |
$ | 4,335 | |
| CP
Segment | |
| 631 | | |
| 189 | | |
| 820 | |
| Total
Revenue | |
$ | 2,241 | | |
$ | 2,914 | | |
$ | 5,155 | |
| | |
Hardware | | |
Monitoring | | |
Total | |
| Three months ended September 30, 2023: | |
| | | |
| | | |
| | |
| PG Segment | |
$ | 780 | | |
$ | 1,018 | | |
$ | 1,798 | |
| CP
Segment | |
| 224 | | |
| 65 | | |
| 289 | |
| Total
Revenue | |
$ | 1,004 | | |
$ | 1,083 | | |
$ | 2,087 | |
| | |
Hardware | | |
Monitoring | | |
Total | |
| Three months ended September 30, 2022: | |
| | | |
| | | |
| | |
| PG Segment | |
$ | 608 | | |
$ | 902 | | |
$ | 1,510 | |
| CP
Segment | |
| 217 | | |
| 56 | | |
| 273 | |
| Total
Revenue | |
$ | 825 | | |
$ | 958 | | |
$ | 1,783 | |
|
| SCHEDULE OF DEFERRED REVENUE ACTIVITY |
Deferred
revenue activity for the nine months ended September 30, 2023 can be seen in the table below (in thousands):
SCHEDULE
OF DEFERRED REVENUE ACTIVITY
| |
|
Hardware |
|
|
Monitoring |
|
|
Total |
|
| Balance
at December 31, 2022 |
|
$ |
3,751 |
|
|
$ |
2,420 |
|
|
$ |
6,171 |
|
| Additions
during the period |
|
|
1,597 |
|
|
|
3,436 |
|
|
|
5,033 |
|
| Recognized
as revenue |
|
|
(1,821 |
) |
|
|
(3,172 |
) |
|
|
(4,993 |
) |
| Balance
at September 30, 2023 |
|
$ |
3,527 |
|
|
$ |
2,684 |
|
|
$ |
6,211 |
|
| |
|
|
|
|
|
|
|
|
|
|
|
|
| Amounts
to be recognized as revenue in the twelve-month-period ending: |
|
|
|
|
|
|
|
|
|
|
|
|
| September
30, 2024 |
|
$ |
2,023 |
|
|
$ |
2,247 |
|
|
$
|
4,270 |
|
| September
30, 2025 |
|
|
1,179 |
|
|
|
433 |
|
|
|
1,612 |
|
| September
30, 2026 and thereafter |
|
|
325 |
|
|
|
4 |
|
|
|
329 |
|
| |
|
$ |
3,527 |
|
|
$ |
2,684 |
|
|
$ |
6,211 |
|
|
| SCHEDULE OF RECONCILIATION OF HARDWARE REVENUE |
SCHEDULE
OF RECONCILIATION OF HARDWARE REVENUE
| Reconciliation of Hardware
Revenue | |
2023 | | |
2022 | | |
2023 | | |
2022 | |
| | |
Nine
months ended September
30, | | |
Three
months ended September
30, | |
| Reconciliation of Hardware
Revenue | |
2023 | | |
2022 | | |
2023 | | |
2022 | |
| Amortization of deferred revenue | |
$ | 1,821 | | |
$ | 1,658 | | |
$ | 629 | | |
$ | 631 | |
| Sales of custom designed units and related
accessories | |
| 135 | | |
| — | | |
| 43 | | |
| — | |
| Hardware sales (new product versions) | |
| 150 | | |
| — | | |
| 150 | | |
| — | |
| Other accessories, services,
shipping and miscellaneous charges | |
| 531 | | |
| 583 | | |
| 182 | | |
| 194 | |
| Total hardware revenue | |
$ | 2,637 | | |
$ | 2,241 | | |
$ | 1,004 | | |
$ | 825 | |
|
| SCHEDULE OF DEFERRED CHARGES ACTIVITY |
Deferred
charges relate only to the sale of equipment. Deferred charges activity for the nine months ended September 30, 2023 can be seen in the
table below (in thousands):
SCHEDULE
OF DEFERRED CHARGES ACTIVITY
| | |
| | |
| Balance at December 31, 2022 | |
$ | 1,694 | |
| Additions, net of adjustments,
during the period | |
| 655 | |
| Recognized as COGS | |
| (817 | ) |
| Balance at September 30, 2023 | |
$ | 1,532 | |
| | |
| | |
| Amounts to be recognized as COGS in the twelve-month-period
ending: | |
| | |
| September 30, 2024 | |
$ | 890 | |
| September 30, 2025 | |
| 507 | |
| September 30, 2026
and thereafter | |
| 135 | |
| | |
$ | 1,532 | |
|
| SCHEDULE OF RECONCILIATION OF COGS EXPENSE |
SCHEDULE
OF RECONCILIATION OF COGS EXPENSE
| Reconciliation of COGS
Expense | |
2023 | | |
2022 | | |
2023 | | |
2022 | |
| | |
Nine
months ended September
30, | | |
Three
months ended September
30, | |
| Reconciliation of COGS
Expense | |
2023 | | |
2022 | | |
2023 | | |
2022 | |
| Amortization of deferred COGS | |
$ | 817 | | |
$ | 793 | | |
$ | 277 | | |
$ | 309 | |
| COGS of custom designed units and related accessories | |
| 34 | | |
| — | | |
| 11 | | |
| — | |
| COGS of hardware sales (new product versions) | |
| 66 | | |
| — | | |
| 66 | | |
| — | |
| Data costs for monitoring | |
| 224 | | |
| 250 | | |
| 76 | | |
| 93 | |
| Other COGS of accessories,
services, shipping and miscellaneous charges | |
| 312 | | |
| 393 | | |
| 107 | | |
| 166 | |
| Total COGS expense | |
$ | 1,453 | | |
$ | 1,436 | | |
$ | 537 | | |
$ | 568 | |
|
| SCHEDULE OF SALES COMMISSIONS CONTRACT ASSETS |
The
following table provides a reconciliation of the Company’s sales commissions contract assets for the nine-month period ended September
30, 2023 (in thousands):
SCHEDULE
OF SALES COMMISSIONS CONTRACT ASSETS
| | |
Hardware | | |
Monitoring | | |
Total | |
| Balance at December 31, 2022 | |
$ | 319 | | |
$ | 80 | | |
$ | 399 | |
| Additions during the period | |
| 148 | | |
| 43 | | |
| 191 | |
| Amortization of sales
commissions | |
| (149 | ) | |
| (27 | ) | |
| (176 | ) |
| Balance at September 30, 2023 | |
$ | 318 | | |
| 96 | | |
| 414 | |
|
| SCHEDULE OF SALES COMMISSIONS EXPENSE |
Amounts
to be recognized as sales commission expense in the twelve-month-period ending:
SCHEDULE
OF SALES COMMISSIONS EXPENSE
| |
|
|
|
|
| September
30, 2024 |
|
$ |
218 |
|
| September
30, 2025 |
|
|
138 |
|
| September
30, 2026 and thereafter |
|
|
58 |
|
| Total |
|
$ |
414 |
|
|
| X |
- DefinitionSchedule of Deferred Charges Activity [Table Text Block]
| Name: |
ACFN_ScheduleOfDeferredChargesActivityTableTextBlock |
| Namespace Prefix: |
ACFN_ |
| Data Type: |
dtr-types:textBlockItemType |
| Balance Type: |
na |
| Period Type: |
duration |
|
| X |
- DefinitionSchedule of reconciliation of COGS expense [Table text block]
| Name: |
ACFN_ScheduleOfReconciliationOfCOGSExpenseTableTextBlock |
| Namespace Prefix: |
ACFN_ |
| Data Type: |
dtr-types:textBlockItemType |
| Balance Type: |
na |
| Period Type: |
duration |
|
| X |
- DefinitionSchedule of reconciliation of hardware revenue [Table text block]
| Name: |
ACFN_ScheduleOfReconciliationOfHardwareRevenueTableTextBlock |
| Namespace Prefix: |
ACFN_ |
| Data Type: |
dtr-types:textBlockItemType |
| Balance Type: |
na |
| Period Type: |
duration |
|
| X |
- DefinitionSchedule of sales commission expense activity [Table Text Block].
| Name: |
ACFN_ScheduleOfSalesCommissionExpenseActivityTableTextBlock |
| Namespace Prefix: |
ACFN_ |
| Data Type: |
dtr-types:textBlockItemType |
| Balance Type: |
na |
| Period Type: |
duration |
|
| X |
- DefinitionSchedule of sales commissions contract assets [Table Text Block]
| Name: |
ACFN_ScheduleOfSalesCommissionsContractAssetsTableTextBlock |
| Namespace Prefix: |
ACFN_ |
| Data Type: |
dtr-types:textBlockItemType |
| Balance Type: |
na |
| Period Type: |
duration |
|
| X |
- DefinitionTabular disclosure of the type of arrangements and the corresponding amounts that comprise the current and noncurrent balance of deferred revenue as of the balance sheet date.
| Name: |
us-gaap_DeferredRevenueByArrangementDisclosureTextBlock |
| Namespace Prefix: |
us-gaap_ |
| Data Type: |
dtr-types:textBlockItemType |
| Balance Type: |
na |
| Period Type: |
duration |
|
| X |
- DefinitionTabular disclosure of disaggregation of revenue into categories depicting how nature, amount, timing, and uncertainty of revenue and cash flows are affected by economic factor. Reference 1: http://www.xbrl.org/2009/role/commonPracticeRef
-Topic 606
-SubTopic 10
-Name Accounting Standards Codification
-Section 50
-Paragraph 5
-Publisher FASB
-URI https://asc.fasb.org//1943274/2147479806/606-10-50-5
| Name: |
us-gaap_DisaggregationOfRevenueTableTextBlock |
| Namespace Prefix: |
us-gaap_ |
| Data Type: |
dtr-types:textBlockItemType |
| Balance Type: |
na |
| Period Type: |
duration |
|
| X |
- References
+ Details
| Name: |
us-gaap_RevenueFromContractWithCustomerAbstract |
| Namespace Prefix: |
us-gaap_ |
| Data Type: |
xbrli:stringItemType |
| Balance Type: |
na |
| Period Type: |
duration |
|
v3.23.3
| X |
- References
+ Details
| Name: |
us-gaap_OrganizationConsolidationAndPresentationOfFinancialStatementsAbstract |
| Namespace Prefix: |
us-gaap_ |
| Data Type: |
xbrli:stringItemType |
| Balance Type: |
na |
| Period Type: |
duration |
|
| X |
- DefinitionEquity impact of the value of stock that has been repurchased during the period and has not been retired and is not held in treasury. Some state laws may mandate the circumstances under which an entity may acquire its own stock and prescribe the accounting treatment therefore. This element is used when state law does not recognize treasury stock. Reference 1: http://fasb.org/us-gaap/role/ref/legacyRef
-Name Accounting Standards Codification
-Section 50
-Paragraph 2
-SubTopic 10
-Topic 505
-Publisher FASB
-URI https://asc.fasb.org//1943274/2147481112/505-10-50-2
Reference 2: http://www.xbrl.org/2003/role/exampleRef
-Topic 946
-SubTopic 830
-Name Accounting Standards Codification
-Section 55
-Paragraph 11
-Publisher FASB
-URI https://asc.fasb.org//1943274/2147480167/946-830-55-11
Reference 3: http://www.xbrl.org/2003/role/disclosureRef
-Topic 946
-SubTopic 205
-Name Accounting Standards Codification
-Section 45
-Paragraph 4
-Subparagraph (a)
-Publisher FASB
-URI https://asc.fasb.org//1943274/2147480767/946-205-45-4
Reference 4: http://www.xbrl.org/2003/role/disclosureRef
-Topic 946
-SubTopic 505
-Name Accounting Standards Codification
-Section 50
-Paragraph 2
-Subparagraph (c)
-Publisher FASB
-URI https://asc.fasb.org//1943274/2147481004/946-505-50-2
Reference 5: http://www.xbrl.org/2003/role/disclosureRef
-Topic 946
-SubTopic 220
-Name Accounting Standards Codification
-Section S99
-Paragraph 3
-Subparagraph (SX 210.6-09(4)(b))
-Publisher FASB
-URI https://asc.fasb.org//1943274/2147483575/946-220-S99-3
Reference 6: http://fasb.org/us-gaap/role/ref/legacyRef
-Topic 210
-SubTopic 10
-Name Accounting Standards Codification
-Section S99
-Paragraph 1
-Subparagraph (SX 210.5-02(28))
-Publisher FASB
-URI https://asc.fasb.org//1943274/2147480566/210-10-S99-1
Reference 7: http://fasb.org/us-gaap/role/ref/legacyRef
-Topic 505
-SubTopic 10
-Name Accounting Standards Codification
-Section S99
-Paragraph 1
-Subparagraph (SX 210.3-04)
-Publisher FASB
-URI https://asc.fasb.org//1943274/2147480008/505-10-S99-1
Reference 8: http://fasb.org/us-gaap/role/ref/legacyRef
-Topic 210
-SubTopic 10
-Name Accounting Standards Codification
-Section S99
-Paragraph 1
-Subparagraph (SX 210.5-02(29))
-Publisher FASB
-URI https://asc.fasb.org//1943274/2147480566/210-10-S99-1
| Name: |
us-gaap_StockRepurchasedDuringPeriodValue |
| Namespace Prefix: |
us-gaap_ |
| Data Type: |
xbrli:monetaryItemType |
| Balance Type: |
debit |
| Period Type: |
duration |
|
| X |
- DefinitionDescription of the reverse stock split arrangement. Also provide the retroactive effect given by the reverse split that occurs after the balance sheet date but before the release of financial statements. Reference 1: http://fasb.org/us-gaap/role/ref/legacyRef
-Topic 505
-SubTopic 10
-Name Accounting Standards Codification
-Section S99
-Paragraph 4
-Subparagraph (SAB Topic 4.C)
-Publisher FASB
-URI https://asc.fasb.org//1943274/2147480008/505-10-S99-4
| Name: |
us-gaap_StockholdersEquityReverseStockSplit |
| Namespace Prefix: |
us-gaap_ |
| Data Type: |
xbrli:stringItemType |
| Balance Type: |
na |
| Period Type: |
duration |
|
v3.23.3
SCHEDULE OF EFFECT ON NET INCOME LOSS AND WEIGHTED AVERAGE NUMBER OF SHARES (Details) - USD ($)
$ / shares in Units, shares in Thousands, $ in Thousands |
3 Months Ended |
9 Months Ended |
Sep. 30, 2023 |
Sep. 30, 2022 |
Sep. 30, 2023 |
Sep. 30, 2022 |
| Accounting Policies [Abstract] |
|
|
|
|
|
| Net income (loss) available to common stockholders |
|
$ 24
|
$ (210)
|
$ 35
|
$ (556)
|
| Weighted average share outstanding: |
|
|
|
|
|
| Basic |
[1] |
2,485
|
2,481
|
2,484
|
2,481
|
| Add: Stock options |
|
47
|
0
|
22
|
0
|
| Diluted |
[1] |
2,532
|
2,481
|
2,506
|
2,481
|
| Basic net income (loss) per share |
[1] |
$ 0.01
|
$ (0.08)
|
$ 0.01
|
$ (0.22)
|
| Diluted net income (loss) per share |
[1] |
$ 0.01
|
$ (0.08)
|
$ 0.01
|
$ (0.22)
|
|
|
| X |
- References
+ Details
| Name: |
us-gaap_AccountingPoliciesAbstract |
| Namespace Prefix: |
us-gaap_ |
| Data Type: |
xbrli:stringItemType |
| Balance Type: |
na |
| Period Type: |
duration |
|
| X |
- DefinitionThe amount of net income (loss) for the period per each share of common stock or unit outstanding during the reporting period. Reference 1: http://www.xbrl.org/2003/role/disclosureRef
-Topic 250
-SubTopic 10
-Name Accounting Standards Codification
-Section 50
-Paragraph 3
-Publisher FASB
-URI https://asc.fasb.org//1943274/2147483443/250-10-50-3
Reference 2: http://www.xbrl.org/2003/role/disclosureRef
-Topic 260
-SubTopic 10
-Name Accounting Standards Codification
-Section 55
-Paragraph 15
-Publisher FASB
-URI https://asc.fasb.org//1943274/2147482635/260-10-55-15
Reference 3: http://www.xbrl.org/2003/role/disclosureRef
-Topic 815
-SubTopic 40
-Name Accounting Standards Codification
-Section 65
-Paragraph 1
-Subparagraph (e)(4)
-Publisher FASB
-URI https://asc.fasb.org//1943274/2147480175/815-40-65-1
Reference 4: http://www.xbrl.org/2003/role/disclosureRef
-Topic 815
-SubTopic 40
-Name Accounting Standards Codification
-Section 65
-Paragraph 1
-Subparagraph (f)
-Publisher FASB
-URI https://asc.fasb.org//1943274/2147480175/815-40-65-1
Reference 5: http://www.xbrl.org/2003/role/disclosureRef
-Topic 250
-SubTopic 10
-Name Accounting Standards Codification
-Section 50
-Paragraph 11
-Subparagraph (a)
-Publisher FASB
-URI https://asc.fasb.org//1943274/2147483443/250-10-50-11
Reference 6: http://www.xbrl.org/2003/role/disclosureRef
-Topic 250
-SubTopic 10
-Name Accounting Standards Codification
-Section 50
-Paragraph 11
-Subparagraph (b)
-Publisher FASB
-URI https://asc.fasb.org//1943274/2147483443/250-10-50-11
Reference 7: http://www.xbrl.org/2003/role/disclosureRef
-Topic 250
-SubTopic 10
-Name Accounting Standards Codification
-Section 50
-Paragraph 7
-Subparagraph (a)
-Publisher FASB
-URI https://asc.fasb.org//1943274/2147483443/250-10-50-7
Reference 8: http://www.xbrl.org/2003/role/disclosureRef
-Topic 260
-SubTopic 10
-Name Accounting Standards Codification
-Section 45
-Paragraph 2
-Publisher FASB
-URI https://asc.fasb.org//1943274/2147482689/260-10-45-2
Reference 9: http://www.xbrl.org/2003/role/disclosureRef
-Topic 260
-SubTopic 10
-Name Accounting Standards Codification
-Section 45
-Paragraph 60B
-Subparagraph (d)
-Publisher FASB
-URI https://asc.fasb.org//1943274/2147482689/260-10-45-60B
Reference 10: http://www.xbrl.org/2003/role/disclosureRef
-Topic 250
-SubTopic 10
-Name Accounting Standards Codification
-Section 50
-Paragraph 4
-Publisher FASB
-URI https://asc.fasb.org//1943274/2147483443/250-10-50-4
Reference 11: http://www.xbrl.org/2003/role/disclosureRef
-Topic 260
-SubTopic 10
-Name Accounting Standards Codification
-Section 50
-Paragraph 1
-Subparagraph (a)
-Publisher FASB
-URI https://asc.fasb.org//1943274/2147482662/260-10-50-1
Reference 12: http://www.xbrl.org/2003/role/disclosureRef
-Topic 260
-SubTopic 10
-Name Accounting Standards Codification
-Section 45
-Paragraph 10
-Publisher FASB
-URI https://asc.fasb.org//1943274/2147482689/260-10-45-10
Reference 13: http://www.xbrl.org/2003/role/disclosureRef
-Topic 220
-SubTopic 10
-Name Accounting Standards Codification
-Section S99
-Paragraph 2
-Subparagraph (SX 210.5-03(25))
-Publisher FASB
-URI https://asc.fasb.org//1943274/2147483621/220-10-S99-2
Reference 14: http://www.xbrl.org/2003/role/disclosureRef
-Topic 942
-SubTopic 220
-Name Accounting Standards Codification
-Section S99
-Paragraph 1
-Subparagraph (SX 210.9-04(27))
-Publisher FASB
-URI https://asc.fasb.org//1943274/2147483589/942-220-S99-1
Reference 15: http://www.xbrl.org/2003/role/disclosureRef
-Topic 944
-SubTopic 220
-Name Accounting Standards Codification
-Section S99
-Paragraph 1
-Subparagraph (SX 210.7-04(23))
-Publisher FASB
-URI https://asc.fasb.org//1943274/2147483586/944-220-S99-1
Reference 16: http://www.xbrl.org/2003/role/exampleRef
-Topic 260
-SubTopic 10
-Name Accounting Standards Codification
-Section 55
-Paragraph 52
-Publisher FASB
-URI https://asc.fasb.org//1943274/2147482635/260-10-55-52
Reference 17: http://www.xbrl.org/2003/role/disclosureRef
-Topic 260
-SubTopic 10
-Name Accounting Standards Codification
-Section 45
-Paragraph 7
-Publisher FASB
-URI https://asc.fasb.org//1943274/2147482689/260-10-45-7
| Name: |
us-gaap_EarningsPerShareBasic |
| Namespace Prefix: |
us-gaap_ |
| Data Type: |
dtr-types:perShareItemType |
| Balance Type: |
na |
| Period Type: |
duration |
|
| X |
- References
+ Details
| Name: |
us-gaap_EarningsPerShareBasicOtherDisclosuresAbstract |
| Namespace Prefix: |
us-gaap_ |
| Data Type: |
xbrli:stringItemType |
| Balance Type: |
na |
| Period Type: |
duration |
|
| X |
- DefinitionThe amount of net income (loss) for the period available to each share of common stock or common unit outstanding during the reporting period and to each share or unit that would have been outstanding assuming the issuance of common shares or units for all dilutive potential common shares or units outstanding during the reporting period. Reference 1: http://www.xbrl.org/2003/role/disclosureRef
-Topic 250
-SubTopic 10
-Name Accounting Standards Codification
-Section 50
-Paragraph 3
-Publisher FASB
-URI https://asc.fasb.org//1943274/2147483443/250-10-50-3
Reference 2: http://www.xbrl.org/2003/role/disclosureRef
-Topic 260
-SubTopic 10
-Name Accounting Standards Codification
-Section 55
-Paragraph 15
-Publisher FASB
-URI https://asc.fasb.org//1943274/2147482635/260-10-55-15
Reference 3: http://www.xbrl.org/2003/role/disclosureRef
-Topic 815
-SubTopic 40
-Name Accounting Standards Codification
-Section 65
-Paragraph 1
-Subparagraph (e)(4)
-Publisher FASB
-URI https://asc.fasb.org//1943274/2147480175/815-40-65-1
Reference 4: http://www.xbrl.org/2003/role/disclosureRef
-Topic 815
-SubTopic 40
-Name Accounting Standards Codification
-Section 65
-Paragraph 1
-Subparagraph (f)
-Publisher FASB
-URI https://asc.fasb.org//1943274/2147480175/815-40-65-1
Reference 5: http://www.xbrl.org/2003/role/disclosureRef
-Topic 250
-SubTopic 10
-Name Accounting Standards Codification
-Section 50
-Paragraph 11
-Subparagraph (a)
-Publisher FASB
-URI https://asc.fasb.org//1943274/2147483443/250-10-50-11
Reference 6: http://www.xbrl.org/2003/role/disclosureRef
-Topic 250
-SubTopic 10
-Name Accounting Standards Codification
-Section 50
-Paragraph 11
-Subparagraph (b)
-Publisher FASB
-URI https://asc.fasb.org//1943274/2147483443/250-10-50-11
Reference 7: http://www.xbrl.org/2003/role/disclosureRef
-Topic 250
-SubTopic 10
-Name Accounting Standards Codification
-Section 50
-Paragraph 7
-Subparagraph (a)
-Publisher FASB
-URI https://asc.fasb.org//1943274/2147483443/250-10-50-7
Reference 8: http://www.xbrl.org/2003/role/disclosureRef
-Topic 260
-SubTopic 10
-Name Accounting Standards Codification
-Section 45
-Paragraph 2
-Publisher FASB
-URI https://asc.fasb.org//1943274/2147482689/260-10-45-2
Reference 9: http://www.xbrl.org/2003/role/disclosureRef
-Topic 260
-SubTopic 10
-Name Accounting Standards Codification
-Section 45
-Paragraph 60B
-Subparagraph (d)
-Publisher FASB
-URI https://asc.fasb.org//1943274/2147482689/260-10-45-60B
Reference 10: http://www.xbrl.org/2003/role/disclosureRef
-Topic 250
-SubTopic 10
-Name Accounting Standards Codification
-Section 50
-Paragraph 4
-Publisher FASB
-URI https://asc.fasb.org//1943274/2147483443/250-10-50-4
Reference 11: http://www.xbrl.org/2003/role/disclosureRef
-Topic 260
-SubTopic 10
-Name Accounting Standards Codification
-Section 50
-Paragraph 1
-Subparagraph (a)
-Publisher FASB
-URI https://asc.fasb.org//1943274/2147482662/260-10-50-1
Reference 12: http://www.xbrl.org/2003/role/disclosureRef
-Topic 220
-SubTopic 10
-Name Accounting Standards Codification
-Section S99
-Paragraph 2
-Subparagraph (SX 210.5-03(25))
-Publisher FASB
-URI https://asc.fasb.org//1943274/2147483621/220-10-S99-2
Reference 13: http://www.xbrl.org/2003/role/disclosureRef
-Topic 942
-SubTopic 220
-Name Accounting Standards Codification
-Section S99
-Paragraph 1
-Subparagraph (SX 210.9-04(27))
-Publisher FASB
-URI https://asc.fasb.org//1943274/2147483589/942-220-S99-1
Reference 14: http://www.xbrl.org/2003/role/disclosureRef
-Topic 944
-SubTopic 220
-Name Accounting Standards Codification
-Section S99
-Paragraph 1
-Subparagraph (SX 210.7-04(23))
-Publisher FASB
-URI https://asc.fasb.org//1943274/2147483586/944-220-S99-1
Reference 15: http://www.xbrl.org/2003/role/exampleRef
-Topic 260
-SubTopic 10
-Name Accounting Standards Codification
-Section 55
-Paragraph 52
-Publisher FASB
-URI https://asc.fasb.org//1943274/2147482635/260-10-55-52
Reference 16: http://www.xbrl.org/2003/role/disclosureRef
-Topic 260
-SubTopic 10
-Name Accounting Standards Codification
-Section 45
-Paragraph 7
-Publisher FASB
-URI https://asc.fasb.org//1943274/2147482689/260-10-45-7
| Name: |
us-gaap_EarningsPerShareDiluted |
| Namespace Prefix: |
us-gaap_ |
| Data Type: |
dtr-types:perShareItemType |
| Balance Type: |
na |
| Period Type: |
duration |
|
| X |
- DefinitionAdditional shares included in the calculation of diluted EPS as a result of the potentially dilutive effect of share based payment arrangements using the treasury stock method. Reference 1: http://www.xbrl.org/2003/role/disclosureRef
-Topic 718
-SubTopic 10
-Name Accounting Standards Codification
-Section 45
-Paragraph 1
-Publisher FASB
-URI https://asc.fasb.org//1943274/2147480454/718-10-45-1
Reference 2: http://www.xbrl.org/2003/role/disclosureRef
-Topic 260
-SubTopic 10
-Name Accounting Standards Codification
-Section 50
-Paragraph 1
-Subparagraph (a)
-Publisher FASB
-URI https://asc.fasb.org//1943274/2147482662/260-10-50-1
Reference 3: http://www.xbrl.org/2003/role/disclosureRef
-Topic 260
-SubTopic 10
-Name Accounting Standards Codification
-Section 45
-Paragraph 22
-Publisher FASB
-URI https://asc.fasb.org//1943274/2147482689/260-10-45-22
Reference 4: http://www.xbrl.org/2003/role/disclosureRef
-Topic 260
-SubTopic 10
-Name Accounting Standards Codification
-Section 45
-Paragraph 23
-Subparagraph (c)
-Publisher FASB
-URI https://asc.fasb.org//1943274/2147482689/260-10-45-23
Reference 5: http://www.xbrl.org/2003/role/disclosureRef
-Topic 260
-SubTopic 10
-Name Accounting Standards Codification
-Section 45
-Paragraph 28A
-Publisher FASB
-URI https://asc.fasb.org//1943274/2147482689/260-10-45-28A
| Name: |
us-gaap_IncrementalCommonSharesAttributableToShareBasedPaymentArrangements |
| Namespace Prefix: |
us-gaap_ |
| Data Type: |
xbrli:sharesItemType |
| Balance Type: |
na |
| Period Type: |
duration |
|
| X |
- DefinitionThe portion of profit or loss for the period, net of income taxes, which is attributable to the parent. Reference 1: http://www.xbrl.org/2003/role/disclosureRef
-Topic 235
-SubTopic 10
-Name Accounting Standards Codification
-Section S99
-Paragraph 1
-Subparagraph (SX 210.4-08(g)(1)(ii))
-Publisher FASB
-URI https://asc.fasb.org//1943274/2147480678/235-10-S99-1
Reference 2: http://www.xbrl.org/2003/role/disclosureRef
-Topic 323
-SubTopic 10
-Name Accounting Standards Codification
-Section 50
-Paragraph 3
-Subparagraph (c)
-Publisher FASB
-URI https://asc.fasb.org//1943274/2147481687/323-10-50-3
Reference 3: http://www.xbrl.org/2003/role/disclosureRef
-Topic 825
-SubTopic 10
-Name Accounting Standards Codification
-Section 50
-Paragraph 28
-Subparagraph (f)
-Publisher FASB
-URI https://asc.fasb.org//1943274/2147482907/825-10-50-28
Reference 4: http://www.xbrl.org/2003/role/disclosureRef
-Topic 220
-SubTopic 10
-Name Accounting Standards Codification
-Section 50
-Paragraph 6
-Publisher FASB
-URI https://asc.fasb.org//1943274/2147482765/220-10-50-6
Reference 5: http://www.xbrl.org/2003/role/disclosureRef
-Topic 250
-SubTopic 10
-Name Accounting Standards Codification
-Section 50
-Paragraph 3
-Publisher FASB
-URI https://asc.fasb.org//1943274/2147483443/250-10-50-3
Reference 6: http://www.xbrl.org/2003/role/disclosureRef
-Topic 250
-SubTopic 10
-Name Accounting Standards Codification
-Section 50
-Paragraph 1
-Subparagraph (b)(2)
-Publisher FASB
-URI https://asc.fasb.org//1943274/2147483443/250-10-50-1
Reference 7: http://www.xbrl.org/2003/role/disclosureRef
-Topic 815
-SubTopic 40
-Name Accounting Standards Codification
-Section 65
-Paragraph 1
-Subparagraph (f)
-Publisher FASB
-URI https://asc.fasb.org//1943274/2147480175/815-40-65-1
Reference 8: http://www.xbrl.org/2003/role/disclosureRef
-Topic 250
-SubTopic 10
-Name Accounting Standards Codification
-Section 50
-Paragraph 8
-Publisher FASB
-URI https://asc.fasb.org//1943274/2147483443/250-10-50-8
Reference 9: http://www.xbrl.org/2003/role/disclosureRef
-Topic 250
-SubTopic 10
-Name Accounting Standards Codification
-Section 50
-Paragraph 9
-Publisher FASB
-URI https://asc.fasb.org//1943274/2147483443/250-10-50-9
Reference 10: http://www.xbrl.org/2003/role/disclosureRef
-Topic 250
-SubTopic 10
-Name Accounting Standards Codification
-Section 50
-Paragraph 11
-Subparagraph (a)
-Publisher FASB
-URI https://asc.fasb.org//1943274/2147483443/250-10-50-11
Reference 11: http://www.xbrl.org/2003/role/disclosureRef
-Topic 250
-SubTopic 10
-Name Accounting Standards Codification
-Section 50
-Paragraph 11
-Subparagraph (b)
-Publisher FASB
-URI https://asc.fasb.org//1943274/2147483443/250-10-50-11
Reference 12: http://www.xbrl.org/2003/role/disclosureRef
-Topic 250
-SubTopic 10
-Name Accounting Standards Codification
-Section 50
-Paragraph 4
-Publisher FASB
-URI https://asc.fasb.org//1943274/2147483443/250-10-50-4
Reference 13: http://www.xbrl.org/2003/role/exampleRef
-Topic 946
-SubTopic 830
-Name Accounting Standards Codification
-Section 55
-Paragraph 10
-Publisher FASB
-URI https://asc.fasb.org//1943274/2147480167/946-830-55-10
Reference 14: http://www.xbrl.org/2003/role/disclosureRef
-Topic 946
-SubTopic 220
-Name Accounting Standards Codification
-Section 45
-Paragraph 7
-Publisher FASB
-URI https://asc.fasb.org//1943274/2147483581/946-220-45-7
Reference 15: http://www.xbrl.org/2003/role/disclosureRef
-Topic 944
-SubTopic 220
-Name Accounting Standards Codification
-Section S99
-Paragraph 1
-Subparagraph (SX 210.7-04(18))
-Publisher FASB
-URI https://asc.fasb.org//1943274/2147483586/944-220-S99-1
Reference 16: http://www.xbrl.org/2003/role/disclosureRef
-Topic 280
-SubTopic 10
-Name Accounting Standards Codification
-Section 50
-Paragraph 22
-Publisher FASB
-URI https://asc.fasb.org//1943274/2147482810/280-10-50-22
Reference 17: http://www.xbrl.org/2003/role/disclosureRef
-Topic 946
-SubTopic 220
-Name Accounting Standards Codification
-Section S99
-Paragraph 1
-Subparagraph (SX 210.6-07(9))
-Publisher FASB
-URI https://asc.fasb.org//1943274/2147483575/946-220-S99-1
Reference 18: http://www.xbrl.org/2003/role/disclosureRef
-Topic 946
-SubTopic 220
-Name Accounting Standards Codification
-Section S99
-Paragraph 3
-Subparagraph (SX 210.6-09(1)(d))
-Publisher FASB
-URI https://asc.fasb.org//1943274/2147483575/946-220-S99-3
Reference 19: http://www.xbrl.org/2003/role/disclosureRef
-Topic 470
-SubTopic 10
-Name Accounting Standards Codification
-Section S99
-Paragraph 1A
-Subparagraph (SX 210.13-01(a)(4)(i))
-Publisher FASB
-URI https://asc.fasb.org//1943274/2147480097/470-10-S99-1A
Reference 20: http://www.xbrl.org/2009/role/commonPracticeRef
-Topic 470
-SubTopic 10
-Name Accounting Standards Codification
-Section S99
-Paragraph 1A
-Subparagraph (SX 210.13-01(a)(4)(ii))
-Publisher FASB
-URI https://asc.fasb.org//1943274/2147480097/470-10-S99-1A
Reference 21: http://www.xbrl.org/2003/role/disclosureRef
-Topic 470
-SubTopic 10
-Name Accounting Standards Codification
-Section S99
-Paragraph 1A
-Subparagraph (SX 210.13-01(a)(4)(iii)(A))
-Publisher FASB
-URI https://asc.fasb.org//1943274/2147480097/470-10-S99-1A
Reference 22: http://www.xbrl.org/2003/role/disclosureRef
-Topic 470
-SubTopic 10
-Name Accounting Standards Codification
-Section S99
-Paragraph 1A
-Subparagraph (SX 210.13-01(a)(4)(iv))
-Publisher FASB
-URI https://asc.fasb.org//1943274/2147480097/470-10-S99-1A
Reference 23: http://www.xbrl.org/2003/role/disclosureRef
-Topic 470
-SubTopic 10
-Name Accounting Standards Codification
-Section S99
-Paragraph 1A
-Subparagraph (SX 210.13-01(a)(5))
-Publisher FASB
-URI https://asc.fasb.org//1943274/2147480097/470-10-S99-1A
Reference 24: http://www.xbrl.org/2003/role/disclosureRef
-Topic 470
-SubTopic 10
-Name Accounting Standards Codification
-Section S99
-Paragraph 1B
-Subparagraph (SX 210.13-02(a)(4)(i))
-Publisher FASB
-URI https://asc.fasb.org//1943274/2147480097/470-10-S99-1B
Reference 25: http://www.xbrl.org/2003/role/disclosureRef
-Topic 470
-SubTopic 10
-Name Accounting Standards Codification
-Section S99
-Paragraph 1B
-Subparagraph (SX 210.13-02(a)(4)(iii)(A))
-Publisher FASB
-URI https://asc.fasb.org//1943274/2147480097/470-10-S99-1B
Reference 26: http://www.xbrl.org/2003/role/disclosureRef
-Topic 470
-SubTopic 10
-Name Accounting Standards Codification
-Section S99
-Paragraph 1B
-Subparagraph (SX 210.13-02(a)(4)(iii)(B))
-Publisher FASB
-URI https://asc.fasb.org//1943274/2147480097/470-10-S99-1B
Reference 27: http://www.xbrl.org/2003/role/disclosureRef
-Topic 470
-SubTopic 10
-Name Accounting Standards Codification
-Section S99
-Paragraph 1B
-Subparagraph (SX 210.13-02(a)(4)(iv))
-Publisher FASB
-URI https://asc.fasb.org//1943274/2147480097/470-10-S99-1B
Reference 28: http://www.xbrl.org/2003/role/disclosureRef
-Topic 470
-SubTopic 10
-Name Accounting Standards Codification
-Section S99
-Paragraph 1B
-Subparagraph (SX 210.13-02(a)(5))
-Publisher FASB
-URI https://asc.fasb.org//1943274/2147480097/470-10-S99-1B
Reference 29: http://www.xbrl.org/2003/role/disclosureRef
-Topic 280
-SubTopic 10
-Name Accounting Standards Codification
-Section 50
-Paragraph 30
-Subparagraph (b)
-Publisher FASB
-URI https://asc.fasb.org//1943274/2147482810/280-10-50-30
Reference 30: http://www.xbrl.org/2003/role/disclosureRef
-Topic 280
-SubTopic 10
-Name Accounting Standards Codification
-Section 50
-Paragraph 32
-Subparagraph (f)
-Publisher FASB
-URI https://asc.fasb.org//1943274/2147482810/280-10-50-32
Reference 31: http://www.xbrl.org/2003/role/disclosureRef
-Topic 260
-SubTopic 10
-Name Accounting Standards Codification
-Section 45
-Paragraph 60B
-Subparagraph (a)
-Publisher FASB
-URI https://asc.fasb.org//1943274/2147482689/260-10-45-60B
Reference 32: http://www.xbrl.org/2003/role/exampleRef
-Topic 280
-SubTopic 10
-Name Accounting Standards Codification
-Section 50
-Paragraph 31
-Publisher FASB
-URI https://asc.fasb.org//1943274/2147482810/280-10-50-31
Reference 33: http://www.xbrl.org/2003/role/disclosureRef
-Topic 280
-SubTopic 10
-Name Accounting Standards Codification
-Section 50
-Paragraph 32
-Subparagraph (c)
-Publisher FASB
-URI https://asc.fasb.org//1943274/2147482810/280-10-50-32
Reference 34: http://www.xbrl.org/2003/role/disclosureRef
-Topic 205
-SubTopic 20
-Name Accounting Standards Codification
-Section 50
-Paragraph 7
-Publisher FASB
-URI https://asc.fasb.org//1943274/2147483499/205-20-50-7
Reference 35: http://fasb.org/us-gaap/role/ref/legacyRef
-Topic 230
-SubTopic 10
-Name Accounting Standards Codification
-Section 45
-Paragraph 28
-Publisher FASB
-URI https://asc.fasb.org//1943274/2147482740/230-10-45-28
Reference 36: http://www.xbrl.org/2003/role/disclosureRef
-Topic 220
-SubTopic 10
-Name Accounting Standards Codification
-Section 45
-Paragraph 1A
-Subparagraph (a)
-Publisher FASB
-URI https://asc.fasb.org//1943274/2147482790/220-10-45-1A
Reference 37: http://www.xbrl.org/2003/role/disclosureRef
-Topic 220
-SubTopic 10
-Name Accounting Standards Codification
-Section 45
-Paragraph 1B
-Subparagraph (a)
-Publisher FASB
-URI https://asc.fasb.org//1943274/2147482790/220-10-45-1B
Reference 38: http://fasb.org/us-gaap/role/ref/legacyRef
-Topic 220
-SubTopic 10
-Name Accounting Standards Codification
-Section S99
-Paragraph 2
-Subparagraph (SX 210.5-03(20))
-Publisher FASB
-URI https://asc.fasb.org//1943274/2147483621/220-10-S99-2
Reference 39: http://fasb.org/us-gaap/role/ref/legacyRef
-Topic 942
-SubTopic 220
-Name Accounting Standards Codification
-Section S99
-Paragraph 1
-Subparagraph (SX 210.9-04(22))
-Publisher FASB
-URI https://asc.fasb.org//1943274/2147483589/942-220-S99-1
| Name: |
us-gaap_NetIncomeLoss |
| Namespace Prefix: |
us-gaap_ |
| Data Type: |
xbrli:monetaryItemType |
| Balance Type: |
credit |
| Period Type: |
duration |
|
| X |
- DefinitionThe average number of shares or units issued and outstanding that are used in calculating diluted EPS or earnings per unit (EPU), determined based on the timing of issuance of shares or units in the period. Reference 1: http://www.xbrl.org/2003/role/disclosureRef
-Topic 260
-SubTopic 10
-Name Accounting Standards Codification
-Section 50
-Paragraph 1
-Subparagraph (a)
-Publisher FASB
-URI https://asc.fasb.org//1943274/2147482662/260-10-50-1
Reference 2: http://www.xbrl.org/2003/role/disclosureRef
-Topic 260
-SubTopic 10
-Name Accounting Standards Codification
-Section 45
-Paragraph 16
-Publisher FASB
-URI https://asc.fasb.org//1943274/2147482689/260-10-45-16
| Name: |
us-gaap_WeightedAverageNumberOfDilutedSharesOutstanding |
| Namespace Prefix: |
us-gaap_ |
| Data Type: |
xbrli:sharesItemType |
| Balance Type: |
na |
| Period Type: |
duration |
|
| X |
- DefinitionNumber of [basic] shares or units, after adjustment for contingently issuable shares or units and other shares or units not deemed outstanding, determined by relating the portion of time within a reporting period that common shares or units have been outstanding to the total time in that period. Reference 1: http://www.xbrl.org/2003/role/disclosureRef
-Topic 260
-SubTopic 10
-Name Accounting Standards Codification
-Section 50
-Paragraph 1
-Subparagraph (a)
-Publisher FASB
-URI https://asc.fasb.org//1943274/2147482662/260-10-50-1
Reference 2: http://www.xbrl.org/2003/role/disclosureRef
-Topic 260
-SubTopic 10
-Name Accounting Standards Codification
-Section 45
-Paragraph 10
-Publisher FASB
-URI https://asc.fasb.org//1943274/2147482689/260-10-45-10
| Name: |
us-gaap_WeightedAverageNumberOfSharesOutstandingBasic |
| Namespace Prefix: |
us-gaap_ |
| Data Type: |
xbrli:sharesItemType |
| Balance Type: |
na |
| Period Type: |
duration |
|
v3.23.3
ACCOUNTING POLICIES (Details Narrative) - USD ($)
|
3 Months Ended |
9 Months Ended |
12 Months Ended |
Sep. 30, 2023 |
Sep. 30, 2022 |
Sep. 30, 2023 |
Sep. 30, 2022 |
Dec. 31, 2022 |
| Product Information [Line Items] |
|
|
|
|
|
| Deposits assets |
$ 1,749,000
|
|
$ 1,749,000
|
|
|
| Inventory write-off |
$ 1,000
|
|
$ 9,000
|
|
|
| Stock Options [Member] |
|
|
|
|
|
| Product Information [Line Items] |
|
|
|
|
|
| Antidilutive securities excluded from computation of earnings per share, amount |
|
2,187
|
6,000
|
60,000
|
|
| Weighted average exercise price |
|
2.08
|
8.49
|
6.72
|
|
| Revenue Benchmark [Member] | Customer Concentration Risk [Member] | One Customer [Member] |
|
|
|
|
|
| Product Information [Line Items] |
|
|
|
|
|
| Concentration risk percentage |
10.00%
|
|
11.00%
|
|
|
| Accounts Receivable [Member] | Customer Concentration Risk [Member] | One Customer [Member] |
|
|
|
|
|
| Product Information [Line Items] |
|
|
|
|
|
| Concentration risk percentage |
|
|
|
|
12.00%
|
| Accounts Receivable [Member] | Customer Concentration Risk [Member] | Two Customer [Member] |
|
|
|
|
|
| Product Information [Line Items] |
|
|
|
|
|
| Concentration risk percentage |
|
|
10.00%
|
|
|
| X |
- DefinitionWeighted average exercise price of options and warrants.
| Name: |
ACFN_WeightedAverageExercisePriceOfOptionsAndWarrants |
| Namespace Prefix: |
ACFN_ |
| Data Type: |
xbrli:sharesItemType |
| Balance Type: |
na |
| Period Type: |
duration |
|
| X |
- DefinitionSecurities (including those issuable pursuant to contingent stock agreements) that could potentially dilute basic earnings per share (EPS) or earnings per unit (EPU) in the future that were not included in the computation of diluted EPS or EPU because to do so would increase EPS or EPU amounts or decrease loss per share or unit amounts for the period presented. Reference 1: http://www.xbrl.org/2003/role/disclosureRef
-Topic 260
-SubTopic 10
-Name Accounting Standards Codification
-Section 50
-Paragraph 1
-Subparagraph (c)
-Publisher FASB
-URI https://asc.fasb.org//1943274/2147482662/260-10-50-1
| Name: |
us-gaap_AntidilutiveSecuritiesExcludedFromComputationOfEarningsPerShareAmount |
| Namespace Prefix: |
us-gaap_ |
| Data Type: |
xbrli:sharesItemType |
| Balance Type: |
na |
| Period Type: |
duration |
|
| X |
- DefinitionFor an entity that discloses a concentration risk in relation to quantitative amount, which serves as the "benchmark" (or denominator) in the equation, this concept represents the concentration percentage derived from the division. Reference 1: http://www.xbrl.org/2003/role/disclosureRef
-Topic 280
-SubTopic 10
-Name Accounting Standards Codification
-Section 50
-Paragraph 42
-Publisher FASB
-URI https://asc.fasb.org//1943274/2147482810/280-10-50-42
Reference 2: http://fasb.org/us-gaap/role/ref/legacyRef
-Name Accounting Standards Codification
-Topic 825
-SubTopic 10
-Section 50
-Paragraph 21
-Subparagraph (a)
-Publisher FASB
-URI https://asc.fasb.org//1943274/2147482907/825-10-50-21
Reference 3: http://fasb.org/us-gaap/role/ref/legacyRef
-Name Accounting Standards Codification
-Topic 825
-SubTopic 10
-Section 50
-Paragraph 20
-Publisher FASB
-URI https://asc.fasb.org//1943274/2147482907/825-10-50-20
Reference 4: http://fasb.org/us-gaap/role/ref/legacyRef
-Name Accounting Standards Codification
-Topic 275
-SubTopic 10
-Section 50
-Paragraph 18
-Publisher FASB
-URI https://asc.fasb.org//1943274/2147482861/275-10-50-18
Reference 5: http://fasb.org/us-gaap/role/ref/legacyRef
-Name Accounting Standards Codification
-Topic 275
-SubTopic 10
-Section 50
-Paragraph 20
-Publisher FASB
-URI https://asc.fasb.org//1943274/2147482861/275-10-50-20
| Name: |
us-gaap_ConcentrationRiskPercentage1 |
| Namespace Prefix: |
us-gaap_ |
| Data Type: |
dtr-types:percentItemType |
| Balance Type: |
na |
| Period Type: |
duration |
|
| X |
- DefinitionThe carrying amount of the asset transferred to a third party to serve as a deposit, which typically serves as security against failure by the transferor to perform under terms of an agreement. Reference 1: http://www.xbrl.org/2009/role/commonPracticeRef
-Topic 210
-SubTopic 10
-Name Accounting Standards Codification
-Section S99
-Paragraph 1
-Subparagraph (SX 210.5-02(17))
-Publisher FASB
-URI https://asc.fasb.org//1943274/2147480566/210-10-S99-1
| Name: |
us-gaap_DepositAssets |
| Namespace Prefix: |
us-gaap_ |
| Data Type: |
xbrli:monetaryItemType |
| Balance Type: |
debit |
| Period Type: |
instant |
|
| X |
- DefinitionAmount of loss from reductions in inventory due to subsequent measurement adjustments, including, but not limited to, physical deterioration, obsolescence, or changes in price levels. Reference 1: http://www.xbrl.org/2003/role/disclosureRef
-Topic 330
-SubTopic 10
-Name Accounting Standards Codification
-Section 50
-Paragraph 2
-Publisher FASB
-URI https://asc.fasb.org//1943274/2147483080/330-10-50-2
| Name: |
us-gaap_InventoryWriteDown |
| Namespace Prefix: |
us-gaap_ |
| Data Type: |
xbrli:monetaryItemType |
| Balance Type: |
debit |
| Period Type: |
duration |
|
| X |
- Details
| Name: |
us-gaap_AntidilutiveSecuritiesExcludedFromComputationOfEarningsPerShareByAntidilutiveSecuritiesAxis=ACFN_StockOptionsMember |
| Namespace Prefix: |
|
| Data Type: |
na |
| Balance Type: |
|
| Period Type: |
|
|
| X |
- Details
| Name: |
us-gaap_ConcentrationRiskByBenchmarkAxis=us-gaap_SalesRevenueNetMember |
| Namespace Prefix: |
|
| Data Type: |
na |
| Balance Type: |
|
| Period Type: |
|
|
| X |
- Details
| Name: |
us-gaap_ConcentrationRiskByTypeAxis=us-gaap_CustomerConcentrationRiskMember |
| Namespace Prefix: |
|
| Data Type: |
na |
| Balance Type: |
|
| Period Type: |
|
|
| X |
- Details
| Name: |
srt_ProductOrServiceAxis=ACFN_OneCustomerMember |
| Namespace Prefix: |
|
| Data Type: |
na |
| Balance Type: |
|
| Period Type: |
|
|
| X |
- Details
| Name: |
us-gaap_ConcentrationRiskByBenchmarkAxis=us-gaap_AccountsReceivableMember |
| Namespace Prefix: |
|
| Data Type: |
na |
| Balance Type: |
|
| Period Type: |
|
|
| X |
- Details
| Name: |
srt_ProductOrServiceAxis=ACFN_TwoCustomerMember |
| Namespace Prefix: |
|
| Data Type: |
na |
| Balance Type: |
|
| Period Type: |
|
|
v3.23.3
LIQUIDITY (Details Narrative) - USD ($)
|
9 Months Ended |
|
|
Sep. 30, 2023 |
Sep. 30, 2022 |
Nov. 07, 2023 |
Dec. 31, 2022 |
| Subsequent Event [Line Items] |
|
|
|
|
| Cash |
$ 1,749,000
|
|
|
|
| Working capital |
513,000
|
|
|
|
| Deferred revenue |
4,270,000
|
|
|
$ 3,984,000
|
| Net increase (decrease) in cash |
299,000
|
$ (598,000)
|
|
|
| Operating activities |
366,000
|
(311,000)
|
|
|
| Investing activities |
72,000
|
292,000
|
|
|
| Financing activities |
$ 5,000
|
$ 5,000
|
|
|
| Subsequent Event [Member] |
|
|
|
|
| Subsequent Event [Line Items] |
|
|
|
|
| Cash |
|
|
$ 1,684,000
|
|
| X |
- DefinitionAmount of currency on hand as well as demand deposits with banks or financial institutions. Includes other kinds of accounts that have the general characteristics of demand deposits. Also includes short-term, highly liquid investments that are both readily convertible to known amounts of cash and so near their maturity that they present insignificant risk of changes in value because of changes in interest rates. Excludes cash and cash equivalents within disposal group and discontinued operation. Reference 1: http://www.xbrl.org/2003/role/disclosureRef
-Topic 210
-SubTopic 10
-Name Accounting Standards Codification
-Section S99
-Paragraph 1
-Subparagraph (SX 210.5-02(1))
-Publisher FASB
-URI https://asc.fasb.org//1943274/2147480566/210-10-S99-1
Reference 2: http://www.xbrl.org/2003/role/exampleRef
-Topic 210
-SubTopic 10
-Name Accounting Standards Codification
-Section 45
-Paragraph 1
-Subparagraph (a)
-Publisher FASB
-URI https://asc.fasb.org//1943274/2147483467/210-10-45-1
Reference 3: http://fasb.org/us-gaap/role/ref/legacyRef
-Name Accounting Standards Codification
-Topic 230
-SubTopic 10
-Section 45
-Paragraph 4
-Publisher FASB
-URI https://asc.fasb.org//1943274/2147482740/230-10-45-4
| Name: |
us-gaap_CashAndCashEquivalentsAtCarryingValue |
| Namespace Prefix: |
us-gaap_ |
| Data Type: |
xbrli:monetaryItemType |
| Balance Type: |
debit |
| Period Type: |
instant |
|
| X |
- DefinitionAmount of increase (decrease) in cash, cash equivalents, and cash and cash equivalents restricted to withdrawal or usage; including effect from exchange rate change. Cash includes, but is not limited to, currency on hand, demand deposits with banks or financial institutions, and other accounts with general characteristics of demand deposits. Cash equivalents include, but are not limited to, short-term, highly liquid investments that are both readily convertible to known amounts of cash and so near their maturity that they present insignificant risk of changes in value because of changes in interest rates. Reference 1: http://fasb.org/us-gaap/role/ref/legacyRef
-Topic 230
-SubTopic 10
-Name Accounting Standards Codification
-Section 45
-Paragraph 24
-Publisher FASB
-URI https://asc.fasb.org//1943274/2147482740/230-10-45-24
Reference 2: http://fasb.org/us-gaap/role/ref/legacyRef
-Name Accounting Standards Codification
-Section 45
-Paragraph 1
-SubTopic 230
-Topic 830
-Publisher FASB
-URI https://asc.fasb.org//1943274/2147481877/830-230-45-1
| Name: |
us-gaap_CashCashEquivalentsRestrictedCashAndRestrictedCashEquivalentsPeriodIncreaseDecreaseIncludingExchangeRateEffect |
| Namespace Prefix: |
us-gaap_ |
| Data Type: |
xbrli:monetaryItemType |
| Balance Type: |
debit |
| Period Type: |
duration |
|
| X |
- DefinitionAmount of deferred income and obligation to transfer product and service to customer for which consideration has been received or is receivable, classified as current. Reference 1: http://www.xbrl.org/2009/role/commonPracticeRef
-Topic 210
-SubTopic 10
-Name Accounting Standards Codification
-Section S99
-Paragraph 1
-Subparagraph (SX 210.5-02(20))
-Publisher FASB
-URI https://asc.fasb.org//1943274/2147480566/210-10-S99-1
| Name: |
us-gaap_DeferredRevenueCurrent |
| Namespace Prefix: |
us-gaap_ |
| Data Type: |
xbrli:monetaryItemType |
| Balance Type: |
credit |
| Period Type: |
instant |
|
| X |
- DefinitionAmount of cash inflow (outflow) from financing activities, including discontinued operations. Financing activity cash flows include obtaining resources from owners and providing them with a return on, and a return of, their investment; borrowing money and repaying amounts borrowed, or settling the obligation; and obtaining and paying for other resources obtained from creditors on long-term credit. Reference 1: http://www.xbrl.org/2003/role/disclosureRef
-Topic 230
-SubTopic 10
-Name Accounting Standards Codification
-Section 45
-Paragraph 24
-Publisher FASB
-URI https://asc.fasb.org//1943274/2147482740/230-10-45-24
| Name: |
us-gaap_NetCashProvidedByUsedInFinancingActivities |
| Namespace Prefix: |
us-gaap_ |
| Data Type: |
xbrli:monetaryItemType |
| Balance Type: |
debit |
| Period Type: |
duration |
|
| X |
- DefinitionAmount of cash inflow (outflow) from investing activities, including discontinued operations. Investing activity cash flows include making and collecting loans and acquiring and disposing of debt or equity instruments and property, plant, and equipment and other productive assets. Reference 1: http://www.xbrl.org/2003/role/disclosureRef
-Topic 230
-SubTopic 10
-Name Accounting Standards Codification
-Section 45
-Paragraph 24
-Publisher FASB
-URI https://asc.fasb.org//1943274/2147482740/230-10-45-24
| Name: |
us-gaap_NetCashProvidedByUsedInInvestingActivities |
| Namespace Prefix: |
us-gaap_ |
| Data Type: |
xbrli:monetaryItemType |
| Balance Type: |
debit |
| Period Type: |
duration |
|
| X |
- DefinitionAmount of cash inflow (outflow) from operating activities, including discontinued operations. Operating activity cash flows include transactions, adjustments, and changes in value not defined as investing or financing activities. Reference 1: http://fasb.org/us-gaap/role/ref/legacyRef
-Topic 230
-SubTopic 10
-Name Accounting Standards Codification
-Section 45
-Paragraph 28
-Publisher FASB
-URI https://asc.fasb.org//1943274/2147482740/230-10-45-28
Reference 2: http://fasb.org/us-gaap/role/ref/legacyRef
-Topic 230
-SubTopic 10
-Name Accounting Standards Codification
-Section 45
-Paragraph 24
-Publisher FASB
-URI https://asc.fasb.org//1943274/2147482740/230-10-45-24
Reference 3: http://fasb.org/us-gaap/role/ref/legacyRef
-Topic 230
-SubTopic 10
-Name Accounting Standards Codification
-Section 45
-Paragraph 25
-Publisher FASB
-URI https://asc.fasb.org//1943274/2147482740/230-10-45-25
| Name: |
us-gaap_NetCashProvidedByUsedInOperatingActivities |
| Namespace Prefix: |
us-gaap_ |
| Data Type: |
xbrli:monetaryItemType |
| Balance Type: |
na |
| Period Type: |
duration |
|
| X |
- DefinitionDetail information of subsequent event by type. User is expected to use existing line items from elsewhere in the taxonomy as the primary line items for this disclosure, which is further associated with dimension and member elements pertaining to a subsequent event. Reference 1: http://www.xbrl.org/2003/role/disclosureRef
-Topic 830
-SubTopic 30
-Name Accounting Standards Codification
-Section 50
-Paragraph 2
-Publisher FASB
-URI https://asc.fasb.org//1943274/2147481674/830-30-50-2
Reference 2: http://www.xbrl.org/2003/role/disclosureRef
-Topic 855
-SubTopic 10
-Name Accounting Standards Codification
-Section 50
-Paragraph 2
-Publisher FASB
-URI https://asc.fasb.org//1943274/2147483399/855-10-50-2
| Name: |
us-gaap_SubsequentEventLineItems |
| Namespace Prefix: |
us-gaap_ |
| Data Type: |
xbrli:stringItemType |
| Balance Type: |
na |
| Period Type: |
duration |
|
| X |
- Details
| Name: |
us-gaap_SubsequentEventTypeAxis=us-gaap_SubsequentEventMember |
| Namespace Prefix: |
|
| Data Type: |
na |
| Balance Type: |
|
| Period Type: |
|
|
v3.23.3
| X |
- DefinitionAmount of allowance for credit loss on financing receivable. Excludes allowance for financing receivable covered under loss sharing agreement. Reference 1: http://www.xbrl.org/2003/role/disclosureRef
-Topic 210
-SubTopic 10
-Name Accounting Standards Codification
-Section S99
-Paragraph 1
-Subparagraph (SX 210.5-02(4))
-Publisher FASB
-URI https://asc.fasb.org//1943274/2147480566/210-10-S99-1
Reference 2: http://www.xbrl.org/2003/role/disclosureRef
-Name Regulation S-K (SK)
-Number 229
-Section 1405
-Paragraph (a)
-Subparagraph (1)
-Publisher SEC
Reference 3: http://www.xbrl.org/2003/role/disclosureRef
-Name Regulation S-K (SK)
-Number 229
-Section 1405
-Paragraph (a)
-Subparagraph (3)
-Publisher SEC
Reference 4: http://www.xbrl.org/2003/role/disclosureRef
-Name Regulation S-K (SK)
-Number 229
-Section 1405
-Paragraph (c)
-Publisher SEC
Reference 5: http://www.xbrl.org/2003/role/disclosureRef
-Topic 326
-SubTopic 20
-Name Accounting Standards Codification
-Section 45
-Paragraph 1
-Publisher FASB
-URI https://asc.fasb.org//1943274/2147479344/326-20-45-1
Reference 6: http://www.xbrl.org/2009/role/commonPracticeRef
-Topic 942
-SubTopic 210
-Name Accounting Standards Codification
-Section S99
-Paragraph 1
-Subparagraph (SX 210.9-03(7)(2))
-Publisher FASB
-URI https://asc.fasb.org//1943274/2147479853/942-210-S99-1
Reference 7: http://fasb.org/us-gaap/role/ref/legacyRef
-Name Accounting Standards Codification
-Section 50
-Paragraph 11B
-Subparagraph (c)(1)
-SubTopic 10
-Topic 310
-Publisher FASB
-URI https://asc.fasb.org//1943274/2147481962/310-10-50-11B
Reference 8: http://www.xbrl.org/2003/role/disclosureRef
-Topic 326
-SubTopic 20
-Name Accounting Standards Codification
-Section 50
-Paragraph 13
-Subparagraph (a)
-Publisher FASB
-URI https://asc.fasb.org//1943274/2147479319/326-20-50-13
Reference 9: http://www.xbrl.org/2003/role/disclosureRef
-Topic 326
-SubTopic 20
-Name Accounting Standards Codification
-Section 50
-Paragraph 13
-Subparagraph (f)
-Publisher FASB
-URI https://asc.fasb.org//1943274/2147479319/326-20-50-13
| Name: |
us-gaap_FinancingReceivableAllowanceForCreditLosses |
| Namespace Prefix: |
us-gaap_ |
| Data Type: |
xbrli:monetaryItemType |
| Balance Type: |
credit |
| Period Type: |
instant |
|
| X |
- DefinitionAmount of increase (decrease) in allowance for credit loss on financing receivable. Reference 1: http://www.xbrl.org/2009/role/commonPracticeRef
-Topic 326
-SubTopic 20
-Name Accounting Standards Codification
-Section 50
-Paragraph 13
-Publisher FASB
-URI https://asc.fasb.org//1943274/2147479319/326-20-50-13
Reference 2: http://fasb.org/us-gaap/role/ref/legacyRef
-Name Accounting Standards Codification
-Topic 310
-SubTopic 10
-Section 50
-Paragraph 11B
-Subparagraph (c)
-Publisher FASB
-URI https://asc.fasb.org//1943274/2147481962/310-10-50-11B
| Name: |
us-gaap_FinancingReceivableAllowanceForCreditLossesPeriodIncreaseDecrease |
| Namespace Prefix: |
us-gaap_ |
| Data Type: |
xbrli:monetaryItemType |
| Balance Type: |
na |
| Period Type: |
duration |
|
| X |
- DefinitionAmount of writeoff of financing receivable, charged against allowance for credit loss. Reference 1: http://www.xbrl.org/2003/role/exampleRef
-Topic 326
-SubTopic 20
-Name Accounting Standards Codification
-Section 55
-Paragraph 79
-Publisher FASB
-URI https://asc.fasb.org//1943274/2147479294/326-20-55-79
Reference 2: http://www.xbrl.org/2003/role/disclosureRef
-Topic 326
-SubTopic 20
-Name Accounting Standards Codification
-Section 50
-Paragraph 6
-Publisher FASB
-URI https://asc.fasb.org//1943274/2147479319/326-20-50-6
Reference 3: http://www.xbrl.org/2003/role/disclosureRef
-Topic 326
-SubTopic 20
-Name Accounting Standards Codification
-Section 50
-Paragraph 13
-Subparagraph (d)
-Publisher FASB
-URI https://asc.fasb.org//1943274/2147479319/326-20-50-13
Reference 4: http://fasb.org/us-gaap/role/ref/legacyRef
-Name Accounting Standards Codification
-Section 50
-Paragraph 11B
-Subparagraph (c)(3)
-SubTopic 10
-Topic 310
-Publisher FASB
-URI https://asc.fasb.org//1943274/2147481962/310-10-50-11B
| Name: |
us-gaap_FinancingReceivableAllowanceForCreditLossesWriteOffs |
| Namespace Prefix: |
us-gaap_ |
| Data Type: |
xbrli:monetaryItemType |
| Balance Type: |
debit |
| Period Type: |
duration |
|
| X |
- References
+ Details
| Name: |
us-gaap_ReceivablesAbstract |
| Namespace Prefix: |
us-gaap_ |
| Data Type: |
xbrli:stringItemType |
| Balance Type: |
na |
| Period Type: |
duration |
|
v3.23.3
| X |
- DefinitionAmount, after allowance for credit loss, of right to consideration from customer for product sold and service rendered in normal course of business. Reference 1: http://www.xbrl.org/2003/role/exampleRef
-Topic 946
-SubTopic 310
-Name Accounting Standards Codification
-Section 45
-Paragraph 1
-Subparagraph (d)
-Publisher FASB
-URI https://asc.fasb.org//1943274/2147480833/946-310-45-1
Reference 2: http://www.xbrl.org/2009/role/commonPracticeRef
-Topic 944
-SubTopic 210
-Name Accounting Standards Codification
-Section S99
-Paragraph 1
-Subparagraph (SX 210.7-03(a)(5))
-Publisher FASB
-URI https://asc.fasb.org//1943274/2147479440/944-210-S99-1
Reference 3: http://www.xbrl.org/2003/role/disclosureRef
-Topic 946
-SubTopic 210
-Name Accounting Standards Codification
-Section S99
-Paragraph 1
-Subparagraph (SX 210.6-04(5)(b))
-Publisher FASB
-URI https://asc.fasb.org//1943274/2147479617/946-210-S99-1
Reference 4: http://www.xbrl.org/2003/role/disclosureRef
-Topic 954
-SubTopic 310
-Name Accounting Standards Codification
-Section 45
-Paragraph 1
-Publisher FASB
-URI https://asc.fasb.org//1943274/2147481058/954-310-45-1
| Name: |
us-gaap_AccountsReceivableNet |
| Namespace Prefix: |
us-gaap_ |
| Data Type: |
xbrli:monetaryItemType |
| Balance Type: |
debit |
| Period Type: |
instant |
|
| X |
- DefinitionAmount of allowance for credit loss on accounts receivable. Reference 1: http://www.xbrl.org/2009/role/commonPracticeRef
-Topic 944
-SubTopic 210
-Name Accounting Standards Codification
-Section S99
-Paragraph 1
-Subparagraph (SX 210.7-03(a)(5))
-Publisher FASB
-URI https://asc.fasb.org//1943274/2147479440/944-210-S99-1
Reference 2: http://www.xbrl.org/2003/role/disclosureRef
-Topic 210
-SubTopic 10
-Name Accounting Standards Codification
-Section S99
-Paragraph 1
-Subparagraph (SX 210.5-02(4))
-Publisher FASB
-URI https://asc.fasb.org//1943274/2147480566/210-10-S99-1
Reference 3: http://www.xbrl.org/2003/role/disclosureRef
-Topic 326
-SubTopic 20
-Name Accounting Standards Codification
-Section 45
-Paragraph 1
-Publisher FASB
-URI https://asc.fasb.org//1943274/2147479344/326-20-45-1
Reference 4: http://www.xbrl.org/2003/role/disclosureRef
-Topic 310
-SubTopic 10
-Name Accounting Standards Codification
-Section 50
-Paragraph 4
-Publisher FASB
-URI https://asc.fasb.org//1943274/2147481962/310-10-50-4
Reference 5: http://www.xbrl.org/2003/role/disclosureRef
-Topic 326
-SubTopic 20
-Name Accounting Standards Codification
-Section 50
-Paragraph 13
-Subparagraph (a)
-Publisher FASB
-URI https://asc.fasb.org//1943274/2147479319/326-20-50-13
Reference 6: http://www.xbrl.org/2003/role/disclosureRef
-Topic 326
-SubTopic 20
-Name Accounting Standards Codification
-Section 50
-Paragraph 13
-Subparagraph (f)
-Publisher FASB
-URI https://asc.fasb.org//1943274/2147479319/326-20-50-13
| Name: |
us-gaap_AllowanceForDoubtfulAccountsReceivable |
| Namespace Prefix: |
us-gaap_ |
| Data Type: |
xbrli:monetaryItemType |
| Balance Type: |
credit |
| Period Type: |
instant |
|
| X |
- References
+ Details
| Name: |
us-gaap_ReceivablesAbstract |
| Namespace Prefix: |
us-gaap_ |
| Data Type: |
xbrli:stringItemType |
| Balance Type: |
na |
| Period Type: |
duration |
|
v3.23.3
| X |
- References
+ Details
| Name: |
us-gaap_InventoryDisclosureAbstract |
| Namespace Prefix: |
us-gaap_ |
| Data Type: |
xbrli:stringItemType |
| Balance Type: |
na |
| Period Type: |
duration |
|
| X |
- DefinitionAmount before valuation and LIFO reserves of completed merchandise or goods expected to be sold within one year or operating cycle, if longer. Reference 1: http://www.xbrl.org/2009/role/commonPracticeRef
-Topic 210
-SubTopic 10
-Name Accounting Standards Codification
-Section S99
-Paragraph 1
-Subparagraph (SX 210.5-02(6)(a)(1))
-Publisher FASB
-URI https://asc.fasb.org//1943274/2147480566/210-10-S99-1
| Name: |
us-gaap_InventoryFinishedGoods |
| Namespace Prefix: |
us-gaap_ |
| Data Type: |
xbrli:monetaryItemType |
| Balance Type: |
debit |
| Period Type: |
instant |
|
| X |
- DefinitionAmount after valuation and LIFO reserves of inventory expected to be sold, or consumed within one year or operating cycle, if longer. Reference 1: http://www.xbrl.org/2003/role/exampleRef
-Topic 852
-SubTopic 10
-Name Accounting Standards Codification
-Section 55
-Paragraph 10
-Publisher FASB
-URI https://asc.fasb.org//1943274/2147481372/852-10-55-10
Reference 2: http://www.xbrl.org/2003/role/exampleRef
-Topic 210
-SubTopic 10
-Name Accounting Standards Codification
-Section 45
-Paragraph 1
-Subparagraph (b)
-Publisher FASB
-URI https://asc.fasb.org//1943274/2147483467/210-10-45-1
Reference 3: http://www.xbrl.org/2003/role/disclosureRef
-Topic 210
-SubTopic 10
-Name Accounting Standards Codification
-Section S99
-Paragraph 1
-Subparagraph (SX 210.5-02(6))
-Publisher FASB
-URI https://asc.fasb.org//1943274/2147480566/210-10-S99-1
| Name: |
us-gaap_InventoryNet |
| Namespace Prefix: |
us-gaap_ |
| Data Type: |
xbrli:monetaryItemType |
| Balance Type: |
debit |
| Period Type: |
instant |
|
| X |
- DefinitionAmount before valuation and LIFO reserves of raw materials expected to be sold, or consumed within one year or operating cycle, if longer. Reference 1: http://www.xbrl.org/2009/role/commonPracticeRef
-Topic 210
-SubTopic 10
-Name Accounting Standards Codification
-Section S99
-Paragraph 1
-Subparagraph (SX 210.5-02(6)(a)(4))
-Publisher FASB
-URI https://asc.fasb.org//1943274/2147480566/210-10-S99-1
| Name: |
us-gaap_InventoryRawMaterials |
| Namespace Prefix: |
us-gaap_ |
| Data Type: |
xbrli:monetaryItemType |
| Balance Type: |
debit |
| Period Type: |
instant |
|
v3.23.3
| X |
- References
+ Details
| Name: |
us-gaap_InventoryDisclosureAbstract |
| Namespace Prefix: |
us-gaap_ |
| Data Type: |
xbrli:stringItemType |
| Balance Type: |
na |
| Period Type: |
duration |
|
| X |
- DefinitionAmount of valuation reserve for inventory. Reference 1: http://www.xbrl.org/2009/role/commonPracticeRef
-Topic 210
-SubTopic 10
-Name Accounting Standards Codification
-Section S99
-Paragraph 1
-Subparagraph (SX 210.5-02(6))
-Publisher FASB
-URI https://asc.fasb.org//1943274/2147480566/210-10-S99-1
Reference 2: http://fasb.org/us-gaap/role/ref/legacyRef
-Name Accounting Standards Codification
-Topic 330
-SubTopic 10
-Section S99
-Paragraph 2
-Subparagraph (SAB TOPIC 5.BB)
-Publisher FASB
-URI https://asc.fasb.org//1943274/2147480581/330-10-S99-2
| Name: |
us-gaap_InventoryValuationReserves |
| Namespace Prefix: |
us-gaap_ |
| Data Type: |
xbrli:monetaryItemType |
| Balance Type: |
credit |
| Period Type: |
instant |
|
| X |
- DefinitionAmount of loss from reductions in inventory due to subsequent measurement adjustments, including, but not limited to, physical deterioration, obsolescence, or changes in price levels. Reference 1: http://www.xbrl.org/2003/role/disclosureRef
-Topic 330
-SubTopic 10
-Name Accounting Standards Codification
-Section 50
-Paragraph 2
-Publisher FASB
-URI https://asc.fasb.org//1943274/2147483080/330-10-50-2
| Name: |
us-gaap_InventoryWriteDown |
| Namespace Prefix: |
us-gaap_ |
| Data Type: |
xbrli:monetaryItemType |
| Balance Type: |
debit |
| Period Type: |
duration |
|
v3.23.3
| X |
- DefinitionCash paid for operating lease liabilities.
| Name: |
ACFN_CashPaidForOperatingLeaseLiabilities |
| Namespace Prefix: |
ACFN_ |
| Data Type: |
xbrli:monetaryItemType |
| Balance Type: |
credit |
| Period Type: |
duration |
|
| X |
- References
+ Details
| Name: |
ACFN_DisclosureLeasesAbstract |
| Namespace Prefix: |
ACFN_ |
| Data Type: |
xbrli:stringItemType |
| Balance Type: |
na |
| Period Type: |
duration |
|
v3.23.3
| X |
- References
+ Details
| Name: |
ACFN_DisclosureLeasesAbstract |
| Namespace Prefix: |
ACFN_ |
| Data Type: |
xbrli:stringItemType |
| Balance Type: |
na |
| Period Type: |
duration |
|
| X |
- DefinitionWeighted average remaining lease term for operating lease, in 'PnYnMnDTnHnMnS' format, for example, 'P1Y5M13D' represents reported fact of one year, five months, and thirteen days. Reference 1: http://www.xbrl.org/2003/role/exampleRef
-Topic 842
-SubTopic 20
-Name Accounting Standards Codification
-Section 55
-Paragraph 53
-Publisher FASB
-URI https://asc.fasb.org//1943274/2147479589/842-20-55-53
Reference 2: http://www.xbrl.org/2003/role/disclosureRef
-Topic 842
-SubTopic 20
-Name Accounting Standards Codification
-Section 50
-Paragraph 4
-Subparagraph (g)(3)
-Publisher FASB
-URI https://asc.fasb.org//1943274/2147478964/842-20-50-4
| Name: |
us-gaap_OperatingLeaseWeightedAverageRemainingLeaseTerm1 |
| Namespace Prefix: |
us-gaap_ |
| Data Type: |
xbrli:durationItemType |
| Balance Type: |
na |
| Period Type: |
instant |
|
v3.23.3
| X |
- References
+ Details
| Name: |
ACFN_DisclosureLeasesAbstract |
| Namespace Prefix: |
ACFN_ |
| Data Type: |
xbrli:stringItemType |
| Balance Type: |
na |
| Period Type: |
duration |
|
| X |
- DefinitionAmount of lessee's undiscounted obligation for lease payment for operating lease. Reference 1: http://www.xbrl.org/2003/role/disclosureRef
-Topic 842
-SubTopic 20
-Name Accounting Standards Codification
-Section 50
-Paragraph 6
-Publisher FASB
-URI https://asc.fasb.org//1943274/2147478964/842-20-50-6
| Name: |
us-gaap_LesseeOperatingLeaseLiabilityPaymentsDue |
| Namespace Prefix: |
us-gaap_ |
| Data Type: |
xbrli:monetaryItemType |
| Balance Type: |
credit |
| Period Type: |
instant |
|
| X |
- DefinitionAmount of lessee's undiscounted obligation for lease payment for operating lease to be paid in next fiscal year following current fiscal year. Excludes interim and annual periods when interim periods are reported from current statement of financial position date (rolling approach). Reference 1: http://www.xbrl.org/2003/role/disclosureRef
-Topic 842
-SubTopic 20
-Name Accounting Standards Codification
-Section 50
-Paragraph 6
-Publisher FASB
-URI https://asc.fasb.org//1943274/2147478964/842-20-50-6
| Name: |
us-gaap_LesseeOperatingLeaseLiabilityPaymentsDueNextTwelveMonths |
| Namespace Prefix: |
us-gaap_ |
| Data Type: |
xbrli:monetaryItemType |
| Balance Type: |
credit |
| Period Type: |
instant |
|
| X |
- DefinitionAmount of lessee's undiscounted obligation for lease payment for operating lease to be paid in second fiscal year following current fiscal year. Excludes interim and annual periods when interim periods are reported from current statement of financial position date (rolling approach). Reference 1: http://www.xbrl.org/2003/role/disclosureRef
-Topic 842
-SubTopic 20
-Name Accounting Standards Codification
-Section 50
-Paragraph 6
-Publisher FASB
-URI https://asc.fasb.org//1943274/2147478964/842-20-50-6
| Name: |
us-gaap_LesseeOperatingLeaseLiabilityPaymentsDueYearTwo |
| Namespace Prefix: |
us-gaap_ |
| Data Type: |
xbrli:monetaryItemType |
| Balance Type: |
credit |
| Period Type: |
instant |
|
| X |
- DefinitionAmount of lessee's undiscounted obligation for lease payments in excess of discounted obligation for lease payments for operating lease. Reference 1: http://www.xbrl.org/2003/role/disclosureRef
-Topic 842
-SubTopic 20
-Name Accounting Standards Codification
-Section 50
-Paragraph 6
-Publisher FASB
-URI https://asc.fasb.org//1943274/2147478964/842-20-50-6
| Name: |
us-gaap_LesseeOperatingLeaseLiabilityUndiscountedExcessAmount |
| Namespace Prefix: |
us-gaap_ |
| Data Type: |
xbrli:monetaryItemType |
| Balance Type: |
credit |
| Period Type: |
instant |
|
| X |
- DefinitionPresent value of lessee's discounted obligation for lease payments from operating lease. Reference 1: http://www.xbrl.org/2003/role/disclosureRef
-Topic 842
-SubTopic 20
-Name Accounting Standards Codification
-Section 45
-Paragraph 1
-Subparagraph (b)
-Publisher FASB
-URI https://asc.fasb.org//1943274/2147479041/842-20-45-1
| Name: |
us-gaap_OperatingLeaseLiability |
| Namespace Prefix: |
us-gaap_ |
| Data Type: |
xbrli:monetaryItemType |
| Balance Type: |
credit |
| Period Type: |
instant |
|
v3.23.3
| X |
- References
+ Details
| Name: |
ACFN_DisclosureLeasesAbstract |
| Namespace Prefix: |
ACFN_ |
| Data Type: |
xbrli:stringItemType |
| Balance Type: |
na |
| Period Type: |
duration |
|
| X |
- DefinitionPresent value of lessee's discounted obligation for lease payments from operating lease, classified as current. Reference 1: http://www.xbrl.org/2003/role/disclosureRef
-Topic 842
-SubTopic 20
-Name Accounting Standards Codification
-Section 45
-Paragraph 1
-Subparagraph (b)
-Publisher FASB
-URI https://asc.fasb.org//1943274/2147479041/842-20-45-1
| Name: |
us-gaap_OperatingLeaseLiabilityCurrent |
| Namespace Prefix: |
us-gaap_ |
| Data Type: |
xbrli:monetaryItemType |
| Balance Type: |
credit |
| Period Type: |
instant |
|
v3.23.3
| X |
- References
+ Details
| Name: |
ACFN_DisclosureLeasesAbstract |
| Namespace Prefix: |
ACFN_ |
| Data Type: |
xbrli:stringItemType |
| Balance Type: |
na |
| Period Type: |
duration |
|
| X |
- DefinitionFinance Lease Liability Sublease Payments Due.
| Name: |
ACFN_FinanceLeaseLiabilitySubleasePaymentsDue |
| Namespace Prefix: |
ACFN_ |
| Data Type: |
xbrli:monetaryItemType |
| Balance Type: |
credit |
| Period Type: |
instant |
|
| X |
- DefinitionFinance Lease Liability Sublease Payments Due Next Twelve Months.
| Name: |
ACFN_FinanceLeaseLiabilitySubleasePaymentsDueNextTwelveMonths |
| Namespace Prefix: |
ACFN_ |
| Data Type: |
xbrli:monetaryItemType |
| Balance Type: |
credit |
| Period Type: |
instant |
|
| X |
- DefinitionFinance Lease Liability Sublease Payments Due Year Two
| Name: |
ACFN_FinanceLeaseLiabilitySubleasePaymentsDueYearTwo |
| Namespace Prefix: |
ACFN_ |
| Data Type: |
xbrli:monetaryItemType |
| Balance Type: |
credit |
| Period Type: |
instant |
|
v3.23.3
LEASES (Details Narrative)
|
|
1 Months Ended |
3 Months Ended |
9 Months Ended |
|
Jul. 06, 2021
USD ($)
ft²
|
Apr. 30, 2019 |
Sep. 30, 2023
USD ($)
|
Sep. 30, 2022
USD ($)
|
Sep. 30, 2023
USD ($)
|
Sep. 30, 2022
USD ($)
|
| Collaborative Arrangement and Arrangement Other than Collaborative [Line Items] |
|
|
|
|
|
|
|
| Operating lease discount rate |
|
|
|
4.50%
|
|
4.50%
|
|
| Operating lease payments |
[1] |
|
|
$ 250,000
|
|
$ 250,000
|
|
| Sublease payment |
|
$ 2,375
|
|
|
|
|
|
| Estimated sublease payments |
|
6,100
|
|
|
|
|
|
| Annual service cost |
|
$ 2,220
|
|
|
|
|
|
| King Industrial Reality Inc [Member] |
|
|
|
|
|
|
|
| Collaborative Arrangement and Arrangement Other than Collaborative [Line Items] |
|
|
|
|
|
|
|
| Office and production space | ft² |
|
1,900
|
|
|
|
|
|
| King Industrial Realty Inc [Member] |
|
|
|
|
|
|
|
| Collaborative Arrangement and Arrangement Other than Collaborative [Line Items] |
|
|
|
|
|
|
|
| Office and production space | ft² |
|
21,000
|
|
|
|
|
|
| Operating Lease Agreements [Member] | Omni Metrix Holdings, Inc. [Member] |
|
|
|
|
|
|
|
| Collaborative Arrangement and Arrangement Other than Collaborative [Line Items] |
|
|
|
|
|
|
|
| Lease description |
|
|
The office equipment lease was entered into in April 2019 and has a sixty-month term
|
|
|
|
|
| Operating lease payments |
|
|
|
$ 33,000
|
$ 31,000
|
$ 96,000
|
$ 93,000
|
|
|
| X |
- DefinitionEstimated sublease payments.
| Name: |
ACFN_EstimatedSubleasePayments |
| Namespace Prefix: |
ACFN_ |
| Data Type: |
xbrli:monetaryItemType |
| Balance Type: |
credit |
| Period Type: |
instant |
|
| X |
- DefinitionLine items represent financial concepts included in a table. These concepts are used to disclose reportable information associated with domain members defined in one or many axes to the table. Reference 1: http://www.xbrl.org/2003/role/disclosureRef
-Topic 808
-SubTopic 10
-Name Accounting Standards Codification
-Section 50
-Paragraph 1
-Subparagraph (d)
-Publisher FASB
-URI https://asc.fasb.org//1943274/2147479402/808-10-50-1
| Name: |
us-gaap_CollaborativeArrangementsAndNoncollaborativeArrangementTransactionsLineItems |
| Namespace Prefix: |
us-gaap_ |
| Data Type: |
xbrli:stringItemType |
| Balance Type: |
na |
| Period Type: |
duration |
|
| X |
- DefinitionDescription of lessee's operating lease. Reference 1: http://www.xbrl.org/2003/role/disclosureRef
-Topic 842
-SubTopic 20
-Name Accounting Standards Codification
-Section 50
-Paragraph 3
-Subparagraph (a)(1)
-Publisher FASB
-URI https://asc.fasb.org//1943274/2147478964/842-20-50-3
| Name: |
us-gaap_LesseeOperatingLeaseDescription |
| Namespace Prefix: |
us-gaap_ |
| Data Type: |
xbrli:stringItemType |
| Balance Type: |
na |
| Period Type: |
duration |
|
| X |
- DefinitionDiscount rate used by lessee to determine present value of operating lease payments. Reference 1: http://www.xbrl.org/2003/role/exampleRef
-Topic 842
-SubTopic 20
-Name Accounting Standards Codification
-Section 50
-Paragraph 3
-Subparagraph (c)(3)
-Publisher FASB
-URI https://asc.fasb.org//1943274/2147478964/842-20-50-3
| Name: |
us-gaap_LesseeOperatingLeaseDiscountRate |
| Namespace Prefix: |
us-gaap_ |
| Data Type: |
dtr-types:percentItemType |
| Balance Type: |
na |
| Period Type: |
instant |
|
| X |
- DefinitionPresent value of lessee's discounted obligation for lease payments from operating lease. Reference 1: http://www.xbrl.org/2003/role/disclosureRef
-Topic 842
-SubTopic 20
-Name Accounting Standards Codification
-Section 45
-Paragraph 1
-Subparagraph (b)
-Publisher FASB
-URI https://asc.fasb.org//1943274/2147479041/842-20-45-1
| Name: |
us-gaap_OperatingLeaseLiability |
| Namespace Prefix: |
us-gaap_ |
| Data Type: |
xbrli:monetaryItemType |
| Balance Type: |
credit |
| Period Type: |
instant |
|
| X |
- DefinitionAmount of cash outflow from operating lease, excluding payments to bring another asset to condition and location necessary for its intended use. Reference 1: http://www.xbrl.org/2003/role/disclosureRef
-Topic 842
-SubTopic 20
-Name Accounting Standards Codification
-Section 45
-Paragraph 5
-Subparagraph (c)
-Publisher FASB
-URI https://asc.fasb.org//1943274/2147479041/842-20-45-5
Reference 2: http://www.xbrl.org/2003/role/disclosureRef
-Topic 842
-SubTopic 20
-Name Accounting Standards Codification
-Section 50
-Paragraph 4
-Subparagraph (g)(1)
-Publisher FASB
-URI https://asc.fasb.org//1943274/2147478964/842-20-50-4
| Name: |
us-gaap_OperatingLeasePayments |
| Namespace Prefix: |
us-gaap_ |
| Data Type: |
xbrli:monetaryItemType |
| Balance Type: |
credit |
| Period Type: |
duration |
|
| X |
- DefinitionAmount of sublease income excluding finance and operating lease expense. Reference 1: http://www.xbrl.org/2003/role/exampleRef
-Topic 842
-SubTopic 20
-Name Accounting Standards Codification
-Section 55
-Paragraph 53
-Publisher FASB
-URI https://asc.fasb.org//1943274/2147479589/842-20-55-53
Reference 2: http://www.xbrl.org/2003/role/disclosureRef
-Topic 842
-SubTopic 20
-Name Accounting Standards Codification
-Section 50
-Paragraph 4
-Subparagraph (e)
-Publisher FASB
-URI https://asc.fasb.org//1943274/2147478964/842-20-50-4
| Name: |
us-gaap_SubleaseIncome |
| Namespace Prefix: |
us-gaap_ |
| Data Type: |
xbrli:monetaryItemType |
| Balance Type: |
credit |
| Period Type: |
duration |
|
| X |
- Details
| Name: |
dei_LegalEntityAxis=ACFN_KingIndustrialRealityIncMember |
| Namespace Prefix: |
|
| Data Type: |
na |
| Balance Type: |
|
| Period Type: |
|
|
| X |
- Details
| Name: |
dei_LegalEntityAxis=ACFN_KingIndustrialRealtyIncMember |
| Namespace Prefix: |
|
| Data Type: |
na |
| Balance Type: |
|
| Period Type: |
|
|
| X |
- Details
| Name: |
us-gaap_TypeOfArrangementAxis=ACFN_OperatingLeaseAgreementsMember |
| Namespace Prefix: |
|
| Data Type: |
na |
| Balance Type: |
|
| Period Type: |
|
|
| X |
- Details
| Name: |
dei_LegalEntityAxis=ACFN_OmnimetrixHoldingsIncMember |
| Namespace Prefix: |
|
| Data Type: |
na |
| Balance Type: |
|
| Period Type: |
|
|
v3.23.3
| X |
- Definition
+ References
+ Details
| Name: |
ACFN_PurchaseCommitmenntPayable |
| Namespace Prefix: |
ACFN_ |
| Data Type: |
xbrli:monetaryItemType |
| Balance Type: |
credit |
| Period Type: |
duration |
|
| X |
- DefinitionLine items represent financial concepts included in a table. These concepts are used to disclose reportable information associated with domain members defined in one or many axes to the table. Reference 1: http://www.xbrl.org/2003/role/disclosureRef
-Topic 808
-SubTopic 10
-Name Accounting Standards Codification
-Section 50
-Paragraph 1
-Subparagraph (d)
-Publisher FASB
-URI https://asc.fasb.org//1943274/2147479402/808-10-50-1
| Name: |
us-gaap_CollaborativeArrangementsAndNoncollaborativeArrangementTransactionsLineItems |
| Namespace Prefix: |
us-gaap_ |
| Data Type: |
xbrli:stringItemType |
| Balance Type: |
na |
| Period Type: |
duration |
|
| X |
- DefinitionPresent value of lessee's discounted obligation for lease payments from operating lease. Reference 1: http://www.xbrl.org/2003/role/disclosureRef
-Topic 842
-SubTopic 20
-Name Accounting Standards Codification
-Section 45
-Paragraph 1
-Subparagraph (b)
-Publisher FASB
-URI https://asc.fasb.org//1943274/2147479041/842-20-45-1
| Name: |
us-gaap_OperatingLeaseLiability |
| Namespace Prefix: |
us-gaap_ |
| Data Type: |
xbrli:monetaryItemType |
| Balance Type: |
credit |
| Period Type: |
instant |
|
| X |
- Details
| Name: |
us-gaap_TypeOfArrangementAxis=ACFN_MasterServicesAgreementMember |
| Namespace Prefix: |
|
| Data Type: |
na |
| Balance Type: |
|
| Period Type: |
|
|
v3.23.3
SCHEDULE OF BLACK-SCHOLES OPTION PRICING ESTIMATE FAIR VALUE (Details) - USD ($)
|
9 Months Ended |
12 Months Ended |
Sep. 30, 2023 |
Dec. 31, 2022 |
| Equity [Abstract] |
|
|
| Number of Options (in shares), Outstanding at beginning of year |
58,966
|
|
| Weighted Average Exercise Price Per Share, Outstanding at beginning of year |
$ 6.71
|
|
| Weighted average remaining contractual life at end |
4 years 2 months 12 days
|
4 years 3 months 18 days
|
| Aggregate intrinsic value at beginning of year |
$ 16,000
|
|
| Number of Options (in shares), Granted |
13,436
|
|
| Weighted Average Exercise Price Per Share, Granted |
$ 5.24
|
|
| Number of Options (in shares), Exercised |
|
|
| Weighted Average Exercise Price Per Share, Exercised |
|
|
| Number of Options (in shares), Forfeited or expired |
(1,280)
|
|
| Weighted Average Exercise Price Per Share, Forfeited or expired |
$ 6.48
|
|
| Number of Options (in shares), Outstanding at end of year |
71,122
|
58,966
|
| Weighted Average Exercise Price Per Share, Outstanding at end of year |
$ 6.44
|
$ 6.71
|
| Aggregate intrinsic value at end of year |
$ 46,000
|
$ 16,000
|
| Number of Options (in shares), Exercisable at end of year |
61,786
|
|
| Weighted Average Exercise Price Per Share, Exercisable at end of year |
$ 6.49
|
|
| Weighted average remaining contractual life at exercisable at end of year |
3 years 10 months 24 days
|
|
| Aggregate intrinsic value, Exercisable at end of year |
$ 38,000
|
|
| X |
- DefinitionFor presentations that combine terminations, the number of shares under options that were cancelled during the reporting period as a result of occurrence of a terminating event specified in contractual agreements pertaining to the stock option plan or that expired.
| Name: |
ACFN_ShareBasedCompensationArrangementByShareBasedPaymentAwardOptionForfeituresAndExpirationsInPeriod |
| Namespace Prefix: |
ACFN_ |
| Data Type: |
xbrli:sharesItemType |
| Balance Type: |
na |
| Period Type: |
duration |
|
| X |
- References
+ Details
| Name: |
us-gaap_EquityAbstract |
| Namespace Prefix: |
us-gaap_ |
| Data Type: |
xbrli:stringItemType |
| Balance Type: |
na |
| Period Type: |
duration |
|
| X |
- DefinitionThe number of shares into which fully or partially vested stock options outstanding as of the balance sheet date can be currently converted under the option plan. Reference 1: http://www.xbrl.org/2003/role/disclosureRef
-Topic 718
-SubTopic 10
-Name Accounting Standards Codification
-Section 50
-Paragraph 2
-Subparagraph (c)(1)(iii)
-Publisher FASB
-URI https://asc.fasb.org//1943274/2147480429/718-10-50-2
| Name: |
us-gaap_ShareBasedCompensationArrangementByShareBasedPaymentAwardOptionsExercisableNumber |
| Namespace Prefix: |
us-gaap_ |
| Data Type: |
xbrli:sharesItemType |
| Balance Type: |
na |
| Period Type: |
instant |
|
| X |
- DefinitionThe weighted-average price as of the balance sheet date at which grantees can acquire the shares reserved for issuance on vested portions of options outstanding and currently exercisable under the stock option plan. Reference 1: http://www.xbrl.org/2003/role/disclosureRef
-Topic 718
-SubTopic 10
-Name Accounting Standards Codification
-Section 50
-Paragraph 2
-Subparagraph (c)(1)(iii)
-Publisher FASB
-URI https://asc.fasb.org//1943274/2147480429/718-10-50-2
| Name: |
us-gaap_ShareBasedCompensationArrangementByShareBasedPaymentAwardOptionsExercisableWeightedAverageExercisePrice |
| Namespace Prefix: |
us-gaap_ |
| Data Type: |
dtr-types:perShareItemType |
| Balance Type: |
na |
| Period Type: |
instant |
|
| X |
- DefinitionWeighted average price of options that were either forfeited or expired. Reference 1: http://www.xbrl.org/2009/role/commonPracticeRef
-Topic 718
-SubTopic 10
-Name Accounting Standards Codification
-Section 50
-Paragraph 2
-Subparagraph (c)(1)(iv)
-Publisher FASB
-URI https://asc.fasb.org//1943274/2147480429/718-10-50-2
| Name: |
us-gaap_ShareBasedCompensationArrangementByShareBasedPaymentAwardOptionsForfeituresAndExpirationsInPeriodWeightedAverageExercisePrice |
| Namespace Prefix: |
us-gaap_ |
| Data Type: |
dtr-types:perShareItemType |
| Balance Type: |
na |
| Period Type: |
duration |
|
| X |
- DefinitionGross number of share options (or share units) granted during the period. Reference 1: http://www.xbrl.org/2003/role/disclosureRef
-Topic 718
-SubTopic 10
-Name Accounting Standards Codification
-Section 50
-Paragraph 2
-Subparagraph (c)(1)(iv)(01)
-Publisher FASB
-URI https://asc.fasb.org//1943274/2147480429/718-10-50-2
| Name: |
us-gaap_ShareBasedCompensationArrangementByShareBasedPaymentAwardOptionsGrantsInPeriodGross |
| Namespace Prefix: |
us-gaap_ |
| Data Type: |
xbrli:sharesItemType |
| Balance Type: |
na |
| Period Type: |
duration |
|
| X |
- DefinitionAmount by which the current fair value of the underlying stock exceeds the exercise price of options outstanding. Reference 1: http://fasb.org/us-gaap/role/ref/legacyRef
-Name Accounting Standards Codification
-Topic 718
-SubTopic 10
-Section 50
-Paragraph 2
-Publisher FASB
-URI https://asc.fasb.org//1943274/2147480429/718-10-50-2
| Name: |
us-gaap_ShareBasedCompensationArrangementByShareBasedPaymentAwardOptionsOutstandingIntrinsicValue |
| Namespace Prefix: |
us-gaap_ |
| Data Type: |
xbrli:monetaryItemType |
| Balance Type: |
debit |
| Period Type: |
instant |
|
| X |
- DefinitionNumber of options outstanding, including both vested and non-vested options. Reference 1: http://www.xbrl.org/2003/role/disclosureRef
-Topic 718
-SubTopic 10
-Name Accounting Standards Codification
-Section 50
-Paragraph 2
-Subparagraph (c)(1)(i)
-Publisher FASB
-URI https://asc.fasb.org//1943274/2147480429/718-10-50-2
Reference 2: http://www.xbrl.org/2003/role/disclosureRef
-Topic 718
-SubTopic 10
-Name Accounting Standards Codification
-Section 50
-Paragraph 2
-Subparagraph (c)(1)(ii)
-Publisher FASB
-URI https://asc.fasb.org//1943274/2147480429/718-10-50-2
| Name: |
us-gaap_ShareBasedCompensationArrangementByShareBasedPaymentAwardOptionsOutstandingNumber |
| Namespace Prefix: |
us-gaap_ |
| Data Type: |
xbrli:sharesItemType |
| Balance Type: |
na |
| Period Type: |
instant |
|
| X |
- DefinitionWeighted average price at which grantees can acquire the shares reserved for issuance under the stock option plan. Reference 1: http://www.xbrl.org/2003/role/disclosureRef
-Topic 718
-SubTopic 10
-Name Accounting Standards Codification
-Section 50
-Paragraph 2
-Subparagraph (c)(1)(i)
-Publisher FASB
-URI https://asc.fasb.org//1943274/2147480429/718-10-50-2
Reference 2: http://www.xbrl.org/2003/role/disclosureRef
-Topic 718
-SubTopic 10
-Name Accounting Standards Codification
-Section 50
-Paragraph 2
-Subparagraph (c)(1)(ii)
-Publisher FASB
-URI https://asc.fasb.org//1943274/2147480429/718-10-50-2
| Name: |
us-gaap_ShareBasedCompensationArrangementByShareBasedPaymentAwardOptionsOutstandingWeightedAverageExercisePrice |
| Namespace Prefix: |
us-gaap_ |
| Data Type: |
dtr-types:perShareItemType |
| Balance Type: |
na |
| Period Type: |
instant |
|
| X |
- DefinitionWeighted average price at which option holders acquired shares when converting their stock options into shares. Reference 1: http://www.xbrl.org/2003/role/disclosureRef
-Topic 718
-SubTopic 10
-Name Accounting Standards Codification
-Section 50
-Paragraph 2
-Subparagraph (c)(1)(iv)(02)
-Publisher FASB
-URI https://asc.fasb.org//1943274/2147480429/718-10-50-2
| Name: |
us-gaap_ShareBasedCompensationArrangementsByShareBasedPaymentAwardOptionsExercisesInPeriodWeightedAverageExercisePrice |
| Namespace Prefix: |
us-gaap_ |
| Data Type: |
dtr-types:perShareItemType |
| Balance Type: |
na |
| Period Type: |
duration |
|
| X |
- DefinitionWeighted average per share amount at which grantees can acquire shares of common stock by exercise of options. Reference 1: http://www.xbrl.org/2003/role/disclosureRef
-Topic 718
-SubTopic 10
-Name Accounting Standards Codification
-Section 50
-Paragraph 2
-Subparagraph (c)(1)(iv)(01)
-Publisher FASB
-URI https://asc.fasb.org//1943274/2147480429/718-10-50-2
| Name: |
us-gaap_ShareBasedCompensationArrangementsByShareBasedPaymentAwardOptionsGrantsInPeriodWeightedAverageExercisePrice |
| Namespace Prefix: |
us-gaap_ |
| Data Type: |
dtr-types:perShareItemType |
| Balance Type: |
na |
| Period Type: |
duration |
|
| X |
- DefinitionAmount of difference between fair value of the underlying shares reserved for issuance and exercise price of vested portions of options outstanding and currently exercisable. Reference 1: http://fasb.org/us-gaap/role/ref/legacyRef
-Name Accounting Standards Codification
-Topic 718
-SubTopic 10
-Section 50
-Paragraph 2
-Publisher FASB
-URI https://asc.fasb.org//1943274/2147480429/718-10-50-2
| Name: |
us-gaap_SharebasedCompensationArrangementBySharebasedPaymentAwardOptionsExercisableIntrinsicValue1 |
| Namespace Prefix: |
us-gaap_ |
| Data Type: |
xbrli:monetaryItemType |
| Balance Type: |
debit |
| Period Type: |
instant |
|
| X |
- DefinitionWeighted average remaining contractual term for vested portions of options outstanding and currently exercisable or convertible, in 'PnYnMnDTnHnMnS' format, for example, 'P1Y5M13D' represents the reported fact of one year, five months, and thirteen days. Reference 1: http://fasb.org/us-gaap/role/ref/legacyRef
-Name Accounting Standards Codification
-Topic 718
-SubTopic 10
-Section 50
-Paragraph 2
-Publisher FASB
-URI https://asc.fasb.org//1943274/2147480429/718-10-50-2
| Name: |
us-gaap_SharebasedCompensationArrangementBySharebasedPaymentAwardOptionsExercisableWeightedAverageRemainingContractualTerm1 |
| Namespace Prefix: |
us-gaap_ |
| Data Type: |
xbrli:durationItemType |
| Balance Type: |
na |
| Period Type: |
duration |
|
| X |
- DefinitionWeighted average remaining contractual term for option awards outstanding, in 'PnYnMnDTnHnMnS' format, for example, 'P1Y5M13D' represents the reported fact of one year, five months, and thirteen days. Reference 1: http://fasb.org/us-gaap/role/ref/legacyRef
-Topic 718
-SubTopic 10
-Subparagraph (e)(1)
-Name Accounting Standards Codification
-Paragraph 2
-Section 50
-Publisher FASB
-URI https://asc.fasb.org//1943274/2147480429/718-10-50-2
| Name: |
us-gaap_SharebasedCompensationArrangementBySharebasedPaymentAwardOptionsOutstandingWeightedAverageRemainingContractualTerm2 |
| Namespace Prefix: |
us-gaap_ |
| Data Type: |
xbrli:durationItemType |
| Balance Type: |
na |
| Period Type: |
duration |
|
| X |
- DefinitionNumber of share options (or share units) exercised during the current period. Reference 1: http://fasb.org/us-gaap/role/ref/legacyRef
-Name Accounting Standards Codification
-Section 50
-Paragraph 2
-SubTopic 10
-Topic 505
-Publisher FASB
-URI https://asc.fasb.org//1943274/2147481112/505-10-50-2
Reference 2: http://www.xbrl.org/2003/role/disclosureRef
-Topic 718
-SubTopic 10
-Name Accounting Standards Codification
-Section 50
-Paragraph 2
-Subparagraph (c)(1)(iv)(02)
-Publisher FASB
-URI https://asc.fasb.org//1943274/2147480429/718-10-50-2
Reference 3: http://fasb.org/us-gaap/role/ref/legacyRef
-Topic 210
-SubTopic 10
-Name Accounting Standards Codification
-Section S99
-Paragraph 1
-Subparagraph (SX 210.5-02(28))
-Publisher FASB
-URI https://asc.fasb.org//1943274/2147480566/210-10-S99-1
Reference 4: http://fasb.org/us-gaap/role/ref/legacyRef
-Topic 505
-SubTopic 10
-Name Accounting Standards Codification
-Section S99
-Paragraph 1
-Subparagraph (SX 210.3-04)
-Publisher FASB
-URI https://asc.fasb.org//1943274/2147480008/505-10-S99-1
Reference 5: http://fasb.org/us-gaap/role/ref/legacyRef
-Topic 210
-SubTopic 10
-Name Accounting Standards Codification
-Section S99
-Paragraph 1
-Subparagraph (SX 210.5-02(29))
-Publisher FASB
-URI https://asc.fasb.org//1943274/2147480566/210-10-S99-1
| Name: |
us-gaap_StockIssuedDuringPeriodSharesStockOptionsExercised |
| Namespace Prefix: |
us-gaap_ |
| Data Type: |
xbrli:sharesItemType |
| Balance Type: |
na |
| Period Type: |
duration |
|
v3.23.3
| X |
- References
+ Details
| Name: |
ACFN_FairValueOfOptionsGranted |
| Namespace Prefix: |
ACFN_ |
| Data Type: |
xbrli:monetaryItemType |
| Balance Type: |
na |
| Period Type: |
duration |
|
| X |
- References
+ Details
| Name: |
us-gaap_EquityAbstract |
| Namespace Prefix: |
us-gaap_ |
| Data Type: |
xbrli:stringItemType |
| Balance Type: |
na |
| Period Type: |
duration |
|
| X |
- DefinitionThe estimated dividend rate (a percentage of the share price) to be paid (expected dividends) to holders of the underlying shares over the option's term. Reference 1: http://www.xbrl.org/2003/role/disclosureRef
-Topic 718
-SubTopic 10
-Name Accounting Standards Codification
-Section 50
-Paragraph 2
-Subparagraph (f)(2)(iii)
-Publisher FASB
-URI https://asc.fasb.org//1943274/2147480429/718-10-50-2
| Name: |
us-gaap_ShareBasedCompensationArrangementByShareBasedPaymentAwardFairValueAssumptionsExpectedDividendRate |
| Namespace Prefix: |
us-gaap_ |
| Data Type: |
dtr-types:percentItemType |
| Balance Type: |
na |
| Period Type: |
duration |
|
| X |
- DefinitionThe estimated measure of the percentage by which a share price is expected to fluctuate during a period. Volatility also may be defined as a probability-weighted measure of the dispersion of returns about the mean. The volatility of a share price is the standard deviation of the continuously compounded rates of return on the share over a specified period. That is the same as the standard deviation of the differences in the natural logarithms of the stock prices plus dividends, if any, over the period. Reference 1: http://www.xbrl.org/2003/role/disclosureRef
-Topic 718
-SubTopic 10
-Name Accounting Standards Codification
-Section 50
-Paragraph 2
-Subparagraph (f)(2)(ii)
-Publisher FASB
-URI https://asc.fasb.org//1943274/2147480429/718-10-50-2
| Name: |
us-gaap_ShareBasedCompensationArrangementByShareBasedPaymentAwardFairValueAssumptionsExpectedVolatilityRate |
| Namespace Prefix: |
us-gaap_ |
| Data Type: |
dtr-types:percentItemType |
| Balance Type: |
na |
| Period Type: |
duration |
|
| X |
- DefinitionThe risk-free interest rate assumption that is used in valuing an option on its own shares. Reference 1: http://www.xbrl.org/2003/role/disclosureRef
-Topic 718
-SubTopic 10
-Name Accounting Standards Codification
-Section 50
-Paragraph 2
-Subparagraph (f)(2)(iv)
-Publisher FASB
-URI https://asc.fasb.org//1943274/2147480429/718-10-50-2
| Name: |
us-gaap_ShareBasedCompensationArrangementByShareBasedPaymentAwardFairValueAssumptionsRiskFreeInterestRate |
| Namespace Prefix: |
us-gaap_ |
| Data Type: |
dtr-types:percentItemType |
| Balance Type: |
na |
| Period Type: |
duration |
|
| X |
- DefinitionExpected term of award under share-based payment arrangement, in 'PnYnMnDTnHnMnS' format, for example, 'P1Y5M13D' represents reported fact of one year, five months, and thirteen days. Reference 1: http://www.xbrl.org/2003/role/disclosureRef
-Topic 718
-SubTopic 10
-Name Accounting Standards Codification
-Section 50
-Paragraph 2
-Subparagraph (f)(2)(i)
-Publisher FASB
-URI https://asc.fasb.org//1943274/2147480429/718-10-50-2
| Name: |
us-gaap_SharebasedCompensationArrangementBySharebasedPaymentAwardFairValueAssumptionsExpectedTerm1 |
| Namespace Prefix: |
us-gaap_ |
| Data Type: |
xbrli:durationItemType |
| Balance Type: |
na |
| Period Type: |
duration |
|
v3.23.3
SUMMARY OF WARRANT ACTIVITY (Details) - Warrant [Member] - $ / shares
|
9 Months Ended |
12 Months Ended |
Sep. 30, 2023 |
Dec. 31, 2022 |
| Accumulated Other Comprehensive Income (Loss) [Line Items] |
|
|
| Number of Warrants (in Shares), Outstanding at beginning balance |
2,187
|
|
| Weighted Average Exercise Price Per Share, Outstanding at beginning balance |
$ 2.08
|
|
| Weighted average remaining contractual life at begining |
|
2 months 15 days
|
| Number of Warrants (in Shares), Granted |
|
|
| Weighted Average Exercise Price Per Share, Granted |
|
|
| Number of Warrants (in Shares), Exercised |
(2,187)
|
|
| Weighted Average Exercise Price Per Share, Exercised |
$ 2.08
|
|
| Number of Warrants (in Shares), Forfeited or expired |
|
|
| Weighted Average Exercise Price Per Share, Forfeited or expired |
|
|
| Number of Warrants (in Shares), Outstanding at end balance |
|
2,187
|
| Weighted Average Exercise Price Per Share, Outstanding at end balance |
|
$ 2.08
|
| X |
- DefinitionNon Options Weighted Average Remaining Contractual Term.
| Name: |
ACFN_SharebasedCompensationArrangementBySharebasedPaymentAwardNonOptionsOutstandingWeightedAverageRemainingContractualTerm2 |
| Namespace Prefix: |
ACFN_ |
| Data Type: |
xbrli:durationItemType |
| Balance Type: |
na |
| Period Type: |
duration |
|
| X |
- DefinitionLine items represent financial concepts included in a table. These concepts are used to disclose reportable information associated with domain members defined in one or many axes to the table. Reference 1: http://www.xbrl.org/2003/role/disclosureRef
-Topic 220
-SubTopic 10
-Name Accounting Standards Codification
-Section 50
-Paragraph 4
-Publisher FASB
-URI https://asc.fasb.org//1943274/2147482765/220-10-50-4
Reference 2: http://www.xbrl.org/2003/role/disclosureRef
-Topic 220
-SubTopic 10
-Name Accounting Standards Codification
-Section 50
-Paragraph 5
-Publisher FASB
-URI https://asc.fasb.org//1943274/2147482765/220-10-50-5
Reference 3: http://www.xbrl.org/2003/role/disclosureRef
-Topic 830
-SubTopic 30
-Name Accounting Standards Codification
-Section 50
-Paragraph 1
-Publisher FASB
-URI https://asc.fasb.org//1943274/2147481674/830-30-50-1
Reference 4: http://www.xbrl.org/2003/role/disclosureRef
-Topic 830
-SubTopic 30
-Name Accounting Standards Codification
-Section 45
-Paragraph 17
-Publisher FASB
-URI https://asc.fasb.org//1943274/2147481694/830-30-45-17
Reference 5: http://www.xbrl.org/2003/role/disclosureRef
-Topic 830
-SubTopic 30
-Name Accounting Standards Codification
-Section 45
-Paragraph 20
-Subparagraph (a)
-Publisher FASB
-URI https://asc.fasb.org//1943274/2147481694/830-30-45-20
Reference 6: http://www.xbrl.org/2003/role/disclosureRef
-Topic 830
-SubTopic 30
-Name Accounting Standards Codification
-Section 45
-Paragraph 20
-Subparagraph (b)
-Publisher FASB
-URI https://asc.fasb.org//1943274/2147481694/830-30-45-20
Reference 7: http://www.xbrl.org/2003/role/disclosureRef
-Topic 830
-SubTopic 30
-Name Accounting Standards Codification
-Section 45
-Paragraph 20
-Subparagraph (c)
-Publisher FASB
-URI https://asc.fasb.org//1943274/2147481694/830-30-45-20
Reference 8: http://www.xbrl.org/2003/role/disclosureRef
-Topic 830
-SubTopic 30
-Name Accounting Standards Codification
-Section 45
-Paragraph 20
-Subparagraph (d)
-Publisher FASB
-URI https://asc.fasb.org//1943274/2147481694/830-30-45-20
| Name: |
us-gaap_AccumulatedOtherComprehensiveIncomeLossLineItems |
| Namespace Prefix: |
us-gaap_ |
| Data Type: |
xbrli:stringItemType |
| Balance Type: |
na |
| Period Type: |
duration |
|
| X |
- DefinitionNumber of non-option equity instruments exercised by participants. Reference 1: http://fasb.org/us-gaap/role/ref/legacyRef
-Name Accounting Standards Codification
-Section 50
-Paragraph 2
-Subparagraph (c)(1)(iv)(2)
-SubTopic 10
-Topic 718
-Publisher FASB
-URI https://asc.fasb.org//1943274/2147480429/718-10-50-2
| Name: |
us-gaap_ShareBasedCompensationArrangementByShareBasedPaymentAwardNonOptionEquityInstrumentsExercised |
| Namespace Prefix: |
us-gaap_ |
| Data Type: |
xbrli:sharesItemType |
| Balance Type: |
na |
| Period Type: |
duration |
|
| X |
- DefinitionNumber of shares under non-option equity instrument agreements that were either cancelled or expired. Reference 1: http://fasb.org/us-gaap/role/ref/legacyRef
-Name Accounting Standards Codification
-Section 50
-Paragraph 2
-Subparagraph (c)(1)(iv)(3)-(4)
-SubTopic 10
-Topic 718
-Publisher FASB
-URI https://asc.fasb.org//1943274/2147480429/718-10-50-2
| Name: |
us-gaap_ShareBasedCompensationArrangementByShareBasedPaymentAwardNonOptionEquityInstrumentsForfeituresAndExpirations |
| Namespace Prefix: |
us-gaap_ |
| Data Type: |
xbrli:sharesItemType |
| Balance Type: |
na |
| Period Type: |
duration |
|
| X |
- DefinitionNet number of non-option equity instruments granted to participants. Reference 1: http://fasb.org/us-gaap/role/ref/legacyRef
-Name Accounting Standards Codification
-Section 50
-Paragraph 2
-Subparagraph (c)(1)(iv)(1)
-SubTopic 10
-Topic 718
-Publisher FASB
-URI https://asc.fasb.org//1943274/2147480429/718-10-50-2
| Name: |
us-gaap_ShareBasedCompensationArrangementByShareBasedPaymentAwardNonOptionEquityInstrumentsGranted |
| Namespace Prefix: |
us-gaap_ |
| Data Type: |
xbrli:sharesItemType |
| Balance Type: |
na |
| Period Type: |
duration |
|
| X |
- DefinitionNumber of equity instruments other than options outstanding, including both vested and non-vested instruments. Reference 1: http://fasb.org/us-gaap/role/ref/legacyRef
-Name Accounting Standards Codification
-Section 50
-Paragraph 2
-Subparagraph (c)(1)(i)
-SubTopic 10
-Topic 718
-Publisher FASB
-URI https://asc.fasb.org//1943274/2147480429/718-10-50-2
Reference 2: http://fasb.org/us-gaap/role/ref/legacyRef
-Name Accounting Standards Codification
-Section 50
-Paragraph 2
-Subparagraph (c)(1)(ii)
-SubTopic 10
-Topic 718
-Publisher FASB
-URI https://asc.fasb.org//1943274/2147480429/718-10-50-2
| Name: |
us-gaap_ShareBasedCompensationArrangementByShareBasedPaymentAwardNonOptionEquityInstrumentsOutstandingNumber |
| Namespace Prefix: |
us-gaap_ |
| Data Type: |
xbrli:sharesItemType |
| Balance Type: |
na |
| Period Type: |
instant |
|
| X |
- Details
| Name: |
us-gaap_StatementEquityComponentsAxis=us-gaap_WarrantMember |
| Namespace Prefix: |
|
| Data Type: |
na |
| Balance Type: |
|
| Period Type: |
|
|
v3.23.3
EQUITY (Details Narrative) - USD ($)
|
|
3 Months Ended |
9 Months Ended |
|
Sep. 05, 2023 |
Sep. 30, 2023 |
Sep. 30, 2022 |
Sep. 30, 2023 |
Sep. 30, 2022 |
Dec. 31, 2022 |
| Share-Based Compensation Arrangement by Share-Based Payment Award [Line Items] |
|
|
|
|
|
|
| Stockholders' equity, reverse stock split |
1-for-16 reverse stock split
|
|
|
|
|
|
| Common stock, shares issued |
|
2,484,791
|
|
2,484,791
|
|
2,482,604
|
| Common stock, shares outstanding |
|
2,484,791
|
|
2,484,791
|
|
2,482,604
|
| Common stock, par value |
|
$ 0.01
|
|
$ 0.01
|
|
$ 0.01
|
| Number of options granted during period |
|
|
|
13,436
|
|
|
| Intrinsic value of options outstanding |
|
$ 46,000
|
|
$ 46,000
|
|
$ 16,000
|
| Intrinsic value of options exercisable |
|
38,000
|
|
38,000
|
|
|
| Compensation cost, non-vested awards not yet recognized |
|
17,000
|
$ 43,000
|
17,000
|
$ 43,000
|
|
| Selling, General and Administrative Expenses [Member] |
|
|
|
|
|
|
| Share-Based Compensation Arrangement by Share-Based Payment Award [Line Items] |
|
|
|
|
|
|
| Stock based compensation expense |
|
16,000
|
$ 16,000
|
46,000
|
$ 69,000
|
|
| Options Held [Member] |
|
|
|
|
|
|
| Share-Based Compensation Arrangement by Share-Based Payment Award [Line Items] |
|
|
|
|
|
|
| Intrinsic value of options outstanding |
|
38,000
|
|
38,000
|
|
|
| Intrinsic value of options exercisable |
|
$ 38,000
|
|
$ 38,000
|
|
|
| Share-Based Payment Arrangement, Employee [Member] |
|
|
|
|
|
|
| Share-Based Compensation Arrangement by Share-Based Payment Award [Line Items] |
|
|
|
|
|
|
| Number of options granted during period |
|
|
|
1,562
|
|
|
| Share-Based Payment Arrangement, Nonemployee [Member] |
|
|
|
|
|
|
| Share-Based Compensation Arrangement by Share-Based Payment Award [Line Items] |
|
|
|
|
|
|
| Number of options granted during period |
|
0
|
|
0
|
|
|
| Non-Employee Directors [Member] |
|
|
|
|
|
|
| Share-Based Compensation Arrangement by Share-Based Payment Award [Line Items] |
|
|
|
|
|
|
| Number of options granted during period |
|
0
|
|
13,436
|
|
|
| Director [Member] |
|
|
|
|
|
|
| Share-Based Compensation Arrangement by Share-Based Payment Award [Line Items] |
|
|
|
|
|
|
| Number of options granted during period |
|
|
|
3,437
|
|
|
| Chief Executive Officer [Member] |
|
|
|
|
|
|
| Share-Based Compensation Arrangement by Share-Based Payment Award [Line Items] |
|
|
|
|
|
|
| Number of options granted during period |
|
|
|
2,187
|
|
|
| Chief Financial Officer [Member] |
|
|
|
|
|
|
| Share-Based Compensation Arrangement by Share-Based Payment Award [Line Items] |
|
|
|
|
|
|
| Number of options granted during period |
|
|
|
6,250
|
|
|
| Amended and Restated 2006 Stock Incentive Plan [Member] |
|
|
|
|
|
|
| Share-Based Compensation Arrangement by Share-Based Payment Award [Line Items] |
|
|
|
|
|
|
| Number of options available for grant |
|
77,540
|
|
77,540
|
|
|
| X |
- DefinitionAmount of expense for award under share-based payment arrangement. Excludes amount capitalized. Reference 1: http://www.xbrl.org/2003/role/disclosureRef
-Topic 718
-SubTopic 10
-Name Accounting Standards Codification
-Section S99
-Paragraph 1
-Subparagraph (SAB Topic 14.F)
-Publisher FASB
-URI https://asc.fasb.org//1943274/2147479830/718-10-S99-1
Reference 2: http://www.xbrl.org/2003/role/disclosureRef
-Topic 718
-SubTopic 10
-Name Accounting Standards Codification
-Section 50
-Paragraph 2
-Subparagraph (h)(1)(i)
-Publisher FASB
-URI https://asc.fasb.org//1943274/2147480429/718-10-50-2
| Name: |
us-gaap_AllocatedShareBasedCompensationExpense |
| Namespace Prefix: |
us-gaap_ |
| Data Type: |
xbrli:monetaryItemType |
| Balance Type: |
debit |
| Period Type: |
duration |
|
| X |
- DefinitionFace amount or stated value per share of common stock. Reference 1: http://fasb.org/us-gaap/role/ref/legacyRef
-Topic 210
-SubTopic 10
-Name Accounting Standards Codification
-Section S99
-Paragraph 1
-Subparagraph (SX 210.5-02(29))
-Publisher FASB
-URI https://asc.fasb.org//1943274/2147480566/210-10-S99-1
| Name: |
us-gaap_CommonStockParOrStatedValuePerShare |
| Namespace Prefix: |
us-gaap_ |
| Data Type: |
dtr-types:perShareItemType |
| Balance Type: |
na |
| Period Type: |
instant |
|
| X |
- DefinitionTotal number of common shares of an entity that have been sold or granted to shareholders (includes common shares that were issued, repurchased and remain in the treasury). These shares represent capital invested by the firm's shareholders and owners, and may be all or only a portion of the number of shares authorized. Shares issued include shares outstanding and shares held in the treasury. Reference 1: http://fasb.org/us-gaap/role/ref/legacyRef
-Topic 210
-SubTopic 10
-Name Accounting Standards Codification
-Section S99
-Paragraph 1
-Subparagraph (SX 210.5-02(29))
-Publisher FASB
-URI https://asc.fasb.org//1943274/2147480566/210-10-S99-1
| Name: |
us-gaap_CommonStockSharesIssued |
| Namespace Prefix: |
us-gaap_ |
| Data Type: |
xbrli:sharesItemType |
| Balance Type: |
na |
| Period Type: |
instant |
|
| X |
- DefinitionNumber of shares of common stock outstanding. Common stock represent the ownership interest in a corporation. Reference 1: http://fasb.org/us-gaap/role/ref/legacyRef
-Name Accounting Standards Codification
-Section 50
-Paragraph 2
-SubTopic 10
-Topic 505
-Publisher FASB
-URI https://asc.fasb.org//1943274/2147481112/505-10-50-2
Reference 2: http://www.xbrl.org/2003/role/disclosureRef
-Topic 946
-SubTopic 210
-Name Accounting Standards Codification
-Section S99
-Paragraph 2
-Subparagraph (SX 210.6-05(4))
-Publisher FASB
-URI https://asc.fasb.org//1943274/2147479617/946-210-S99-2
Reference 3: http://www.xbrl.org/2009/role/commonPracticeRef
-Topic 946
-SubTopic 220
-Name Accounting Standards Codification
-Section S99
-Paragraph 3
-Subparagraph (SX 210.6-09(4)(b))
-Publisher FASB
-URI https://asc.fasb.org//1943274/2147483575/946-220-S99-3
Reference 4: http://www.xbrl.org/2003/role/disclosureRef
-Topic 946
-SubTopic 210
-Name Accounting Standards Codification
-Section S99
-Paragraph 1
-Subparagraph (SX 210.6-04(16)(a))
-Publisher FASB
-URI https://asc.fasb.org//1943274/2147479617/946-210-S99-1
Reference 5: http://www.xbrl.org/2009/role/commonPracticeRef
-Topic 946
-SubTopic 220
-Name Accounting Standards Codification
-Section S99
-Paragraph 3
-Subparagraph (SX 210.6-09(7))
-Publisher FASB
-URI https://asc.fasb.org//1943274/2147483575/946-220-S99-3
Reference 6: http://fasb.org/us-gaap/role/ref/legacyRef
-Topic 210
-SubTopic 10
-Name Accounting Standards Codification
-Section S99
-Paragraph 1
-Subparagraph (SX 210.5-02(29))
-Publisher FASB
-URI https://asc.fasb.org//1943274/2147480566/210-10-S99-1
| Name: |
us-gaap_CommonStockSharesOutstanding |
| Namespace Prefix: |
us-gaap_ |
| Data Type: |
xbrli:sharesItemType |
| Balance Type: |
na |
| Period Type: |
instant |
|
| X |
- DefinitionAmount of cost not yet recognized for nonvested award under share-based payment arrangement. Reference 1: http://www.xbrl.org/2003/role/disclosureRef
-Topic 718
-SubTopic 10
-Name Accounting Standards Codification
-Section 50
-Paragraph 2
-Subparagraph (i)
-Publisher FASB
-URI https://asc.fasb.org//1943274/2147480429/718-10-50-2
| Name: |
us-gaap_EmployeeServiceShareBasedCompensationNonvestedAwardsTotalCompensationCostNotYetRecognized |
| Namespace Prefix: |
us-gaap_ |
| Data Type: |
xbrli:monetaryItemType |
| Balance Type: |
debit |
| Period Type: |
instant |
|
| X |
- DefinitionLine items represent financial concepts included in a table. These concepts are used to disclose reportable information associated with domain members defined in one or many axes to the table. Reference 1: http://www.xbrl.org/2003/role/disclosureRef
-Topic 718
-SubTopic 10
-Name Accounting Standards Codification
-Section 35
-Paragraph 1D
-Publisher FASB
-URI https://asc.fasb.org//1943274/2147480483/718-10-35-1D
Reference 2: http://www.xbrl.org/2003/role/disclosureRef
-Topic 718
-SubTopic 10
-Name Accounting Standards Codification
-Section 35
-Paragraph 3
-Publisher FASB
-URI https://asc.fasb.org//1943274/2147480483/718-10-35-3
Reference 3: http://www.xbrl.org/2003/role/disclosureRef
-Topic 718
-SubTopic 10
-Name Accounting Standards Codification
-Section 50
-Paragraph 2
-Subparagraph (a)(1)
-Publisher FASB
-URI https://asc.fasb.org//1943274/2147480429/718-10-50-2
Reference 4: http://www.xbrl.org/2003/role/disclosureRef
-Topic 718
-SubTopic 10
-Name Accounting Standards Codification
-Section 50
-Paragraph 2
-Subparagraph (a)(2)
-Publisher FASB
-URI https://asc.fasb.org//1943274/2147480429/718-10-50-2
Reference 5: http://www.xbrl.org/2003/role/disclosureRef
-Topic 718
-SubTopic 10
-Name Accounting Standards Codification
-Section 50
-Paragraph 2
-Subparagraph (a)(3)
-Publisher FASB
-URI https://asc.fasb.org//1943274/2147480429/718-10-50-2
Reference 6: http://www.xbrl.org/2003/role/disclosureRef
-Topic 718
-SubTopic 10
-Name Accounting Standards Codification
-Section 50
-Paragraph 2
-Subparagraph (c)(1)(i)
-Publisher FASB
-URI https://asc.fasb.org//1943274/2147480429/718-10-50-2
Reference 7: http://www.xbrl.org/2003/role/disclosureRef
-Topic 718
-SubTopic 10
-Name Accounting Standards Codification
-Section 50
-Paragraph 2
-Subparagraph (c)(1)(ii)
-Publisher FASB
-URI https://asc.fasb.org//1943274/2147480429/718-10-50-2
Reference 8: http://www.xbrl.org/2003/role/disclosureRef
-Topic 718
-SubTopic 10
-Name Accounting Standards Codification
-Section 50
-Paragraph 2
-Subparagraph (c)(1)(iii)
-Publisher FASB
-URI https://asc.fasb.org//1943274/2147480429/718-10-50-2
Reference 9: http://www.xbrl.org/2003/role/disclosureRef
-Topic 718
-SubTopic 10
-Name Accounting Standards Codification
-Section 50
-Paragraph 2
-Subparagraph (c)(1)(iv)
-Publisher FASB
-URI https://asc.fasb.org//1943274/2147480429/718-10-50-2
Reference 10: http://www.xbrl.org/2003/role/disclosureRef
-Topic 718
-SubTopic 10
-Name Accounting Standards Codification
-Section 50
-Paragraph 2
-Subparagraph (c)(1)(iv)(01)
-Publisher FASB
-URI https://asc.fasb.org//1943274/2147480429/718-10-50-2
Reference 11: http://www.xbrl.org/2003/role/disclosureRef
-Topic 718
-SubTopic 10
-Name Accounting Standards Codification
-Section 50
-Paragraph 2
-Subparagraph (c)(1)(iv)(02)
-Publisher FASB
-URI https://asc.fasb.org//1943274/2147480429/718-10-50-2
Reference 12: http://www.xbrl.org/2003/role/disclosureRef
-Topic 718
-SubTopic 10
-Name Accounting Standards Codification
-Section 50
-Paragraph 2
-Subparagraph (c)(1)(iv)(03)
-Publisher FASB
-URI https://asc.fasb.org//1943274/2147480429/718-10-50-2
Reference 13: http://www.xbrl.org/2003/role/disclosureRef
-Topic 718
-SubTopic 10
-Name Accounting Standards Codification
-Section 50
-Paragraph 2
-Subparagraph (c)(1)(iv)(04)
-Publisher FASB
-URI https://asc.fasb.org//1943274/2147480429/718-10-50-2
Reference 14: http://www.xbrl.org/2003/role/disclosureRef
-Topic 718
-SubTopic 10
-Name Accounting Standards Codification
-Section 50
-Paragraph 2
-Subparagraph (c)(2)(i)
-Publisher FASB
-URI https://asc.fasb.org//1943274/2147480429/718-10-50-2
Reference 15: http://www.xbrl.org/2003/role/disclosureRef
-Topic 718
-SubTopic 10
-Name Accounting Standards Codification
-Section 50
-Paragraph 2
-Subparagraph (c)(2)(ii)
-Publisher FASB
-URI https://asc.fasb.org//1943274/2147480429/718-10-50-2
Reference 16: http://www.xbrl.org/2003/role/disclosureRef
-Topic 718
-SubTopic 10
-Name Accounting Standards Codification
-Section 50
-Paragraph 2
-Subparagraph (c)(2)(iii)
-Publisher FASB
-URI https://asc.fasb.org//1943274/2147480429/718-10-50-2
Reference 17: http://www.xbrl.org/2003/role/disclosureRef
-Topic 718
-SubTopic 10
-Name Accounting Standards Codification
-Section 50
-Paragraph 2
-Subparagraph (c)(2)(iii)(01)
-Publisher FASB
-URI https://asc.fasb.org//1943274/2147480429/718-10-50-2
Reference 18: http://www.xbrl.org/2003/role/disclosureRef
-Topic 718
-SubTopic 10
-Name Accounting Standards Codification
-Section 50
-Paragraph 2
-Subparagraph (c)(2)(iii)(02)
-Publisher FASB
-URI https://asc.fasb.org//1943274/2147480429/718-10-50-2
Reference 19: http://www.xbrl.org/2003/role/disclosureRef
-Topic 718
-SubTopic 10
-Name Accounting Standards Codification
-Section 50
-Paragraph 2
-Subparagraph (c)(2)(iii)(03)
-Publisher FASB
-URI https://asc.fasb.org//1943274/2147480429/718-10-50-2
Reference 20: http://www.xbrl.org/2003/role/disclosureRef
-Topic 718
-SubTopic 10
-Name Accounting Standards Codification
-Section 50
-Paragraph 2
-Subparagraph (d)(1)
-Publisher FASB
-URI https://asc.fasb.org//1943274/2147480429/718-10-50-2
Reference 21: http://www.xbrl.org/2003/role/disclosureRef
-Topic 718
-SubTopic 10
-Name Accounting Standards Codification
-Section 50
-Paragraph 2
-Subparagraph (d)(2)
-Publisher FASB
-URI https://asc.fasb.org//1943274/2147480429/718-10-50-2
Reference 22: http://www.xbrl.org/2003/role/disclosureRef
-Topic 718
-SubTopic 10
-Name Accounting Standards Codification
-Section 50
-Paragraph 2
-Subparagraph (e)(1)
-Publisher FASB
-URI https://asc.fasb.org//1943274/2147480429/718-10-50-2
Reference 23: http://www.xbrl.org/2003/role/disclosureRef
-Topic 718
-SubTopic 10
-Name Accounting Standards Codification
-Section 50
-Paragraph 2
-Subparagraph (e)(2)
-Publisher FASB
-URI https://asc.fasb.org//1943274/2147480429/718-10-50-2
Reference 24: http://www.xbrl.org/2003/role/disclosureRef
-Topic 718
-SubTopic 10
-Name Accounting Standards Codification
-Section 50
-Paragraph 2
-Subparagraph (f)(2)(i)
-Publisher FASB
-URI https://asc.fasb.org//1943274/2147480429/718-10-50-2
Reference 25: http://www.xbrl.org/2003/role/disclosureRef
-Topic 718
-SubTopic 10
-Name Accounting Standards Codification
-Section 50
-Paragraph 2
-Subparagraph (f)(2)(ii)
-Publisher FASB
-URI https://asc.fasb.org//1943274/2147480429/718-10-50-2
Reference 26: http://www.xbrl.org/2003/role/disclosureRef
-Topic 718
-SubTopic 10
-Name Accounting Standards Codification
-Section 50
-Paragraph 2
-Subparagraph (f)(2)(iii)
-Publisher FASB
-URI https://asc.fasb.org//1943274/2147480429/718-10-50-2
Reference 27: http://www.xbrl.org/2003/role/disclosureRef
-Topic 718
-SubTopic 10
-Name Accounting Standards Codification
-Section 50
-Paragraph 2
-Subparagraph (f)(2)(iv)
-Publisher FASB
-URI https://asc.fasb.org//1943274/2147480429/718-10-50-2
Reference 28: http://www.xbrl.org/2003/role/disclosureRef
-Topic 718
-SubTopic 10
-Name Accounting Standards Codification
-Section 50
-Paragraph 2
-Subparagraph (f)(2)(v)
-Publisher FASB
-URI https://asc.fasb.org//1943274/2147480429/718-10-50-2
| Name: |
us-gaap_ShareBasedCompensationArrangementByShareBasedPaymentAwardLineItems |
| Namespace Prefix: |
us-gaap_ |
| Data Type: |
xbrli:stringItemType |
| Balance Type: |
na |
| Period Type: |
duration |
|
| X |
- DefinitionThe difference between the maximum number of shares (or other type of equity) authorized for issuance under the plan (including the effects of amendments and adjustments), and the sum of: 1) the number of shares (or other type of equity) already issued upon exercise of options or other equity-based awards under the plan; and 2) shares (or other type of equity) reserved for issuance on granting of outstanding awards, net of cancellations and forfeitures, if applicable. Reference 1: http://fasb.org/us-gaap/role/ref/legacyRef
-Name Accounting Standards Codification
-Topic 718
-SubTopic 10
-Section 50
-Paragraph 2
-Publisher FASB
-URI https://asc.fasb.org//1943274/2147480429/718-10-50-2
| Name: |
us-gaap_ShareBasedCompensationArrangementByShareBasedPaymentAwardNumberOfSharesAvailableForGrant |
| Namespace Prefix: |
us-gaap_ |
| Data Type: |
xbrli:sharesItemType |
| Balance Type: |
na |
| Period Type: |
instant |
|
| X |
- DefinitionGross number of share options (or share units) granted during the period. Reference 1: http://www.xbrl.org/2003/role/disclosureRef
-Topic 718
-SubTopic 10
-Name Accounting Standards Codification
-Section 50
-Paragraph 2
-Subparagraph (c)(1)(iv)(01)
-Publisher FASB
-URI https://asc.fasb.org//1943274/2147480429/718-10-50-2
| Name: |
us-gaap_ShareBasedCompensationArrangementByShareBasedPaymentAwardOptionsGrantsInPeriodGross |
| Namespace Prefix: |
us-gaap_ |
| Data Type: |
xbrli:sharesItemType |
| Balance Type: |
na |
| Period Type: |
duration |
|
| X |
- DefinitionAmount by which the current fair value of the underlying stock exceeds the exercise price of options outstanding. Reference 1: http://fasb.org/us-gaap/role/ref/legacyRef
-Name Accounting Standards Codification
-Topic 718
-SubTopic 10
-Section 50
-Paragraph 2
-Publisher FASB
-URI https://asc.fasb.org//1943274/2147480429/718-10-50-2
| Name: |
us-gaap_ShareBasedCompensationArrangementByShareBasedPaymentAwardOptionsOutstandingIntrinsicValue |
| Namespace Prefix: |
us-gaap_ |
| Data Type: |
xbrli:monetaryItemType |
| Balance Type: |
debit |
| Period Type: |
instant |
|
| X |
- DefinitionAmount of difference between fair value of the underlying shares reserved for issuance and exercise price of vested portions of options outstanding and currently exercisable. Reference 1: http://fasb.org/us-gaap/role/ref/legacyRef
-Name Accounting Standards Codification
-Topic 718
-SubTopic 10
-Section 50
-Paragraph 2
-Publisher FASB
-URI https://asc.fasb.org//1943274/2147480429/718-10-50-2
| Name: |
us-gaap_SharebasedCompensationArrangementBySharebasedPaymentAwardOptionsExercisableIntrinsicValue1 |
| Namespace Prefix: |
us-gaap_ |
| Data Type: |
xbrli:monetaryItemType |
| Balance Type: |
debit |
| Period Type: |
instant |
|
| X |
- DefinitionDescription of the reverse stock split arrangement. Also provide the retroactive effect given by the reverse split that occurs after the balance sheet date but before the release of financial statements. Reference 1: http://fasb.org/us-gaap/role/ref/legacyRef
-Topic 505
-SubTopic 10
-Name Accounting Standards Codification
-Section S99
-Paragraph 4
-Subparagraph (SAB Topic 4.C)
-Publisher FASB
-URI https://asc.fasb.org//1943274/2147480008/505-10-S99-4
| Name: |
us-gaap_StockholdersEquityReverseStockSplit |
| Namespace Prefix: |
us-gaap_ |
| Data Type: |
xbrli:stringItemType |
| Balance Type: |
na |
| Period Type: |
duration |
|
| X |
- Details
| Name: |
us-gaap_IncomeStatementLocationAxis=us-gaap_SellingGeneralAndAdministrativeExpensesMember |
| Namespace Prefix: |
|
| Data Type: |
na |
| Balance Type: |
|
| Period Type: |
|
|
| X |
- Details
| Name: |
us-gaap_FinancialInstrumentAxis=us-gaap_OptionMember |
| Namespace Prefix: |
|
| Data Type: |
na |
| Balance Type: |
|
| Period Type: |
|
|
| X |
- Details
| Name: |
us-gaap_GranteeStatusAxis=us-gaap_ShareBasedPaymentArrangementEmployeeMember |
| Namespace Prefix: |
|
| Data Type: |
na |
| Balance Type: |
|
| Period Type: |
|
|
| X |
- Details
| Name: |
us-gaap_GranteeStatusAxis=us-gaap_ShareBasedPaymentArrangementNonemployeeMember |
| Namespace Prefix: |
|
| Data Type: |
na |
| Balance Type: |
|
| Period Type: |
|
|
| X |
- Details
| Name: |
srt_TitleOfIndividualAxis=ACFN_NonEmployeeDirectorsMember |
| Namespace Prefix: |
|
| Data Type: |
na |
| Balance Type: |
|
| Period Type: |
|
|
| X |
- Details
| Name: |
srt_TitleOfIndividualAxis=srt_DirectorMember |
| Namespace Prefix: |
|
| Data Type: |
na |
| Balance Type: |
|
| Period Type: |
|
|
| X |
- Details
| Name: |
srt_TitleOfIndividualAxis=srt_ChiefExecutiveOfficerMember |
| Namespace Prefix: |
|
| Data Type: |
na |
| Balance Type: |
|
| Period Type: |
|
|
| X |
- Details
| Name: |
srt_TitleOfIndividualAxis=srt_ChiefFinancialOfficerMember |
| Namespace Prefix: |
|
| Data Type: |
na |
| Balance Type: |
|
| Period Type: |
|
|
| X |
- Details
| Name: |
us-gaap_PlanNameAxis=ACFN_AmendedAndRestatedTwoThousandSixStockincentivePlanMember |
| Namespace Prefix: |
|
| Data Type: |
na |
| Balance Type: |
|
| Period Type: |
|
|
v3.23.3
SUMMARY OF SEGMENTED DATA (Details) - USD ($)
$ in Thousands |
3 Months Ended |
9 Months Ended |
Sep. 30, 2023 |
Sep. 30, 2022 |
Sep. 30, 2023 |
Sep. 30, 2022 |
| Segment Reporting Information [Line Items] |
|
|
|
|
|
| Revenue from external customers |
$ 2,087
|
$ 1,783
|
$ 5,809
|
$ 5,155
|
|
| Segment gross profit |
1,550
|
1,215
|
4,356
|
3,719
|
|
| Depreciation and amortization |
41
|
36
|
115
|
85
|
|
| Segment income (loss) before income taxes |
366
|
20
|
856
|
237
|
[1] |
| PG [Member] |
|
|
|
|
|
| Segment Reporting Information [Line Items] |
|
|
|
|
|
| Revenue from external customers |
1,798
|
1,510
|
4,994
|
4,335
|
|
| Segment gross profit |
1,381
|
1,092
|
3,876
|
3,256
|
|
| Depreciation and amortization |
36
|
31
|
99
|
72
|
|
| Segment income (loss) before income taxes |
361
|
78
|
891
|
340
|
[1] |
| CP [Member] |
|
|
|
|
|
| Segment Reporting Information [Line Items] |
|
|
|
|
|
| Revenue from external customers |
289
|
273
|
815
|
820
|
|
| Segment gross profit |
169
|
123
|
480
|
463
|
|
| Depreciation and amortization |
5
|
5
|
16
|
13
|
|
| Segment income (loss) before income taxes |
$ 5
|
$ (58)
|
$ (35)
|
$ (103)
|
[1] |
|
|
| X |
- DefinitionThe aggregate expense recognized in the current period that allocates the cost of tangible assets, intangible assets, or depleting assets to periods that benefit from use of the assets. Reference 1: http://fasb.org/us-gaap/role/ref/legacyRef
-Name Accounting Standards Codification
-Section 45
-Paragraph 28
-Subparagraph (b)
-SubTopic 10
-Topic 230
-Publisher FASB
-URI https://asc.fasb.org//1943274/2147482740/230-10-45-28
Reference 2: http://www.xbrl.org/2003/role/disclosureRef
-Topic 280
-SubTopic 10
-Name Accounting Standards Codification
-Section 50
-Paragraph 22
-Subparagraph (e)
-Publisher FASB
-URI https://asc.fasb.org//1943274/2147482810/280-10-50-22
| Name: |
us-gaap_DepreciationDepletionAndAmortization |
| Namespace Prefix: |
us-gaap_ |
| Data Type: |
xbrli:monetaryItemType |
| Balance Type: |
debit |
| Period Type: |
duration |
|
| X |
- DefinitionAggregate revenue less cost of goods and services sold or operating expenses directly attributable to the revenue generation activity. Reference 1: http://www.xbrl.org/2003/role/disclosureRef
-Topic 235
-SubTopic 10
-Name Accounting Standards Codification
-Section S99
-Paragraph 1
-Subparagraph (SX 210.4-08(g)(1)(ii))
-Publisher FASB
-URI https://asc.fasb.org//1943274/2147480678/235-10-S99-1
Reference 2: http://www.xbrl.org/2003/role/disclosureRef
-Topic 323
-SubTopic 10
-Name Accounting Standards Codification
-Section 50
-Paragraph 3
-Subparagraph (c)
-Publisher FASB
-URI https://asc.fasb.org//1943274/2147481687/323-10-50-3
Reference 3: http://www.xbrl.org/2003/role/disclosureRef
-Topic 825
-SubTopic 10
-Name Accounting Standards Codification
-Section 50
-Paragraph 28
-Subparagraph (f)
-Publisher FASB
-URI https://asc.fasb.org//1943274/2147482907/825-10-50-28
Reference 4: http://www.xbrl.org/2003/role/disclosureRef
-Topic 280
-SubTopic 10
-Name Accounting Standards Codification
-Section 50
-Paragraph 22
-Publisher FASB
-URI https://asc.fasb.org//1943274/2147482810/280-10-50-22
Reference 5: http://www.xbrl.org/2003/role/disclosureRef
-Topic 470
-SubTopic 10
-Name Accounting Standards Codification
-Section S99
-Paragraph 1A
-Subparagraph (SX 210.13-01(a)(4)(i))
-Publisher FASB
-URI https://asc.fasb.org//1943274/2147480097/470-10-S99-1A
Reference 6: http://www.xbrl.org/2009/role/commonPracticeRef
-Topic 470
-SubTopic 10
-Name Accounting Standards Codification
-Section S99
-Paragraph 1A
-Subparagraph (SX 210.13-01(a)(4)(ii))
-Publisher FASB
-URI https://asc.fasb.org//1943274/2147480097/470-10-S99-1A
Reference 7: http://www.xbrl.org/2003/role/disclosureRef
-Topic 470
-SubTopic 10
-Name Accounting Standards Codification
-Section S99
-Paragraph 1A
-Subparagraph (SX 210.13-01(a)(4)(iii)(A))
-Publisher FASB
-URI https://asc.fasb.org//1943274/2147480097/470-10-S99-1A
Reference 8: http://www.xbrl.org/2003/role/disclosureRef
-Topic 470
-SubTopic 10
-Name Accounting Standards Codification
-Section S99
-Paragraph 1A
-Subparagraph (SX 210.13-01(a)(4)(iv))
-Publisher FASB
-URI https://asc.fasb.org//1943274/2147480097/470-10-S99-1A
Reference 9: http://www.xbrl.org/2003/role/disclosureRef
-Topic 470
-SubTopic 10
-Name Accounting Standards Codification
-Section S99
-Paragraph 1A
-Subparagraph (SX 210.13-01(a)(5))
-Publisher FASB
-URI https://asc.fasb.org//1943274/2147480097/470-10-S99-1A
Reference 10: http://www.xbrl.org/2003/role/disclosureRef
-Topic 470
-SubTopic 10
-Name Accounting Standards Codification
-Section S99
-Paragraph 1B
-Subparagraph (SX 210.13-02(a)(4)(i))
-Publisher FASB
-URI https://asc.fasb.org//1943274/2147480097/470-10-S99-1B
Reference 11: http://www.xbrl.org/2003/role/disclosureRef
-Topic 470
-SubTopic 10
-Name Accounting Standards Codification
-Section S99
-Paragraph 1B
-Subparagraph (SX 210.13-02(a)(4)(iii)(A))
-Publisher FASB
-URI https://asc.fasb.org//1943274/2147480097/470-10-S99-1B
Reference 12: http://www.xbrl.org/2003/role/disclosureRef
-Topic 470
-SubTopic 10
-Name Accounting Standards Codification
-Section S99
-Paragraph 1B
-Subparagraph (SX 210.13-02(a)(4)(iii)(B))
-Publisher FASB
-URI https://asc.fasb.org//1943274/2147480097/470-10-S99-1B
Reference 13: http://www.xbrl.org/2003/role/disclosureRef
-Topic 470
-SubTopic 10
-Name Accounting Standards Codification
-Section S99
-Paragraph 1B
-Subparagraph (SX 210.13-02(a)(4)(iv))
-Publisher FASB
-URI https://asc.fasb.org//1943274/2147480097/470-10-S99-1B
Reference 14: http://www.xbrl.org/2003/role/disclosureRef
-Topic 470
-SubTopic 10
-Name Accounting Standards Codification
-Section S99
-Paragraph 1B
-Subparagraph (SX 210.13-02(a)(5))
-Publisher FASB
-URI https://asc.fasb.org//1943274/2147480097/470-10-S99-1B
Reference 15: http://www.xbrl.org/2003/role/disclosureRef
-Topic 280
-SubTopic 10
-Name Accounting Standards Codification
-Section 50
-Paragraph 30
-Subparagraph (b)
-Publisher FASB
-URI https://asc.fasb.org//1943274/2147482810/280-10-50-30
Reference 16: http://www.xbrl.org/2003/role/disclosureRef
-Topic 280
-SubTopic 10
-Name Accounting Standards Codification
-Section 50
-Paragraph 32
-Subparagraph (f)
-Publisher FASB
-URI https://asc.fasb.org//1943274/2147482810/280-10-50-32
Reference 17: http://www.xbrl.org/2003/role/exampleRef
-Topic 280
-SubTopic 10
-Name Accounting Standards Codification
-Section 50
-Paragraph 31
-Publisher FASB
-URI https://asc.fasb.org//1943274/2147482810/280-10-50-31
Reference 18: http://www.xbrl.org/2003/role/disclosureRef
-Topic 280
-SubTopic 10
-Name Accounting Standards Codification
-Section 50
-Paragraph 32
-Subparagraph (c)
-Publisher FASB
-URI https://asc.fasb.org//1943274/2147482810/280-10-50-32
Reference 19: http://fasb.org/us-gaap/role/ref/legacyRef
-Topic 220
-SubTopic 10
-Name Accounting Standards Codification
-Section S99
-Paragraph 2
-Subparagraph (SX 210.5-03.1,2)
-Publisher FASB
-URI https://asc.fasb.org//1943274/2147483621/220-10-S99-2
| Name: |
us-gaap_GrossProfit |
| Namespace Prefix: |
us-gaap_ |
| Data Type: |
xbrli:monetaryItemType |
| Balance Type: |
credit |
| Period Type: |
duration |
|
| X |
- DefinitionAmount, excluding tax collected from customer, of revenue from satisfaction of performance obligation by transferring promised good or service to customer. Tax collected from customer is tax assessed by governmental authority that is both imposed on and concurrent with specific revenue-producing transaction, including, but not limited to, sales, use, value added and excise. Reference 1: http://www.xbrl.org/2003/role/disclosureRef
-Topic 924
-SubTopic 10
-Name Accounting Standards Codification
-Section S99
-Paragraph 1
-Subparagraph (SAB Topic 11.L)
-Publisher FASB
-URI https://asc.fasb.org//1943274/2147479941/924-10-S99-1
Reference 2: http://www.xbrl.org/2003/role/disclosureRef
-Topic 606
-SubTopic 10
-Name Accounting Standards Codification
-Section 50
-Paragraph 5
-Publisher FASB
-URI https://asc.fasb.org//1943274/2147479806/606-10-50-5
Reference 3: http://www.xbrl.org/2003/role/disclosureRef
-Topic 280
-SubTopic 10
-Name Accounting Standards Codification
-Section 50
-Paragraph 30
-Subparagraph (a)
-Publisher FASB
-URI https://asc.fasb.org//1943274/2147482810/280-10-50-30
Reference 4: http://www.xbrl.org/2003/role/disclosureRef
-Topic 280
-SubTopic 10
-Name Accounting Standards Codification
-Section 50
-Paragraph 42
-Publisher FASB
-URI https://asc.fasb.org//1943274/2147482810/280-10-50-42
Reference 5: http://www.xbrl.org/2003/role/disclosureRef
-Topic 280
-SubTopic 10
-Name Accounting Standards Codification
-Section 50
-Paragraph 22
-Subparagraph (b)
-Publisher FASB
-URI https://asc.fasb.org//1943274/2147482810/280-10-50-22
Reference 6: http://www.xbrl.org/2003/role/disclosureRef
-Topic 280
-SubTopic 10
-Name Accounting Standards Codification
-Section 50
-Paragraph 32
-Subparagraph (b)
-Publisher FASB
-URI https://asc.fasb.org//1943274/2147482810/280-10-50-32
Reference 7: http://www.xbrl.org/2003/role/disclosureRef
-Topic 280
-SubTopic 10
-Name Accounting Standards Codification
-Section 50
-Paragraph 40
-Publisher FASB
-URI https://asc.fasb.org//1943274/2147482810/280-10-50-40
Reference 8: http://www.xbrl.org/2003/role/disclosureRef
-Topic 280
-SubTopic 10
-Name Accounting Standards Codification
-Section 50
-Paragraph 22
-Subparagraph (a)
-Publisher FASB
-URI https://asc.fasb.org//1943274/2147482810/280-10-50-22
Reference 9: http://www.xbrl.org/2003/role/disclosureRef
-Topic 280
-SubTopic 10
-Name Accounting Standards Codification
-Section 50
-Paragraph 32
-Subparagraph (a)
-Publisher FASB
-URI https://asc.fasb.org//1943274/2147482810/280-10-50-32
Reference 10: http://www.xbrl.org/2003/role/disclosureRef
-Topic 280
-SubTopic 10
-Name Accounting Standards Codification
-Section 50
-Paragraph 41
-Subparagraph (a)
-Publisher FASB
-URI https://asc.fasb.org//1943274/2147482810/280-10-50-41
Reference 11: http://www.xbrl.org/2003/role/disclosureRef
-Topic 606
-SubTopic 10
-Name Accounting Standards Codification
-Section 50
-Paragraph 4
-Subparagraph (a)
-Publisher FASB
-URI https://asc.fasb.org//1943274/2147479806/606-10-50-4
| Name: |
us-gaap_RevenueFromContractWithCustomerExcludingAssessedTax |
| Namespace Prefix: |
us-gaap_ |
| Data Type: |
xbrli:monetaryItemType |
| Balance Type: |
credit |
| Period Type: |
duration |
|
| X |
- Details
| Name: |
us-gaap_StatementBusinessSegmentsAxis=ACFN_PGMember |
| Namespace Prefix: |
|
| Data Type: |
na |
| Balance Type: |
|
| Period Type: |
|
|
| X |
- Details
| Name: |
us-gaap_StatementBusinessSegmentsAxis=ACFN_CPMember |
| Namespace Prefix: |
|
| Data Type: |
na |
| Balance Type: |
|
| Period Type: |
|
|
v3.23.3
| X |
- DefinitionAmount of write-down of assets recognized in the income statement. Includes, but is not limited to, losses from tangible assets, intangible assets and goodwill. Reference 1: http://fasb.org/us-gaap/role/ref/legacyRef
-Name Accounting Standards Codification
-Section 45
-Paragraph 28
-Subparagraph (b)
-SubTopic 10
-Topic 230
-Publisher FASB
-URI https://asc.fasb.org//1943274/2147482740/230-10-45-28
Reference 2: http://fasb.org/us-gaap/role/ref/legacyRef
-Name Accounting Standards Codification
-Topic 360
-SubTopic 10
-Section 45
-Paragraph 4
-Publisher FASB
-URI https://asc.fasb.org//1943274/2147482130/360-10-45-4
| Name: |
us-gaap_AssetImpairmentCharges |
| Namespace Prefix: |
us-gaap_ |
| Data Type: |
xbrli:monetaryItemType |
| Balance Type: |
debit |
| Period Type: |
duration |
|
| X |
- DefinitionLine items represent financial concepts included in a table. These concepts are used to disclose reportable information associated with domain members defined in one or many axes to the table.
| Name: |
us-gaap_PropertyPlantAndEquipmentLineItems |
| Namespace Prefix: |
us-gaap_ |
| Data Type: |
xbrli:stringItemType |
| Balance Type: |
na |
| Period Type: |
duration |
|
| X |
- Details
| Name: |
us-gaap_PropertyPlantAndEquipmentByTypeAxis=ACFN_SoftwareMember |
| Namespace Prefix: |
|
| Data Type: |
na |
| Balance Type: |
|
| Period Type: |
|
|
v3.23.3
| X |
- DefinitionUnallocated cost of corporate headquarters.
| Name: |
ACFN_UnallocatedCostOfCorporateHeadquarters |
| Namespace Prefix: |
ACFN_ |
| Data Type: |
xbrli:monetaryItemType |
| Balance Type: |
debit |
| Period Type: |
duration |
|
| X |
- DefinitionUnallocated software impairment.
| Name: |
ACFN_UnallocatedSoftwareImpairment |
| Namespace Prefix: |
ACFN_ |
| Data Type: |
xbrli:monetaryItemType |
| Balance Type: |
debit |
| Period Type: |
duration |
|
| X |
- References
+ Details
| Name: |
us-gaap_SegmentReportingAbstract |
| Namespace Prefix: |
us-gaap_ |
| Data Type: |
xbrli:stringItemType |
| Balance Type: |
na |
| Period Type: |
duration |
|
v3.23.3
SCHEDULE OF DISAGGREGATES OF REVENUE (Details) - USD ($)
$ in Thousands |
3 Months Ended |
9 Months Ended |
Sep. 30, 2023 |
Sep. 30, 2022 |
Sep. 30, 2023 |
Sep. 30, 2022 |
| Disaggregation of Revenue [Line Items] |
|
|
|
|
| Total Revenue |
$ 2,087
|
$ 1,783
|
$ 5,809
|
$ 5,155
|
| PG [Member] |
|
|
|
|
| Disaggregation of Revenue [Line Items] |
|
|
|
|
| Total Revenue |
1,798
|
1,510
|
4,994
|
4,335
|
| CP [Member] |
|
|
|
|
| Disaggregation of Revenue [Line Items] |
|
|
|
|
| Total Revenue |
289
|
273
|
815
|
820
|
| Hardware [Member] |
|
|
|
|
| Disaggregation of Revenue [Line Items] |
|
|
|
|
| Total Revenue |
1,004
|
825
|
2,637
|
2,241
|
| Hardware [Member] | PG [Member] |
|
|
|
|
| Disaggregation of Revenue [Line Items] |
|
|
|
|
| Total Revenue |
780
|
608
|
2,017
|
1,610
|
| Hardware [Member] | CP [Member] |
|
|
|
|
| Disaggregation of Revenue [Line Items] |
|
|
|
|
| Total Revenue |
224
|
217
|
620
|
631
|
| Monitoring [Member] |
|
|
|
|
| Disaggregation of Revenue [Line Items] |
|
|
|
|
| Total Revenue |
1,083
|
958
|
3,172
|
2,914
|
| Monitoring [Member] | PG [Member] |
|
|
|
|
| Disaggregation of Revenue [Line Items] |
|
|
|
|
| Total Revenue |
1,018
|
902
|
2,977
|
2,725
|
| Monitoring [Member] | CP [Member] |
|
|
|
|
| Disaggregation of Revenue [Line Items] |
|
|
|
|
| Total Revenue |
$ 65
|
$ 56
|
$ 195
|
$ 189
|
| X |
- DefinitionLine items represent financial concepts included in a table. These concepts are used to disclose reportable information associated with domain members defined in one or many axes to the table. Reference 1: http://www.xbrl.org/2003/role/disclosureRef
-Topic 606
-SubTopic 10
-Name Accounting Standards Codification
-Section 50
-Paragraph 5
-Publisher FASB
-URI https://asc.fasb.org//1943274/2147479806/606-10-50-5
Reference 2: http://www.xbrl.org/2003/role/exampleRef
-Topic 606
-SubTopic 10
-Name Accounting Standards Codification
-Section 55
-Paragraph 91
-Subparagraph (a)
-Publisher FASB
-URI https://asc.fasb.org//1943274/2147479777/606-10-55-91
Reference 3: http://www.xbrl.org/2003/role/exampleRef
-Topic 606
-SubTopic 10
-Name Accounting Standards Codification
-Section 55
-Paragraph 91
-Subparagraph (b)
-Publisher FASB
-URI https://asc.fasb.org//1943274/2147479777/606-10-55-91
Reference 4: http://www.xbrl.org/2003/role/exampleRef
-Topic 606
-SubTopic 10
-Name Accounting Standards Codification
-Section 55
-Paragraph 91
-Subparagraph (c)
-Publisher FASB
-URI https://asc.fasb.org//1943274/2147479777/606-10-55-91
Reference 5: http://www.xbrl.org/2003/role/exampleRef
-Topic 606
-SubTopic 10
-Name Accounting Standards Codification
-Section 55
-Paragraph 91
-Subparagraph (d)
-Publisher FASB
-URI https://asc.fasb.org//1943274/2147479777/606-10-55-91
Reference 6: http://www.xbrl.org/2003/role/exampleRef
-Topic 606
-SubTopic 10
-Name Accounting Standards Codification
-Section 55
-Paragraph 91
-Subparagraph (e)
-Publisher FASB
-URI https://asc.fasb.org//1943274/2147479777/606-10-55-91
Reference 7: http://www.xbrl.org/2003/role/exampleRef
-Topic 606
-SubTopic 10
-Name Accounting Standards Codification
-Section 55
-Paragraph 91
-Subparagraph (f)
-Publisher FASB
-URI https://asc.fasb.org//1943274/2147479777/606-10-55-91
Reference 8: http://www.xbrl.org/2003/role/exampleRef
-Topic 606
-SubTopic 10
-Name Accounting Standards Codification
-Section 55
-Paragraph 91
-Subparagraph (g)
-Publisher FASB
-URI https://asc.fasb.org//1943274/2147479777/606-10-55-91
| Name: |
us-gaap_DisaggregationOfRevenueLineItems |
| Namespace Prefix: |
us-gaap_ |
| Data Type: |
xbrli:stringItemType |
| Balance Type: |
na |
| Period Type: |
duration |
|
| X |
- DefinitionAmount, excluding tax collected from customer, of revenue from satisfaction of performance obligation by transferring promised good or service to customer. Tax collected from customer is tax assessed by governmental authority that is both imposed on and concurrent with specific revenue-producing transaction, including, but not limited to, sales, use, value added and excise. Reference 1: http://www.xbrl.org/2003/role/disclosureRef
-Topic 924
-SubTopic 10
-Name Accounting Standards Codification
-Section S99
-Paragraph 1
-Subparagraph (SAB Topic 11.L)
-Publisher FASB
-URI https://asc.fasb.org//1943274/2147479941/924-10-S99-1
Reference 2: http://www.xbrl.org/2003/role/disclosureRef
-Topic 606
-SubTopic 10
-Name Accounting Standards Codification
-Section 50
-Paragraph 5
-Publisher FASB
-URI https://asc.fasb.org//1943274/2147479806/606-10-50-5
Reference 3: http://www.xbrl.org/2003/role/disclosureRef
-Topic 280
-SubTopic 10
-Name Accounting Standards Codification
-Section 50
-Paragraph 30
-Subparagraph (a)
-Publisher FASB
-URI https://asc.fasb.org//1943274/2147482810/280-10-50-30
Reference 4: http://www.xbrl.org/2003/role/disclosureRef
-Topic 280
-SubTopic 10
-Name Accounting Standards Codification
-Section 50
-Paragraph 42
-Publisher FASB
-URI https://asc.fasb.org//1943274/2147482810/280-10-50-42
Reference 5: http://www.xbrl.org/2003/role/disclosureRef
-Topic 280
-SubTopic 10
-Name Accounting Standards Codification
-Section 50
-Paragraph 22
-Subparagraph (b)
-Publisher FASB
-URI https://asc.fasb.org//1943274/2147482810/280-10-50-22
Reference 6: http://www.xbrl.org/2003/role/disclosureRef
-Topic 280
-SubTopic 10
-Name Accounting Standards Codification
-Section 50
-Paragraph 32
-Subparagraph (b)
-Publisher FASB
-URI https://asc.fasb.org//1943274/2147482810/280-10-50-32
Reference 7: http://www.xbrl.org/2003/role/disclosureRef
-Topic 280
-SubTopic 10
-Name Accounting Standards Codification
-Section 50
-Paragraph 40
-Publisher FASB
-URI https://asc.fasb.org//1943274/2147482810/280-10-50-40
Reference 8: http://www.xbrl.org/2003/role/disclosureRef
-Topic 280
-SubTopic 10
-Name Accounting Standards Codification
-Section 50
-Paragraph 22
-Subparagraph (a)
-Publisher FASB
-URI https://asc.fasb.org//1943274/2147482810/280-10-50-22
Reference 9: http://www.xbrl.org/2003/role/disclosureRef
-Topic 280
-SubTopic 10
-Name Accounting Standards Codification
-Section 50
-Paragraph 32
-Subparagraph (a)
-Publisher FASB
-URI https://asc.fasb.org//1943274/2147482810/280-10-50-32
Reference 10: http://www.xbrl.org/2003/role/disclosureRef
-Topic 280
-SubTopic 10
-Name Accounting Standards Codification
-Section 50
-Paragraph 41
-Subparagraph (a)
-Publisher FASB
-URI https://asc.fasb.org//1943274/2147482810/280-10-50-41
Reference 11: http://www.xbrl.org/2003/role/disclosureRef
-Topic 606
-SubTopic 10
-Name Accounting Standards Codification
-Section 50
-Paragraph 4
-Subparagraph (a)
-Publisher FASB
-URI https://asc.fasb.org//1943274/2147479806/606-10-50-4
| Name: |
us-gaap_RevenueFromContractWithCustomerExcludingAssessedTax |
| Namespace Prefix: |
us-gaap_ |
| Data Type: |
xbrli:monetaryItemType |
| Balance Type: |
credit |
| Period Type: |
duration |
|
| X |
- Details
| Name: |
us-gaap_StatementBusinessSegmentsAxis=ACFN_PGMember |
| Namespace Prefix: |
|
| Data Type: |
na |
| Balance Type: |
|
| Period Type: |
|
|
| X |
- Details
| Name: |
us-gaap_StatementBusinessSegmentsAxis=ACFN_CPMember |
| Namespace Prefix: |
|
| Data Type: |
na |
| Balance Type: |
|
| Period Type: |
|
|
| X |
- Details
| Name: |
srt_ProductOrServiceAxis=ACFN_HardwareMember |
| Namespace Prefix: |
|
| Data Type: |
na |
| Balance Type: |
|
| Period Type: |
|
|
| X |
- Details
| Name: |
srt_ProductOrServiceAxis=ACFN_MonitoringMember |
| Namespace Prefix: |
|
| Data Type: |
na |
| Balance Type: |
|
| Period Type: |
|
|
v3.23.3
SCHEDULE OF DEFERRED REVENUE ACTIVITY (Details)
$ in Thousands |
9 Months Ended |
|
Sep. 30, 2023
USD ($)
|
|---|
| Disaggregation of Revenue [Line Items] |
|
| Balance at December 31, 2022 |
$ 6,171
|
| Additions during the period |
5,033
|
| Recognized as revenue |
(4,993)
|
| Balance at September 30, 2023 |
6,211
|
| September 30, 2024 |
4,270
|
| September 30, 2025 |
1,612
|
| September 30, 2026 and thereafter |
329
|
| Total |
6,211
|
| Hardware [Member] |
|
| Disaggregation of Revenue [Line Items] |
|
| Balance at December 31, 2022 |
3,751
|
| Additions during the period |
1,597
|
| Recognized as revenue |
(1,821)
|
| Balance at September 30, 2023 |
3,527
|
| September 30, 2024 |
2,023
|
| September 30, 2025 |
1,179
|
| September 30, 2026 and thereafter |
325
|
| Total |
3,527
|
| Monitoring [Member] |
|
| Disaggregation of Revenue [Line Items] |
|
| Balance at December 31, 2022 |
2,420
|
| Additions during the period |
3,436
|
| Recognized as revenue |
(3,172)
|
| Balance at September 30, 2023 |
2,684
|
| September 30, 2024 |
2,247
|
| September 30, 2025 |
433
|
| September 30, 2026 and thereafter |
4
|
| Total |
$ 2,684
|
| X |
- DefinitionContract with customer liability additions.
| Name: |
ACFN_ContractWithCustomerLiabilityAdditions |
| Namespace Prefix: |
ACFN_ |
| Data Type: |
xbrli:monetaryItemType |
| Balance Type: |
credit |
| Period Type: |
duration |
|
| X |
- DefinitionContract with customer liability revenue additions in year one.
| Name: |
ACFN_ContractWithCustomerLiabilityRevenueAdditionsInYearOne |
| Namespace Prefix: |
ACFN_ |
| Data Type: |
xbrli:monetaryItemType |
| Balance Type: |
credit |
| Period Type: |
instant |
|
| X |
- DefinitionContract with customer liability revenue additions in year three.
| Name: |
ACFN_ContractWithCustomerLiabilityRevenueAdditionsInYearThree |
| Namespace Prefix: |
ACFN_ |
| Data Type: |
xbrli:monetaryItemType |
| Balance Type: |
credit |
| Period Type: |
instant |
|
| X |
- DefinitionContract with customer liability revenue additions in year two.
| Name: |
ACFN_ContractWithCustomerLiabilityRevenueAdditionsInYearTwo |
| Namespace Prefix: |
ACFN_ |
| Data Type: |
xbrli:monetaryItemType |
| Balance Type: |
credit |
| Period Type: |
instant |
|
| X |
- DefinitionAmount of obligation to transfer good or service to customer for which consideration has been received or is receivable. Reference 1: http://www.xbrl.org/2003/role/disclosureRef
-Topic 606
-SubTopic 10
-Name Accounting Standards Codification
-Section 45
-Paragraph 1
-Publisher FASB
-URI https://asc.fasb.org//1943274/2147479837/606-10-45-1
Reference 2: http://www.xbrl.org/2003/role/disclosureRef
-Topic 606
-SubTopic 10
-Name Accounting Standards Codification
-Section 50
-Paragraph 8
-Subparagraph (a)
-Publisher FASB
-URI https://asc.fasb.org//1943274/2147479806/606-10-50-8
Reference 3: http://www.xbrl.org/2003/role/disclosureRef
-Topic 606
-SubTopic 10
-Name Accounting Standards Codification
-Section 45
-Paragraph 2
-Publisher FASB
-URI https://asc.fasb.org//1943274/2147479837/606-10-45-2
| Name: |
us-gaap_ContractWithCustomerLiability |
| Namespace Prefix: |
us-gaap_ |
| Data Type: |
xbrli:monetaryItemType |
| Balance Type: |
credit |
| Period Type: |
instant |
|
| X |
- DefinitionAmount of revenue recognized that was previously included in balance of obligation to transfer good or service to customer for which consideration from customer has been received or is due. Reference 1: http://www.xbrl.org/2003/role/disclosureRef
-Topic 606
-SubTopic 10
-Name Accounting Standards Codification
-Section 50
-Paragraph 8
-Subparagraph (b)
-Publisher FASB
-URI https://asc.fasb.org//1943274/2147479806/606-10-50-8
| Name: |
us-gaap_ContractWithCustomerLiabilityRevenueRecognized |
| Namespace Prefix: |
us-gaap_ |
| Data Type: |
xbrli:monetaryItemType |
| Balance Type: |
credit |
| Period Type: |
duration |
|
| X |
- DefinitionLine items represent financial concepts included in a table. These concepts are used to disclose reportable information associated with domain members defined in one or many axes to the table. Reference 1: http://www.xbrl.org/2003/role/disclosureRef
-Topic 606
-SubTopic 10
-Name Accounting Standards Codification
-Section 50
-Paragraph 5
-Publisher FASB
-URI https://asc.fasb.org//1943274/2147479806/606-10-50-5
Reference 2: http://www.xbrl.org/2003/role/exampleRef
-Topic 606
-SubTopic 10
-Name Accounting Standards Codification
-Section 55
-Paragraph 91
-Subparagraph (a)
-Publisher FASB
-URI https://asc.fasb.org//1943274/2147479777/606-10-55-91
Reference 3: http://www.xbrl.org/2003/role/exampleRef
-Topic 606
-SubTopic 10
-Name Accounting Standards Codification
-Section 55
-Paragraph 91
-Subparagraph (b)
-Publisher FASB
-URI https://asc.fasb.org//1943274/2147479777/606-10-55-91
Reference 4: http://www.xbrl.org/2003/role/exampleRef
-Topic 606
-SubTopic 10
-Name Accounting Standards Codification
-Section 55
-Paragraph 91
-Subparagraph (c)
-Publisher FASB
-URI https://asc.fasb.org//1943274/2147479777/606-10-55-91
Reference 5: http://www.xbrl.org/2003/role/exampleRef
-Topic 606
-SubTopic 10
-Name Accounting Standards Codification
-Section 55
-Paragraph 91
-Subparagraph (d)
-Publisher FASB
-URI https://asc.fasb.org//1943274/2147479777/606-10-55-91
Reference 6: http://www.xbrl.org/2003/role/exampleRef
-Topic 606
-SubTopic 10
-Name Accounting Standards Codification
-Section 55
-Paragraph 91
-Subparagraph (e)
-Publisher FASB
-URI https://asc.fasb.org//1943274/2147479777/606-10-55-91
Reference 7: http://www.xbrl.org/2003/role/exampleRef
-Topic 606
-SubTopic 10
-Name Accounting Standards Codification
-Section 55
-Paragraph 91
-Subparagraph (f)
-Publisher FASB
-URI https://asc.fasb.org//1943274/2147479777/606-10-55-91
Reference 8: http://www.xbrl.org/2003/role/exampleRef
-Topic 606
-SubTopic 10
-Name Accounting Standards Codification
-Section 55
-Paragraph 91
-Subparagraph (g)
-Publisher FASB
-URI https://asc.fasb.org//1943274/2147479777/606-10-55-91
| Name: |
us-gaap_DisaggregationOfRevenueLineItems |
| Namespace Prefix: |
us-gaap_ |
| Data Type: |
xbrli:stringItemType |
| Balance Type: |
na |
| Period Type: |
duration |
|
| X |
- Details
| Name: |
srt_ProductOrServiceAxis=ACFN_HardwareMember |
| Namespace Prefix: |
|
| Data Type: |
na |
| Balance Type: |
|
| Period Type: |
|
|
| X |
- Details
| Name: |
srt_ProductOrServiceAxis=ACFN_MonitoringMember |
| Namespace Prefix: |
|
| Data Type: |
na |
| Balance Type: |
|
| Period Type: |
|
|
v3.23.3
SCHEDULE OF RECONCILIATION OF HARDWARE REVENUE (Details) - USD ($)
$ in Thousands |
3 Months Ended |
9 Months Ended |
Sep. 30, 2023 |
Sep. 30, 2022 |
Sep. 30, 2023 |
Sep. 30, 2022 |
| Disaggregation of Revenue [Line Items] |
|
|
|
|
| Revenue |
$ 2,087
|
$ 1,783
|
$ 5,809
|
$ 5,155
|
| Hardware [Member] |
|
|
|
|
| Disaggregation of Revenue [Line Items] |
|
|
|
|
| Revenue |
1,004
|
825
|
2,637
|
2,241
|
| Hardware [Member] | Amortization [Member] |
|
|
|
|
| Disaggregation of Revenue [Line Items] |
|
|
|
|
| Revenue |
629
|
631
|
1,821
|
1,658
|
| Hardware [Member] | Sales of Custom Designed Units [Member] |
|
|
|
|
| Disaggregation of Revenue [Line Items] |
|
|
|
|
| Revenue |
43
|
|
135
|
|
| Hardware [Member] | Hardware Sales [Member] |
|
|
|
|
| Disaggregation of Revenue [Line Items] |
|
|
|
|
| Revenue |
150
|
|
150
|
|
| Hardware [Member] | Other Accessories [Member] |
|
|
|
|
| Disaggregation of Revenue [Line Items] |
|
|
|
|
| Revenue |
$ 182
|
$ 194
|
$ 531
|
$ 583
|
| X |
- DefinitionLine items represent financial concepts included in a table. These concepts are used to disclose reportable information associated with domain members defined in one or many axes to the table. Reference 1: http://www.xbrl.org/2003/role/disclosureRef
-Topic 606
-SubTopic 10
-Name Accounting Standards Codification
-Section 50
-Paragraph 5
-Publisher FASB
-URI https://asc.fasb.org//1943274/2147479806/606-10-50-5
Reference 2: http://www.xbrl.org/2003/role/exampleRef
-Topic 606
-SubTopic 10
-Name Accounting Standards Codification
-Section 55
-Paragraph 91
-Subparagraph (a)
-Publisher FASB
-URI https://asc.fasb.org//1943274/2147479777/606-10-55-91
Reference 3: http://www.xbrl.org/2003/role/exampleRef
-Topic 606
-SubTopic 10
-Name Accounting Standards Codification
-Section 55
-Paragraph 91
-Subparagraph (b)
-Publisher FASB
-URI https://asc.fasb.org//1943274/2147479777/606-10-55-91
Reference 4: http://www.xbrl.org/2003/role/exampleRef
-Topic 606
-SubTopic 10
-Name Accounting Standards Codification
-Section 55
-Paragraph 91
-Subparagraph (c)
-Publisher FASB
-URI https://asc.fasb.org//1943274/2147479777/606-10-55-91
Reference 5: http://www.xbrl.org/2003/role/exampleRef
-Topic 606
-SubTopic 10
-Name Accounting Standards Codification
-Section 55
-Paragraph 91
-Subparagraph (d)
-Publisher FASB
-URI https://asc.fasb.org//1943274/2147479777/606-10-55-91
Reference 6: http://www.xbrl.org/2003/role/exampleRef
-Topic 606
-SubTopic 10
-Name Accounting Standards Codification
-Section 55
-Paragraph 91
-Subparagraph (e)
-Publisher FASB
-URI https://asc.fasb.org//1943274/2147479777/606-10-55-91
Reference 7: http://www.xbrl.org/2003/role/exampleRef
-Topic 606
-SubTopic 10
-Name Accounting Standards Codification
-Section 55
-Paragraph 91
-Subparagraph (f)
-Publisher FASB
-URI https://asc.fasb.org//1943274/2147479777/606-10-55-91
Reference 8: http://www.xbrl.org/2003/role/exampleRef
-Topic 606
-SubTopic 10
-Name Accounting Standards Codification
-Section 55
-Paragraph 91
-Subparagraph (g)
-Publisher FASB
-URI https://asc.fasb.org//1943274/2147479777/606-10-55-91
| Name: |
us-gaap_DisaggregationOfRevenueLineItems |
| Namespace Prefix: |
us-gaap_ |
| Data Type: |
xbrli:stringItemType |
| Balance Type: |
na |
| Period Type: |
duration |
|
| X |
- DefinitionAmount, excluding tax collected from customer, of revenue from satisfaction of performance obligation by transferring promised good or service to customer. Tax collected from customer is tax assessed by governmental authority that is both imposed on and concurrent with specific revenue-producing transaction, including, but not limited to, sales, use, value added and excise. Reference 1: http://www.xbrl.org/2003/role/disclosureRef
-Topic 924
-SubTopic 10
-Name Accounting Standards Codification
-Section S99
-Paragraph 1
-Subparagraph (SAB Topic 11.L)
-Publisher FASB
-URI https://asc.fasb.org//1943274/2147479941/924-10-S99-1
Reference 2: http://www.xbrl.org/2003/role/disclosureRef
-Topic 606
-SubTopic 10
-Name Accounting Standards Codification
-Section 50
-Paragraph 5
-Publisher FASB
-URI https://asc.fasb.org//1943274/2147479806/606-10-50-5
Reference 3: http://www.xbrl.org/2003/role/disclosureRef
-Topic 280
-SubTopic 10
-Name Accounting Standards Codification
-Section 50
-Paragraph 30
-Subparagraph (a)
-Publisher FASB
-URI https://asc.fasb.org//1943274/2147482810/280-10-50-30
Reference 4: http://www.xbrl.org/2003/role/disclosureRef
-Topic 280
-SubTopic 10
-Name Accounting Standards Codification
-Section 50
-Paragraph 42
-Publisher FASB
-URI https://asc.fasb.org//1943274/2147482810/280-10-50-42
Reference 5: http://www.xbrl.org/2003/role/disclosureRef
-Topic 280
-SubTopic 10
-Name Accounting Standards Codification
-Section 50
-Paragraph 22
-Subparagraph (b)
-Publisher FASB
-URI https://asc.fasb.org//1943274/2147482810/280-10-50-22
Reference 6: http://www.xbrl.org/2003/role/disclosureRef
-Topic 280
-SubTopic 10
-Name Accounting Standards Codification
-Section 50
-Paragraph 32
-Subparagraph (b)
-Publisher FASB
-URI https://asc.fasb.org//1943274/2147482810/280-10-50-32
Reference 7: http://www.xbrl.org/2003/role/disclosureRef
-Topic 280
-SubTopic 10
-Name Accounting Standards Codification
-Section 50
-Paragraph 40
-Publisher FASB
-URI https://asc.fasb.org//1943274/2147482810/280-10-50-40
Reference 8: http://www.xbrl.org/2003/role/disclosureRef
-Topic 280
-SubTopic 10
-Name Accounting Standards Codification
-Section 50
-Paragraph 22
-Subparagraph (a)
-Publisher FASB
-URI https://asc.fasb.org//1943274/2147482810/280-10-50-22
Reference 9: http://www.xbrl.org/2003/role/disclosureRef
-Topic 280
-SubTopic 10
-Name Accounting Standards Codification
-Section 50
-Paragraph 32
-Subparagraph (a)
-Publisher FASB
-URI https://asc.fasb.org//1943274/2147482810/280-10-50-32
Reference 10: http://www.xbrl.org/2003/role/disclosureRef
-Topic 280
-SubTopic 10
-Name Accounting Standards Codification
-Section 50
-Paragraph 41
-Subparagraph (a)
-Publisher FASB
-URI https://asc.fasb.org//1943274/2147482810/280-10-50-41
Reference 11: http://www.xbrl.org/2003/role/disclosureRef
-Topic 606
-SubTopic 10
-Name Accounting Standards Codification
-Section 50
-Paragraph 4
-Subparagraph (a)
-Publisher FASB
-URI https://asc.fasb.org//1943274/2147479806/606-10-50-4
| Name: |
us-gaap_RevenueFromContractWithCustomerExcludingAssessedTax |
| Namespace Prefix: |
us-gaap_ |
| Data Type: |
xbrli:monetaryItemType |
| Balance Type: |
credit |
| Period Type: |
duration |
|
| X |
- Details
| Name: |
srt_ProductOrServiceAxis=ACFN_HardwareMember |
| Namespace Prefix: |
|
| Data Type: |
na |
| Balance Type: |
|
| Period Type: |
|
|
| X |
- Details
| Name: |
us-gaap_ContractWithCustomerSalesChannelAxis=ACFN_AmortizationMember |
| Namespace Prefix: |
|
| Data Type: |
na |
| Balance Type: |
|
| Period Type: |
|
|
| X |
- Details
| Name: |
us-gaap_ContractWithCustomerSalesChannelAxis=ACFN_SalesOfCustomDesignedUnitsMember |
| Namespace Prefix: |
|
| Data Type: |
na |
| Balance Type: |
|
| Period Type: |
|
|
| X |
- Details
| Name: |
us-gaap_ContractWithCustomerSalesChannelAxis=ACFN_HardwareSalesMember |
| Namespace Prefix: |
|
| Data Type: |
na |
| Balance Type: |
|
| Period Type: |
|
|
| X |
- Details
| Name: |
us-gaap_ContractWithCustomerSalesChannelAxis=ACFN_OtherAccessoriesMember |
| Namespace Prefix: |
|
| Data Type: |
na |
| Balance Type: |
|
| Period Type: |
|
|
v3.23.3
SCHEDULE OF DEFERRED CHARGES ACTIVITY (Details)
$ in Thousands |
9 Months Ended |
|
Sep. 30, 2023
USD ($)
|
|---|
| Revenue from Contract with Customer [Abstract] |
|
| Balance at December 31, 2022 |
$ 1,694
|
| Additions, net of adjustments, during the period |
655
|
| Recognized as COGS |
(817)
|
| Balance at September 30, 2023 |
1,532
|
| September 30, 2024 |
890
|
| September 30, 2025 |
507
|
| September 30, 2026 and thereafter |
135
|
| Total |
$ 1,532
|
| X |
- DefinitionDeferred charges sale of equipment
| Name: |
ACFN_DeferredChargesSaleOfEquipment |
| Namespace Prefix: |
ACFN_ |
| Data Type: |
xbrli:monetaryItemType |
| Balance Type: |
credit |
| Period Type: |
instant |
|
| X |
- DefinitionDeferred charges sale of equipment additions
| Name: |
ACFN_DeferredChargesSaleOfEquipmentAdditions |
| Namespace Prefix: |
ACFN_ |
| Data Type: |
xbrli:monetaryItemType |
| Balance Type: |
credit |
| Period Type: |
duration |
|
| X |
- DefinitionDeferred charges sale of equipment in year one.
| Name: |
ACFN_DeferredChargesSaleOfEquipmentInYearOne |
| Namespace Prefix: |
ACFN_ |
| Data Type: |
xbrli:monetaryItemType |
| Balance Type: |
credit |
| Period Type: |
instant |
|
| X |
- DefinitionDeferred charges sale of equipment in year three.
| Name: |
ACFN_DeferredChargesSaleOfEquipmentInYearThree |
| Namespace Prefix: |
ACFN_ |
| Data Type: |
xbrli:monetaryItemType |
| Balance Type: |
credit |
| Period Type: |
instant |
|
| X |
- DefinitionDeferred charges sale of equipment in year two.
| Name: |
ACFN_DeferredChargesSaleOfEquipmentInYearTwo |
| Namespace Prefix: |
ACFN_ |
| Data Type: |
xbrli:monetaryItemType |
| Balance Type: |
credit |
| Period Type: |
instant |
|
| X |
- DefinitionDeferred charges sale of equipment recognized
| Name: |
ACFN_DeferredChargesSaleOfEquipmentRecognized |
| Namespace Prefix: |
ACFN_ |
| Data Type: |
xbrli:monetaryItemType |
| Balance Type: |
credit |
| Period Type: |
duration |
|
| X |
- DefinitionAmount of deferred sale inducement cost capitalized on contract remaining in force. Reference 1: http://www.xbrl.org/2009/role/commonPracticeRef
-Topic 944
-SubTopic 30
-Name Accounting Standards Codification
-Section 50
-Paragraph 2B
-Subparagraph (a)
-Publisher FASB
-URI https://asc.fasb.org//1943274/2147479432/944-30-50-2B
Reference 2: http://www.xbrl.org/2009/role/commonPracticeRef
-Topic 944
-SubTopic 30
-Name Accounting Standards Codification
-Section 50
-Paragraph 2B
-Subparagraph (b)
-Publisher FASB
-URI https://asc.fasb.org//1943274/2147479432/944-30-50-2B
Reference 3: http://www.xbrl.org/2009/role/commonPracticeRef
-Topic 944
-SubTopic 40
-Name Accounting Standards Codification
-Section 65
-Paragraph 2
-Subparagraph (g)(1)
-Publisher FASB
-URI https://asc.fasb.org//1943274/2147480016/944-40-65-2
Reference 4: http://fasb.org/us-gaap/role/ref/otherTransitionRef
-Topic 944
-SubTopic 30
-Name Accounting Standards Codification
-Section 50
-Paragraph 3
-Subparagraph (c)
-Publisher FASB
-URI https://asc.fasb.org//1943274/2147479432/944-30-50-3
Reference 5: http://www.xbrl.org/2003/role/disclosureRef
-Topic 944
-SubTopic 30
-Name Accounting Standards Codification
-Section 45
-Paragraph 2
-Publisher FASB
-URI https://asc.fasb.org//1943274/2147479460/944-30-45-2
| Name: |
us-gaap_DeferredSalesInducementsNet |
| Namespace Prefix: |
us-gaap_ |
| Data Type: |
xbrli:monetaryItemType |
| Balance Type: |
debit |
| Period Type: |
instant |
|
| X |
- References
+ Details
| Name: |
us-gaap_RevenueFromContractWithCustomerAbstract |
| Namespace Prefix: |
us-gaap_ |
| Data Type: |
xbrli:stringItemType |
| Balance Type: |
na |
| Period Type: |
duration |
|
v3.23.3
SCHEDULE OF RECONCILIATION OF COGS EXPENSE (Details) - USD ($)
$ in Thousands |
3 Months Ended |
9 Months Ended |
Sep. 30, 2023 |
Sep. 30, 2022 |
Sep. 30, 2023 |
Sep. 30, 2022 |
| Disaggregation of Revenue [Line Items] |
|
|
|
|
| Revenue |
$ 2,087
|
$ 1,783
|
$ 5,809
|
$ 5,155
|
| COGS [Member] |
|
|
|
|
| Disaggregation of Revenue [Line Items] |
|
|
|
|
| Revenue |
537
|
568
|
1,453
|
1,436
|
| COGS [Member] | Amortization [Member] |
|
|
|
|
| Disaggregation of Revenue [Line Items] |
|
|
|
|
| Revenue |
277
|
309
|
817
|
793
|
| COGS [Member] | COGS of Custom Designed Units [Member] |
|
|
|
|
| Disaggregation of Revenue [Line Items] |
|
|
|
|
| Revenue |
11
|
|
34
|
|
| COGS [Member] | COGS of Hardware Sales [Member] |
|
|
|
|
| Disaggregation of Revenue [Line Items] |
|
|
|
|
| Revenue |
66
|
|
66
|
|
| COGS [Member] | COGS Data Costs [Member] |
|
|
|
|
| Disaggregation of Revenue [Line Items] |
|
|
|
|
| Revenue |
76
|
93
|
224
|
250
|
| COGS [Member] | Other COGS Accessories [Member] |
|
|
|
|
| Disaggregation of Revenue [Line Items] |
|
|
|
|
| Revenue |
$ 107
|
$ 166
|
$ 312
|
$ 393
|
| X |
- DefinitionLine items represent financial concepts included in a table. These concepts are used to disclose reportable information associated with domain members defined in one or many axes to the table. Reference 1: http://www.xbrl.org/2003/role/disclosureRef
-Topic 606
-SubTopic 10
-Name Accounting Standards Codification
-Section 50
-Paragraph 5
-Publisher FASB
-URI https://asc.fasb.org//1943274/2147479806/606-10-50-5
Reference 2: http://www.xbrl.org/2003/role/exampleRef
-Topic 606
-SubTopic 10
-Name Accounting Standards Codification
-Section 55
-Paragraph 91
-Subparagraph (a)
-Publisher FASB
-URI https://asc.fasb.org//1943274/2147479777/606-10-55-91
Reference 3: http://www.xbrl.org/2003/role/exampleRef
-Topic 606
-SubTopic 10
-Name Accounting Standards Codification
-Section 55
-Paragraph 91
-Subparagraph (b)
-Publisher FASB
-URI https://asc.fasb.org//1943274/2147479777/606-10-55-91
Reference 4: http://www.xbrl.org/2003/role/exampleRef
-Topic 606
-SubTopic 10
-Name Accounting Standards Codification
-Section 55
-Paragraph 91
-Subparagraph (c)
-Publisher FASB
-URI https://asc.fasb.org//1943274/2147479777/606-10-55-91
Reference 5: http://www.xbrl.org/2003/role/exampleRef
-Topic 606
-SubTopic 10
-Name Accounting Standards Codification
-Section 55
-Paragraph 91
-Subparagraph (d)
-Publisher FASB
-URI https://asc.fasb.org//1943274/2147479777/606-10-55-91
Reference 6: http://www.xbrl.org/2003/role/exampleRef
-Topic 606
-SubTopic 10
-Name Accounting Standards Codification
-Section 55
-Paragraph 91
-Subparagraph (e)
-Publisher FASB
-URI https://asc.fasb.org//1943274/2147479777/606-10-55-91
Reference 7: http://www.xbrl.org/2003/role/exampleRef
-Topic 606
-SubTopic 10
-Name Accounting Standards Codification
-Section 55
-Paragraph 91
-Subparagraph (f)
-Publisher FASB
-URI https://asc.fasb.org//1943274/2147479777/606-10-55-91
Reference 8: http://www.xbrl.org/2003/role/exampleRef
-Topic 606
-SubTopic 10
-Name Accounting Standards Codification
-Section 55
-Paragraph 91
-Subparagraph (g)
-Publisher FASB
-URI https://asc.fasb.org//1943274/2147479777/606-10-55-91
| Name: |
us-gaap_DisaggregationOfRevenueLineItems |
| Namespace Prefix: |
us-gaap_ |
| Data Type: |
xbrli:stringItemType |
| Balance Type: |
na |
| Period Type: |
duration |
|
| X |
- DefinitionAmount, excluding tax collected from customer, of revenue from satisfaction of performance obligation by transferring promised good or service to customer. Tax collected from customer is tax assessed by governmental authority that is both imposed on and concurrent with specific revenue-producing transaction, including, but not limited to, sales, use, value added and excise. Reference 1: http://www.xbrl.org/2003/role/disclosureRef
-Topic 924
-SubTopic 10
-Name Accounting Standards Codification
-Section S99
-Paragraph 1
-Subparagraph (SAB Topic 11.L)
-Publisher FASB
-URI https://asc.fasb.org//1943274/2147479941/924-10-S99-1
Reference 2: http://www.xbrl.org/2003/role/disclosureRef
-Topic 606
-SubTopic 10
-Name Accounting Standards Codification
-Section 50
-Paragraph 5
-Publisher FASB
-URI https://asc.fasb.org//1943274/2147479806/606-10-50-5
Reference 3: http://www.xbrl.org/2003/role/disclosureRef
-Topic 280
-SubTopic 10
-Name Accounting Standards Codification
-Section 50
-Paragraph 30
-Subparagraph (a)
-Publisher FASB
-URI https://asc.fasb.org//1943274/2147482810/280-10-50-30
Reference 4: http://www.xbrl.org/2003/role/disclosureRef
-Topic 280
-SubTopic 10
-Name Accounting Standards Codification
-Section 50
-Paragraph 42
-Publisher FASB
-URI https://asc.fasb.org//1943274/2147482810/280-10-50-42
Reference 5: http://www.xbrl.org/2003/role/disclosureRef
-Topic 280
-SubTopic 10
-Name Accounting Standards Codification
-Section 50
-Paragraph 22
-Subparagraph (b)
-Publisher FASB
-URI https://asc.fasb.org//1943274/2147482810/280-10-50-22
Reference 6: http://www.xbrl.org/2003/role/disclosureRef
-Topic 280
-SubTopic 10
-Name Accounting Standards Codification
-Section 50
-Paragraph 32
-Subparagraph (b)
-Publisher FASB
-URI https://asc.fasb.org//1943274/2147482810/280-10-50-32
Reference 7: http://www.xbrl.org/2003/role/disclosureRef
-Topic 280
-SubTopic 10
-Name Accounting Standards Codification
-Section 50
-Paragraph 40
-Publisher FASB
-URI https://asc.fasb.org//1943274/2147482810/280-10-50-40
Reference 8: http://www.xbrl.org/2003/role/disclosureRef
-Topic 280
-SubTopic 10
-Name Accounting Standards Codification
-Section 50
-Paragraph 22
-Subparagraph (a)
-Publisher FASB
-URI https://asc.fasb.org//1943274/2147482810/280-10-50-22
Reference 9: http://www.xbrl.org/2003/role/disclosureRef
-Topic 280
-SubTopic 10
-Name Accounting Standards Codification
-Section 50
-Paragraph 32
-Subparagraph (a)
-Publisher FASB
-URI https://asc.fasb.org//1943274/2147482810/280-10-50-32
Reference 10: http://www.xbrl.org/2003/role/disclosureRef
-Topic 280
-SubTopic 10
-Name Accounting Standards Codification
-Section 50
-Paragraph 41
-Subparagraph (a)
-Publisher FASB
-URI https://asc.fasb.org//1943274/2147482810/280-10-50-41
Reference 11: http://www.xbrl.org/2003/role/disclosureRef
-Topic 606
-SubTopic 10
-Name Accounting Standards Codification
-Section 50
-Paragraph 4
-Subparagraph (a)
-Publisher FASB
-URI https://asc.fasb.org//1943274/2147479806/606-10-50-4
| Name: |
us-gaap_RevenueFromContractWithCustomerExcludingAssessedTax |
| Namespace Prefix: |
us-gaap_ |
| Data Type: |
xbrli:monetaryItemType |
| Balance Type: |
credit |
| Period Type: |
duration |
|
| X |
- Details
| Name: |
srt_ProductOrServiceAxis=ACFN_COGSMember |
| Namespace Prefix: |
|
| Data Type: |
na |
| Balance Type: |
|
| Period Type: |
|
|
| X |
- Details
| Name: |
us-gaap_ContractWithCustomerSalesChannelAxis=ACFN_AmortizationMember |
| Namespace Prefix: |
|
| Data Type: |
na |
| Balance Type: |
|
| Period Type: |
|
|
| X |
- Details
| Name: |
us-gaap_ContractWithCustomerSalesChannelAxis=ACFN_COGSOfCustomDesignedUnitsMember |
| Namespace Prefix: |
|
| Data Type: |
na |
| Balance Type: |
|
| Period Type: |
|
|
| X |
- Details
| Name: |
us-gaap_ContractWithCustomerSalesChannelAxis=ACFN_COGSOfHardwareSalesMember |
| Namespace Prefix: |
|
| Data Type: |
na |
| Balance Type: |
|
| Period Type: |
|
|
| X |
- Details
| Name: |
us-gaap_ContractWithCustomerSalesChannelAxis=ACFN_COGSDataCostsMember |
| Namespace Prefix: |
|
| Data Type: |
na |
| Balance Type: |
|
| Period Type: |
|
|
| X |
- Details
| Name: |
us-gaap_ContractWithCustomerSalesChannelAxis=ACFN_OtherCOGSAccessoriesMember |
| Namespace Prefix: |
|
| Data Type: |
na |
| Balance Type: |
|
| Period Type: |
|
|
v3.23.3
| X |
- DefinitionContract with customer asset additions.
| Name: |
ACFN_ContractWithCustomerAssetAdditions |
| Namespace Prefix: |
ACFN_ |
| Data Type: |
xbrli:monetaryItemType |
| Balance Type: |
credit |
| Period Type: |
duration |
|
| X |
- DefinitionContract with customer asset sale commission.
| Name: |
ACFN_ContractWithCustomerAssetSaleCommission |
| Namespace Prefix: |
ACFN_ |
| Data Type: |
xbrli:monetaryItemType |
| Balance Type: |
credit |
| Period Type: |
instant |
|
| X |
- DefinitionThe amount of expense recognized in the current period for the periodic realization of capitalized fees that were paid to salespeople, distributors, brokers, and agents at the time of the conclusion of the sale. As a noncash expense, this element is added back to net income when calculating cash provided by or used in operations using the indirect method. Reference 1: http://fasb.org/us-gaap/role/ref/legacyRef
-Name Accounting Standards Codification
-Section 45
-Paragraph 28
-Subparagraph (b)
-SubTopic 10
-Topic 230
-Publisher FASB
-URI https://asc.fasb.org//1943274/2147482740/230-10-45-28
Reference 2: http://fasb.org/us-gaap/role/ref/legacyRef
-Topic 220
-SubTopic 10
-Name Accounting Standards Codification
-Section S99
-Paragraph 2
-Subparagraph (SX 210.5-03.3)
-Publisher FASB
-URI https://asc.fasb.org//1943274/2147483621/220-10-S99-2
| Name: |
us-gaap_AmortizationOfDeferredSalesCommissions |
| Namespace Prefix: |
us-gaap_ |
| Data Type: |
xbrli:monetaryItemType |
| Balance Type: |
debit |
| Period Type: |
duration |
|
| X |
- DefinitionLine items represent financial concepts included in a table. These concepts are used to disclose reportable information associated with domain members defined in one or many axes to the table. Reference 1: http://www.xbrl.org/2003/role/disclosureRef
-Topic 606
-SubTopic 10
-Name Accounting Standards Codification
-Section 50
-Paragraph 5
-Publisher FASB
-URI https://asc.fasb.org//1943274/2147479806/606-10-50-5
Reference 2: http://www.xbrl.org/2003/role/exampleRef
-Topic 606
-SubTopic 10
-Name Accounting Standards Codification
-Section 55
-Paragraph 91
-Subparagraph (a)
-Publisher FASB
-URI https://asc.fasb.org//1943274/2147479777/606-10-55-91
Reference 3: http://www.xbrl.org/2003/role/exampleRef
-Topic 606
-SubTopic 10
-Name Accounting Standards Codification
-Section 55
-Paragraph 91
-Subparagraph (b)
-Publisher FASB
-URI https://asc.fasb.org//1943274/2147479777/606-10-55-91
Reference 4: http://www.xbrl.org/2003/role/exampleRef
-Topic 606
-SubTopic 10
-Name Accounting Standards Codification
-Section 55
-Paragraph 91
-Subparagraph (c)
-Publisher FASB
-URI https://asc.fasb.org//1943274/2147479777/606-10-55-91
Reference 5: http://www.xbrl.org/2003/role/exampleRef
-Topic 606
-SubTopic 10
-Name Accounting Standards Codification
-Section 55
-Paragraph 91
-Subparagraph (d)
-Publisher FASB
-URI https://asc.fasb.org//1943274/2147479777/606-10-55-91
Reference 6: http://www.xbrl.org/2003/role/exampleRef
-Topic 606
-SubTopic 10
-Name Accounting Standards Codification
-Section 55
-Paragraph 91
-Subparagraph (e)
-Publisher FASB
-URI https://asc.fasb.org//1943274/2147479777/606-10-55-91
Reference 7: http://www.xbrl.org/2003/role/exampleRef
-Topic 606
-SubTopic 10
-Name Accounting Standards Codification
-Section 55
-Paragraph 91
-Subparagraph (f)
-Publisher FASB
-URI https://asc.fasb.org//1943274/2147479777/606-10-55-91
Reference 8: http://www.xbrl.org/2003/role/exampleRef
-Topic 606
-SubTopic 10
-Name Accounting Standards Codification
-Section 55
-Paragraph 91
-Subparagraph (g)
-Publisher FASB
-URI https://asc.fasb.org//1943274/2147479777/606-10-55-91
| Name: |
us-gaap_DisaggregationOfRevenueLineItems |
| Namespace Prefix: |
us-gaap_ |
| Data Type: |
xbrli:stringItemType |
| Balance Type: |
na |
| Period Type: |
duration |
|
| X |
- Details
| Name: |
srt_ProductOrServiceAxis=ACFN_HardwareMember |
| Namespace Prefix: |
|
| Data Type: |
na |
| Balance Type: |
|
| Period Type: |
|
|
| X |
- Details
| Name: |
srt_ProductOrServiceAxis=ACFN_MonitoringMember |
| Namespace Prefix: |
|
| Data Type: |
na |
| Balance Type: |
|
| Period Type: |
|
|
v3.23.3
| X |
- DefinitionContract with customer liability sales commissions expense.
| Name: |
ACFN_ContractWithCustomerLiabilitySalesCommissionsExpense |
| Namespace Prefix: |
ACFN_ |
| Data Type: |
xbrli:monetaryItemType |
| Balance Type: |
credit |
| Period Type: |
instant |
|
| X |
- DefinitionContract with customer liability sales commissions expense in year one.
| Name: |
ACFN_ContractWithCustomerLiabilitySalesCommissionsExpenseInYearOne |
| Namespace Prefix: |
ACFN_ |
| Data Type: |
xbrli:monetaryItemType |
| Balance Type: |
credit |
| Period Type: |
instant |
|
| X |
- DefinitionContract with customer liability sales commissions expense in year three.
| Name: |
ACFN_ContractWithCustomerLiabilitySalesCommissionsExpenseInYearThree |
| Namespace Prefix: |
ACFN_ |
| Data Type: |
xbrli:monetaryItemType |
| Balance Type: |
credit |
| Period Type: |
instant |
|
| X |
- DefinitionContract with customer liability sales commissions expense in year two.
| Name: |
ACFN_ContractWithCustomerLiabilitySalesCommissionsExpenseInYearTwo |
| Namespace Prefix: |
ACFN_ |
| Data Type: |
xbrli:monetaryItemType |
| Balance Type: |
credit |
| Period Type: |
instant |
|
| X |
- References
+ Details
| Name: |
us-gaap_RevenueFromContractWithCustomerAbstract |
| Namespace Prefix: |
us-gaap_ |
| Data Type: |
xbrli:stringItemType |
| Balance Type: |
na |
| Period Type: |
duration |
|
v3.23.3
REVENUE (Details Narrative) - USD ($)
|
9 Months Ended |
|
Sep. 30, 2023 |
Dec. 31, 2022 |
| Disaggregation of Revenue [Line Items] |
|
|
| Other current assets |
$ 343,000
|
$ 288,000
|
| Capitalized Sales Commissions [Member] |
|
|
| Disaggregation of Revenue [Line Items] |
|
|
| Other current assets |
218,000
|
196,000
|
| Other assets |
196,000
|
$ 203,000
|
| Hardware [Member] |
|
|
| Disaggregation of Revenue [Line Items] |
|
|
| Deferred revenue recognized |
1,469,000
|
|
| Monitoring [Member] |
|
|
| Disaggregation of Revenue [Line Items] |
|
|
| Deferred revenue recognized |
$ 1,890,000
|
|
| X |
- DefinitionAmount of revenue recognized that was previously reported as deferred or unearned revenue.
| Name: |
us-gaap_DeferredRevenueRevenueRecognized1 |
| Namespace Prefix: |
us-gaap_ |
| Data Type: |
xbrli:monetaryItemType |
| Balance Type: |
credit |
| Period Type: |
duration |
|
| X |
- DefinitionLine items represent financial concepts included in a table. These concepts are used to disclose reportable information associated with domain members defined in one or many axes to the table. Reference 1: http://www.xbrl.org/2003/role/disclosureRef
-Topic 606
-SubTopic 10
-Name Accounting Standards Codification
-Section 50
-Paragraph 5
-Publisher FASB
-URI https://asc.fasb.org//1943274/2147479806/606-10-50-5
Reference 2: http://www.xbrl.org/2003/role/exampleRef
-Topic 606
-SubTopic 10
-Name Accounting Standards Codification
-Section 55
-Paragraph 91
-Subparagraph (a)
-Publisher FASB
-URI https://asc.fasb.org//1943274/2147479777/606-10-55-91
Reference 3: http://www.xbrl.org/2003/role/exampleRef
-Topic 606
-SubTopic 10
-Name Accounting Standards Codification
-Section 55
-Paragraph 91
-Subparagraph (b)
-Publisher FASB
-URI https://asc.fasb.org//1943274/2147479777/606-10-55-91
Reference 4: http://www.xbrl.org/2003/role/exampleRef
-Topic 606
-SubTopic 10
-Name Accounting Standards Codification
-Section 55
-Paragraph 91
-Subparagraph (c)
-Publisher FASB
-URI https://asc.fasb.org//1943274/2147479777/606-10-55-91
Reference 5: http://www.xbrl.org/2003/role/exampleRef
-Topic 606
-SubTopic 10
-Name Accounting Standards Codification
-Section 55
-Paragraph 91
-Subparagraph (d)
-Publisher FASB
-URI https://asc.fasb.org//1943274/2147479777/606-10-55-91
Reference 6: http://www.xbrl.org/2003/role/exampleRef
-Topic 606
-SubTopic 10
-Name Accounting Standards Codification
-Section 55
-Paragraph 91
-Subparagraph (e)
-Publisher FASB
-URI https://asc.fasb.org//1943274/2147479777/606-10-55-91
Reference 7: http://www.xbrl.org/2003/role/exampleRef
-Topic 606
-SubTopic 10
-Name Accounting Standards Codification
-Section 55
-Paragraph 91
-Subparagraph (f)
-Publisher FASB
-URI https://asc.fasb.org//1943274/2147479777/606-10-55-91
Reference 8: http://www.xbrl.org/2003/role/exampleRef
-Topic 606
-SubTopic 10
-Name Accounting Standards Codification
-Section 55
-Paragraph 91
-Subparagraph (g)
-Publisher FASB
-URI https://asc.fasb.org//1943274/2147479777/606-10-55-91
| Name: |
us-gaap_DisaggregationOfRevenueLineItems |
| Namespace Prefix: |
us-gaap_ |
| Data Type: |
xbrli:stringItemType |
| Balance Type: |
na |
| Period Type: |
duration |
|
| X |
- DefinitionAmount of assets classified as other. Reference 1: http://www.xbrl.org/2003/role/exampleRef
-Topic 946
-SubTopic 830
-Name Accounting Standards Codification
-Section 55
-Paragraph 12
-Publisher FASB
-URI https://asc.fasb.org//1943274/2147480167/946-830-55-12
Reference 2: http://www.xbrl.org/2003/role/disclosureRef
-Topic 944
-SubTopic 210
-Name Accounting Standards Codification
-Section S99
-Paragraph 1
-Subparagraph (SX 210.7-03(a)(10))
-Publisher FASB
-URI https://asc.fasb.org//1943274/2147479440/944-210-S99-1
Reference 3: http://www.xbrl.org/2003/role/disclosureRef
-Topic 210
-SubTopic 10
-Name Accounting Standards Codification
-Section S99
-Paragraph 1
-Subparagraph (SX 210.5-02(17))
-Publisher FASB
-URI https://asc.fasb.org//1943274/2147480566/210-10-S99-1
Reference 4: http://fasb.org/us-gaap/role/ref/legacyRef
-Topic 942
-SubTopic 210
-Name Accounting Standards Codification
-Section S99
-Paragraph 1
-Subparagraph (SX 210.9-03(10))
-Publisher FASB
-URI https://asc.fasb.org//1943274/2147479853/942-210-S99-1
| Name: |
us-gaap_OtherAssets |
| Namespace Prefix: |
us-gaap_ |
| Data Type: |
xbrli:monetaryItemType |
| Balance Type: |
debit |
| Period Type: |
instant |
|
| X |
- DefinitionAmount of current assets classified as other. Reference 1: http://www.xbrl.org/2003/role/exampleRef
-Topic 852
-SubTopic 10
-Name Accounting Standards Codification
-Section 55
-Paragraph 10
-Publisher FASB
-URI https://asc.fasb.org//1943274/2147481372/852-10-55-10
Reference 2: http://www.xbrl.org/2003/role/disclosureRef
-Topic 210
-SubTopic 10
-Name Accounting Standards Codification
-Section S99
-Paragraph 1
-Subparagraph (SX 210.5-02(8))
-Publisher FASB
-URI https://asc.fasb.org//1943274/2147480566/210-10-S99-1
| Name: |
us-gaap_OtherAssetsCurrent |
| Namespace Prefix: |
us-gaap_ |
| Data Type: |
xbrli:monetaryItemType |
| Balance Type: |
debit |
| Period Type: |
instant |
|
| X |
- Details
| Name: |
us-gaap_DeferredRevenueArrangementTypeAxis=ACFN_CapitalizedSalesCommissionsMember |
| Namespace Prefix: |
|
| Data Type: |
na |
| Balance Type: |
|
| Period Type: |
|
|
| X |
- Details
| Name: |
srt_ProductOrServiceAxis=ACFN_HardwareMember |
| Namespace Prefix: |
|
| Data Type: |
na |
| Balance Type: |
|
| Period Type: |
|
|
| X |
- Details
| Name: |
srt_ProductOrServiceAxis=ACFN_MonitoringMember |
| Namespace Prefix: |
|
| Data Type: |
na |
| Balance Type: |
|
| Period Type: |
|
|
v3.23.3
RELATED PARTY BALANCES AND TRANSACTIONS (Details Narrative) - USD ($)
|
3 Months Ended |
9 Months Ended |
|
Sep. 30, 2023 |
Sep. 30, 2022 |
Sep. 30, 2023 |
Sep. 30, 2022 |
Dec. 31, 2022 |
| Officer [Member] |
|
|
|
|
|
| Related Party Transaction [Line Items] |
|
|
|
|
|
| Officer and Director fees |
$ 131,000
|
$ 130,000
|
$ 391,000
|
$ 391,000
|
|
| Director [Member] |
|
|
|
|
|
| Related Party Transaction [Line Items] |
|
|
|
|
|
| Officer and Director fees |
18,000
|
$ 15,000
|
52,000
|
44,000
|
|
| Related Party [Member] |
|
|
|
|
|
| Related Party Transaction [Line Items] |
|
|
|
|
|
| Accrued interest and expenses |
$ 2,928,000
|
|
2,928,000
|
|
$ 3,677,000
|
| Related party expenses paid |
|
|
21,000
|
142,000
|
|
| OmniMetrix, LLC [Member] |
|
|
|
|
|
| Related Party Transaction [Line Items] |
|
|
|
|
|
| Decrease in related parties |
|
|
749,000
|
447,000
|
|
| Debt repayment |
|
|
961,000
|
780,000
|
|
| Interest |
|
|
134,000
|
134,000
|
|
| Dividends |
|
|
$ 57,000
|
$ 57,000
|
|
| X |
- DefinitionAmount of paid and unpaid cash, stock, and paid-in-kind (PIK) dividends declared, for example, but not limited to, common and preferred stock. Reference 1: http://fasb.org/us-gaap/role/ref/legacyRef
-Topic 505
-SubTopic 10
-Name Accounting Standards Codification
-Section S99
-Paragraph 1
-Subparagraph (SX 210.3-04)
-Publisher FASB
-URI https://asc.fasb.org//1943274/2147480008/505-10-S99-1
Reference 2: http://fasb.org/us-gaap/role/ref/legacyRef
-Name Accounting Standards Codification
-Section 45
-Paragraph 2
-SubTopic 405
-Topic 942
-Publisher FASB
-URI https://asc.fasb.org//1943274/2147481071/942-405-45-2
| Name: |
us-gaap_Dividends |
| Namespace Prefix: |
us-gaap_ |
| Data Type: |
xbrli:monetaryItemType |
| Balance Type: |
debit |
| Period Type: |
duration |
|
| X |
- DefinitionInterest and debt related expenses associated with nonoperating financing activities of the entity. Reference 1: http://fasb.org/us-gaap/role/ref/legacyRef
-Name Accounting Standards Codification
-Section 50
-Paragraph 1
-SubTopic 20
-Topic 835
-Publisher FASB
-URI https://asc.fasb.org//1943274/2147483013/835-20-50-1
| Name: |
us-gaap_InterestAndDebtExpense |
| Namespace Prefix: |
us-gaap_ |
| Data Type: |
xbrli:monetaryItemType |
| Balance Type: |
debit |
| Period Type: |
duration |
|
| X |
- DefinitionGenerally recurring costs associated with normal operations except for the portion of these expenses which can be clearly related to production and included in cost of sales or services. Excludes Selling, General and Administrative Expense.
| Name: |
us-gaap_OperatingCostsAndExpenses |
| Namespace Prefix: |
us-gaap_ |
| Data Type: |
xbrli:monetaryItemType |
| Balance Type: |
debit |
| Period Type: |
duration |
|
| X |
- DefinitionAmount, after allowance, of receivables classified as other, due within one year or the operating cycle, if longer.
| Name: |
us-gaap_OtherReceivablesNetCurrent |
| Namespace Prefix: |
us-gaap_ |
| Data Type: |
xbrli:monetaryItemType |
| Balance Type: |
debit |
| Period Type: |
instant |
|
Acorn Energy (QB) (USOTC:ACFND)
Historical Stock Chart
From May 2024 to Jun 2024
 Charts.")
Acorn Energy (QB) (USOTC:ACFND)
Historical Stock Chart
From Jun 2023 to Jun 2024
 Charts.")