Farmers & Merchants Bank of Long Beach (OTCBB: FMBL) today
reported financial results for the fourth quarter and full year
ended December 31, 2011.
“Farmers & Merchants Bank has reported double-digit percent
increases in year-over-year net income for the past three years,
coupled with a strong balance sheet,” said Henry Walker, chief
executive officer of Farmers & Merchants Bank of Long Beach.
“As the global and domestic economies continue to challenge the
banking industry as a whole, we believe Farmers & Merchants is
well positioned to attract customers who seek a community bank with
financial strength and personalized service.”
Income Statement
For the 2011 fourth quarter, total interest income was $43.3
million, compared with $44.0 million in the fourth quarter of 2010.
Total interest income for the year ended December 31, 2011 was
$178.6 million, compared with $178.9 million reported for the same
period in 2010.
Interest expense for the 2011 fourth quarter declined to $2.0
million from $2.7 million in the same quarter of 2010, attributed
primarily to the roll over of long-term time deposits. Interest
expense for the year totaled $9.5 million, compared with $12.0
million for the same period in 2010.
The Bank’s net interest income for the 2011 fourth quarter was
$41.3 million, in line with the $41.3 million of net interest
income for the same quarter of 2010. Net interest income for 2011
was $169.2 million, versus $166.9 million in 2010. Farmers &
Merchant’s net interest margin was 4.08% for the year ended
December 31, 2011, compared with 4.23% in the previous year.
The Bank’s provision for loan losses decreased to $5.5 million
in the fourth quarter of 2011 from $6.5 million in the 2010 fourth
quarter amid stabilizing economic conditions. Provision for loan
losses declined to $14.2 million in 2011 from $26.0 million for
2010. The Bank’s allowance for loan losses as a percentage of loans
outstanding was 2.80% at December 31, 2011, compared with 2.69% at
December 31, 2010.
Non-interest income was $4.0 million for the 2011 fourth
quarter, compared with $4.2 million in the 2010 fourth quarter.
Non-interest income for the full 2011 year totaled $13.9 million,
compared with $15.4 million for 2010.
Non-interest expense for the 2011 fourth quarter was $19.9
million, compared with $16.7 million for the same period last year.
Non-interest expense for the year ended December 31, 2011 was $78.4
million, compared with $74.4 million last year.
The Bank’s net income for the 2011 fourth quarter was $13.8
million, or $105.29 per diluted share, compared with $15.3 million,
or $117.16 per diluted share, in the 2010 fourth quarter. The
Bank’s net income for 2011 rose to $59.1 million, or $451.53 per
diluted share, from $53.0 million, or $405.06 per diluted share,
for 2010.
Balance Sheet
At December 31, 2011, net loans increased to $2.03 billion from
$2.01 billion at December 31, 2010. The Bank’s deposits grew 13.0%
to $3.39 billion at the end of 2011, from $3.00 billion at December
31, 2010. Non-interest bearing deposits represented 37.2% of total
deposits at December 31, 2011, versus 33.4% of total deposits at
December 31, 2010. Total assets increased to $4.66 billion at the
close of 2011 from $4.26 billion at December 31, 2010.
At December 31, 2011, Farmers & Merchants Bank remained
“well-capitalized” under all regulatory categories, with a total
risk-based capital ratio of 27.94%, a Tier 1 risk-based capital
ratio of 26.67%, and a Tier 1 leverage ratio of 14.26%. The minimum
ratios for capital adequacy for a well-capitalized bank are 10.00%,
6.00% and 5.00%, respectively.
“Farmers & Merchants Bank finished 2011 with an 11 percent
increase in full-year net income and a 13 percent increase in total
deposits, a testament to our strength and stability in a tough
economic environment,” said Daniel Walker, president and chairman
of the board. “We remain focused on the fundamentals that have
contributed to the Bank’s success for 105 years.”
About Farmers & Merchants Bank of Long Beach
Farmers & Merchants Bank of Long Beach provides personal and
business banking services through 21 offices in Los Angeles and
Orange Counties. Founded in 1907 by C.J. Walker, the Bank
specializes in commercial and small business banking along with
business loan programs.
FARMERS & MERCHANTS BANK OF LONG BEACH
Income Statements (Unaudited) (In Thousands)
Three Months
Ended Dec 31, Year ended December 31, 2011
2010 2011 2010 Interest income: Loans $
28,667 $ 28,796 $ 115,395 $ 115,928 Securities held to maturity
11,303 11,768 48,734 47,563 Securities available for sale 3,118
3,311 13,980 14,666 Deposits with banks 224 85 497 774 Total
interest income 43,312 43,960 178,606 178,931
Interest expense: Deposits 1,709 2,219 7,920 9,999
Securities sold under agreement to repurchase 294 449 1,535
2,043 Total interest expense 2,003 2,668 9,455 12,042 Net
interest income 41,309 41,292 169,151 166,889
Provision
for loan losses 5,450 6,500 14,200 25,950 Net int.
income after provision for loan losses 35,859 34,792 154,951
140,939
Non-interest income: Service charges on
deposit accounts 1,481 1,240 5,114 5,073 Gains on sale of
securities 71 - 174 870 Merchant bankcard fees 354 286 1,257 1,209
Escrow fees 220 188 924 790 Other 1,888 2,504 6,436 7,489
Total non-interest income 4,014 4,218 13,905 15,431
Non-interest expense: Salaries and employee benefits 9,850
9,631 41,814 40,165 FDIC and other insurance expense 1,643 1,265
4,671 4,881 Occupancy expense 1,374 1,465 5,501 5,696 Equipment
expense 1,322 1,345 5,435 5,102 Other real estate owned expense,
net 1,081 (520 ) 3,441 6,298 Legal and professional fees 1,321 689
3,896 2,436 Marketing and promotional expense 1,096 692 3,934 3,004
Other 2,177 2,166 9,736 6,846 Total non-interest expense
19,864 16,733 78,428 74,428 Income before income tax expense
20,009 22,277 90,428 81,942
Income tax expense 6,223 6,938
31,310 28,909
Net income $ 13,786
$ 15,339 $ 59,118 $
53,033 Basic and diluted earnings per common share $ 105.29
$ 117.16 $ 451.53 $ 405.06
FARMERS & MERCHANTS BANK OF LONG
BEACH
Balance Sheets (Unaudited) (In Thousands)
Dec. 31, 2011 Dec. 31, 2010
Assets Cash and due from banks: Noninterest-bearing balances
$ 57,394 $ 49,628 Interest-bearing balances 278,525 48,509
Investment securities 2,113,130 1,977,343 Gross loans 2,087,388
2,070,493 Less allowance for loan losses (58,463 ) (55,627 ) Less
unamortized deferred loan fees, net (418 ) (426 ) Net loans
2,028,507 2,014,440 Bank premises and equipment
55,155 51,650 Other real estate owned 23,036 37,300 Accrued
interest receivable 16,464 17,134 Deferred tax asset 28,583 27,032
Other assets 58,551 39,370
Total assets
$ 4,659,345 $ 4,262,406
Liabilities and stockholders' equity
Liabilities: Deposits: Demand, non-interest bearing $
1,263,162 $ 1,004,272 Demand, interest bearing 300,984 261,961
Savings and money market savings 909,794 754,446 Time deposits
919,538 983,314 Total deposits 3,393,478 3,003,993
Securities sold under agreements to repurchase 555,992 628,192
Accrued interest payable and other liabilities 39,659 7,141
Total liabilities 3,989,129
3,639,326 Stockholders' Equity:
Common Stock, par value $20; authorized
250,000 shares; issued and outstanding
130,928 shares
2,619 2,619 Surplus 12,044 12,044 Retained earnings 646,708 601,861
Other comprehensive income 8,845 6,556
Total
stockholders' equity 670,216 623,080
Total liabilities and stockholders' equity
$ 4,659,345 $ 4,262,406
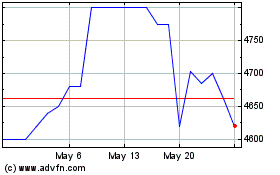
Farmers and Merchants Bank (QX) (USOTC:FMBL)
Historical Stock Chart
From Dec 2024 to Jan 2025

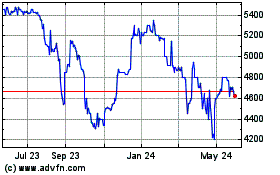
Farmers and Merchants Bank (QX) (USOTC:FMBL)
Historical Stock Chart
From Jan 2024 to Jan 2025
