Farmers & Merchants Bank of Long Beach (OTCBB: FMBL) today
reported financial results for the first quarter ended March 31,
2012.
“Farmers & Merchants’ first-quarter results reflect a strong
start for 2012, as we achieved solid profitability and continued to
grow the Bank’s deposit base,” said Henry Walker, chief executive
officer of Farmers & Merchants Bank of Long Beach. “During the
quarter, we also continued to enhance the Bank’s technology and
auditing teams with the naming of industry veteran Ken Nagel as
chief information officer and tenured accounting executive Frank
Coleman as chief auditor.”
Income Statement
For the three months ended March 31, 2012, interest income rose
to $46.3 million from $45.3 million in the first quarter of 2011.
Interest expense for the 2012 first quarter declined to $1.8
million from $2.6 million in the first quarter of 2011, primarily
related to the prolonged low interest rate environment.
Net interest income for the 2012 first quarter rose 4.10% to
$44.4 million from $42.7 million for the first quarter of 2011.
Farmers & Merchants’ net interest margin was 4.07% for the 2012
first quarter, compared with 4.29% in the 2011 first quarter.
Primarily due to a decrease in gross loans for the period ended
March 31, 2012, the Bank did not establish a provision for loan
losses in the first quarter of 2012, compared with a provision for
loan losses of $700,000 reported in the first quarter of 2011. The
Bank’s allowance for loan losses as a percentage of loans
outstanding was 2.86% at March 31, 2012, compared with 2.75% at
March 31, 2011.
Non-interest income was $5.2 million for the 2012 first quarter,
versus $3.3 million for the first quarter a year ago, principally
related to the gain realized from the resolution and conclusion of
a lending relationship.
Non-interest expense for the 2012 first quarter was $21.9
million, compared with $21.3 million for the same period last
year.
Net income for the 2012 first quarter totaled $18.5 million, or
$141.48 per diluted share, compared with net income of $15.3
million, or $117.18 per diluted share, for the 2011 first
quarter.
Balance Sheet
At March 31, 2012, net loans decreased to $1.97 billion from
$2.03 billion at December 31, 2011. The Bank’s deposits totaled
$3.53 billion at the end of the 2012 first quarter, compared with
$3.39 billion at December 31, 2011. Non-interest bearing deposits
represented 37.9% of total deposits at March 31, 2012, versus 37.2%
of total deposits at December 31, 2011. Total assets increased to
$4.77 billion at the close of the 2012 first quarter from $4.70
billion at December 31, 2011.
At March 31, 2012, Farmers & Merchants Bank remained
“well-capitalized” under all regulatory categories, with a total
risk-based capital ratio of 29.00%, a Tier 1 risk-based capital
ratio of 27.73%, and a Tier 1 leverage ratio of 14.45%. The minimum
ratios for capital adequacy for a well-capitalized bank are 10.00%,
6.00% and 5.00%, respectively.
“Farmers & Merchants’ first-quarter results reflect the
Bank’s ability to adapt and succeed in times of economic
uncertainty,” said Daniel Walker, president and chairman of the
board. “Despite a heightened regulatory environment, the Bank’s
sound fundamentals and steadfast commitment to personalized service
remained central to our performance.”
About Farmers & Merchants Bank of Long Beach
Farmers & Merchants Bank of Long Beach
provides personal and business banking services through 21 offices
in Los Angeles and Orange Counties. Founded in 1907 by C.J. Walker,
the Bank specializes in commercial and small business banking along
with business loan programs.
FARMERS & MERCHANTS BANK OF LONG BEACH
Income Statements (Unaudited) (In Thousands)
Three Months Ended March 31, 2012 2011
Interest income: Loans $ 31,410 $ 29,399 Securities
held-to-maturity 11,634 12,420 Securities available-for-sale 3,015
3,381 Deposits with banks 219 60 Total interest income
46,278 45,260
Interest expense: Deposits 1,567
2,133 Securities sold under agreement to repurchase 268 435
Total interest expense 1,835 2,568 Net interest income
44,443 42,692
Provision for loan losses - 700
Net int. income after provision for loan losses 44,443 41,992
Non-interest income: Service charges on
deposit accounts 1,199 1,171 Gains on sale of securities 42 7
Merchant bankcard fees 421 264 Escrow fees 166 205 Other income
3,343 1,642 Total non-interest income 5,171 3,289
Non-interest expense: Salaries and employee benefits
11,761 10,690 FDIC and other insurance expense 1,570 1,118
Occupancy expense 1,378 1,258 Equipment expense 1,337 1,315 Other
real estate owned expense,net 1,296 1,492 Amortization of
investments in low-income communities 2,201 451 Legal and
professional fees 464 751 Marketing and promotional expense 686 805
Other expenses 1,239 3,377 Total non-interest expense 21,932
21,257 Income before income tax expense 27,682 24,024
Income tax expense 9,159 8,682
Net income
$ 18,523 $ 15,342 Basic and
diluted earnings per common share $ 141.48 $ 117.18
FARMERS & MERCHANTS BANK OF LONG BEACH
Balance Sheets (Unaudited) (In Thousands)
Mar. 31, 2012 Dec. 31, 2011 Assets
Cash and due from banks:
Non-interest-bearing balances
$ 54,343 $ 57,394 Interest-bearing balances 377,812 278,525
Investment securities 2,189,675 2,113,130 Gross loans 2,032,631
2,087,388 Less allowance for loan losses (58,128 ) (58,463 ) Less
unamortized deferred loan fees, net (428 ) (418 ) Net loans
1,974,075 2,028,507 Other real estate owned 19,795
23,036 Investments in low-income communities 41,366 43,566 Bank
premises and equipment 55,052 55,155 Accrued interest receivable
16,232 16,464 Deferred tax asset 28,573 28,583 Other assets 12,490
14,985
Total assets $
4,769,413 $ 4,659,345
Liabilities and stockholders' equity
Liabilities: Deposits: Demand, non-interest bearing $
1,338,382 $ 1,263,162 Demand, interest bearing 321,741 300,984
Savings and money market savings 963,370 909,794 Time deposits
910,108 919,538 Total deposits 3,533,601
3,393,478 Securities sold under agreements to repurchase
502,919 555,992 Other liabilities 47,112 39,659
Total liabilities 4,083,632
3,989,129 Stockholders' Equity:
Common Stock, par value $20; authorized
250,000 shares; issued and outstanding 130,928 shares
2,619 2,619 Surplus 12,044 12,044 Retained earnings 662,481 646,708
Other comprehensive income 8,637 8,845
Total stockholders' equity 685,781
670,216 Total liabilities and stockholders'
equity $ 4,769,413 $
4,659,345
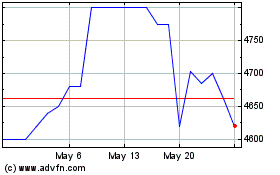
Farmers and Merchants Bank (QX) (USOTC:FMBL)
Historical Stock Chart
From Dec 2024 to Jan 2025

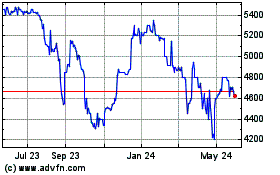
Farmers and Merchants Bank (QX) (USOTC:FMBL)
Historical Stock Chart
From Jan 2024 to Jan 2025
