(OTCBB: RYQG) Begins Oil Extraction on Oklahoma Well
December 09 2009 - 6:30AM
Marketwired
Royal Quantum Group, Inc. (OTCBB: RYQG) announced yesterday their
successful completion of their Bond #1-18 Well in Oklahoma.
The average oil well in Oklahoma produces two barrels of oil per
day (BOPD). The Bond #1-18 Well has an initial flow of 120 BOPD.
Crude oil prices have moved between $70 and $80 a barrel in recent
days.
The Wilcox Zone, where the Bond #1-18 Well is located, is one of
Oklahoma's most prolific oil producing zones. Oklahoma is the fifth
largest producer of crude oil in the nation with over 23 billion
dollars annually contributing to Oklahoma's gross domestic
product.
For more information, please visit www.royalquantum.com.
Other active stocks are Chesapeake Energy Corp. (NYSE: CHK),
Zenergy International (PINKSHEETS: ZENG) and Hercules Offshore
(NASDAQ: HERO).
Information, opinions and analysis contained herein are based on
sources believed to be reliable, but no representation, expressed
or implied, is made as to its accuracy, completeness or
correctness. The opinions contained herein reflect our current
judgment and are subject to change without notice. We accept no
liability for any losses arising from an investor's reliance on or
use of this report. This report is for information purposes only,
and is neither a solicitation to buy nor an offer to sell
securities. A third party has hired and paid IO News Wire twelve
hundred and ninety five dollars for the publication and circulation
of this news release. Certain information included herein is
forward-looking within the meaning of the Private Securities
Litigation Reform Act of 1995, including, but not limited to,
statements concerning manufacturing, marketing, growth, and
expansion. Such forward-looking information involves important
risks and uncertainties that could affect actual results and cause
them to differ materially from expectations expressed herein. We
have no ownership of equity, no representation; do no trading of
any kind and send no faxes or emails.
Contact: Eric Jensen www.ionewswire.com 516.942.4910
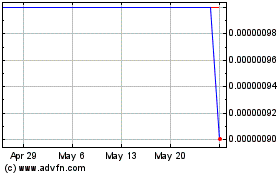
Zenergy (CE) (USOTC:ZENG)
Historical Stock Chart
From Nov 2024 to Dec 2024

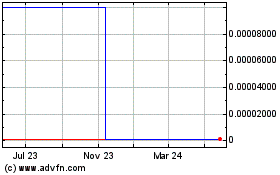
Zenergy (CE) (USOTC:ZENG)
Historical Stock Chart
From Dec 2023 to Dec 2024

Real-Time news about Zenergy International Inc (CE) (OTCMarkets): 0 recent articles
More IO News Wire News Articles