In the early part of the summer, commodity investors were zeroed
in on grains like wheat and corn thanks to the drought. This was
for good reason, as both of these commodities had incredible
returns during the time period, far outpacing index returns for
broad stock and commodity benchmarks.
In fact, ETNs tracking Corn (CORN) and
Wheat (WEET) are among the best performing in the
commodity world on a year-to-date basis, adding double digits in
the time frame, while the iPath Dow Jones-UBS Grains ETN
(JJG) is actually the best performing commodity product in
the entire ETP world from a year-to-date look, adding more than 37%
since January 1st (see Beyond Corn: Three Commodity ETFs
Surging This Summer).
Thanks to these impressive moves and the ubiquitous nature of
corn and wheat, many investors have overlooked another key staple
product that has not only had a great year, but has been storming
higher in recent sessions as well; soybeans. This product, as
represented by the Teucrium Soybean ETF (SOYB) is
quietly up 25% YTD and it could continue to march higher in the
near term thanks to unfavorable crop reports.
This could be especially true given the latest USDA crop
projections that just hit the market, sending soybean futures
higher yet again. In this latest release, American soybean
production will be down 14% from 2011 and will be at the lowest
level since 2003, possibly pushing U.S. output below Brazil for the
first time ever in the key crop (read Buy American with these Three
Commodity ETFs).
Furthermore, the USDA prediction was less than the Bloomberg
News analyst prediction, and is roughly 60 million bushels less
than what the USDA thought just a month ago. The situation becomes
even worse when investors add in a soybean-hungry Asia into the
mix, as China, the biggest importer of the staple, looks to see
demand rise to just over 75 million tons for the year, the ninth
straight increase, according to Bloomberg Businessweek.
Clearly the supply situation has baked into soybean futures and
ETFs an incredible price increase over the past few months. SOYB is
actually now one of the top five commodity ETPs on a year-to-date
look, while the commodity product is currently sporting a double
digit return since the start of August as well.
However, some believe that prices are starting to top out for
the commodity, or that the product is due for a breather in the
near term. Still, the futures curve is in heavy backwardation at
least until 2015—at time of writing—so investors could see some
gains in the near term before the product pulls back (see USAG in
Focus As Agricultural Commodity ETFs Soar).
Additionally, a slowdown in China could curtail demand for
soybean and one of its main uses, as a feed for hogs. Should this
take place, the high projections for Chinese demand could be a
little off base and may give soybeans some room on the
supply/demand front heading into 2013.
Lastly, it is also important to note how SOYB’s structure could
influence returns going forward. After all, the product, unlike
many commodity ETFs, doesn’t just cycle into the next month as
expiration approaches, rather it uses a much more in-depth
approach.
The ETF uses three futures contracts for soybeans, all of which
are traded on the CBOT. The three contracts include (1) the
2nd-to-expire contract, weighted 35%, (2) the 3rd-to-expire
contract, weighted 30%, and (3) the contract expiring in the
November following the expiration month of the 3rd-to-expire
contract, weighted 35%.
Teucrium believes that this spread out approach can reduce
contango and thus help investors achieve better returns during
unfavorable commodity environments. However, this strategy could
backfire in rare times like this in which the market is extremely
backwardated, as the product could gain less from the roll as it
might if it was just shifting from one month to the next (see Is
USCI The Best Commodity ETF?).
Thanks to this, SOYB could be an interesting short-term play,
but it might not do as well as some investors might expect over the
longer term. Not only will the futures curve not be as helpful, but
a slowdown in China or recent rains in the heartland could help to
boost the supply/demand balance in favor of production.
Given this reality, investors should use caution when investing
in this commodity ETF, although the short term trend is definitely
bullish and could provide quick traders with gains before September
is over. After all, the company’s Corn ETF, while a top performer
from earlier in the summer, has been flat to negative in the
trailing one month period despite the relatively favorable supply
picture (also see What Happened to the Sugar ETF?).
Although CORN is still up significantly on the year, there
should be some concern among agricultural ETF investors that a
comparable situation is happening in the soybean market as well.
SOYB’s current performance is eerily similar to what CORN saw
earlier in the year, so while the curve may be favorable and
supplies tight, investors should definitely proceed with caution
before taking a dive on soybeans to close out 2012.
Want the latest recommendations from Zacks Investment Research?
Today, you can download 7 Best Stocks for the Next 30
Days. Click to get this free report >>
Follow @Eric Dutram on Twitter
TEUCRM-CORN FD (CORN): ETF Research Reports
IPATH-DJ-A GRNS (JJG): ETF Research Reports
TEUCRM-SOYBEAN (SOYB): ETF Research Reports
IPATH-PB GRAINS (WEET): ETF Research Reports
To read this article on Zacks.com click here.
Zacks Investment Research
Want the latest recommendations from Zacks Investment Research?
Today, you can download 7 Best Stocks for the Next 30 Days. Click
to get this free report
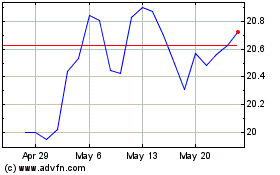
Teucrium Corn (AMEX:CORN)
Historical Stock Chart
From Dec 2024 to Jan 2025

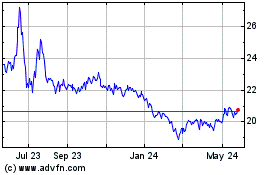
Teucrium Corn (AMEX:CORN)
Historical Stock Chart
From Jan 2024 to Jan 2025
