Thanks to improving global sentiment and growing investor
confidence, 2013 has been a good year so far for both the equity
markets and the ETF industry. Fund inflows have been strong and a
host of new products have hit the market over the past few
weeks.
In fact, in February alone, ETFs saw inflows over $8 billion
(read: Best and Worst Performing ETFs of February). With this,
total AUM reached the $1.426 trillion mark, which is shy of the
all-time record of $1.437 trillion, but 19% higher than $1.201
trillion reported in the year-ago period.
Despite the significant volatility in the month, the equity
funds experienced the heaviest inflows followed by fixed income
funds. Investors should note that commodities lost over $3.8
billion in assets due in large part to the terrible performance by
gold and gold ETFs (read: Have We Seen the Bottom in Gold
ETFs?).
Below, we have discussed the three ETFs that were extremely
popular in February. These funds not only attracted many investors,
but also performed better than the broad market index funds, and
could be poised for further gains in March.
WisdomTree Japan Hedged Equity Fund (DXJ)
This is the most popular ETF of February, having gathered over
$1.7 billion in the time frame. This is largely thanks to the
concerns over a declining yen, helping to propel the fund’s asset
base to nearly $4.3 billion.
This ETF seeks to match the price and yield of the WisdomTree
Japan Hedged Equity Index, before fees and expenses. At the same
time, the fund also provides a hedge against a drop in the currency
against the U.S. dollar, a reason why the ETF experienced a huge
inflow (read: Japan ETFs: Six Ways to Play the Surge).
The product offers a broader play on the Japanese equity market
providing exposure to 274 stocks. Mitsubishi UFJ Financial (MTU),
Takeda Pharmaceutical (TKPYY) and Canon (CAJ) occupy the top three
positions in the fund’s basket.
From a sector perspective, the fund is heavy on industrials with
roughly 23.47% share, closely followed by consumer discretionary
and information technology with 18.75% and 15.83% of the assets,
respectively.
DXJ has been the one of the performing ETFs in the Japanese
space, gaining 13% so far in the year. In fact, the fund has
outpaced the broad market fund, SPY, by a wide margin of 620 bps.
The fund charges a fee of 48 basis points on an annual basis.
The ETF has a Zacks ETF Rank #3 or ‘Hold’ rating.
iShares Russell 2000 Index Fund (IWM)
The second winner in the ETF space is this small cap focused
iShares product, which is designed to deliver the returns of the
U.S. small cap segment (read: Try Small Cap ETFs to Gain from
Chinese Domestic Demand). The product pulled in about $1.1 billion
in February, accumulating over $19.2 billion in its asset base
while charging 25 bps in fees per year.
Holding 1967 securities in the basket, the fund tracks the
Russell 2000 Index, which is a capitalization weighted 2,000-stock
subset of the Russell 3000 Index. The product eliminates specific
company risks as it puts too little assets in each security.
Pharmacyclics (PCYC), Ocwen Financial (OCL) and Genesee &
Wyoming (GWR) are the top three elements in the basket. None of the
individual securities holds more than 0.3% share of the total,
suggesting extreme diversification.
However, the product is tilted towards financial services and
consumer discretionary sectors, which together make up for 38% of
the total assets. IWM generated solid returns of about 7.8% YTD,
outperforming SPY by 100 bps.
The ETF also pays an annual dividend of 1.86%, which isn’t
too bad considering the growth focus of the fund (read: Forget SPY,
Focus on Mid and Small Cap ETFs).
IWM has a Zacks ETF Rank #3 or ‘Hold’ rating with low risk
tolerance level.
iShares Dow Jones U.S. Real Estate ETF
(IYR)
This was another successful product in February, attracting $846
million in new capital. The ETF targets the real estate space by
tracking the Dow Jones U.S. Real Estate Index and has amassed $5.4
billion in AUM so far.
The product manages a basket of 89 real estate companies with
40.5% of the asset base invested in the top 10 holdings. Simon
Property (SPG) takes the top spot in the basket with 8.71% share.
Beyond this, American Tower (AMT) and HCP Inc. (HCP) occupy the
next two positions with combined 9.4% of IYR (see more ETFs in the
Zacks ETF Center).
With respect to the sector, specialty and retail REITS
collectively take 50% of the assets in the basket. Investors have
to pay 46 bps in annual fees for this exposure. IYR returned over
5% so far this year and yields a good annual dividend of 3.52%.
We can summarize the three funds in the following table:
|
Funds
|
Category
|
Net Flows ($ in millions)
|
AUM ($ in millions)
|
Expense Ratio
|
YTD Returns (as of March 1,
2013)
|
|
DXJ
|
Japan Equities
|
1,734.80
|
4,311.90
|
0.48%
|
12.99%
|
|
IWM
|
Small Cap Blend
|
1,072.23
|
19,217.10
|
0.25%
|
7.79%
|
|
IYR
|
Real Estate
|
846.07
|
5,425.20
|
0.46%
|
5.54%
|
Want the latest recommendations from Zacks Investment Research?
Today, you can download 7 Best Stocks for the Next 30
Days. Click to get this free report >>
WISDMTR-J HEF (DXJ): ETF Research Reports
ISHARES TR-2000 (IWM): ETF Research Reports
ISHARS-DJ REAL (IYR): ETF Research Reports
To read this article on Zacks.com click here.
Zacks Investment Research
Want the latest recommendations from Zacks Investment Research?
Today, you can download 7 Best Stocks for the Next 30 Days. Click
to get this free report
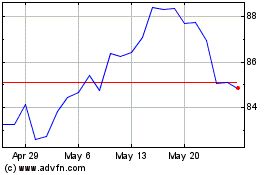
iShares US Real Estate (AMEX:IYR)
Historical Stock Chart
From Jan 2025 to Feb 2025

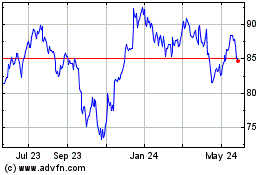
iShares US Real Estate (AMEX:IYR)
Historical Stock Chart
From Feb 2024 to Feb 2025
