Solana Slips To $209: Rising Bearish Pressure Threatens Key Support
December 17 2024 - 10:30AM
NEWSBTC
Solana is navigating a critical juncture as its price edges toward
the $209 mark under increasing bearish pressure. Recent market
dynamics have tilted in favor of the bears, challenging SOL’s
previous upward momentum. The $209 level now emerges as a crucial
line of defense, with the bulls required to act swiftly to prevent
deeper losses and regain control of the market narrative. This
heightened selling pressure highlights growing uncertainty, making
the stakes even higher for both sides of the market. If the bulls
manage to hold the line, it may signal strength and set the stage
for a potential rebound. However, failure to defend this level
could pave the way for further downside, reinforcing the bearish
outlook. Solana Nears The Critical $209 Support Level Recent price
movements indicate that Solana is under significant downside
pressure as it approaches the crucial $209 support level. This
decline comes despite the cryptocurrency remaining above the
100-day Simple Moving Average (SMA), a key indicator often
associated with broader bullish trends. The negative sentiment has
overshadowed the SMA’s support, signaling possible vulnerability in
SOL’s price structure. Related Reading: Solana To New ATH Before
Christmas – Analyst Expects $300 Soon While the 100-day SMA
typically acts as a safety net for upward momentum, the increased
selling pressure suggests that bears are testing the strength of
this support. If Solana fails to hold above the $209 mark, it might
invalidate the SMA’s bullish influence, paving the way for deeper
losses. However, a rebound at this level could reaffirm the SMA’s
role in sustaining the positive outlook, setting the stage for
potential recovery. Furthermore, the 1-day Relative Strength Index
(RSI) is trending below the critical 50% threshold, signaling a
shift in market sentiment toward bearish dominance. The RSI, a
widely used momentum indicator, measures the speed and magnitude of
price movements. When it dips below 50%, it typically indicates
weakening buying pressure. This downward trend in the RSI reflects
the increased bearish influence on Solana’s price, aligning with
its recent decline toward the $209 support level. Sustaining its
position below 50% suggests that bulls may be losing their grip,
making it imperative for them to regain control soon to prevent
further losses. Should the RSI continue to decline, it could
reinforce the negative outlook, potentially leading to a deeper
price correction. Potential Scenarios: Rebound Or Further Decline?
Solana’s price, currently hovering near the $209 support level,
sets up two potential scenarios: a bullish rebound or an extended
decline. If the price successfully rebounds from this level, it may
indicate strength and resilience, possibly pushing Solana toward
higher resistance levels, such as $240 and $260, while reigniting
its uptrend. Related Reading: Solana Price On The Rise: Key
Resistance At $235 Could Spark Major Breakout However, failing to
hold above $209 could intensify selling pressure, potentially
driving the price lower toward $194 as bearish dominance takes
hold. A break below this level would heighten the risk of more
drops, with Solana testing the 100-day SMA as the next key support.
Featured image from iStock, chart from Tradingview.com
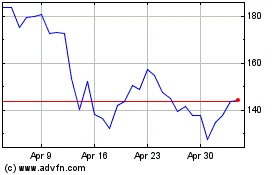
Solana (COIN:SOLUSD)
Historical Stock Chart
From Nov 2024 to Dec 2024

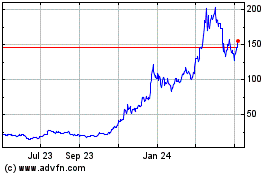
Solana (COIN:SOLUSD)
Historical Stock Chart
From Dec 2023 to Dec 2024
