ONDO Faces 30% Correction Risk If It Loses $1.46 Support – Top Analyst
December 26 2024 - 11:30AM
NEWSBTC
Ondo Finance has faced significant challenges in recent weeks, with
its price dropping over 30% from its all-time high of $2.14.
Despite the recent downturn, many analysts remain optimistic about
ONDO’s potential for recovery, citing its strong performance
earlier this cycle as evidence of its resilience. As one of the
top-performing altcoins, ONDO has consistently attracted investor
attention, leading to speculation about its next move. Related
Reading: Bitcoin Is Forming A Symmetrical Triangle – Can BTC
Reclaim $100K? However, caution is warranted. Renowned analyst Ali
Martinez recently shared a technical analysis warning that ONDO may
be at risk of further correction. Martinez highlights the potential
formation of a head-and-shoulders pattern on the price chart, a
bearish signal often associated with trend reversals. If this
pattern plays out, it could lead to increased selling pressure and
a deeper pullback. The coming days will be critical for Ondo
Finance as it navigates this pivotal moment. Investors will closely
watch whether the token can defy bearish signals and reignite
bullish momentum or if the feared pattern will confirm, leading to
additional declines. For now, ONDO’s future hangs in the balance,
with market sentiment and technical indicators offering conflicting
signals about its short-term trajectory. ONDO Testing Crucial
Demand Ondo Finance has faced a significant correction after its
strong rally earlier in the cycle, now testing crucial demand
levels at key price points. The token’s price halted at its
previous all-time high, around $1.50, which now serves as a pivotal
support level. If It holds above this mark, bullish momentum could
return, potentially setting the stage for a renewed uptrend.
However, top analyst Ali Martinez has raised concerns with a
technical analysis that suggests ONDO may be forming a bearish
head-and-shoulders pattern. This pattern, if confirmed, typically
signals a trend reversal and could lead to increased selling
pressure. Martinez warns that a decisive close below the $1.48
level could trigger a steep 30% correction, driving ONDO’s price
down to approximately $1.05. Such a move would represent a
significant setback for the token and its investors. Related
Reading: Solana Sees Consistent Capital Inflows Since 2023 –
Liquidity Influx Signals Growth To invalidate this bearish
scenario, ONDO must reclaim the $1.86 level as support, a move that
would signal strength and restore confidence in the asset’s bullish
potential. Until then, the market remains at a critical juncture,
with traders closely monitoring price action for clues about ONDO’s
next direction. The coming days will be decisive in determining
whether ONDO can recover or faces further downside risk. Technical
Analysis: What To Expect Ondo Finance (ONDO) is currently trading
at $1.49 after successfully testing the critical $1.46 support
level highlighted by top analyst Ali Martinez. This level has
proven to be a significant line of defense for ONDO, reflecting
strong buying interest at this price. The token appears stable for
now, but market participants remain cautious, as broader market
conditions could still impact ONDO’s trajectory. The recent
resilience at $1.46 is encouraging, suggesting that ONDO may be
building a foundation for a potential recovery. However, a
market-wide retrace could put additional pressure on ONDO, possibly
driving its price lower and retesting critical demand levels.
Investors are keeping a close eye on key technical levels for
confirmation of a bullish rebound. Related Reading: XRP Whales Keep
Buying – Data Reveals Smart Money Prepares For A Rally For ONDO to
regain upward momentum, reclaiming the $1.70 level in the coming
days is essential. A decisive move above this mark would signal
renewed strength, paving the way for a bullish recovery and
potentially retesting previous highs. Until then, ONDO remains in a
delicate position, with traders monitoring broader market sentiment
and the asset’s ability to sustain current support levels. The next
steps will be crucial in determining whether ONDO can resume its
uptrend or face continued consolidation. Featured image from
Dall-E, chart from TradingView
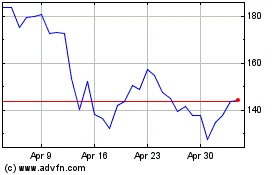
Solana (COIN:SOLUSD)
Historical Stock Chart
From Dec 2024 to Jan 2025

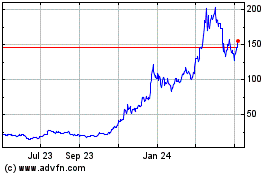
Solana (COIN:SOLUSD)
Historical Stock Chart
From Jan 2024 to Jan 2025
