- Revenue of $66 million, +17% year-over-year; WAU of 45.9
million, +13% year-over-year
- GAAP net loss of $15 million; Adjusted EBITDA loss of $1
million, representing year-over-year margin improvement of 33
percentage points
- Increases full-year 2024 financial outlook
Nextdoor Holdings, Inc. (NYSE: KIND), the essential neighborhood
network, today reported financial results for the third quarter
ended September 30, 2024.
Nextdoor's highlighted metrics for the quarter ended September
30, 2024 include:
- Total Weekly Active Users (WAU) of 45.9 million increased 13%
year-over-year.
- Revenue of $66 million increased 17% year-over-year.
- Net loss was $15 million, compared to $38 million in the
year-ago period.
- Adjusted EBITDA loss was $1 million, compared to $20 million in
the year-ago period.
- Ending cash, cash equivalents, and marketable securities were
$425 million as of September 30, 2024.
"Our Q3 results demonstrate improved growth and operational
efficiency," said Nextdoor CEO Nirav Tolia. "WAU increased 13%
year-over-year as we continue to attract and engage users with
relevant local content. Revenue increased 17% year-over-year
reflecting improved ease of use and better performance for
advertisers using our Nextdoor Ads Platform."
"We are executing with precision and purpose, better allocating
resources toward growth, and have raised our FY 2024 outlook. I'm
confident we will continue to deliver solid performance, while also
developing NEXT, our complete product transformation."
For more detailed information on our operating and financial
results for the third quarter ended September 30, 2024, as well as
our outlook for Q4 and fiscal year 2024, please reference our
Shareholder Letter posted to our Investor Relations website located
at investors.nextdoor.com.
Three Months Ended September
30,
Nine Months Ended September
30,
(in thousands)
2024
2023
2024
2023
Revenue
$
65,610
$
56,092
$
182,048
$
162,752
Loss from operations
$
(20,777
)
$
(44,376
)
$
(104,542
)
$
(124,630
)
Net loss
$
(14,898
)
$
(38,116
)
$
(85,940
)
$
(107,235
)
Adjusted EBITDA(1)
$
(1,317
)
$
(19,799
)
$
(21,311
)
$
(60,065
)
(1) The following is a reconciliation of
net loss, the most comparable GAAP measure, to adjusted EBITDA for
the periods presented above:
Three Months Ended September
30,
Nine Months Ended September
30,
(in thousands)
2024
2023
2024
2023
Net loss
$
(14,898
)
$
(38,116
)
$
(85,940
)
$
(107,235
)
Depreciation and amortization
777
1,451
3,307
4,356
Stock-based compensation
18,440
23,343
54,181
60,735
Interest income
(5,804
)
(6,766
)
(19,059
)
(18,635
)
Provision for income taxes
168
289
683
714
Restructuring charges
—
—
25,517
—
Adjusted EBITDA
$
(1,317
)
$
(19,799
)
$
(21,311
)
$
(60,065
)
Net loss % Margin
(23
)%
(68
)%
(47
)%
(66
)%
Adjusted EBITDA % Margin
(2
)%
(35
)%
(12
)%
(37
)%
Nextdoor will host a conference call at 2:00 p.m. PT/5:00 p.m.
ET today to discuss these results and outlook. A live webcast of
our third quarter 2024 earnings release call will be available in
the Events & Presentations section of Nextdoor’s Investor
Relations website. After the live event, the audio recording for
the webcast can be accessed on the same website for approximately
one year.
Nextdoor uses its Investor Relations website
(investors.nextdoor.com), its X handle (X.com/Nextdoor), and its
LinkedIn Home Page (linkedin.com/company/nextdoor-com) as a means
of disseminating or providing notification of, among other things,
news or announcements regarding its business or financial
performance, investor events, press releases, and earnings
releases, and as a means of disclosing material nonpublic
information and for complying with its disclosure obligations under
Regulation FD.
Non-GAAP Financial Measures
To supplement our condensed consolidated financial statements,
which are prepared in accordance with GAAP, we present certain
non-GAAP financial measures, such as adjusted EBITDA and adjusted
EBITDA margin, in this press release. Our use of non-GAAP financial
measures has limitations as an analytical tool, and these measures
should not be considered in isolation or as a substitute for
analysis of financial results as reported under GAAP.
We use non-GAAP financial measures in conjunction with financial
measures prepared in accordance with GAAP for planning purposes,
including in the preparation of our annual operating budget, as a
measure of our core operating results and the effectiveness of our
business strategy, and in evaluating our financial performance.
Non-GAAP financial measures provide consistency and comparability
with past financial performance, facilitate period-to-period
comparisons of core operating results, and also facilitate
comparisons with other peer companies, many of which use similar
non-GAAP financial measures to supplement their GAAP results. In
addition, adjusted EBITDA is widely used by investors and
securities analysts to measure a company's operating performance.
We exclude the following items from one or more of our non-GAAP
financial measures: stock-based compensation expense (non-cash
expense calculated by companies using a variety of valuation
methodologies and subjective assumptions), depreciation and
amortization (non-cash expense), interest income, provision for
income taxes, and, if applicable, restructuring charges or
acquisition-related costs.
Investors are cautioned that there are material limitations
associated with the use of non-GAAP financial measures as an
analytical tool. In particular, (1) stock-based compensation
expense has recently been, and will continue to be for the
foreseeable future, a significant recurring expense for our
business and an important part of our compensation strategy, (2)
although depreciation and amortization expense are non-cash
charges, the assets subject to depreciation and amortization may
have to be replaced in the future, and our non-GAAP measures do not
reflect cash capital expenditure requirements for such replacements
or for new capital expenditure requirements, and (3) adjusted
EBITDA does not reflect: (a) changes in, or cash requirements for,
our working capital needs; (b) interest expense, or the cash
requirements necessary to service interest or principal payments on
our debt, which reduces cash available to us; or (c) tax payments
that may represent a reduction in cash available to us. The
non-GAAP measures we use may be different from non-GAAP financial
measures used by other companies, limiting their usefulness for
comparison purposes. We compensate for these limitations by
providing specific information regarding the GAAP items excluded
from these non-GAAP financial measures.
About Nextdoor
Nextdoor (NYSE: KIND) is the essential neighborhood network.
Neighbors, public agencies and businesses use Nextdoor to connect
around local information that matters in more than 340,000
neighborhoods across 11 countries. Nextdoor builds innovative
technology to foster local community, and brands and businesses of
all sizes use Nextdoor’s proprietary advertising platform to engage
with neighborhoods at scale. Download the app and join the
neighborhood at nextdoor.com. For more information and media
assets, visit nextdoor.com/newsroom.
View source
version on businesswire.com: https://www.businesswire.com/news/home/20241106589586/en/
Investor Relations:
John T. Williams ir@nextdoor.com or visit
investors.nextdoor.com
Media Relations:
Kelsey Grady Antonia Gray press@nextdoor.com
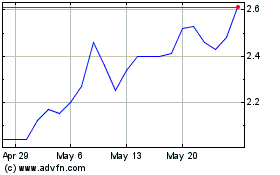
Nextdoor (NYSE:KIND)
Historical Stock Chart
From Dec 2024 to Jan 2025

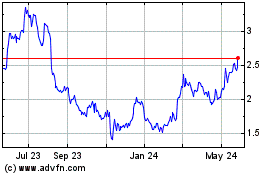
Nextdoor (NYSE:KIND)
Historical Stock Chart
From Jan 2024 to Jan 2025
