FORM
6-K
U.S.
SECURITIES AND EXCHANGE COMMISSION
Washington, D.C. 20549
Report of Foreign Private Issuer
Pursuant to Rule 13a-16 or 15d-16 of
the Securities Exchange Act of 1934
Commission File Number: 1-15270
For the month of November 2023
NOMURA
HOLDINGS, INC.
(Translation of registrant’s name into English)
13-1, Nihonbashi 1-chome
Chuo-ku, Tokyo 103-8645
Japan
(Address of
principal executive offices)
Indicate by check mark whether the registrant files or will file annual reports under cover Form 20-F
or Form 40-F.
Form
20-F X Form 40-F
Indicate by check mark if the registrant is submitting the Form 6-K in paper as permitted by
Regulation S-T Rule 101(b)(1):
Indicate by check mark if the registrant is
submitting the Form 6-K in paper as permitted by Regulation S-T Rule 101(b)(7):
Information furnished on this form:
EXHIBIT
Exhibit
Number
SIGNATURES
Pursuant to the requirements of the Securities Exchange Act of 1934, the registrant has duly caused this report to be signed on its behalf by
the undersigned, thereunto duly authorized.
|
|
|
|
|
|
|
NOMURA HOLDINGS, INC. |
|
|
|
| Date: November 1, 2023 |
|
By: |
|
/s/ Yoshifumi Kishida |
|
|
|
|
Yoshifumi Kishida |
|
|
|
|
Senior Managing Director |
NOMURA Connecting Markets East & West
© Nomura (US GAAP) October 2023 Consolidated Results of Operations Second quarter, year ending March 2024 Nomura Holdings, Inc.
Outline NOMURA Presentation Financial Supplement
Executive summary (P2-3) Overview of results (P4) Business segment results (P5) Retail (P6-8) Investment Management (P9-10)
Wholesale (P11-13) Non-interest expenses (P14) Robust financial position (P15) Consolidated balance sheet (P17) Value at risk (P18) Consolidated financial high lights (P19) Consolidated income (P20) Main
revenue items (P21) Consolidated results: Income (loss) before income taxes by segment and region (P22) Segment “Other” (P23) Retail related data (P24-27) Investment Management related data (P28-29) Whole sale related data (P30) Number of employees (P31)
|

|
NOMURA Executive summary (1/2) FY2023/24 1H
highlights ® Income before income taxes: Y103bn (+138% YoY); Net income1: Y58.6bn (3.2x YoY); EPS2: Y18.62; ROE3: 3.6% ® Three segment income before income taxes of Y89.2bn (+79% YoY) - Realignment of organization done in Spring to better
meet needs of clients, coupled with stock market rally, resulted in rebound in Retail performance - Investment Management performance improved: Net inflows lifted AuM to record high; Stable business revenues increased and investment gain/loss
improved - Wholesale income before income taxes declined: Equities and Investment Banking reported higher revenues, but international Fixed Income (notably Rates and FX/EM) were muted due to market uncertainty ® Half-year dividend per share: Y8
FY2023/24 FY2022/23 Income (loss) before income taxes: FY2023/24 FY2022/23 YoY YoY 1H 1H Business segment results 1H 1H Retail Y52.0bn Y10.4bn 5.0x Net revenue Y716.7bn Y617.0bn 16% Investment Management Y26.8bn
-Y6.2bn -Income (loss) before Y103.0bn Y43.2bn 138% -77% income taxes Wholesale Y10.4bn Y45.5bn Net income (loss)1 Y58.6bn Y18.5bn 3.2x Three segment total Y89.2bn
Y49.7bn 79% Other Y15.4bn -Y1.8bn -EPS2 Y18.62 Y5.91 3.2x Unrealized gain (loss) on investments in -Y1.6bn -Y4.7bn -equity
securities held for operating purposes ROE3 3.6% 1.2% Income (loss) before income taxes Y103.0bn Y43.2bn 138% 1. Net income (loss) attributable to Nomura Holdings shareholders. 2. Diluted net income (loss) attributable to Nomura Holdings
shareholders per share. 2 3. Calculated using annualized net income attributable to Nomura Holdings shareholders for each period.
|
|
NOMURA Executive summary (2/2) Income (loss) before
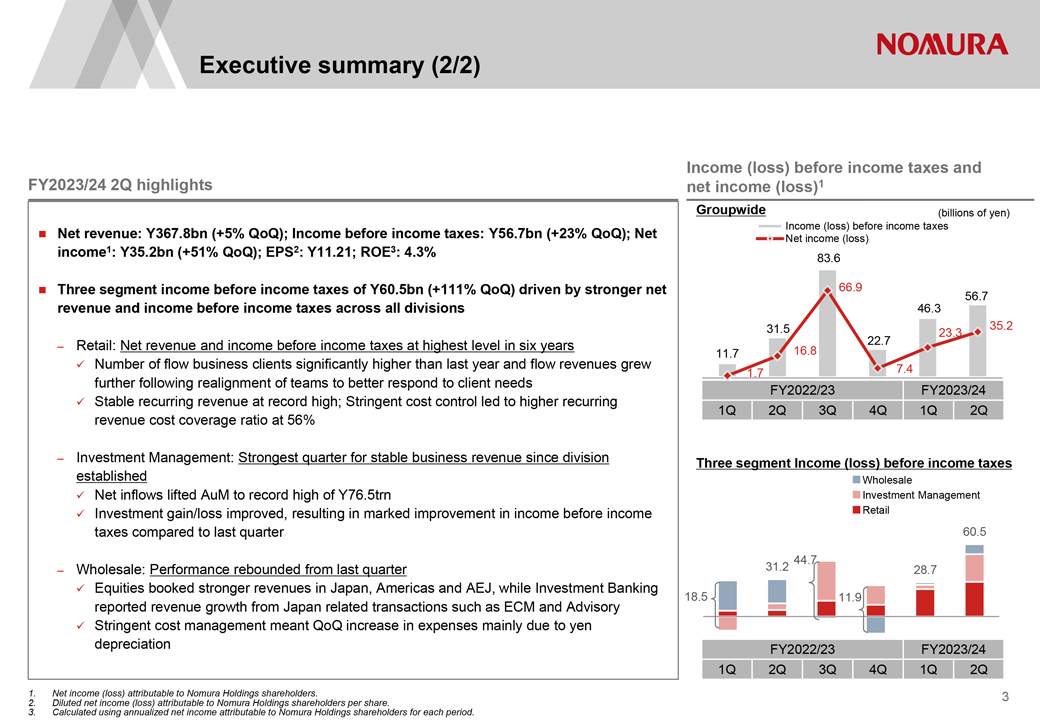
income taxes and FY2023/24 2Q highlights net income (loss)1 Groupwide (billions of yen) Income (loss) before income taxes ® Net revenue: Y367.8bn (+5% QoQ); Income before income taxes: Y56.7bn (+23% QoQ); Net Net income (loss) income1: Y35.2bn
(+51% QoQ); EPS2: Y11.21; ROE3: 4.3% 83.6 ® Three segment income before income taxes of Y60.5bn (+111% QoQ) driven by stronger net 66.9 56.7 revenue and income before income taxes across all divisions 46.3 31.5 35.2 23.3 Retail: Net revenue and
income before income taxes at highest level in six years 22.7 – 16.8 11.7 ƒ¼ Number of flow business clients significantly higher than last year and flow revenues grew 7.4 1.7 further following realignment of teams to better respond
to client needs FY2022/23 FY2023/24 ƒ¼ Stable recurring revenue at record high; Stringent cost control led to higher recurring 1Q 2Q 3Q 4Q 1Q 2Q revenue cost coverage ratio at 56% – Investment Management: Strongest quarter for stable
business revenue since division Three segment Income (loss) before income taxes established Wholesale ƒ¼ Net inflows lifted AuM to record high of Y76.5trn Investment Management ƒ¼ Investment gain/loss improved, resulting in
marked improvement in income before income Retail taxes compared to last quarter 60.5 44.7 – Wholesale: Performance rebounded from last quarter 31.2 28.7 ƒ¼ Equities booked stronger revenues in Japan, Americas and AEJ, while
Investment Banking 18.5 11.9 reported revenue growth from Japan related transactions such as ECM and Advisory Stringent cost management meant QoQ increase in expenses mainly due to yen depreciation FY2022/23 FY2023/24 1Q 2Q 3Q 4Q
1Q 2Q 1. Net income (loss) attributable to Nomura Holdings shareholders. 3 2. Diluted net income (loss) attributable to Nomura Holdings shareholders per share. 3. Calculated using annualized net income attributable to Nomura Holdings shareholders
for each period.
|
|
Overview of results Highlights (billions of yen,
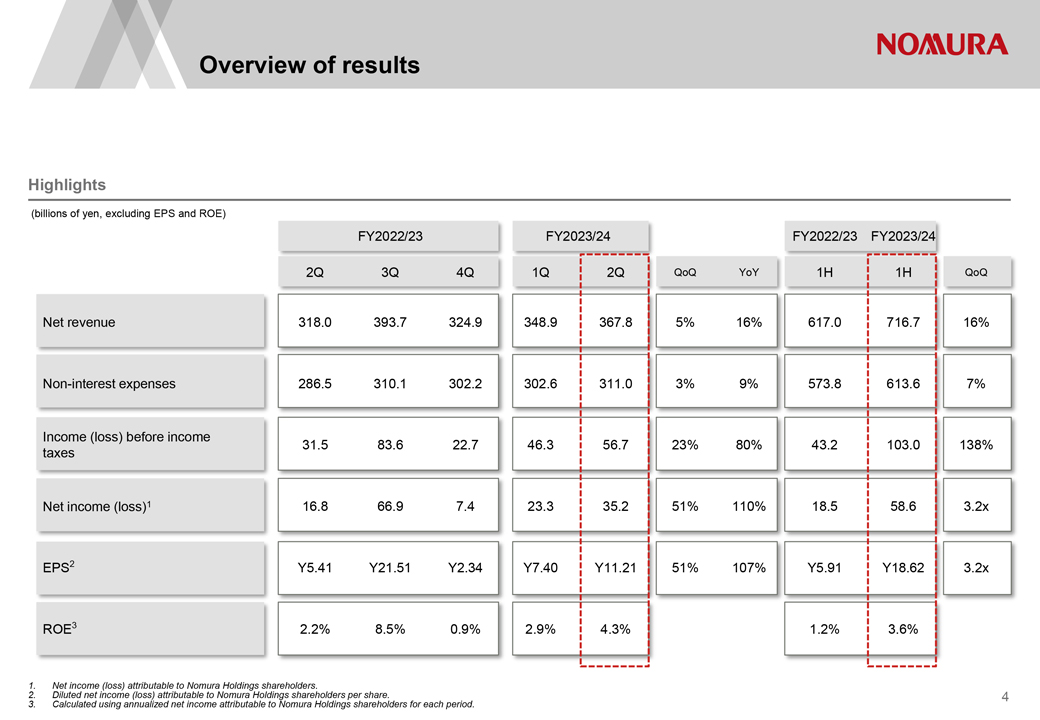
excluding EPS and ROE) FY2022/23 FY2023/24 FY2022/23 FY2023/24 2Q 3Q 4Q 1Q 2Q QoQ YoY 1H 1H QoQ Net revenue 318.0 393.7 324.9 348.9 367.8 5% 16% 617.0 716.7 16% Non-interest expenses 286.5 310.1 302.2 302.6
311.0 3% 9% 573.8 613.6 7% Income (loss) before income 31.5 83.6 22.7 46.3 56.7 23% 80% 43.2 103.0 138% taxes Net income (loss)1 16.8 66.9 7.4 23.3 35.2 51% 110% 18.5 58.6 3.2x EPS2 Y5.41 Y21.51 Y2.34 Y7.40 Y11.21 51% 107% Y5.91 Y18.62 3.2x ROE3
2.2% 8.5% 0.9% 2.9% 4.3% 1.2% 3.6% 1. Net income (loss) attributable to Nomura Holdings shareholders. 2. Diluted net income (loss) attributable to Nomura Holdings shareholders per share. 4 3. Calculated using annualized net income attributable to
Nomura Holdings shareholders for each period.
|

|
NOMURA Business segment results Net revenue and
income (loss) before income taxes (billions of yen) FY2022/23 FY2023/24 FY22/23 FY23/24 2Q 3Q 4Q 1Q 2Q QoQ YoY 1H 1H YoY Net revenue Retail 72.5 81.0 75.3 92.1 98.9 7% 36% 143.9 191.0 33% Investment Management 26.2 57.0 37.8 26.5 45.1 70% 72% 33.8
71.6 112% Wholesale 205.5 189.1 178.8 190.9 204.1 7% -1% 404.5 394.9 -2% Subtotal 304.2 327.0 292.0 309.4 348.1 13% 14% 582.1 657.6 13% Other* 15.6 87.3 37.9 43.8 17.0 -61% 9% 39.5 60.7 54% Unrealized gain (loss) on investments in equity securities held for operating -1.8 -20.7 -4.9 -4.3 2.7 — -4.7 -1.6 -purpose Net revenue 318.0 393.7 324.9 348.9 367.8 5% 16% 617.0
716.7 16% Retail 5.5 13.3 9.8 22.9 29.0 27% 5.3x 10.4 52.0 5.0x Income (loss) before Investment Management 5.6 33.3 16.4 3.6 23.2 6.4x 4.2x -6.2 26.8 -income taxes Wholesale 20.2
-1.9 -14.2 2.1 8.3 3.9x -59% 45.5 10.4 -77% Subtotal 31.2 44.7 11.9 28.7 60.5 111% 94%
49.7 89.2 79% Other* 2.1 59.5 15.7 21.9 -6.5 -1.8 15.4—Unrealized gain (loss) on investments in equity securities held for operating
-1.8 -20.7 -4.9 -4.3 2.7 — -4.7 -1.6 -purpose Income (loss) before income taxes 31.5 83.6 22.7 46.3 56.7 23% 80% 43.2 103.0 138% *Additional information on “Other” ® Loss related to economic hedging (Y8.9bn) (FY2023/24 2Q) ® Loss
on changes to own and counterparty credit spread relating to Derivatives (Y1.8bn) 5
|
|
NOMURA Retail Net revenue and net income before
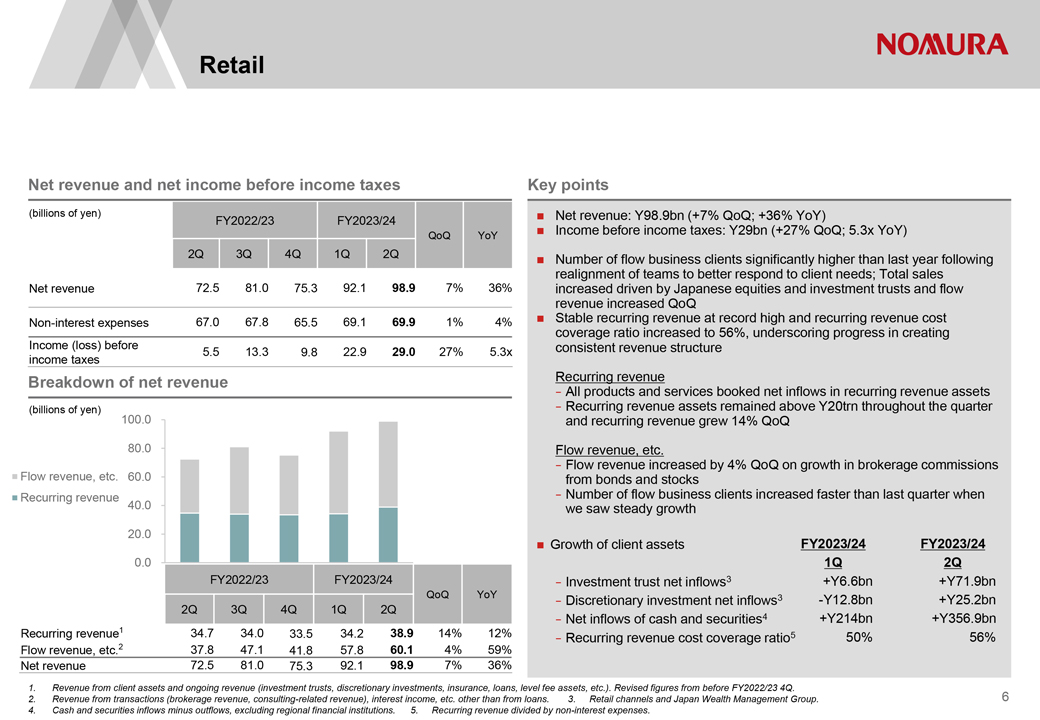
income taxes Key points (billions of yen) ® Net revenue: Y98.9bn (+7% QoQ; +36% YoY) FY2022/23 FY2023/24 QoQ YoY ® Income before income taxes: Y29bn (+27% QoQ; 5.3x YoY) 2Q 3Q 4Q 1Q 2Q clients significantly higher than last ® Number of
flow business year following realignment of teams to better respond to client needs; Total sales Net revenue 72.5 81.0 75.3 92.1 98.9 7% 36% increased driven by Japanese equities and investment trusts and flow revenue increased QoQ Non-interest expenses 67.0 67.8 65.5 69.1 69.9 1% 4%® Stable recurring revenue at record high and recurring revenue cost coverage ratio increased to 56%, underscoring progress in creating Income (loss) before
consistent revenue structure 5.5 13.3 9.8 22.9 29.0 27% 5.3x income taxes Breakdown of net revenue Recurring revenue - All products and services booked net inflows in recurring revenue assets (billions of yen) - Recurring revenue assets remained
above Y20trn throughout the quarter 100.0 and recurring revenue grew 14% QoQ 80.0 Flow revenue, etc. - Flow revenue increased by 4% QoQ on growth in brokerage commissions Flow revenue, etc. 60.0 from bonds and stocks Recurring revenue 40.0 - Number
of flow business clients increased faster than last quarter when we saw steady growth 20.0 ® Growth of client assets FY2023/24 FY2023/24 0.0 1Q 2Q FY2022/23 FY2023/24 - Investment trust net inflows3 +Y6.6bn +Y71.9bn QoQ YoY net 3 -Y12.8bn +Y25.2bn - Discretionary investment inflows 2Q 3Q 4Q 1Q 2Q - Net inflows of cash and securities4 +Y214bn +Y356.9bn Recurring revenue1 34.7 34.0 33.5 34.2 38.9 14% 12% - Recurring revenue cost coverage
ratio5 50% 56% Flow revenue, etc.2 37.8 47.1 41.8 57.8 60.1 4% 59% Net revenue 72.5 81.0 75.3 92.1 98.9 7% 36% 1. Revenue from client assets and ongoing revenue (investment trusts, discretionary investments, insurance, loans, level fee assets,
etc.). Revised figures from before FY2022/23 4Q. 2. Revenue from transactions (brokerage revenue, consulting-related revenue), interest income, etc. other than from loans. 3. Retail channels and Japan Wealth Management Group. 6 4. Cash and
securities inflows minus outflows, excluding regional financial institutions. 5. Recurring revenue divided by non-interest expenses.
|
|
NOMURA Retail: Total sales saw strong growth driven
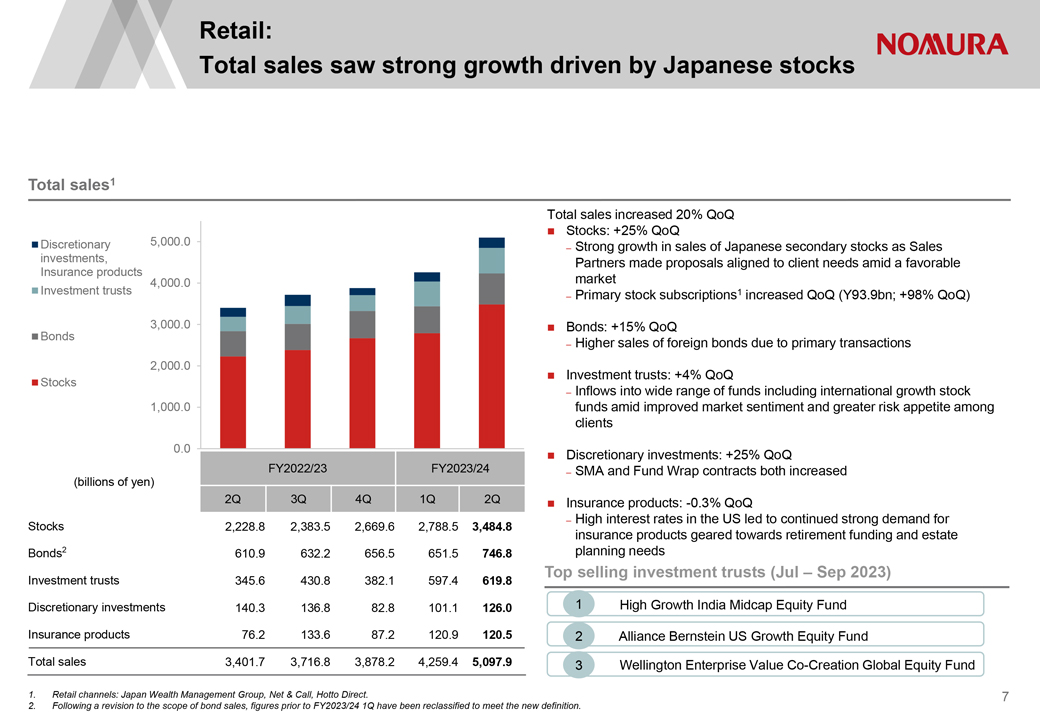
by Japanese stocks Total sales1 Total sales increased 20% QoQ 5,000.0 ® Stocks: +25% QoQ Discretionary – Strong growth in sales of Japanese secondary stocks as Sales investments, Partners made proposals aligned to client needs amid a
favorable Insurance products 4,000.0 market Investment trusts Primary 1 – stock subscriptions increased QoQ (Y93.9bn; +98% QoQ) 3,000.0 ® Bonds: +15% QoQ Bonds – Higher sales of foreign bonds due to primary transactions 2,000.0 ®
Investment trusts: +4% QoQ Stocks – Inflows into wide range of funds including international growth stock 1,000.0 funds amid improved market sentiment and greater risk appetite among clients 0.0 ® Discretionary investments: +25% QoQ
FY2022/23 FY2023/24 – SMA and Fund Wrap contracts both increased (billions of yen) 2Q 3Q 4Q 1Q 2Q ® Insurance products: -0.3% QoQ – High interest rates in the US led to continued strong demand
for Stocks 2,228.8 2,383.5 2,669.6 2,788.5 3,484.8 insurance products geared towards retirement funding and estate Bonds2 610.9 632.2 656.5 651.5 746.8 planning needs Top selling investment trusts (Jul – Sep 2023) Investment trusts 345.6 430.8
382.1 597.4 619.8 Discretionary investments 140.3 136.8 82.8 101.1 126.0 1 High Growth India Midcap Equity Fund Insurance products 76.2 133.6 87.2 120.9 120.5 2 Alliance Bernstein US Growth Equity Fund Total sales 3,401.7 3,716.8 3,878.2 4,259.4
5,097.9 3 Wellington Enterprise Value Co-Creation Global Equity Fund 1. Retail channels: Japan Wealth Management Group, Net & Call, Hotto Direct. 7 2. Following a revision to the scope of bond sales,
figures prior to FY2023/24 1Q have been reclassified to meet the new definition.
|
|
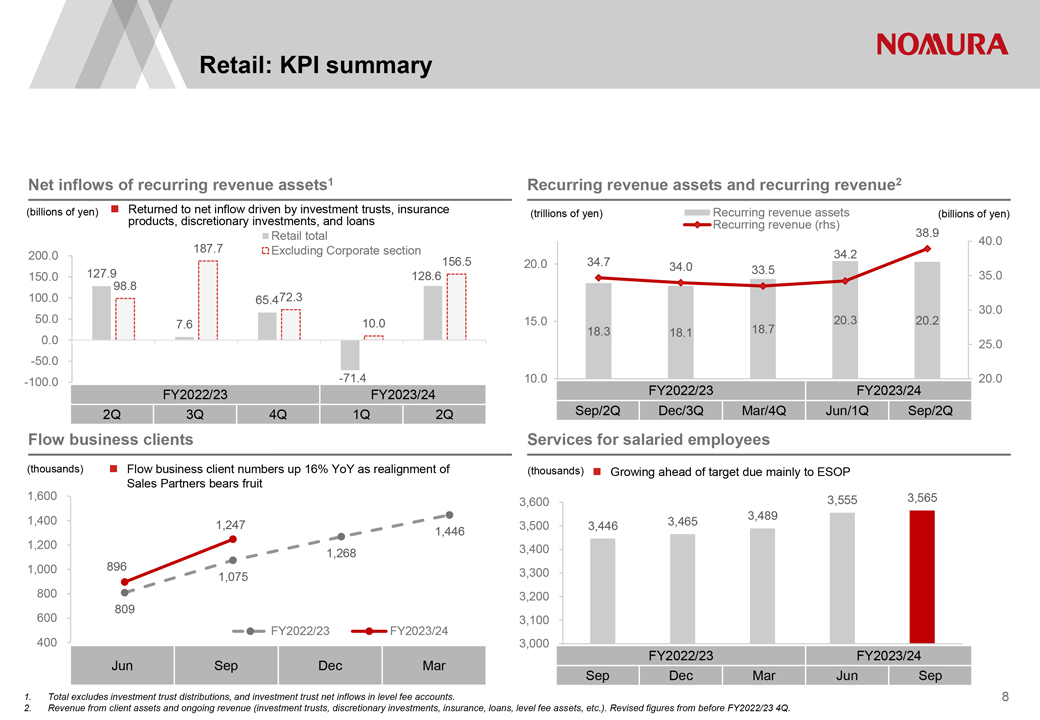
NOMURA Retail: KPI summary Net inflows of recurring
revenue assets1 Recurring revenue assets and recurring revenue2 (billions of yen) ® Returned to net inflow driven by investment trusts, insurance (trillions of yen) Recurring revenue assets (billions of yen) products, discretionary investments,
and loans Recurring revenue (rhs) Retail total 38.9 40.0 187.7 Excluding Corporate section 200.0 34.2 156.5 20.0 34.7 34.0 127.9 33.5 35.0 150.0 98.8 128.6 100.0 65.472.3 30.0 50.0 10.0 15.0 20.3 20.2 7.6 18.7 18.3 18.1 0.0 25.0 -50.0 -100.0 -71.4 10.0 20.0 FY2022/23 FY2023/24 FY2022/23 FY2023/24 2Q 3Q 4Q 1Q 2Q Sep/2Q Dec/3Q Mar/4Q Jun/1Q Sep/2Q Flow business
clients Services for salaried employees (thousands) ® Flow business client numbers up 16% YoY as realignment of (thousands) ® Growing ahead of target due mainly to ESOP Sales Partners bears fruit 1,600 3,555 3,565 3,600 1,400 3,489 1,247
1,446 3,500 3,446 3,465 1,200 3,400 1,268 1,000 896 1,075 3,300 800 3,200 809 600 3,100 FY2022/23 FY2023/24 400 3,000 FY2022/23 FY2023/24 Jun Sep Dec Mar Sep Dec Mar Jun Sep 1. Total excludes investment trust distributions, and investment trust net
inflows in level fee accounts. 8 2. Revenue from client assets and ongoing revenue (investment trusts, discretionary investments, insurance, loans, level fee assets, etc.). Revised figures from before FY2022/23 4Q.
|
|
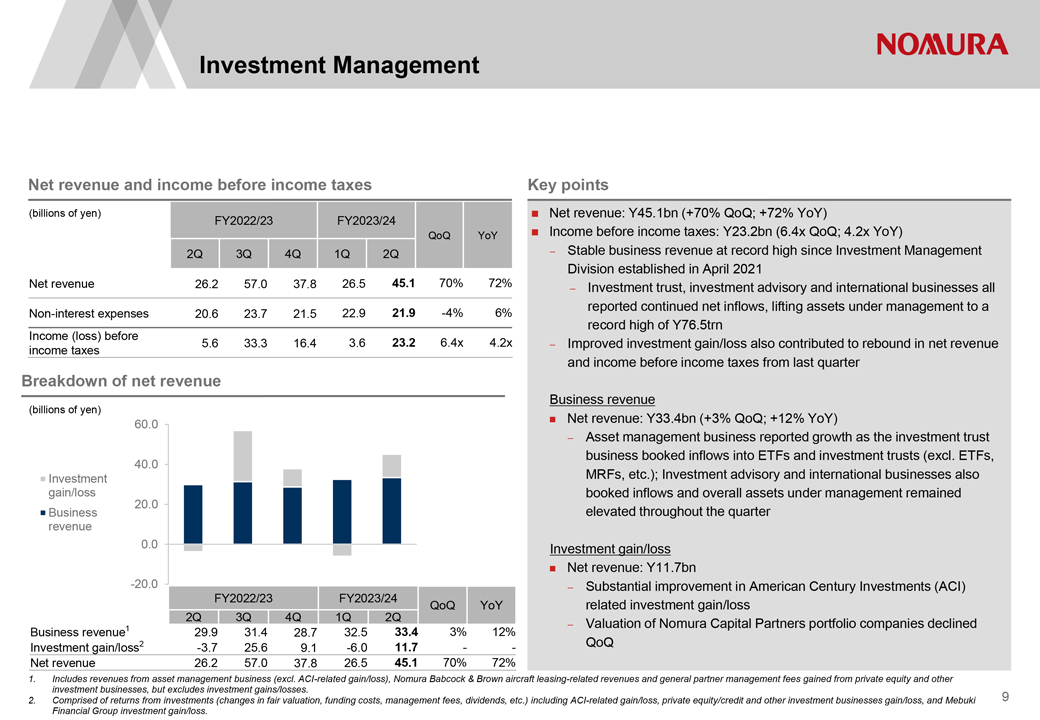
NOMURA Investment Management Net revenue and income
before income taxes Key points (billions of yen) Net revenue: Y45.1bn (+70% QoQ; +72% YoY) FY2022/23 FY2023/24 before income taxes: QoQ YoY Income Y23.2bn (6.4x QoQ; 4.2x YoY) 2Q 3Q 4Q 1Q 2Q Stable business revenue at record high since Investment
Management Division established in April 2021 Net revenue 26.2 57.0 37.8 26.5 45.1 70% 72% Investment trust, investment advisory and international businesses all reported continued net inflows, lifting assets under management to a Non-interest expenses 20.6 23.7 21.5 22.9 21.9 -4% 6% Income (loss) before record high of Y76.5trn 5.6 33.3 16.4 3.6 23.2 6.4x 4.2x Improved investment gain/loss also
contributed to rebound in net revenue income taxes and income before income taxes from last quarter Breakdown of net revenue (billions of yen) Business revenue ® Net revenue: Y33.4bn (+3% QoQ; +12% YoY) 60.0 Asset management business reported
growth as the investment trust business booked inflows into ETFs and investment trusts (excl. ETFs, 40.0 Investment MRFs, etc.); Investment advisory and international businesses also gain/loss booked inflows and overall assets under management
remained 20.0 Business elevated throughout the quarter revenue 0.0 Investment gain/loss Net revenue: Y11.7bn -20.0 Substantial improvement in American Century Investments (ACI) FY2022/23 FY2023/24 QoQ YoY
related investment gain/loss 2Q 3Q 4Q 1Q 2Q 1 Valuation of Nomura Capital Partners portfolio companies declined Business revenue 29.9 31.4 28.7 32.5 33.4 3% 12% Investment gain/loss2 -3.7 25.6 9.1 -6.0 11.7 - QoQ Net revenue 26.2 57.0 37.8 26.5 45.1 70% 72% 1. Includes revenues from asset management business (excl. ACI-related gain/loss), Nomura Babcock & Brown
aircraft leasing-related revenues and general partner management fees gained from private equity and other investment businesses, but excludes investment gains/losses. 2. Comprised of returns from investments (changes in fair valuation, funding
costs, management fees, dividends, etc.) including ACI-related gain/loss, private equity/credit and other investment businesses gain/loss, and Mebuki 9 Financial Group investment gain/loss.
|

|
NOMURA Investment Management: Inflows lift AuM to
record high Assets under management (net)1 (trillions of yen) Investment advisory and international businesses, etc. AuM remained high during the quarter, recording new record high for Investment trust business second straight quarter 76.1 76.5 80.0
64.8 64.7 67.3® Investment trust business 21.1 21.4 Inflows into high dividend stock and other Japan stock related ETFs 60.0 18.3 18.1 17.7 (Y270bn) as well as investment trusts (excl. ETFs, MRFs, etc.) (Y200bn) Investment trusts
(excl. ETFs, MRFs, etc.): 40.0 Bank channel booked inflows mainly into balanced funds and US stock funds 49.0 55.0 55.1 46.7 47.0 Funds for DC plans saw ongoing inflows into foreign stock funds with 20.0 3 AuM at top of
industry (Sep AuM: Y2.3trn; AuM market share : 21.1%) ® Investment advisory and international businesses, etc. 0.0 Japan booked inflows into yen bond and alternative funds FY2022/23 FY2023/24 International business booked
inflows into India stock funds Sep Dec Mar Jun Sep Net inflows2 Inflows drive steady growth in alternative AuM4 (billions of yen) Investment advisory and international businesses, etc. (billions of yen) Investment trust business 2,000 2,000 1,713
1,682 1,544 1,500 1,500 1,209 1,263 1,064 1,148 1,000 593 500 226 118 1,000 89 649 475 137 57 0 -100 -44 -358 500 -500 -134 -492 -1,000 0 FY2022/23 FY2023/24 FY2022/23 FY2023/24 2Q 3Q 4Q 1Q 2Q Sep Dec Mar Jun
Sep 1. Net after deducting duplications from assets under management (gross) of Nomura Asset Management, Nomura Corporate Research and Asset Management, and Wealth Square, as well as third party investment by Nomura SPARX Investment, Nomura
Mezzanine Partners, Nomura Capital Partners, Nomura Research & Advisory, and Nomura Real Asset Investment 2. Based on assets under management (net). 3. Nomura, based on published data. 4. Total of Nomura Asset Management alternative AuM and
third party investments related to Nomura SPARX Investment, Nomura Mezzanine Partners, Nomura Capital Partners, Nomura Research & Advisory, 10 and Nomura Real Asset Investment.
|

|
NOMURA Wholesale Net revenue and income (loss)
before income taxes1 Key points (billions of yen) ® Net revenue: Y204.1bn (+7% QoQ; -1% YoY) FY2022/23 FY2023/24 QoQ YoY ® Income before income taxes: Y8.3bn (3.9x QoQ;
-59% YoY) 2Q 3Q 4Q 1Q 2Q ® Overall performance improved QoQ Net revenue 205.5 189.1 178.8 190.9 204.1 7% -1%—Global Markets revenues increased by 6% QoQ as
Equities revenues increased 17% on the back of growth in Equity Products and Execution Non-interest expenses 185.3 190.9 193.1 188.7 195.8 4% 6% Services; In Fixed Income, FX/EM and Securitized Products offset
slower Income (loss) before Rates revenues, resulting in roughly flat revenues QoQ 20.2 -1.9 -14.2 2.1 8.3 3.9x -59% income
taxes—Investment Banking revenues grew 10% QoQ driven by Japan related CIR 90% 101% 108% 99% 96% ECM and Advisory transactions ® Stringent cost management meant QoQ increase in expenses mainly due to Revenue/modified RWA2 7.1% 5.9% 5.8%
6.2% 6.4% yen depreciation Net revenue by business line Net revenue by region (billions of yen) (billions of yen) 200.0 200.0 Investment Banking 65.1 69.3 Americas 150.0 61.5 64.2 100.0 57.7 Global Markets EMEA 39.0 34.1 44.2 27.9 30.3 100.0 0.0
50.4 32.4 27.2 34.5 AEJ 34.5 FY2022/23 FY2023/24 50.0 QoQ YoY 69.2 51.0 60.9 66.2 Japan 2Q 3Q 4Q 1Q 2Q 48.9 Global Markets 177.5 154.3 149.3 160.4 170.7 6% -4% 0.0 FY2022/23 FY2023/24 Investment Banking 28.0
34.8 29.6 30.5 33.4 10% 19% Net revenue 205.5 189.1 178.8 190.9 204.1 7% -1% 2Q 3Q 4Q 1Q 2Q 1. As the recoverable amount for part of the claim related to the loss arising from transactions with a US client can
now be reasonably estimated, gains of Y11.1bn (Y9.1bn trading revenue, Y1.9bn loan-loss provision reversal) were booked in FY2022/23 3Q. 2. Wholesale net revenue (annualized) divided by modified risk-weighted assets (daily average for the accounting
period) used by Wholesale. Modified risk-weighted assets (daily average for the accounting period) is a non-GAAP financial measure and is the total of (i) risk-weighted assets (as calculated and presented
under Basel III) and (ii) an adjustment equal to the regulatory adjustment to common equity tier 1 capital calculated and presented under Basel 11 III divided by our internal minimum capital ratio target.
|
|
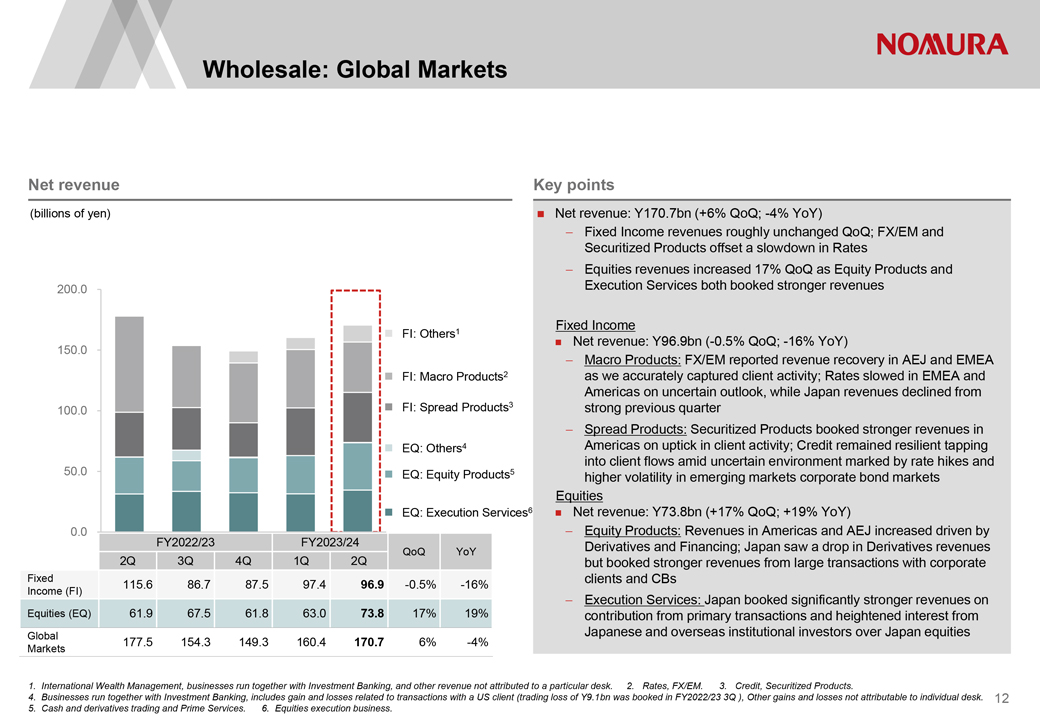
NOMURA Wholesale: Global Markets Net revenue Key
points (billions of yen) ® Net revenue: Y170.7bn (+6% QoQ; -4% YoY) Fixed Income revenues roughly unchanged QoQ; FX/EM and Securitized Products offset a slowdown in Rates Equities revenues
increased 17% QoQ as Equity Products and 200.0 Execution Services both booked stronger revenues Fixed Income ® FI: Others1 Net revenue: ® Y96.9bn (-0.5% QoQ;
-16% YoY) 150.0 Macro Products: FX/EM reported revenue recovery in AEJ and EMEA ® FI: Macro Products2 as we accurately captured client activity; Rates slowed in EMEA and Americas on uncertain
outlook, while Japan revenues declined from ® FI: Spread Products3 strong previous quarter 100.0 Spread Products: Securitized Products booked stronger revenues in ® EQ: Others4 Americas on uptick in client activity; Credit
remained resilient tapping into client flows amid uncertain environment marked by rate hikes and 50.0 ® EQ: Equity Products5 higher volatility in emerging markets corporate bond markets Equities ® EQ: Execution Services6 ® Net revenue:
Y73.8bn (+17% QoQ; +19% YoY) 0.0 Equity Products: Revenues in Americas and AEJ increased driven by FY2022/23 FY2023/24 QoQ YoY Derivatives and Financing; Japan saw a drop in Derivatives revenues 2Q 3Q 4Q 1Q 2Q but booked stronger revenues from
large transactions with corporate Fixed clients and CBs 115.6 86.7 87.5 97.4 96.9 -0.5% -16% Income (FI) Execution Services: Japan booked significantly stronger
revenues on Equities (EQ) 61.9 67.5 61.8 63.0 73.8 17% 19% contribution from primary transactions and heightened interest from Global 177.5 154.3 149.3 160.4 170.7 6% -4% Japanese and overseas institutional
investors over Japan equities Markets 1. International Wealth Management, businesses run together with Investment Banking, and other revenue not attributed to a particular desk. 2. Rates, FX/EM. 3. Credit, Securitized Products. 4. Businesses run
together with Investment Banking, includes gain and losses related to transactions with a US client (trading loss of Y9.1bn was booked in FY2022/23 3Q ), Other gains and losses not attributable to individual desk. 12 5. Cash and derivatives trading
and Prime Services. 6. Equities execution business.
|
|
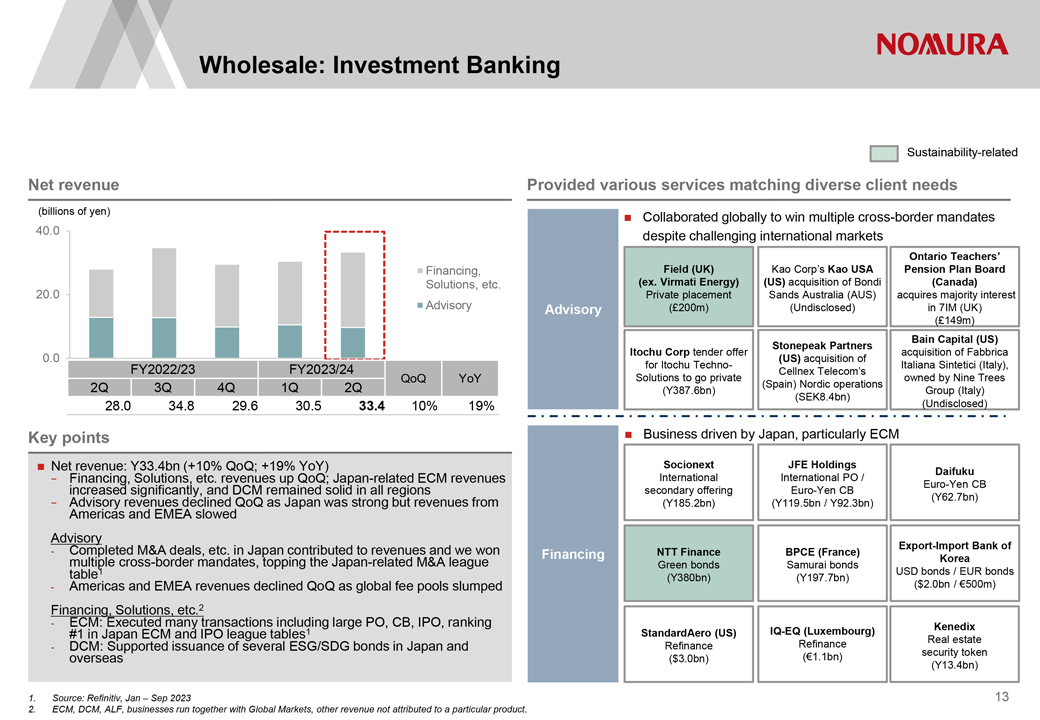
NOMURA Wholesale: Investment Banking
Sustainability-related Net revenue Provided various services matching diverse client needs (billions of yen) ® Collaborated globally to win multiple cross-border mandates 40.0 despite challenging international markets Ontario Teachers’
Financing, Field (UK) Kao Corp’s Kao USA Pension Plan Board Solutions, etc. (ex. Virmati Energy) (US) acquisition of Bondi (Canada) 20.0 Advisory Private placement Sands Australia (AUS) acquires majority interest Advisory (Ł200m)
(Undisclosed) in 7IM (UK) (Ł149m) Bain Capital (US) Stonepeak Partners Itochu Corp tender offer acquisition of Fabbrica 0.0 (US) acquisition of FY2022/23 FY2023/24 for Itochu Techno- Italiana Sintetici (Italy), Cellnex Telecom’s QoQ YoY
Solutions to go private owned by Nine Trees 2Q 3Q 4Q 1Q 2Q (Spain) Nordic operations (Y387.6bn) Group (Italy) (SEK8.4bn) 28.0 34.8 29.6 30.5 33.4 10% 19% (Undisclosed) Key points ® Business driven by Japan, particularly ECM® Net revenue:
Y33.4bn (+10% QoQ; +19% YoY) Socionext JFE Holdings Daifuku - Financing, Solutions, etc. revenues up QoQ; Japan-related ECM revenues International International PO / Euro-Yen CB increased significantly, and
DCM remained solid in all regions secondary offering Euro-Yen CB but revenues from (Y62.7bn) - Americas Advisory revenues and EMEA declined slowed QoQ as Japan was strong (Y185.2bn) (Y119.5bn / Y92.3bn)
Advisory Export-Import Bank of - Completed M&A deals, etc. in Japan contributed to revenues and we won Financing NTT Finance BPCE (France) multiple cross-border mandates, topping the Japan-related M&A league Korea Green bonds Samurai bonds
table1 USD bonds / EUR bonds (Y380bn) (Y197.7bn) - Americas and EMEA revenues declined QoQ as global fee pools slumped ($2.0bn / €500m) Financing, Solutions, etc.2 - ECM: Executed many transactions including 1 large PO, CB, IPO, ranking Kenedix
#1 in Japan ECM and IPO league tables StandardAero (US) IQ-EQ (Luxembourg) Refinance Real estate - DCM: Supported issuance of several ESG/SDG bonds in Japan and Refinance (€1.1bn) security token overseas
($3.0bn) (Y13.4bn) 1. Source: Refinitiv, Jan – Sep 2023 13 2. ECM, DCM, ALF, businesses run together with Global Markets, other revenue not attributed to a particular product.
|
|
NOMURA
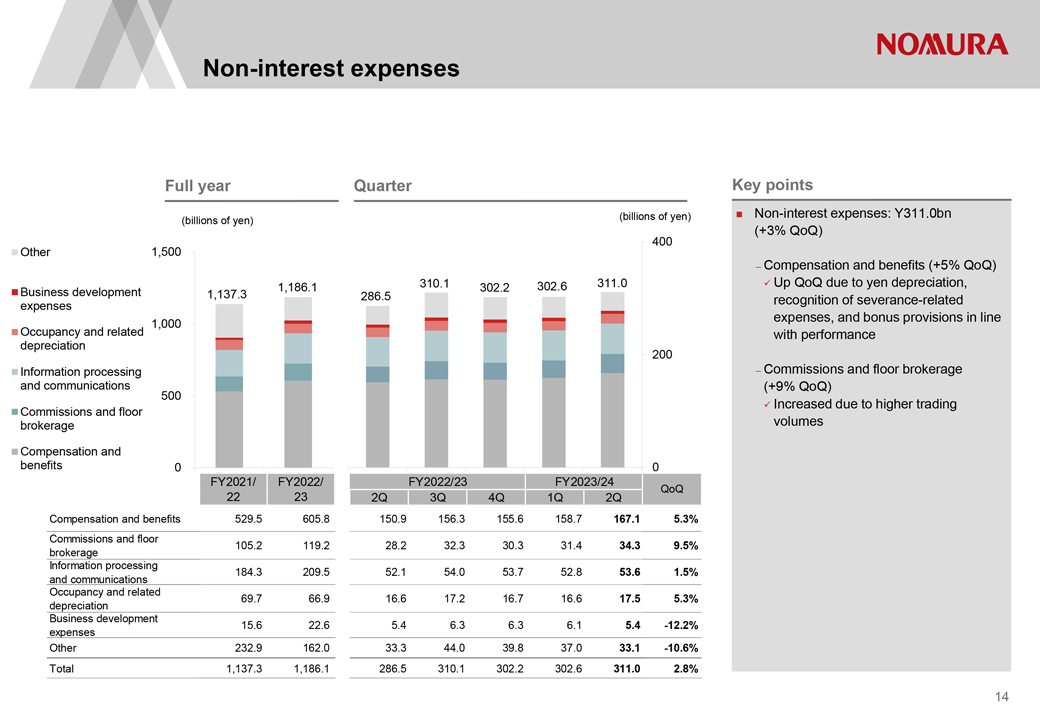
Non-interest expenses Full year Quarter Key points (billions of yen) ® Non-interest expenses: Y311.0bn (billions of yen) 400 (+3% QoQ) Other 1,500 –
Compensation and benefits (+5% QoQ) 1,186.1 310.1 302.2 302.6 311.0 ƒ¼ Up QoQ due to yen depreciation, Business development 1,137.3 286.5 recognition of severance-related expenses expenses, and bonus provisions in line 1,000 Occupancy and
related with performance depreciation 200 Information processing – Commissions and floor brokerage and communications 500 (+9% QoQ) ƒ¼ Increased due to higher trading Commissions and floor brokerage volumes Compensation and benefits 0
0 FY2021/ FY2022/ FY2022/23 FY2023/24 QoQ 22 23 2Q 3Q 4Q 1Q 2Q Compensation and benefits 529.5 605.8 150.9 156.3 155.6 158.7 167.1 5.3% Commissions and floor 105.2 119.2 28.2 32.3 30.3 31.4 34.3 9.5% brokerage Information processing 184.3 209.5 52.1
54.0 53.7 52.8 53.6 1.5% and communications Occupancy and related 69.7 66.9 16.6 17.2 16.7 16.6 17.5 5.3% depreciation Business development 15.6 22.6 5.4 6.3 6.3 6.1 5.4 -12.2% expenses Other 232.9 162.0 33.3
44.0 39.8 37.0 33.1 -10.6% Total 1,137.3 1,186.1 286.5 310.1 302.2 302.6 311.0 2.8% 14
|
|
NOMURA Robust financial position Balance sheet
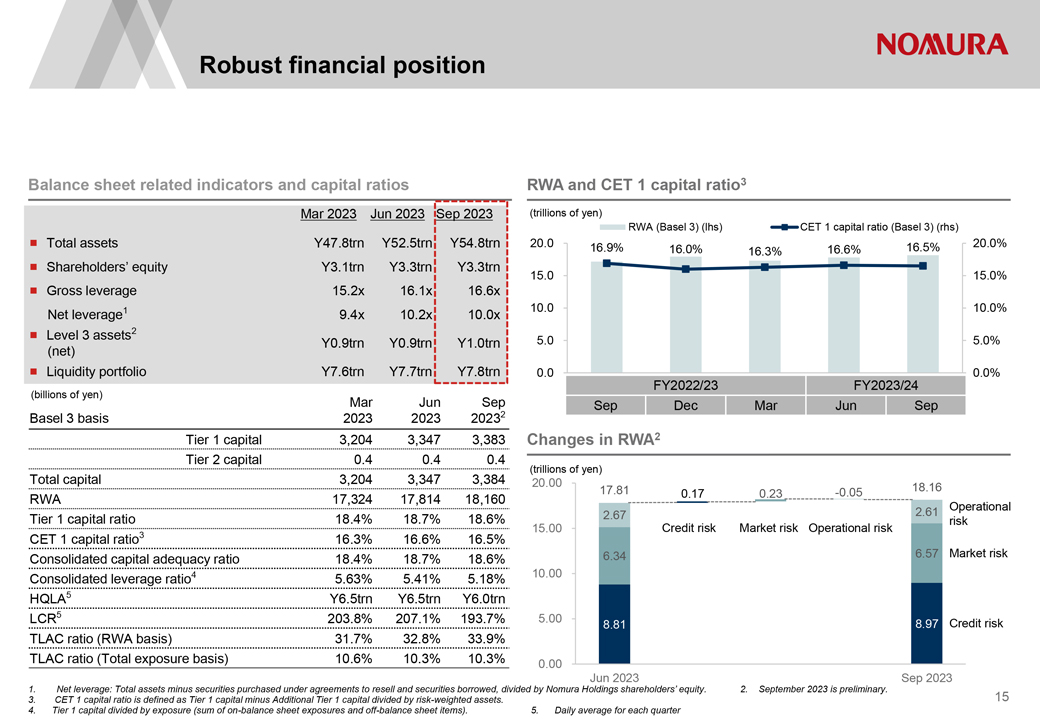
related indicators and capital ratios RWA and CET 1 capital ratio3 Mar 2023 Jun 2023 Sep 2023 (trillions of yen) RWA (Basel 3) (lhs) CET 1 capital ratio (Basel 3) (rhs) ® Total assets Y47.8trn Y52.5trn Y54.8trn 20.0 16.9% 16.5% 20.0% 16.0% 16.3%
16.6% ® Shareholders’ equity Y3.1trn Y3.3trn Y3.3trn 15.0 15.0% ® Gross leverage 15.2x 16.1x 16.6x 1 10.0 10.0% Net leverage 9.4x 10.2x 10.0x ® Level 3 assets2 5.0 5.0% Y0.9trn Y0.9trn Y1.0trn (net) ® Liquidity portfolio
Y7.6trn Y7.7trn Y7.8trn 0.0 0.0% FY2022/23 FY2023/24 (billions of yen) Mar Jun Sep Sep Dec Mar Jun Sep Basel 3 basis 2023 2023 20232 Tier 1 capital 3,204 3,347 3,383 Changes in RWA2 Tier 2 capital 0.4 0.4 0.4 (trillions of yen) Total capital 3,204
3,347 3,384 20.00 17.81 -0.05 18.16 RWA 17,324 17,814 18,160 0.17 0.23 Operational 2.67 2.61 Tier 1 capital ratio 18.4% 18.7% 18.6% risk 15.00 Credit risk Market risk Operational risk CET 1 capital ratio3
16.3% 16.6% 16.5% Consolidated capital adequacy ratio 18.4% 18.7% 18.6% 6.34 6.57 Market risk Consolidated leverage ratio4 5.63% 5.41% 5.18% 10.00 HQLA5 Y6.5trn Y6.5trn Y6.0trn LCR5 203.8% 207.1% 193.7% 5.00 8.81 8.97 Credit risk TLAC ratio (RWA
basis) 31.7% 32.8% 33.9% TLAC ratio (Total exposure basis) 10.6% 10.3% 10.3% 0.00 Jun 2023 Sep 2023 1. Net leverage: Total assets minus securities purchased under agreements to resell and securities borrowed, divided by Nomura Holdings
shareholders’ equity. 2. September 2023 is preliminary. 3. CET 1 capital ratio is defined as Tier 1 capital minus Additional Tier 1 capital divided by risk-weighted assets. 15 4. Tier 1 capital divided by exposure (sum of on-balance sheet exposures and off-balance sheet items). 5. Daily average for each quarter
|

|
NOMURA Financial Supplement
NOMURA Consolidated balance sheet Consolidated
balance sheet (billions of yen) Mar 31, 2023 Sep 30, 2023 Increase (Decrease) Assets Total cash and cash deposits 4,521 4,877356 Total loans and receivables 5,207 6,112905 Total collateralized agreements 18,117 21,7703,652 Total trading assets and
private equity and debt investments 1 17,609 19,6322,023 Total other assets1 2,317 2,425108 Total assets 47,772 54,8157,043 Mar 31, 2023 Sep 30, 2023 Increase (Decrease) Liabilities Short-term borrowings 1,009 1,06557 Total payables and deposits
5,297 5,954656 Total collateralized financing 16,109 20,6224,513 Trading liabilities 10,558 11,141583 Other liabilities 1,176 1,21944 Long-term borrowings 10,399 11,4421,043 Total liabilities 44,548 51,4436,895 Equity Total NHI shareholders’
equity 3,149 3,291143 Noncontrolling interest 76 815 Total liabilities and equity 47,772 54,8157,043 1. Including securities pledged as collateral. 17
|
|
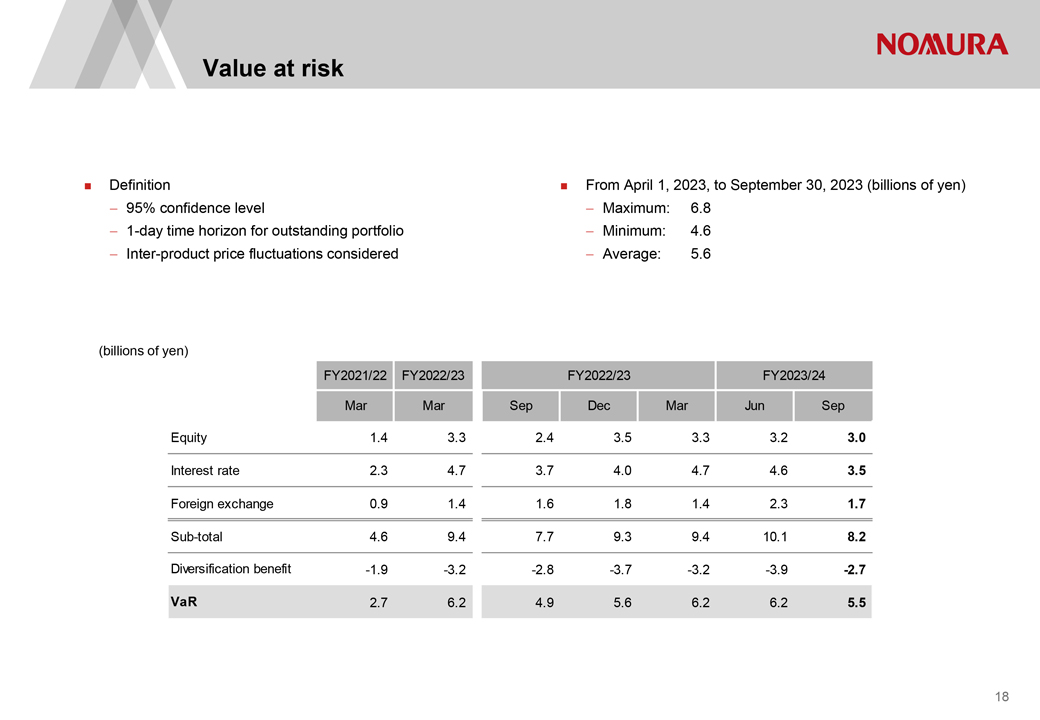
NOMURA Value at risk Definition From April 1,
2023, to September 30, 2023 (billions of yen) 95% confidence level Maximum: 6.8 1-day time horizon for outstanding portfolio Minimum: 4.6 Inter-product price fluctuations considered Average: 5.6
(billions of yen) FY2021/22 FY2022/23 FY2022/23FY2023/24 Mar Mar SepDecMarJunSep Equity 1.4 3.32.43.53.33.23.0 Interest rate 2.3 4.73.74.04.74.63.5 Foreign exchange 0.9 1.41.61.81.42.31.7 Sub-total 4.6
9.47.79.39.410.18.2 Diversification benefit -1.9 -3.2-2.8-3.7-3.2-3.9-2.7 VaR 2.7 6.24.95.66.26.25.5 18
|
|
NOMURA Consolidated financial highlights Full year
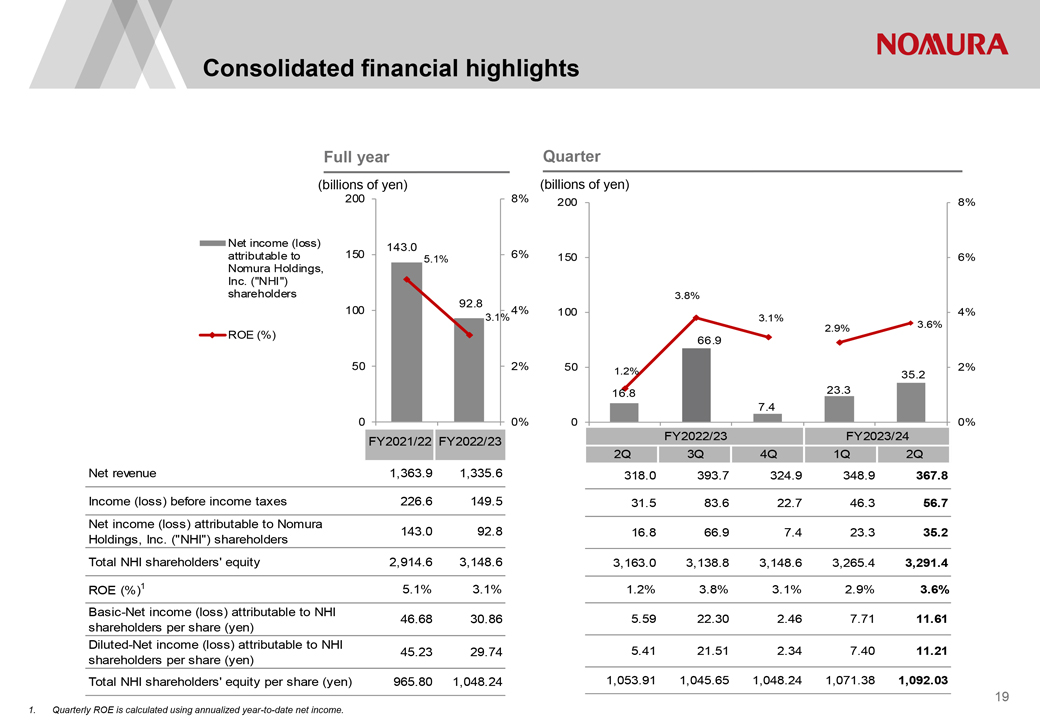
(billions of yen) 200 8% Net income (loss) 143.0 attributable to 150 5.1% 6% Nomura Holdings, Inc. (“NHI”) shareholders 92.8 100 4% 3.1% ROE (%) 50 2% 0 0% FY2021/22 FY2022/23 Quarter (billions of yen) 200 8% 150 6% 3.8% 100 4% 3.1% 2.9%
3.6% 66.9 50 1.2% 2% 35.2 16.8 23.3 7.4 0 0% FY2022/23 FY2023/24 2Q 3Q 4Q 1Q 2Q Net revenue 1,363.9 1,335.6 Income (loss) before income taxes 226.6 149.5 Net income (loss) attributable to Nomura 143.0 92.8 Holdings, Inc. (“NHI”)
shareholders Total NHI shareholders’ equity 2,914.6 3,148.6 ROE (%)1 5.1% 3.1% Basic-Net income (loss) attributable to NHI 46.68 30.86 shareholders per share (yen)
Diluted-Net income (loss) attributable to NHI 45.23 29.74 shareholders per share (yen) Total NHI shareholders’ equity per share (yen) 965.80 1,048.24 318.0 393.7 324.9348.9367.8 31.5 83.6 22.746.356.7
16.8 66.9 7.423.335.2 3,163.0 3,138.8 3,148.63,265.43,291.4 1.2% 3.8% 3.1%2.9%3.6% 5.59 22.30 2.467.7111.61 5.41 21.51 2.347.4011.21 1,053.91 1,045.65 1,048.241,071.381,092.03 1. Quarterly ROE is calculated using annualized year-to-date net income. 19
|
|
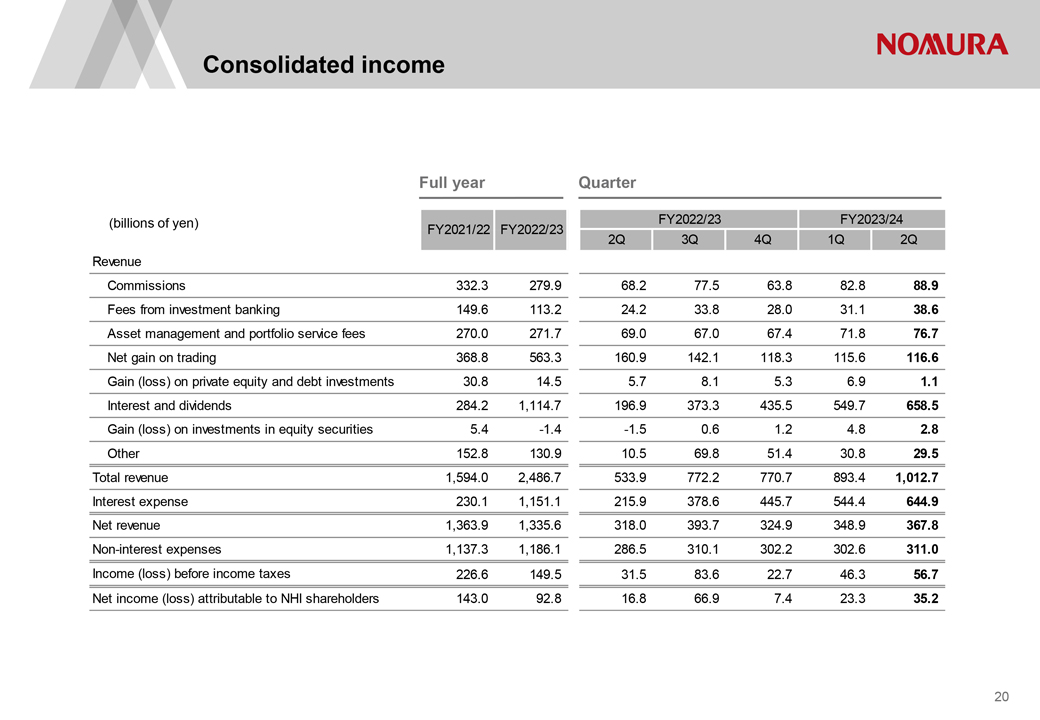
NOMURA Consolidated income Full year Quarter
(billions of yen) FY2022/23FY2023/24 FY2021/22 FY2022/23 2Q3Q4Q1Q2Q Revenue Commissions 332.3 279.968.277.563.882.888.9 Fees from investment banking 149.6 113.224.233.828.031.138.6 Asset management and portfolio
service fees 270.0 271.769.067.067.471.876.7 Net gain on trading 368.8 563.3160.9142.1118.3115.6116.6 Gain (loss) on private equity and debt investments 30.8 14.55.78.15.36.91.1 Interest and dividends 284.2
1,114.7196.9373.3435.5549.7658.5 Gain (loss) on investments in equity securities 5.4 -1.4-1.50.61.24.82.8 Other 152.8 130.910.569.851.430.829.5 Total revenue 1,594.0 2,486.7533.9772.2770.7893.41,012.7 Interest expense 230.1
1,151.1215.9378.6445.7544.4644.9 Net revenue 1,363.9 1,335.6318.0393.7324.9348.9367.8 Non-interest expenses 1,137.3 1,186.1286.5310.1302.2302.6311.0 Income (loss) before income taxes 226.6
149.531.583.622.746.356.7 Net income (loss) attributable to NHI shareholders 143.0 92.816.866.97.423.335.2 20
|
|
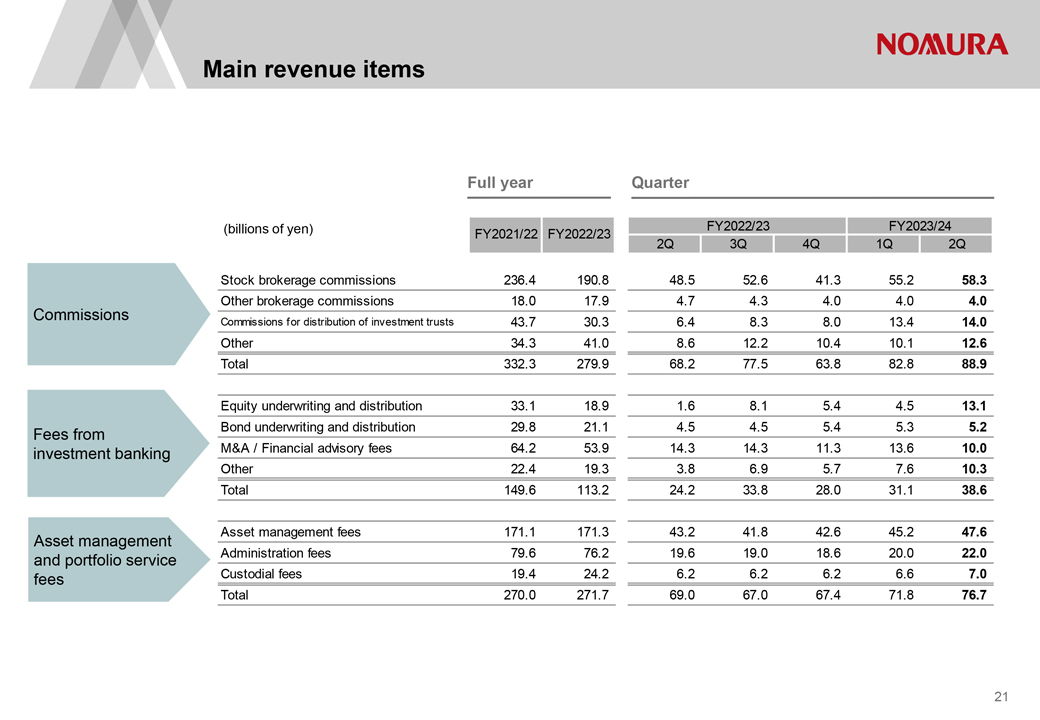
NOMURA Main revenue items Commissions Fees from
investment banking Asset management and portfolio service fees Full year Quarter (billions of yen) FY2021/22 FY2022/23 FY2022/23FY2023/24 2Q3Q4Q1Q2Q Stock brokerage commissions 236.4 190.848.552.641.355.258.3 Other brokerage
commissions 18.0 17.94.74.34.04.04.0 Commissions for distribution of investment trusts 43.7 30.36.48.38.013.414.0 Other 34.3 41.08.612.210.410.112.6 Total 332.3 279.968.277.563.882.888.9 Equity underwriting and
distribution 33.1 18.91.68.15.44.513.1 Bond underwriting and distribution 29.8 21.14.54.55.45.35.2 M&A / Financial advisory fees 64.2 53.914.314.311.313.610.0 Other 22.4 19.33.86.95.77.610.3 Total 149.6
113.224.233.828.031.138.6 Asset management fees 171.1 171.343.241.842.645.247.6 Administration fees 79.6 76.219.619.018.620.022.0 Custodial fees 19.4 24.26.26.26.26.67.0 Total 270.0 271.769.067.067.471.876.7 21
|
|
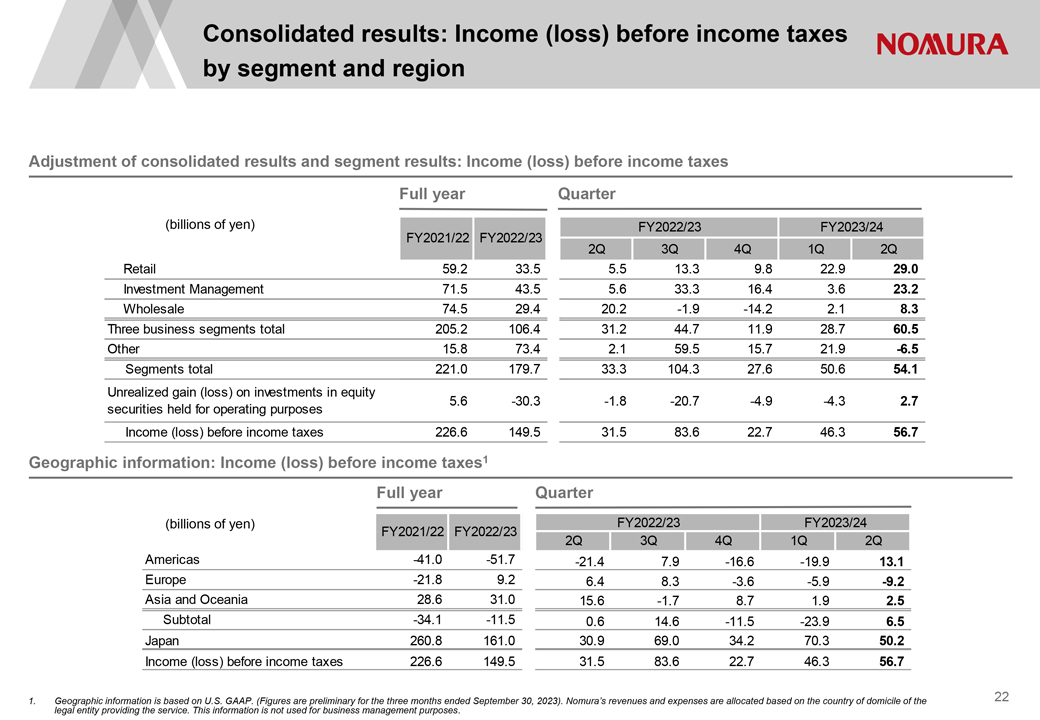
NOMURA Consolidated results: Income (loss) before
income taxes by segment and region
Adjustment of consolidated results and segment results: Income (loss) before income taxes
Full year Quarter
(billions of yen) FY2022/23FY2023/24
FY2021/22 FY2022/23
2Q3Q4Q1Q2Q
Retail 59.233.55.513.39.822.929.0
Investment Management
71.543.55.633.316.43.623.2
Wholesale 74.529.420.2-1.9-14.22.18.3
Three
business segments total 205.2106.431.244.711.928.760.5
Other 15.873.42.159.515.721.9-6.5
Segments total 221.0179.733.3104.327.650.654.1
Unrealized gain (loss) on
investments in equity
securities held for operating purposes 5.6-30.3-1.8-20.7-4.9-4.32.7
Income (loss) before income taxes 226.6149.531.583.622.746.356.7
Geographic
information: Income (loss) before income taxes1
Full year Quarter
(billions of yen) FY2022/23FY2023/24
FY2021/22 FY2022/23
2Q3Q4Q1Q2Q
Americas -41.0 -51.7-21.47.9-16.6-19.913.1
Europe -21.8 9.26.48.3-3.6-5.9-9.2
Asia and Oceania 28.6 31.015.6-1.78.71.92.5
Subtotal -34.1 -11.50.614.6-11.5-23.96.5
Japan 260.8
161.030.969.034.270.350.2
Income (loss) before income taxes 226.6 149.531.583.622.746.356.7
1. Geographic information is based on U.S. GAAP. (Figures are preliminary for the three months ended September 30, 2023). Nomura’s revenues and expenses are allocated
based on the country of domicile of the legal entity providing the service. This information is not used for business management purposes.
22
|

|
NOMURA Segment “Other”
Income (loss) before income taxes
Full year Quarter
(billions of yen)
90
73.4
60
59.5
30
15.8 21.9
15.7
2.1
0
1
2 3 4 -6. 55
-30
FY2022/23FY2023/24
FY2021/22 FY2022/23
2Q3Q4Q1Q2Q
Net gain (loss) related to economic -9.9 -4.80.1-1.56.33.4-8.9
hedging
transactions
Realized gain (loss) on investments in equity
securities held for operating purposes 1.4 28.40.121.96.28.20.0
Equity
in earnings of affiliates 36.8 47.79.18.912.713.79.0
Corporate items -91.1 -12.64.5-3.3-7.81.91.4
Others 78.6 14.7-11.733.5-1.8-5.3-8.0
Income (loss) before income taxes 15.8
73.42.159.515.721.9-6.5
23
|
|
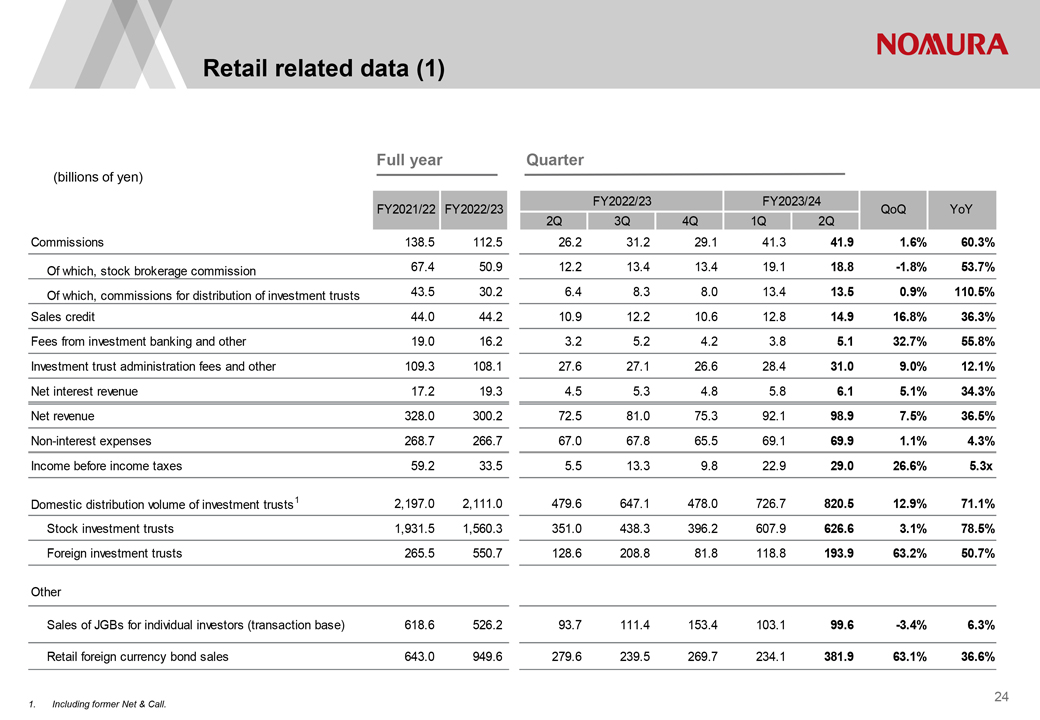
NOMURA Retail related data (1)
Full year Quarter
(billions of yen)
FY2022/23FY2023/24
FY2021/22 FY2022/23 QoQYoY
2Q3Q4Q1Q2Q
Commissions 138.5 112.526.231.229.141.341.91.6%60.3%
Of which, stock brokerage commission 67.4 50.912.213.413.419.118.8-1.8%53.7%
Of which,
commissions for distribution of investment trusts 43.5 30.26.48.38.013.413.50.9%110.5%
Sales credit 44.0 44.210.912.210.612.814.916.8%36.3%
Fees from investment banking and other 19.0 16.23.25.24.23.85.132.7%55.8%
Investment
trust administration fees and other 109.3 108.127.627.126.628.431.09.0%12.1%
Net interest revenue 17.2 19.34.55.34.85.86.15.1%34.3%
Net revenue 328.0 300.272.581.075.392.198.97.5%36.5%
Non-interest expenses 268.7 266.767.067.865.569.169.91.1%4.3%
Income before income taxes 59.2 33.55.513.39.822.929.026.6%5.3x
Domestic distribution
volume of investment trusts 1 2,197.0 2,111.0479.6647.1478.0726.7820.512.9%71.1%
Stock investment trusts 1,931.5
1,560.3351.0438.3396.2607.9626.63.1%78.5%
Foreign investment trusts 265.5 550.7128.6208.881.8118.8193.963.2%50.7%
Other
Sales of JGBs for individual investors (transaction base) 618.6
526.293.7111.4153.4103.199.6-3.4%6.3%
Retail foreign currency bond sales 643.0 949.6279.6239.5269.7234.1381.963.1%36.6%
1. Including former Net & Call.
24
|
|
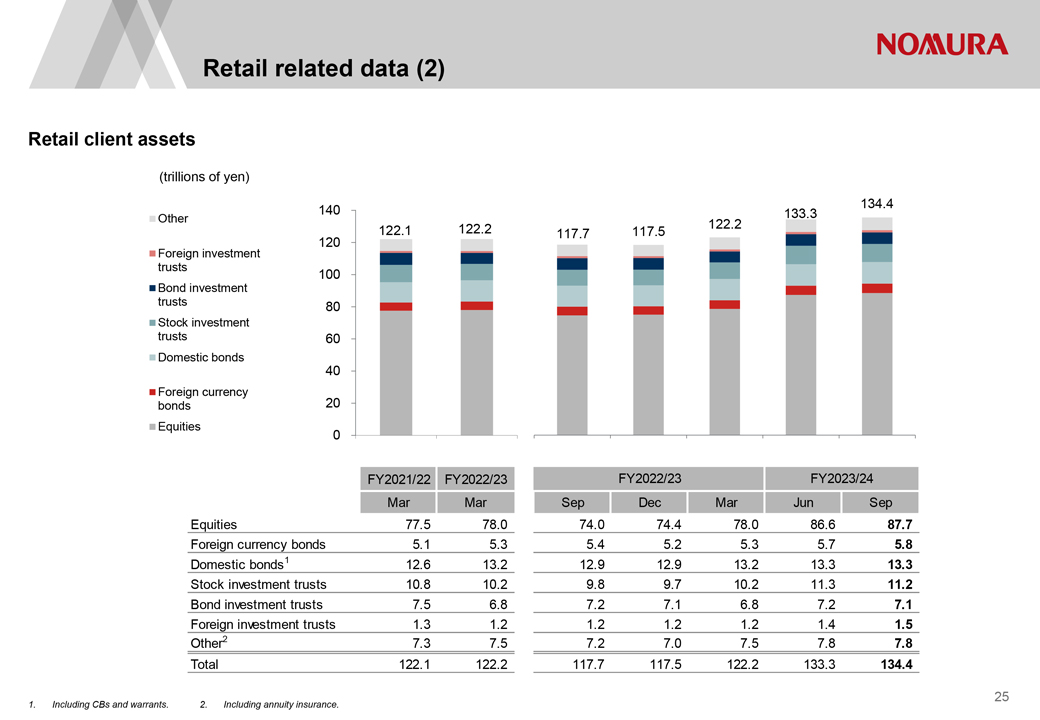
NOMURA Retail related data (2)
Retail client assets
(trillions of yen)
134.4 140 133.3 Other 122.2 122.1 122.2 117.7 117.5
Foreign investment 120 trusts
100
Bond investment trusts 80 Stock investment trusts 60 Domestic bonds
40
Foreign currency 20 bonds Equities
0
FY2021/22 FY2022/23 FY2022/23FY2023/24
Mar Mar SepDecMarJunSep
Equities 77.5 78.074.074.478.086.687.7
Foreign currency bonds 5.1 5.35.45.25.35.75.8
Domestic bonds1 12.6
13.212.912.913.213.313.3
Stock investment trusts 10.8 10.29.89.710.211.311.2
Bond investment trusts 7.5 6.87.27.16.87.27.1
Foreign investment trusts 1.3
1.21.21.21.21.41.5
Other2 7.3 7.57.27.07.57.87.8
Total 122.1
122.2117.7117.5122.2133.3134.4
1. Including CBs and warrants. 2. Including annuity insurance.
25
|
|
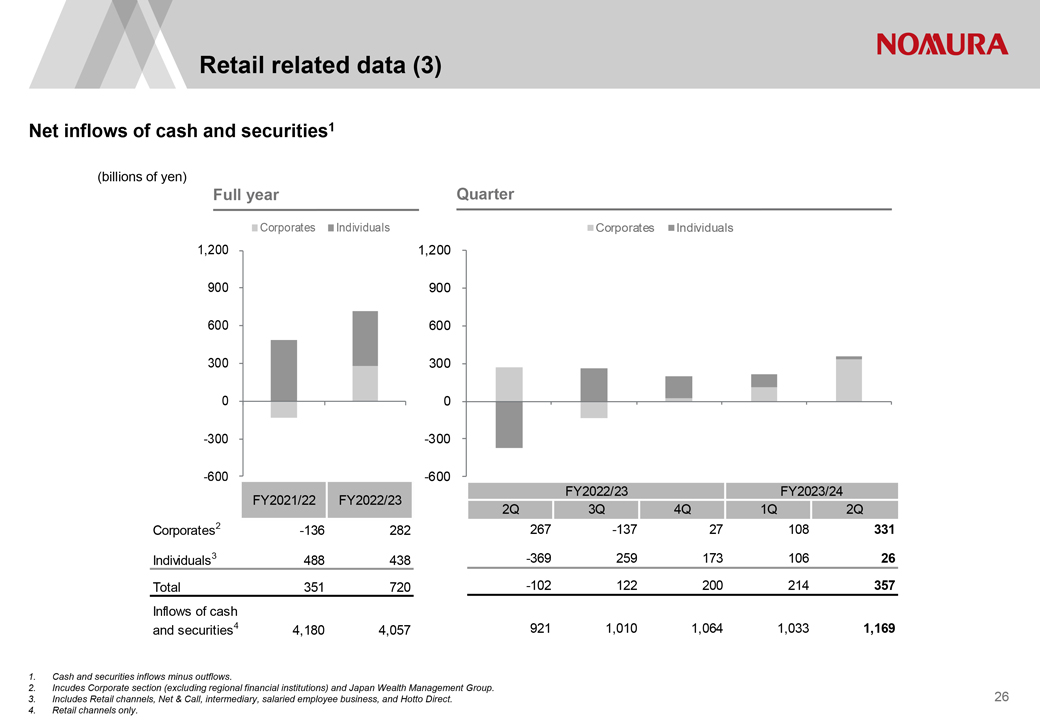
NOMURA Retail related data (3)
Net inflows of cash and securities1
(billions of yen)
Full year Quarter
Corporates Individuals Corporates Individuals
1,200 1,200
900 900 600 600 300 300
0 0 -300 -300
-600 -600
FY2022/23FY2023/24
FY2021/22 FY2022/23
2Q3Q4Q1Q2Q
Corporates2 -136 282267-13727108331
Individuals3 488 438-36925917310626
Total 351 720-102122200214357
Inflows of cash
and securities4 4,180 4,0579211,0101,0641,0331,169
1. Cash and securities inflows minus
outflows.
2. Incudes Corporate section (excluding regional financial institutions) and Japan Wealth Management Group.
3. Includes Retail channels, Net & Call, intermediary, salaried employee business, and Hotto Direct.
4. Retail channels only.
26
|
|
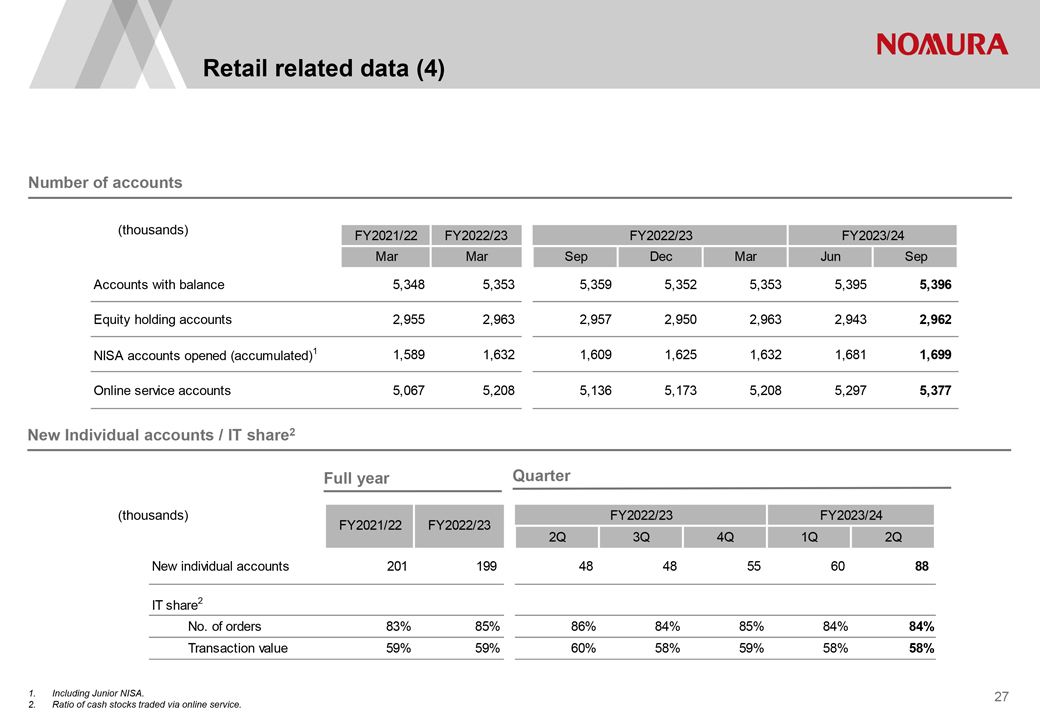
NOMURA Retail related data (4)
Number of accounts
(thousands) FY2021/22 FY2022/23FY2022/23FY2023/24
Mar Mar SepDecMarJunSep
Accounts with balance 5,348 5,3535,3595,3525,3535,3955,396
Equity holding accounts 2,955 2,9632,9572,9502,9632,9432,962
NISA
accounts opened (accumulated)1 1,589 1,6321,6091,6251,6321,6811,699
Online service accounts 5,067 5,2085,1365,1735,2085,2975,377
New Individual accounts / IT share2
Full year Quarter
(thousands) FY2022/23FY2023/24
FY2021/22 FY2022/23
2Q3Q4Q1Q2Q
New individual accounts 201 1994848556088
IT share2
No. of orders 83% 85%86%84%85%84%84%
Transaction value 59% 59%60%58%59%58%58%
1. Including Junior NISA.
2. Ratio of cash stocks traded via online service.
27
|
|
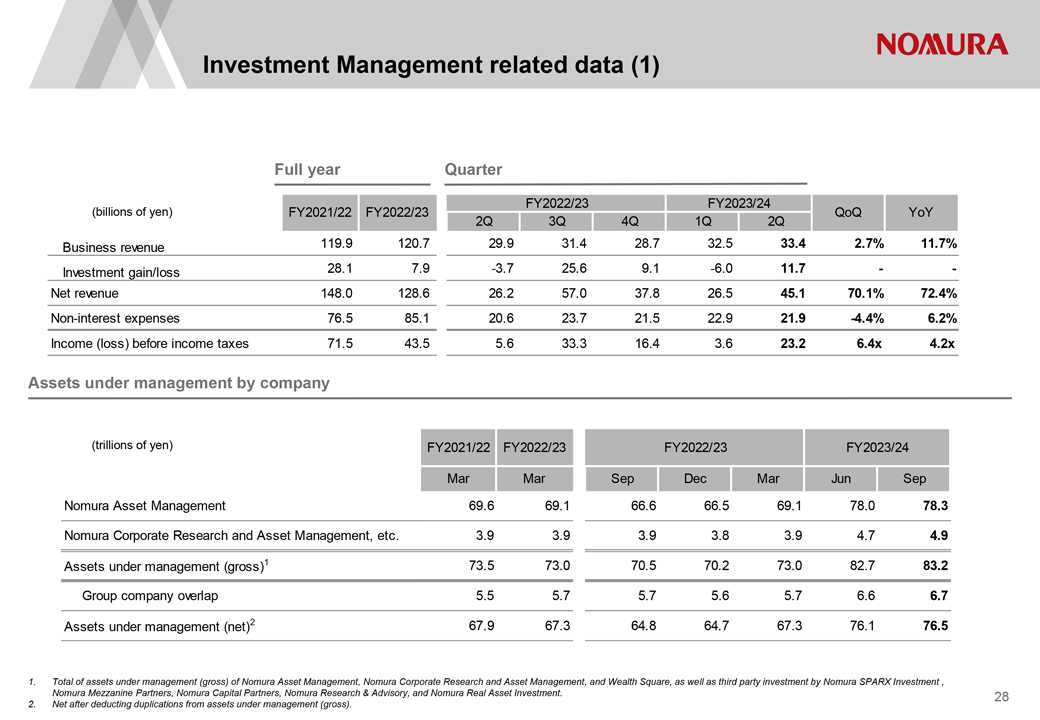
NOMURA Investment Management related data (1)
Full year Quarter
FY2022/23FY2023/24
(billions of yen) FY2021/22 FY2022/23QoQYoY
2Q3Q4Q1Q2Q
Business revenue 119.9 120.729.931.428.732.533.42.7%11.7%
Investment
gain/loss 28.1 7.9-3.725.69.1-6.011.7--
Net revenue 148.0 128.626.257.037.826.545.170.1%72.4%
Non-interest expenses 76.5 85.120.623.721.522.921.9-4.4%6.2%
Income (loss) before income taxes 71.5 43.55.633.316.43.623.26.4x4.2x
Assets under
management by company
(trillions of yen) FY2021/22 FY2022/23FY2022/23FY2023/24
MarMarSepDecMarJunSep
Nomura Asset Management 69.669.166.666.569.178.078.3
Nomura Corporate Research and Asset Management, etc. 3.9 3.93.93.83.94.74.9
Assets under
management (gross)1 73.573.070.570.273.082.783.2
Group company overlap 5.55.75.75.65.76.66.7
Assets under management (net)2 67.967.364.864.767.376.176.5
1. Total of assets under
management (gross) of Nomura Asset Management, Nomura Corporate Research and Asset Management, and Wealth Square, as well as third party investment by Nomura SPARX Investment , Nomura Mezzanine Partners, Nomura Capital Partners, Nomura
Research & Advisory, and Nomura Real Asset Investment.
2. Net after deducting duplications from assets under management (gross).
28
|
|
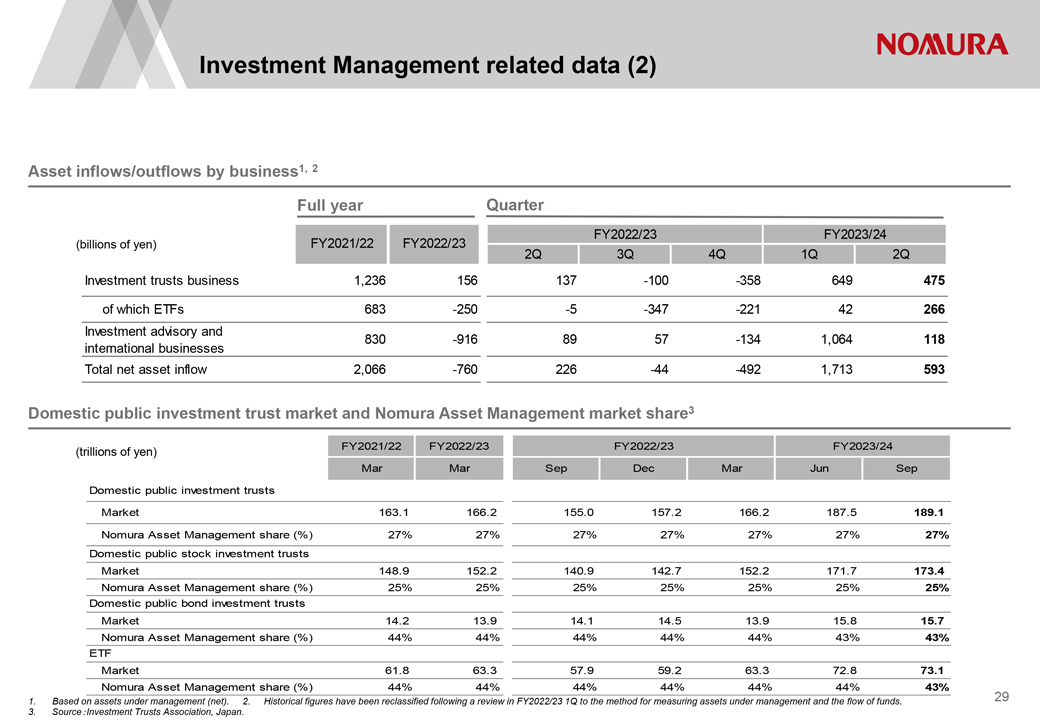
NOMURA Investment Management related data (2)
Asset inflows/outflows by business1, 2
Full year Quarter
FY2022/23FY2023/24
(billions of yen) FY2021/22 FY2022/23
2Q3Q4Q1Q2Q
Investment trusts business 1,236156137-100-358649475
of which ETFs 683-250-5-347-22142266
Investment advisory and
830-9168957-1341,064118
international businesses
Total net asset
inflow 2,066-760226-44-4921,713593
Domestic public investment trust market and Nomura Asset Management market share3
(trillions of yen) FY2021/22FY2022/23FY2022/23FY2023/24
Mar MarSepDecMarJunSep
Domestic public investment trusts
Market
163.1166.2155.0157.2166.2187.5189.1
Nomura Asset Management share (%) 27%27%27%27%27%27%27%
Domestic public stock investment trusts
Market
148.9152.2140.9142.7152.2171.7173.4
Nomura Asset Management share (%) 25%25%25%25%25%25%25%
Domestic public bond investment trusts
Market 14.213.914.114.513.915.815.7
Nomura Asset Management share (%) 44%44%44%44%44%43%43%
ETF
Market 61.863.357.959.263.372.873.1
Nomura Asset Management share
(%) 44%44%44%44%44%44%43%
1. Based on assets under management (net). 2. Historical figures have been reclassified following a review in
FY2022/23 1Q to the method for measuring assets under management and the flow of funds.
3. Source Investment Trusts Association, Japan.
29
|

|
NOMURA Wholesale related data
Full year Quarter
(billions of yen)
FY2022/23FY2023/24
FY2021/22 FY2022/23 QoQYoY
2Q3Q4Q1Q2Q
Net revenue 703.1 772.4205.5189.1178.8190.9204.16.9%-0.7%
Non-interest expenses 628.6 743.0185.3190.9193.1188.7195.83.7%5.7%
Income (loss) before income taxes 74.5 29.420.2-1.9-14.22.18.33.9x-59.1%
Breakdown of
Wholesale revenues
Full year Quarter
(billions of yen)
FY2022/23FY2023/24
FY2021/22 FY2022/23 QoQYoY
2Q3Q4Q1Q2Q
Fixed Income 326.9 402.4115.686.787.597.496.9-0.5%-16.2%
Equities 229.5 253.961.967.561.863.073.817.2%19.2%
Global Markets 556.4
656.3177.5154.3149.3160.4170.76.4%-3.8%
Investment Banking 146.6 116.128.034.829.630.533.49.5%19.2%
Net revenue 703.1 772.4205.5189.1178.8190.9204.16.9%-0.7%
30
|
|
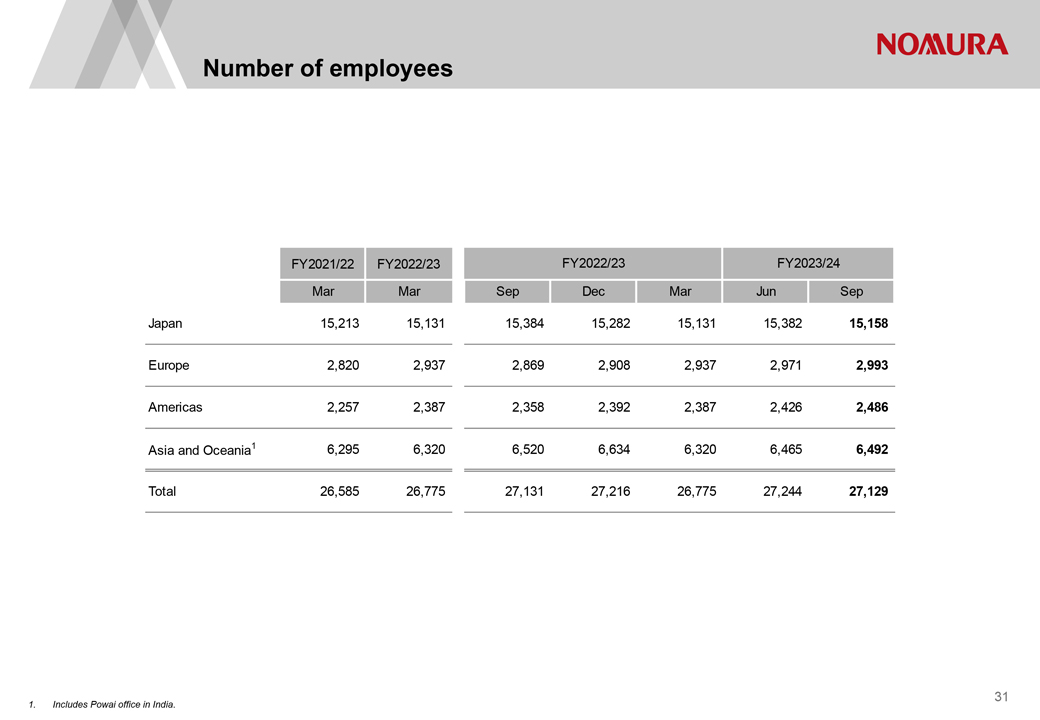
NOMURA Number of employees
FY2021/22 FY2022/23 FY2022/23FY2023/24
Mar Mar SepDecMarJunSep
Japan 15,213 15,13115,38415,28215,13115,38215,158
Europe 2,820
2,9372,8692,9082,9372,9712,993
Americas 2,257 2,3872,3582,3922,3872,4262,486
Asia and Oceania1 6,295 6,3206,5206,6346,3206,4656,492
Total 26,585
26,77527,13127,21626,77527,24427,129
1. Includes Powai office in India.
31
|
|
NOMURA Disclaimer
This document is produced by Nomura Holdings, Inc. (“Nomura”).
Nothing in this
document shall be considered as an offer to sell or solicitation of an offer to buy any security, commodity or other instrument, including securities issued by Nomura or any affiliate thereof. Offers to sell, sales, solicitations to buy, or
purchases of any securities issued by Nomura or any affiliate thereof may only be made or entered into pursuant to appropriate offering materials or a prospectus prepared and distributed according to the laws, regulations, rules and market practices
of the jurisdictions in which such offers or sales may be made.
The information and opinions contained in this document have been obtained from sources believed to
be reliable, but no representations or warranty, express or implied, are made that such information is accurate or complete and no responsibility or liability can be accepted by Nomura for errors or omissions or for any losses arising from the use
of this information.
All rights regarding this document are reserved by Nomura unless otherwise indicated. No part of this document shall be reproduced, stored in
a retrieval system or transmitted in any form or by any means, electronic, mechanical, photocopying, recording or otherwise, without the prior written permission of Nomura.
This document contains statements that may constitute, and from time to time our management may make “forward-looking statements” within the meaning of the safe harbor
provisions of The Private Securities Litigation Reform Act of 1995. Any such statements must be read in the context of the offering materials pursuant to which any securities may be offered or sold in the United States. These forward-looking
statements are not historical facts but instead represent only our belief regarding future events, many of which, by their nature, are inherently uncertain and outside our control. Actual results and financial condition may differ, possibly
materially, from what is indicated in those forward-looking statements. You should not place undue reliance on any forward-looking statement and should consider all of the following uncertainties and risk factors, as well as those more fully
discussed under Nomura’s most recent Annual Report on Form 20-F and other reports filed with the U.S. Securities and Exchange Commission (“SEC”) that are available on Nomura’s website
(https://www.nomura.com) and on the SEC‘s website (https://www.sec.gov); Important risk factors that could cause actual results to differ from those in specific forward-looking statements include, without limitation, economic and market
conditions, political events and investor sentiments, liquidity of secondary markets, level and volatility of interest rates, currency exchange rates, security valuations, competitive conditions and size, and the number and timing of transactions.
Forward-looking statements speak only as of the date they are made, and Nomura undertakes no obligation to update any forward-looking statement to reflect the
impact of circumstances or events that arise after the date the forward-looking statement was made.
The consolidated financial information in this document is
unaudited.
|

|
NOMURA Nomura Holdings, Inc.
www.nomura.com
Nomura (NYSE:NMR)
Historical Stock Chart
From Apr 2024 to May 2024

Nomura (NYSE:NMR)
Historical Stock Chart
From May 2023 to May 2024
