UNITED STATES
SECURITIES AND EXCHANGE
COMMISSION
Washington, D.C.
20549
FORM 6-K
Report of Foreign
Private Issuer
Pursuant to Rule 13a-16
or 15d-16 under
the Securities Exchange
Act of 1934
Report on Form 6-K
dated October 19, 2023
(Commission File
No. 1-13202)
Nokia Corporation
Karakaari 7
FI-02610 Espoo
Finland
(Translation
of the registrant’s name into English and address of registrant’s principal executive office)
Indicate
by check mark whether the registrant files or will file annual reports under cover of Form 20-F or Form 40-F:
| Form 20-F: x |
|
Form 40-F: ¨ |
Enclosures:
| · | Stock
Exchange Release: Nokia Corporation Interim Report for Q3 2023 |
| · | Enclosures:
Interim Report for Q3 2023 (PDF) |
 |
|
STOCK EXCHANGE RELEASE
19 October 2023 |
Nokia Corporation
Interim Report
19 October 2023 at 08:00 EEST
Nokia Corporation Interim Report
for Q3 2023
Outlook maintained despite weak operator
spending weighing on Q3
| · | Q3
net sales declined 15% y-o-y in constant currency (-20% reported) as macroeconomic uncertainty
and higher interest rates continue to pressure operator spending. |
| · | Enterprise
net sales grew 5% y-o-y in constant currency (flat reported). |
| · | Comparable
gross margin declined 120bps y-o-y to 39.2% (reported declined 140bps to 38.7%) due mainly
to regional mix in Mobile Networks. Sequentially Mobile Networks gross margin improved 140bps
due to favorable regional mix. |
| · | Comparable
operating margin declined y-o-y by 200bps to 8.5% (reported declined 350bps to 4.8%) , demonstrating
the resilience of our profitability relative to the net sales decline. |
| · | Comparable
diluted EPS of EUR 0.05; reported diluted EPS of EUR 0.02. |
| · | Free
cash flow negative EUR 0.4bn, net cash balance EUR 3.0bn, working capital headwinds expected
to ease starting Q4. |
| · | Announces
acceleration in strategy execution giving increased operational autonomy to business groups.
Operating model change to embed sales teams into business groups. Target EUR
800 to 1 200 million gross cost savings by 2026. |
| · | Nokia
continues to expect full year 2023 net sales in the range of EUR 23.2 to 24.6 billion with
a comparable operating margin in the range of 11.5% to 13.0%
assuming closure of outstanding deals in Nokia Technologies. |
This is a summary of the Nokia Corporation
Q3 and January-September 2023 Interim Report published today. Nokia only publishes a summary of its financial reports in stock exchange
releases. The summary focuses on Nokia Group's financial information as well as on Nokia's outlook. The detailed, segment-level discussion
will be available in the complete financial report hosted at www.nokia.com/financials. A video interview summarizing the key points
of our Q3 results will also be published on the website. Investors should not solely rely on summaries of Nokia's financial reports and
should also review the complete reports with tables.
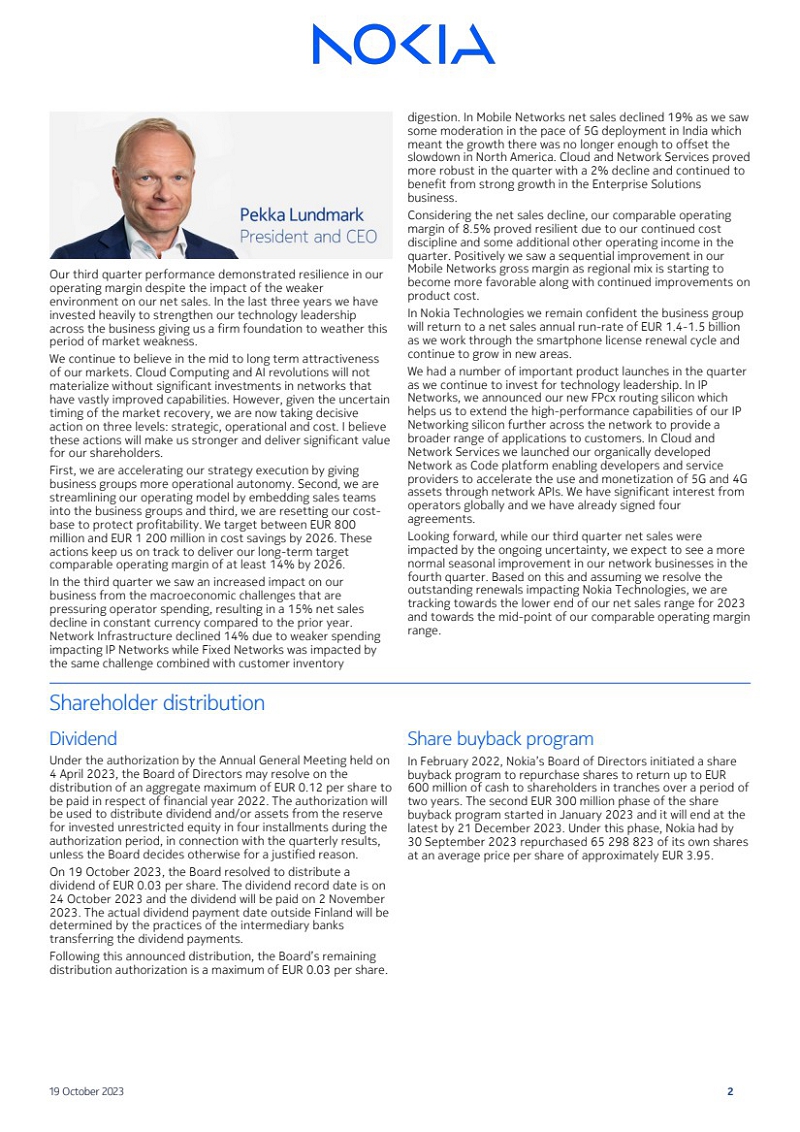
PEKKA LUNDMARK, PRESIDENT AND CEO,
ON Q3 2023 RESULTS
Our third quarter performance demonstrated
resilience in our operating margin despite the impact of the weaker environment on our net sales. In the last three years we have invested
heavily to strengthen our technology leadership across the business giving us a firm foundation to weather this period of market weakness.
| |
|
STOCK EXCHANGE RELEASE
19 October 2023 |
We continue to believe in the mid to
long term attractiveness of our markets. Cloud Computing and AI revolutions will not materialize without significant investments in networks
that have vastly improved capabilities. However, given the uncertain timing of the market recovery, we are now taking decisive action
on three levels: strategic, operational and cost. I believe these actions will make us stronger and deliver significant value for our
shareholders.
First, we are accelerating our strategy
execution by giving business groups more operational autonomy. Second, we are streamlining our operating model by embedding sales teams
into the business groups and third, we are resetting our cost-base to protect profitability. We target between EUR 800 million and EUR
1 200 million in cost savings by 2026. These actions keep us on track to deliver our long-term target comparable operating margin of
at least 14% by 2026.
In the third quarter we saw an increased
impact on our business from the macroeconomic challenges that are pressuring operator spending, resulting in a 15% net sales decline
in constant currency compared to the prior year. Network Infrastructure declined 14% due to weaker spending impacting IP Networks while
Fixed Networks was impacted by the same challenge combined with customer inventory digestion. In Mobile Networks net sales declined 19%
as we saw some moderation in the pace of 5G deployment in India which meant the growth there was no longer enough to offset the slowdown
in North America. Cloud and Network Services proved more robust in the quarter with a 2% decline and continued to benefit from strong
growth in the Enterprise Solutions business.
Considering the net sales decline, our
comparable operating margin of 8.5% proved resilient due to our continued cost discipline and some additional other operating income
in the quarter. Positively we saw a sequential improvement in our Mobile Networks gross margin as regional mix is starting to become
more favorable along with continued improvements on product cost.
In Nokia Technologies we remain confident
the business group will return to a net sales annual run-rate of EUR 1.4-1.5 billion as we work through the smartphone license renewal
cycle and continue to grow in new areas.
We had a number of important product
launches in the quarter as we continue to invest for technology leadership. In IP Networks, we announced our new FPcx routing silicon
which helps us to extend the high-performance capabilities of our IP Networking silicon further across the network to provide a broader
range of applications to customers. In Cloud and Network Services we launched our organically developed Network as Code platform enabling
developers and service providers to accelerate the use and monetization of 5G and 4G assets through network APIs. We have significant
interest from operators globally and we have already signed four agreements.
Looking forward, while our third quarter
net sales were impacted by the ongoing uncertainty, we expect to see a more normal seasonal improvement in our network businesses in
the fourth quarter. Based on this and assuming we resolve the outstanding renewals impacting Nokia Technologies, we are tracking towards
the lower end of our net sales range for 2023 and towards the mid-point of our comparable operating margin range.
| |
|
STOCK EXCHANGE RELEASE
19 October 2023 |
FINANCIAL RESULTS
| EUR million (except for
EPS in EUR) | |
Q3'23 | | |
Q3'22 | | |
YoY
change | | |
Constant
currency
YoY
change | | |
Q1-
Q3'23 | | |
Q1-
Q3'22 | | |
YoY
change | | |
Constant
currency
YoY
change | |
| Reported results | |
| | | |
| | | |
| | | |
| | | |
| | | |
| | | |
| | | |
| | |
| Net sales | |
| 4 982 | | |
| 6 241 | | |
| (20 | )% | |
| (15 | )% | |
| 16 551 | | |
| 17 462 | | |
| (5 | )% | |
| (3 | )% |
| Gross margin % | |
| 38.7 | % | |
| 40.1 | % | |
| (140 | )bps | |
| | | |
| 38.1 | % | |
| 40.3 | % | |
| (220 | )bps | |
| | |
| Research and development expenses | |
| (1 081 | ) | |
| (1 165 | ) | |
| (7 | )% | |
| | | |
| (3 235 | ) | |
| (3 328 | ) | |
| (3 | )% | |
| | |
| Selling, general and administrative expenses | |
| (710 | ) | |
| (771 | ) | |
| (8 | )% | |
| | | |
| (2 142 | ) | |
| (2 174 | ) | |
| (1 | )% | |
| | |
| Operating profit | |
| 241 | | |
| 518 | | |
| (53 | )% | |
| | | |
| 1 141 | | |
| 1 436 | | |
| (21 | )% | |
| | |
| Operating margin % | |
| 4.8 | % | |
| 8.3 | % | |
| (350 | )bps | |
| | | |
| 6.9 | % | |
| 8.2 | % | |
| (130 | )bps | |
| | |
| Profit for the period | |
| 133 | | |
| 428 | | |
| (69 | )% | |
| | | |
| 711 | | |
| 1 107 | | |
| (36 | )% | |
| | |
| EPS, diluted | |
| 0.02 | | |
| 0.08 | | |
| (75 | )% | |
| | | |
| 0.13 | | |
| 0.19 | | |
| (32 | )% | |
| | |
| Net cash and interest-bearing financial investments | |
| 2 960 | | |
| 4 655 | | |
| (36 | )% | |
| | | |
| 2 960 | | |
| 4 655 | | |
| (36 | )% | |
| | |
| Comparable results | |
| | | |
| | | |
| | | |
| | | |
| | | |
| | | |
| | | |
| | |
| Net sales | |
| 4 982 | | |
| 6 241 | | |
| (20 | )% | |
| (15 | )% | |
| 16 551 | | |
| 17 462 | | |
| (5 | )% | |
| (3 | )% |
| Gross margin % | |
| 39.2 | % | |
| 40.4 | % | |
| (120 | )bps | |
| | | |
| 38.5 | % | |
| 40.6 | % | |
| (210 | )bps | |
| | |
| Research and development expenses | |
| (1 037 | ) | |
| (1 139 | ) | |
| (9 | )% | |
| | | |
| (3 156 | ) | |
| (3 261 | ) | |
| (3 | )% | |
| | |
| Selling, general and administrative expenses | |
| (605 | ) | |
| (674 | ) | |
| (10 | )% | |
| | | |
| (1 864 | ) | |
| (1 878) | | |
| (1 | )% | |
| | |
| Operating profit | |
| 424 | | |
| 658 | | |
| (36 | )% | |
| | | |
| 1 529 | | |
| 1 955 | | |
| (22 | )% | |
| | |
| Operating margin % | |
| 8.5 | % | |
| 10.5 | % | |
| (200 | )bps | |
| | | |
| 9.2 | % | |
| 11.2 | % | |
| (200 | )bps | |
| | |
| Profit for the period | |
| 299 | | |
| 551 | | |
| (46 | )% | |
| | | |
| 1 055 | | |
| 1 552 | | |
| (32 | )% | |
| | |
| EPS, diluted | |
| 0.05 | | |
| 0.10 | | |
| (50 | )% | |
| | | |
| 0.19 | | |
| 0.27 | | |
| (30 | )% | |
| | |
| ROIC1 | |
| 12.0 | % | |
| 17.5 | % | |
| (550 | )bps | |
| | | |
| 12.0 | % | |
| 17.5 | % | |
| (550 | )bps | |
| | |
1 Comparable ROIC = Comparable
operating profit after tax, last four quarters / invested capital, average of last five quarters’ ending balances. Refer to the
Performance measures section in Nokia Corporation Q3 and January-September 2023 Interim Report for details.
| Business group results | |
Network
Infrastructure | | |
Mobile
Networks | | |
Cloud and Network
Services | | |
Nokia
Technologies | | |
Group Common
and Other | |
| EUR million | |
Q3'23 | | |
Q3'22 | | |
Q3'23 | | |
Q3'22 | | |
Q3'23 | | |
Q3'22 | | |
Q3'23 | | |
Q3'22 | | |
Q3'23 | | |
Q3'22 | |
| Net sales | |
| 1 807 | | |
| 2 211 | | |
| 2 157 | | |
| 2 851 | | |
| 742 | | |
| 801 | | |
| 258 | | |
| 305 | | |
| 22 | | |
| 84 | |
| YoY change | |
| (18 | )% | |
| | | |
| (24 | )% | |
| | | |
| (7 | )% | |
| | | |
| (15 | )% | |
| | | |
| (74 | )% | |
| | |
| Constant currency YoY change | |
| (14 | )% | |
| | | |
| (19 | )% | |
| | | |
| (2 | )% | |
| | | |
| (14 | )% | |
| | | |
| (74 | )% | |
| | |
| Gross margin % | |
| 36.3 | % | |
| 35.6 | % | |
| 34.8 | % | |
| 39.4 | % | |
| 39.1 | % | |
| 39.0 | % | |
| 100.0 | % | |
| 99.7 | % | |
| 0.0 | % | |
| (4.8 | )% |
| Operating profit/(loss) | |
| 171 | | |
| 228 | | |
| 99 | | |
| 278 | | |
| 36 | | |
| 16 | | |
| 181 | | |
| 207 | | |
| (62 | ) | |
| (70 | ) |
| Operating margin % | |
| 9.5 | % | |
| 10.3 | % | |
| 4.6 | % | |
| 9.8 | % | |
| 4.9 | % | |
| 2.0 | % | |
| 70.2 | % | |
| 67.9 | % | |
| (281.8 | )% | |
| (83.3 | )% |
| |
|
STOCK EXCHANGE RELEASE
19 October 2023 |
SHAREHOLDER DISTRIBUTION
Dividend
Under the authorization
by the Annual General Meeting held on 4 April 2023, the Board of Directors may resolve on the distribution of an aggregate maximum
of EUR 0.12 per share to be paid in respect of financial year 2022. The authorization will be used to distribute dividend and/or assets
from the reserve for invested unrestricted equity in four installments during the authorization period, in connection with the quarterly
results, unless the Board decides otherwise for a justified reason.
On 19 October 2023,
the Board resolved to distribute a dividend of EUR 0.03 per share. The dividend record date is on 24 October 2023 and the dividend
will be paid on 2 November 2023. The actual dividend payment date outside Finland will be determined by the practices of the intermediary
banks transferring the dividend payments.
Following this
announced distribution, the Board’s remaining distribution authorization is a maximum of EUR 0.03 per share.
Share buyback program
In February 2022,
Nokia’s Board of Directors initiated a share buyback program to repurchase shares to return up to EUR 600 million of cash to shareholders
in tranches over a period of two years. The second EUR 300 million phase of the share buyback program started in January 2023 and
it will end at the latest by 21 December 2023. Under this phase, Nokia had by 30 September 2023 repurchased 65 298 823 of its
own shares at an average price per share of approximately EUR 3.95.
OUTLOOK
| |
Full
Year 2023 |
| Net
sales1 |
EUR
23.2 billion to EUR 24.6 billion (-4% to +2% growth in constant currency) |
| Comparable
operating margin2 |
11.5
to 13.0% |
| Free
cash flow2 |
20
to 50% conversion from comparable operating profit |
1Assuming
the rate 1 EUR = 1.06 USD as of 30 September 2023 continues for the remainder of 2023 along with actual year-to-date foreign exchange
rates (adjusted from prior 1.09 USD rate as of 30 June 2023).
2 Please refer to Performance
measures section in Nokia Corporation Q3 and January-September 2023 Interim for a full explanation of how these terms are defined.
The outlook, long-term targets and all
of the underlying outlook assumptions described below are forward-looking statements subject to a number of risks and uncertainties as
described or referred to in the Risk Factors section later in this release. Along with Nokia's official outlook targets provided above,
below are outlook assumptions by business group that support the group level outlook. The comments for relative growth by business group
are provided to give a reference on how we expect each to perform relative to the overall group.
| |
2023
total addressable market |
Nokia
business group assumptions |
| |
Size
(EUR bn)1 |
Constant
currency growth |
Net
sales growth |
Operating
margin |
| Network
Infrastructure2 |
43
(update) |
-1%
(update) |
Below
group |
12.0
to 14.0% |
| Mobile
Networks3 |
44
(update) |
-9%
(update) |
In-line
to faster than group (update) |
6.0
to 8.0% |
| Cloud
and Network Services |
27 |
2%
(update) |
Faster
than group |
6.0
to 8.0% |
1 Total
addressable market forecasts assume the rate 1 EUR = 1.06 USD as of 30 September 2023 continues for the remainder of 2023 along
with actual year-to-date foreign exchange rates. The addressable market is excluding Russia and Belarus.
2 Excluding
Submarine Networks.
3 Excluding
China.
| |
|
STOCK EXCHANGE RELEASE
19 October 2023 |
Nokia provides the following approximate
outlook assumptions for additional items concerning 2023:
| |
Full
year 2023 |
Comment |
| Nokia
Technologies operating profit |
Largely
stable |
Assuming
closure of outstanding litigation / renewal discussions we expect largely stable operating
profit in Nokia Technologies in 2023.
Nokia currently assumes free cash
flow will be meaningfully greater than operating profit in Nokia Technologies. |
| Group
Common and Other operating profit |
Negative
EUR
400 million |
This
includes central function costs which are expected to be largely stable at below EUR 200 million and an increase in investment in
long-term research now above EUR 100 million. This line also accounts for Radio Frequency Systems (RFS) and could be impacted by
any positive or negative revaluations in Nokia's venture funds in 2023. |
| Comparable
financial income and expenses |
Negative
EUR 100 to EUR 150 million (update) |
Reflecting
year-to-date results and the impact of higher interest expenses and foreign exchange rate volatility. |
| Comparable
income tax rate |
~25% |
Following
the re-recognition of deferred tax assets at the end of 2022 we now provide an assumption based on a % tax rate instead of an absolute
amount. |
| Cash
outflows related to income taxes |
EUR
700 million |
Cash
outflows related to income taxes are expected to increase due to mandatory capitalization of R&D costs under U.S. tax laws as
well as evolving regional mix. |
| Capital
Expenditures |
EUR
700 million |
|
LONG-TERM TARGETS
Nokia's long-term targets remain unchanged
from those introduced with its Q4 2021 financial results. The targets had an associated timeline of 3-5 years which remains unchanged
and implies by 2024-2026. These targets remain intended to show Nokia's ambition to deliver continuous improvement in the business over
the time period.
| Net
sales |
Grow
faster than the market |
| Comparable
operating margin1 |
≥
14% |
| Free
cash flow1 |
55
to 85% conversion from comparable operating profit |
1 Please refer to Performance
measures section in Nokia Corporation Q3 and January-September 2023 Interim Report for a full explanation of how these terms are
defined.
RISK FACTORS
Nokia and its businesses are exposed
to a number of risks and uncertainties which include but are not limited to:
| · | Competitive
intensity, which is expected to continue at a high level as some competitors seek to take
share; |
| · | Our
ability to ensure competitiveness of our product roadmaps and costs through additional R&D
investments; |
| · | Our
ability to procure certain standard components and the costs thereof, such as semiconductors; |
| · | Disturbance
in the global supply chain; |
| · | Accelerating
inflation, increased global macro-uncertainty, major currency fluctuations and higher interest
rates; |
| |
|
STOCK EXCHANGE RELEASE
19 October 2023 |
| · | Potential
economic impact and disruption of global pandemics; |
| · | War
or other geopolitical conflicts, disruptions and potential costs thereof; |
| · | Other
macroeconomic, industry and competitive developments; |
| · | Timing
and value of new, renewed and existing patent licensing agreements with smartphone vendors,
automotive companies, consumer electronics companies and other licensees; |
| · | Results
in brand and technology licensing; costs to protect and enforce our intellectual property
rights; on-going litigation with respect to licensing and regulatory landscape for patent
licensing; |
| · | The
outcomes of on-going and potential disputes and litigation; |
| · | Timing
of completions and acceptances of certain projects; |
| · | Our
product and regional mix; |
| · | Uncertainty
in forecasting income tax expenses and cash outflows, over the long-term, as they are also
subject to possible changes due to business mix, the timing of patent licensing cash flow
and changes in tax legislation, including potential tax reforms in various countries and
OECD initiatives; |
| · | Our
ability to utilize our US and Finnish deferred tax assets and their recognition on our balance
sheet; |
| · | Our
ability to meet our sustainability and other ESG targets, including our targets relating
to greenhouse gas emissions; |
as well the risk factors specified under
Forward-looking statements of this release, and our 2022 annual report on Form 20-F
published on 2 March 2023 under Operating and financial review and prospects-Risk factors.
FORWARD-LOOKING STATEMENTS
Certain statements herein that are not
historical facts are forward-looking statements. These forward-looking statements reflect Nokia's current expectations and views of future
developments and include statements regarding: A) expectations, plans, benefits or outlook related to our strategies, product launches,
growth management, licenses, sustainability and other ESG targets, operational key performance indicators and decisions on market exits;
B) expectations, plans or benefits related to future performance of our businesses (including the expected impact, timing and duration
of potential global pandemics and the general or regional macroeconomic conditions on our businesses, our supply chain and our customers’
businesses) and any future dividends and other distributions of profit; C) expectations and targets regarding financial performance and
results of operations, including market share, prices, net sales, income, margins, cash flows, the timing of receivables, operating expenses,
provisions, impairments, taxes, currency exchange rates, hedging, investment funds, inflation, product cost reductions, competitiveness,
revenue generation in any specific region, and licensing income and payments; D) ability to execute, expectations, plans or benefits
related to changes in organizational structure and operating model; E) impact on revenue with respect to litigation/renewal discussions;
and F) any statements preceded by or including "continue", “believe”, “commit”, “estimate”,
“expect”, “aim”, “influence”, "will”, “target”, “likely”, “intend”,
“may”, “could”, “would” or similar expressions. These forward-looking statements are subject to a
number of risks and uncertainties, many of which are beyond our control, which could cause our actual results to differ materially from
such statements. These statements are based on management’s best assumptions and beliefs in light of the information currently
available to them. These forward-looking statements are only predictions based upon our current expectations and views of future events
and developments and are subject to risks and uncertainties that are difficult to predict because they relate to events and depend on
circumstances that will occur in the future. Factors, including risks and uncertainties that could cause these differences, include those
risks and uncertainties identified in the Risk Factors above.
| |
|
STOCK EXCHANGE RELEASE
19 October 2023 |
ANALYST WEBCAST
| · | Nokia's
webcast will begin on 19 October 2023 at 11.30 a.m. Finnish time (EEST). The
webcast will last approximately 60 minutes. |
| · | The
webcast will be a presentation followed by a Q&A session. Presentation slides will be
available for download at www.nokia.com/financials. |
| · | A
link to the webcast will be available at www.nokia.com/financials. |
| · | Media
representatives can listen in via the link, or alternatively call +1-412-317-5619. |
FINANCIAL CALENDAR
| · | Nokia
plans to publish its fourth quarter and full year 2023 results on 25 January 2024. |
About Nokia
At Nokia, we create technology that
helps the world act together.
As a B2B technology innovation leader,
we are pioneering networks that sense, think and act by leveraging our work across mobile, fixed and cloud networks. In addition, we
create value with intellectual property and long-term research, led by the award-winning Nokia Bell Labs.
Service providers, enterprises and partners
worldwide trust Nokia to deliver secure, reliable and sustainable networks today – and work with us to create the digital services
and applications of the future.
Inquiries:
Nokia
Communications
Phone: +358 10 448 4900
Email: press.services@nokia.com
Kaisa Antikainen,
Communications Manager
Nokia
Investor Relations
Phone: +358 4080 3 4080
Email: investor.relations@nokia.com
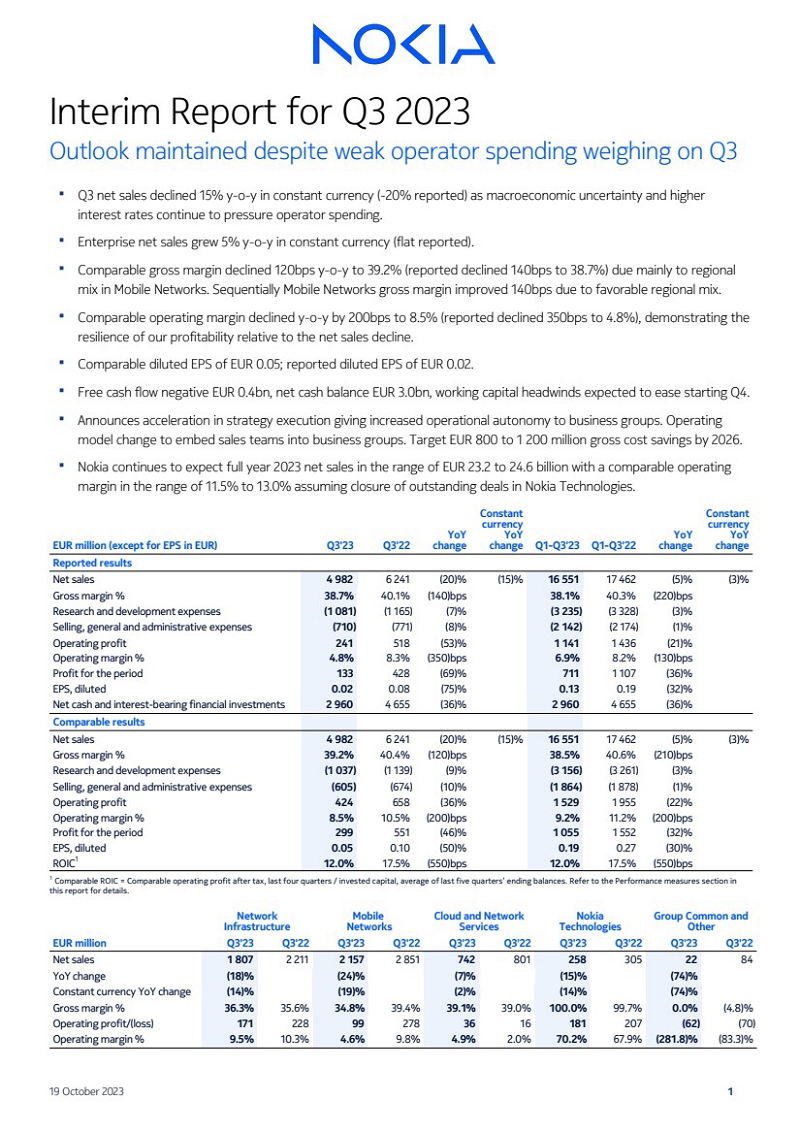
| Interim Report for Q3 2023
Outlook maintained despite weak operator spending weighing on Q3
▪ Q3 net sales declined 15% y-o-y in constant currency (-20% reported) as macroeconomic uncertainty and higher
interest rates continue to pressure operator spending.
▪ Enterprise net sales grew 5% y-o-y in constant currency (flat reported).
▪ Comparable gross margin declined 120bps y-o-y to 39.2% (reported declined 140bps to 38.7%) due mainly to regional
mix in Mobile Networks. Sequentially Mobile Networks gross margin improved 140bps due to favorable regional mix.
▪ Comparable operating margin declined y-o-y by 200bps to 8.5% (reported declined 350bps to 4.8%), demonstrating the
resilience of our profitability relative to the net sales decline.
▪ Comparable diluted EPS of EUR 0.05; reported diluted EPS of EUR 0.02.
▪ Free cash flow negative EUR 0.4bn, net cash balance EUR 3.0bn, working capital headwinds expected to ease starting Q4.
▪ Announces acceleration in strategy execution giving increased operational autonomy to business groups. Operating
model change to embed sales teams into business groups. Target EUR 800 to 1 200 million gross cost savings by 2026.
▪ Nokia continues to expect full year 2023 net sales in the range of EUR 23.2 to 24.6 billion with a comparable operating
margin in the range of 11.5% to 13.0% assuming closure of outstanding deals in Nokia Technologies.
EUR million (except for EPS in EUR) Q3'23 Q3'22
YoY
change
Constant
currency
YoY
change Q1-Q3'23 Q1-Q3'22
YoY
change
Constant
currency
YoY
change
Reported results
Net sales 4 982 6 241 (20)% (15)% 16 551 17 462 (5)% (3)%
Gross margin % 38.7% 40.1% (140)bps 38.1% 40.3% (220)bps
Research and development expenses (1 081) (1 165) (7)% (3 235) (3 328) (3)%
Selling, general and administrative expenses (710) (771) (8)% (2 142) (2 174) (1)%
Operating profit 241 518 (53)% 1 141 1 436 (21)%
Operating margin % 4.8% 8.3% (350)bps 6.9% 8.2% (130)bps
Profit for the period 133 428 (69)% 711 1 107 (36)%
EPS, diluted 0.02 0.08 (75)% 0.13 0.19 (32)%
Net cash and interest-bearing financial investments 2 960 4 655 (36)% 2 960 4 655 (36)%
Comparable results
Net sales 4 982 6 241 (20)% (15)% 16 551 17 462 (5)% (3)%
Gross margin % 39.2% 40.4% (120)bps 38.5% 40.6% (210)bps
Research and development expenses (1 037) (1 139) (9)% (3 156) (3 261) (3)%
Selling, general and administrative expenses (605) (674) (10)% (1 864) (1 878) (1)%
Operating profit 424 658 (36)% 1 529 1 955 (22)%
Operating margin % 8.5% 10.5% (200)bps 9.2% 11.2% (200)bps
Profit for the period 299 551 (46)% 1 055 1 552 (32)%
EPS, diluted 0.05 0.10 (50)% 0.19 0.27 (30)%
ROIC1
12.0% 17.5% (550)bps 12.0% 17.5% (550)bps
1
Comparable ROIC = Comparable operating profit after tax, last four quarters / invested capital, average of last five quarters’ ending balances. Refer to the Performance measures section in
this report for details.
Network
Infrastructure
Mobile
Networks
Cloud and Network
Services
Nokia
Technologies
Group Common and
Other
EUR million Q3'23 Q3'22 Q3'23 Q3'22 Q3'23 Q3'22 Q3'23 Q3'22 Q3'23 Q3'22
Net sales 1 807 2 211 2 157 2 851 742 801 258 305 22 84
YoY change (18)% (24)% (7)% (15)% (74)%
Constant currency YoY change (14)% (19)% (2)% (14)% (74)%
Gross margin % 36.3% 35.6% 34.8% 39.4% 39.1% 39.0% 100.0% 99.7% 0.0% (4.8)%
Operating profit/(loss) 171 228 99 278 36 16 181 207 (62) (70)
Operating margin % 9.5% 10.3% 4.6% 9.8% 4.9% 2.0% 70.2% 67.9% (281.8)% (83.3)%
19 October 2023 1 |
| Our third quarter performance demonstrated resilience in our
operating margin despite the impact of the weaker
environment on our net sales. In the last three years we have
invested heavily to strengthen our technology leadership
across the business giving us a firm foundation to weather this
period of market weakness.
We continue to believe in the mid to long term attractiveness
of our markets. Cloud Computing and AI revolutions will not
materialize without significant investments in networks that
have vastly improved capabilities. However, given the uncertain
timing of the market recovery, we are now taking decisive
action on three levels: strategic, operational and cost. I believe
these actions will make us stronger and deliver significant value
for our shareholders.
First, we are accelerating our strategy execution by giving
business groups more operational autonomy. Second, we are
streamlining our operating model by embedding sales teams
into the business groups and third, we are resetting our cost-base to protect profitability. We target between EUR 800
million and EUR 1 200 million in cost savings by 2026. These
actions keep us on track to deliver our long-term target
comparable operating margin of at least 14% by 2026.
In the third quarter we saw an increased impact on our
business from the macroeconomic challenges that are
pressuring operator spending, resulting in a 15% net sales
decline in constant currency compared to the prior year.
Network Infrastructure declined 14% due to weaker spending
impacting IP Networks while Fixed Networks was impacted by
the same challenge combined with customer inventory
digestion. In Mobile Networks net sales declined 19% as we saw
some moderation in the pace of 5G deployment in India which
meant the growth there was no longer enough to offset the
slowdown in North America. Cloud and Network Services proved
more robust in the quarter with a 2% decline and continued to
benefit from strong growth in the Enterprise Solutions
business.
Considering the net sales decline, our comparable operating
margin of 8.5% proved resilient due to our continued cost
discipline and some additional other operating income in the
quarter. Positively we saw a sequential improvement in our
Mobile Networks gross margin as regional mix is starting to
become more favorable along with continued improvements on
product cost.
In Nokia Technologies we remain confident the business group
will return to a net sales annual run-rate of EUR 1.4-1.5 billion
as we work through the smartphone license renewal cycle and
continue to grow in new areas.
We had a number of important product launches in the quarter
as we continue to invest for technology leadership. In IP
Networks, we announced our new FPcx routing silicon which
helps us to extend the high-performance capabilities of our IP
Networking silicon further across the network to provide a
broader range of applications to customers. In Cloud and
Network Services we launched our organically developed
Network as Code platform enabling developers and service
providers to accelerate the use and monetization of 5G and 4G
assets through network APIs. We have significant interest from
operators globally and we have already signed four
agreements.
Looking forward, while our third quarter net sales were
impacted by the ongoing uncertainty, we expect to see a more
normal seasonal improvement in our network businesses in the
fourth quarter. Based on this and assuming we resolve the
outstanding renewals impacting Nokia Technologies, we are
tracking towards the lower end of our net sales range for 2023
and towards the mid-point of our comparable operating margin
range.
Shareholder distribution
Dividend
Under the authorization by the Annual General Meeting held on
4 April 2023, the Board of Directors may resolve on the
distribution of an aggregate maximum of EUR 0.12 per share to
be paid in respect of financial year 2022. The authorization will
be used to distribute dividend and/or assets from the reserve
for invested unrestricted equity in four installments during the
authorization period, in connection with the quarterly results,
unless the Board decides otherwise for a justified reason.
On 19 October 2023, the Board resolved to distribute a
dividend of EUR 0.03 per share. The dividend record date is on
24 October 2023 and the dividend will be paid on 2 November
2023. The actual dividend payment date outside Finland will be
determined by the practices of the intermediary banks
transferring the dividend payments.
Following this announced distribution, the Board’s remaining
distribution authorization is a maximum of EUR 0.03 per share.
Share buyback program
In February 2022, Nokia’s Board of Directors initiated a share
buyback program to repurchase shares to return up to EUR
600 million of cash to shareholders in tranches over a period of
two years. The second EUR 300 million phase of the share
buyback program started in January 2023 and it will end at the
latest by 21 December 2023. Under this phase, Nokia had by
30 September 2023 repurchased 65 298 823 of its own shares
at an average price per share of approximately EUR 3.95.
19 October 2023 2 |
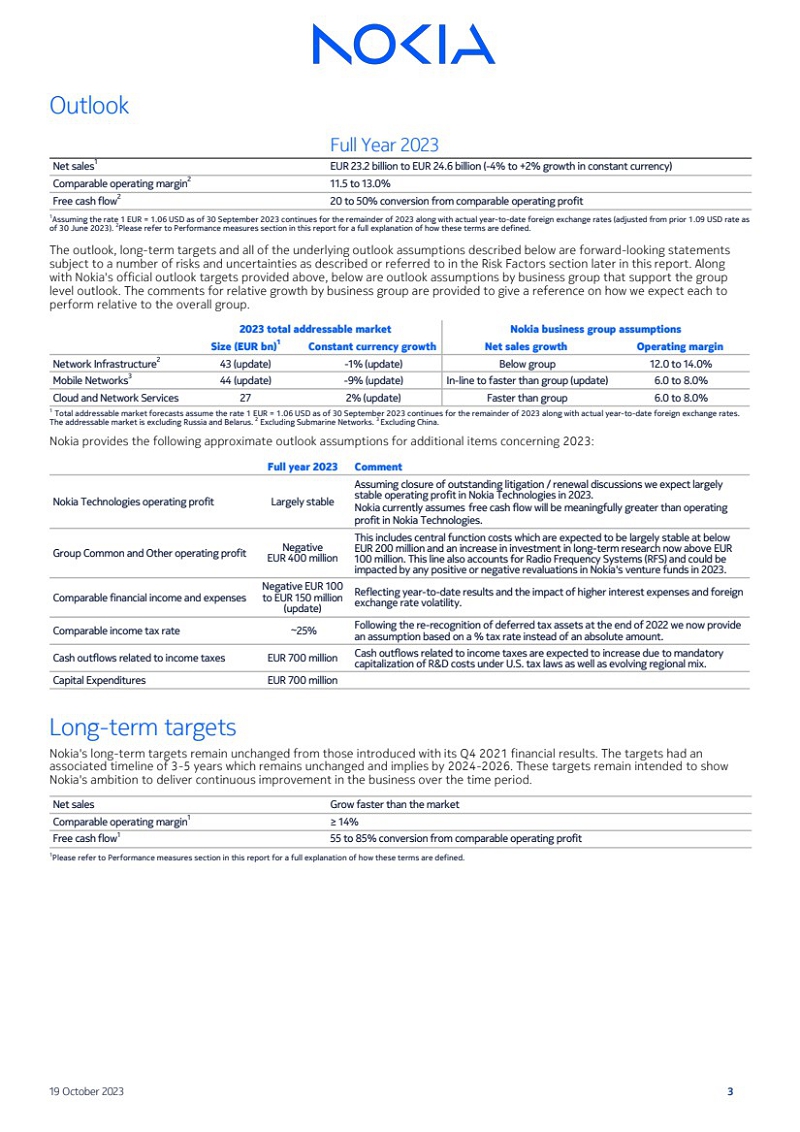
| Outlook
Full Year 2023
Net sales1
EUR 23.2 billion to EUR 24.6 billion (-4% to +2% growth in constant currency)
Comparable operating margin2
11.5 to 13.0%
Free cash flow2
20 to 50% conversion from comparable operating profit
1
Assuming the rate 1 EUR = 1.06 USD as of 30 September 2023 continues for the remainder of 2023 along with actual year-to-date foreign exchange rates (adjusted from prior 1.09 USD rate as
of 30 June 2023). 2
Please refer to Performance measures section in this report for a full explanation of how these terms are defined.
The outlook, long-term targets and all of the underlying outlook assumptions described below are forward-looking statements
subject to a number of risks and uncertainties as described or referred to in the Risk Factors section later in this report. Along
with Nokia's official outlook targets provided above, below are outlook assumptions by business group that support the group
level outlook. The comments for relative growth by business group are provided to give a reference on how we expect each to
perform relative to the overall group.
2023 total addressable market Nokia business group assumptions
Size (EUR bn)1
Constant currency growth Net sales growth Operating margin
Network Infrastructure2
43 (update) -1% (update) Below group 12.0 to 14.0%
Mobile Networks3
44 (update) -9% (update) In-line to faster than group (update) 6.0 to 8.0%
Cloud and Network Services 27 2% (update) Faster than group 6.0 to 8.0%
1
Total addressable market forecasts assume the rate 1 EUR = 1.06 USD as of 30 September 2023 continues for the remainder of 2023 along with actual year-to-date foreign exchange rates.
The addressable market is excluding Russia and Belarus. 2
Excluding Submarine Networks. 3 Excluding China.
Nokia provides the following approximate outlook assumptions for additional items concerning 2023:
Full year 2023 Comment
Nokia Technologies operating profit Largely stable
Assuming closure of outstanding litigation / renewal discussions we expect largely
stable operating profit in Nokia Technologies in 2023.
Nokia currently assumes free cash flow will be meaningfully greater than operating
profit in Nokia Technologies.
Group Common and Other operating profit Negative
EUR 400 million
This includes central function costs which are expected to be largely stable at below
EUR 200 million and an increase in investment in long-term research now above EUR
100 million. This line also accounts for Radio Frequency Systems (RFS) and could be
impacted by any positive or negative revaluations in Nokia's venture funds in 2023.
Comparable financial income and expenses
Negative EUR 100
to EUR 150 million
(update)
Reflecting year-to-date results and the impact of higher interest expenses and foreign
exchange rate volatility.
Comparable income tax rate ~25% Following the re-recognition of deferred tax assets at the end of 2022 we now provide
an assumption based on a % tax rate instead of an absolute amount.
Cash outflows related to income taxes EUR 700 million Cash outflows related to income taxes are expected to increase due to mandatory
capitalization of R&D costs under U.S. tax laws as well as evolving regional mix.
Capital Expenditures EUR 700 million
Long-term targets
Nokia's long-term targets remain unchanged from those introduced with its Q4 2021 financial results. The targets had an
associated timeline of 3-5 years which remains unchanged and implies by 2024-2026. These targets remain intended to show
Nokia's ambition to deliver continuous improvement in the business over the time period.
Net sales Grow faster than the market
Comparable operating margin1
≥ 14%
Free cash flow1
55 to 85% conversion from comparable operating profit
1
Please refer to Performance measures section in this report for a full explanation of how these terms are defined.
19 October 2023 3 |
| Financial Results
Q3 2023 compared to Q3 2022
Net sales
In Q3 2023, reported net sales decreased 20% and were
negatively impacted by foreign exchange rate fluctuations
along with the following drivers.
On a constant currency basis, Nokia's net sales decreased 15%
year-on-year, with declines across all business groups,
particularly Mobile Networks and Network Infrastructure. Mobile
Networks decreased 19% largely driven by North America,
where customers continued to prioritize cash flow and deplete
their inventories. Network Infrastructure declined 14% as it
continued to experience short-term challenges which are
largely related to macroeconomic uncertainty. Nokia
Technologies net sales were down 14% while Cloud and
Network Services showed resilient performance with net sales
decreasing 2%.
Gross margin
Reported gross margin decreased 140 basis points to 38.7% in
Q3 2023 and comparable gross margin decreased 120 basis
points to 39.2%. Gross margin performance mainly reflected
the negative impact of regional mix in Mobile Networks and
lower net sales coverage of fixed costs.
Operating profit and margin
Reported operating profit in Q3 2023 was EUR 241 million, or
4.8% of net sales, down from 8.3% in the year-ago quarter.
Comparable operating profit decreased to EUR 424 million,
while comparable operating margin was 8.5%, down from
10.5% in the year-ago quarter. This decline reflected lower
gross profit, in addition to operating expenses declining at a
slower rate than net sales. Operating expenses were lower
mainly due to foreign exchange fluctuations and lower variable
pay accruals along with continued cost control which helped to
offset the impact of inflation. Additionally, a net positive
fluctuation in other operating income and expenses benefited
operating profit and was related to hedging and the sale of
digital assets.
Nokia's venture fund investments generated a benefit of
approximately EUR 20 million in both Q3 2023 and Q3 2022.
The impact of hedging in Q3 2023 was positive EUR 23 million,
compared to a negative impact of EUR 45 million in Q3 2022.
In Q3 2023, the difference between reported and comparable
operating profit was primarily related to the amortization of
acquired intangible assets and restructuring and associated
charges. In Q3 2022, the difference between reported and
comparable operating profit was related to the amortization of
acquired intangible assets, the impairment and write-off of
assets and restructuring and associated charges.
Profit for the period
Reported net profit in Q3 2023 was EUR 133 million, compared
to EUR 428 million in Q3 2022. Comparable net profit in Q3
2023 was EUR 299 million, compared to EUR 551 million in Q3
2022. The decline in comparable net profit was primarily driven
by the lower comparable operating profit and a net negative
fluctuation in financial income and expenses, which mainly
reflected unfavorable foreign exchange fluctuations. This was
somewhat offset by lower income tax expense.
Apart from the items impacting comparability included in
operating profit (and their associated tax effects), the
difference between reported and comparable net profit in Q3
2023 was related to the impairment and write-off of assets
and the change in financial liability to acquire Nokia Shanghai
Bell non-controlling interest. In Q3 2022, the difference
between reported and comparable net profit was related to the
release of cumulative exchange differences related to the
abandonment of a small foreign operation and the change in
financial liability to acquire Nokia Shanghai Bell non-controlling
interest.
Earnings per share
Reported diluted EPS was EUR 0.02 in Q3 2023, compared to
EUR 0.08 in Q3 2022. Comparable diluted EPS was EUR 0.05 in
Q3 2023 compared to EUR 0.10 in Q3 2022.
Comparable return on Invested Capital (ROIC)
Q3 2023 comparable ROIC was 12.0%, compared to 17.5% in
Q3 2022. The decrease reflected higher average invested
capital for the rolling four quarters, combined with lower
operating profit after tax for the rolling four quarters. The
higher average invested capital reflected growth in average
total equity and a decrease in average total cash and interest-bearing financial investments, partially offset by a decrease in
average total interest-bearing liabilities.
Cash performance
During Q3 2023, net cash decreased EUR 700 million, resulting
in an end-of-quarter net cash balance of EUR 3.0 billion. Total
cash decreased EUR 734 million sequentially to EUR 7.1 billion.
Free cash flow was negative EUR 412 million in Q3 2023.
Additional topics
Nokia accelerates strategy execution, streamlines operational model
and takes actions to protect profitability
Separately, Nokia has announced strategic and operational
changes to its business and a program to reset its cost base.
Nokia is accelerating its strategy execution through providing
its four business groups with increased operational autonomy
and agility. Actions taken to streamline the operational model
will embed the sales and other go-to-market teams into each
of the business groups. This will enable the business groups to
better seize growth opportunities with our existing and new
customers and diversify into enterprise, webscale and
government sectors. The change will bring highly empowered
teams in front of customers that are able to make quicker
decisions based on their needs.
The company will also move to a leaner corporate center that
will provide strategic oversight and guidelines for instance for
financial performance, portfolio development, and compliance.
We will continue our strong commitment to long-term research
through Nokia Bell Labs.
Additionally, to address the challenging market environment,
Nokia will reduce its cost base and increase operational
efficiency while protecting its R&D capacity and commitment to
technology leadership. Nokia targets to lower its cost base on a
gross basis (i.e. before inflation) by between EUR 800 million
and EUR 1 200 million by the end of 2026 compared to 2023,
assuming on-target variable pay in both periods. The program
is expected to lead to a 72 000 to 77 000 employee
organization compared to the 86 000 employees Nokia has
today.
These proposed changes are subject to local consultation
requirements with employee representatives and Nokia’s social
partners where applicable.
19 October 2023 4 |
| Segment Details
Network Infrastructure
EUR million Q3'23 Q3'22 YoY change
Constant
currency YoY
change Q1-Q3'23 Q1-Q3'22 YoY change
Constant
currency YoY
change
Net sales 1 807 2 211 (18)% (14)% 6 034 6 338 (5)% (3)%
- IP Networks 557 773 (28)% (24)% 1 956 2 167 (10)% (8)%
- Optical Networks 439 451 (3)% 4% 1 463 1 251 17% 20%
- Fixed Networks 539 705 (24)% (19)% 1 785 2 088 (15)% (13)%
- Submarine Networks 273 283 (4)% (5)% 829 831 0% 0%
Gross profit 656 788 (17)% 2 246 2 234 1%
Gross margin % 36.3% 35.6% 70bps 37.2% 35.2% 200bps
Operating profit 171 228 (25)% 775 670 16%
Operating margin % 9.5% 10.3% (80)bps 12.8% 10.6% 220bps
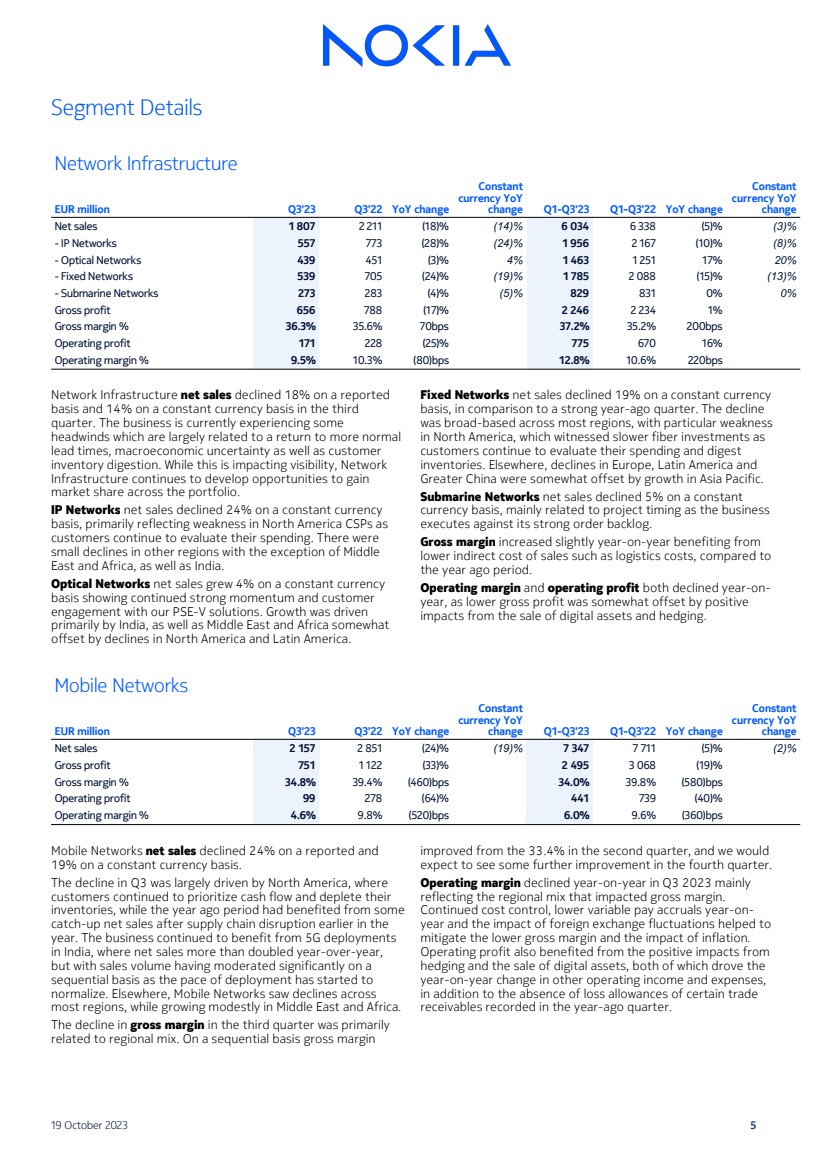
Network Infrastructure net sales declined 18% on a reported
basis and 14% on a constant currency basis in the third
quarter. The business is currently experiencing some
headwinds which are largely related to a return to more normal
lead times, macroeconomic uncertainty as well as customer
inventory digestion. While this is impacting visibility, Network
Infrastructure continues to develop opportunities to gain
market share across the portfolio.
IP Networks net sales declined 24% on a constant currency
basis, primarily reflecting weakness in North America CSPs as
customers continue to evaluate their spending. There were
small declines in other regions with the exception of Middle
East and Africa, as well as India.
Optical Networks net sales grew 4% on a constant currency
basis showing continued strong momentum and customer
engagement with our PSE-V solutions. Growth was driven
primarily by India, as well as Middle East and Africa somewhat
offset by declines in North America and Latin America.
Fixed Networks net sales declined 19% on a constant currency
basis, in comparison to a strong year-ago quarter. The decline
was broad-based across most regions, with particular weakness
in North America, which witnessed slower fiber investments as
customers continue to evaluate their spending and digest
inventories. Elsewhere, declines in Europe, Latin America and
Greater China were somewhat offset by growth in Asia Pacific.
Submarine Networks net sales declined 5% on a constant
currency basis, mainly related to project timing as the business
executes against its strong order backlog.
Gross margin increased slightly year-on-year benefiting from
lower indirect cost of sales such as logistics costs, compared to
the year ago period.
Operating margin and operating profit both declined year-on-year, as lower gross profit was somewhat offset by positive
impacts from the sale of digital assets and hedging.
Mobile Networks
EUR million Q3'23 Q3'22 YoY change
Constant
currency YoY
change Q1-Q3'23 Q1-Q3'22 YoY change
Constant
currency YoY
change
Net sales 2 157 2 851 (24)% (19)% 7 347 7 711 (5)% (2)%
Gross profit 751 1 122 (33)% 2 495 3 068 (19)%
Gross margin % 34.8% 39.4% (460)bps 34.0% 39.8% (580)bps
Operating profit 99 278 (64)% 441 739 (40)%
Operating margin % 4.6% 9.8% (520)bps 6.0% 9.6% (360)bps
Mobile Networks net sales declined 24% on a reported and
19% on a constant currency basis.
The decline in Q3 was largely driven by North America, where
customers continued to prioritize cash flow and deplete their
inventories, while the year ago period had benefited from some
catch-up net sales after supply chain disruption earlier in the
year. The business continued to benefit from 5G deployments
in India, where net sales more than doubled year-over-year,
but with sales volume having moderated significantly on a
sequential basis as the pace of deployment has started to
normalize. Elsewhere, Mobile Networks saw declines across
most regions, while growing modestly in Middle East and Africa.
The decline in gross margin in the third quarter was primarily
related to regional mix. On a sequential basis gross margin
improved from the 33.4% in the second quarter, and we would
expect to see some further improvement in the fourth quarter.
Operating margin declined year-on-year in Q3 2023 mainly
reflecting the regional mix that impacted gross margin.
Continued cost control, lower variable pay accruals year-on-year and the impact of foreign exchange fluctuations helped to
mitigate the lower gross margin and the impact of inflation.
Operating profit also benefited from the positive impacts from
hedging and the sale of digital assets, both of which drove the
year-on-year change in other operating income and expenses,
in addition to the absence of loss allowances of certain trade
receivables recorded in the year-ago quarter.
19 October 2023 5 |
| Cloud and Network Services
EUR million Q3'23 Q3'22 YoY change
Constant
currency YoY
change Q1-Q3'23 Q1-Q3'22 YoY change
Constant
currency YoY
change
Net sales 742 801 (7)% (2)% 2 243 2 291 (2)% 1%
Gross profit 290 312 (7)% 811 876 (7)%
Gross margin % 39.1% 39.0% 10bps 36.2% 38.2% (200)bps
Operating profit 36 16 125% 32 30 7%
Operating margin % 4.9% 2.0% 290bps 1.4% 1.3% 10bps
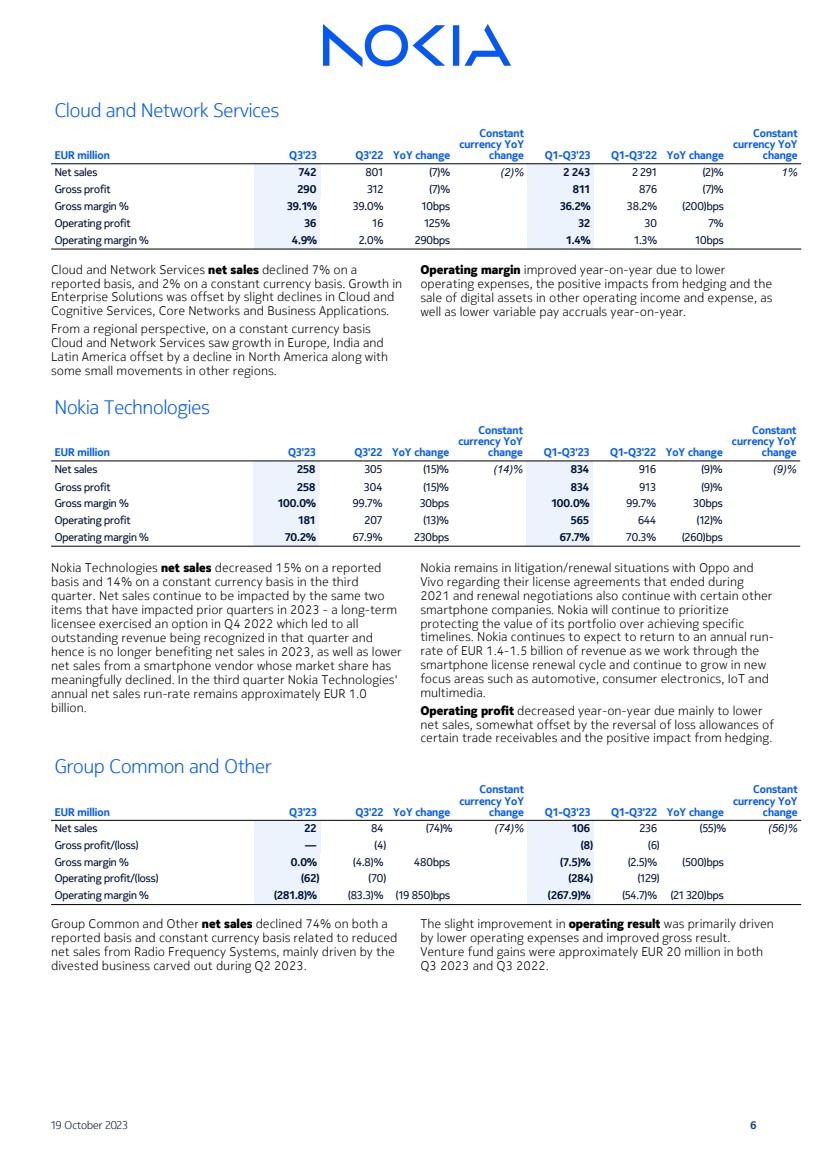
Cloud and Network Services net sales declined 7% on a
reported basis, and 2% on a constant currency basis. Growth in
Enterprise Solutions was offset by slight declines in Cloud and
Cognitive Services, Core Networks and Business Applications.
From a regional perspective, on a constant currency basis
Cloud and Network Services saw growth in Europe, India and
Latin America offset by a decline in North America along with
some small movements in other regions.
Operating margin improved year-on-year due to lower
operating expenses, the positive impacts from hedging and the
sale of digital assets in other operating income and expense, as
well as lower variable pay accruals year-on-year.
Nokia Technologies
EUR million Q3'23 Q3'22 YoY change
Constant
currency YoY
change Q1-Q3'23 Q1-Q3'22 YoY change
Constant
currency YoY
change
Net sales 258 305 (15)% (14)% 834 916 (9)% (9)%
Gross profit 258 304 (15)% 834 913 (9)%
Gross margin % 100.0% 99.7% 30bps 100.0% 99.7% 30bps
Operating profit 181 207 (13)% 565 644 (12)%
Operating margin % 70.2% 67.9% 230bps 67.7% 70.3% (260)bps
Nokia Technologies net sales decreased 15% on a reported
basis and 14% on a constant currency basis in the third
quarter. Net sales continue to be impacted by the same two
items that have impacted prior quarters in 2023 - a long-term
licensee exercised an option in Q4 2022 which led to all
outstanding revenue being recognized in that quarter and
hence is no longer benefiting net sales in 2023, as well as lower
net sales from a smartphone vendor whose market share has
meaningfully declined. In the third quarter Nokia Technologies'
annual net sales run-rate remains approximately EUR 1.0
billion.
Nokia remains in litigation/renewal situations with Oppo and
Vivo regarding their license agreements that ended during
2021 and renewal negotiations also continue with certain other
smartphone companies. Nokia will continue to prioritize
protecting the value of its portfolio over achieving specific
timelines. Nokia continues to expect to return to an annual run-rate of EUR 1.4-1.5 billion of revenue as we work through the
smartphone license renewal cycle and continue to grow in new
focus areas such as automotive, consumer electronics, IoT and
multimedia.
Operating profit decreased year-on-year due mainly to lower
net sales, somewhat offset by the reversal of loss allowances of
certain trade receivables and the positive impact from hedging.
Group Common and Other
EUR million Q3'23 Q3'22 YoY change
Constant
currency YoY
change Q1-Q3'23 Q1-Q3'22 YoY change
Constant
currency YoY
change
Net sales 22 84 (74) % (74)% 106 236 (55) % (56)%
Gross profit/(loss) — (4) (8) (6)
Gross margin % 0.0% (4.8)% 480bps (7.5)% (2.5)% (500)bps
Operating profit/(loss) (62) (70) (284) (129)
Operating margin % (281.8)% (83.3)% (19 850)bps (267.9)% (54.7)% (21 320)bps
Group Common and Other net sales declined 74% on both a
reported basis and constant currency basis related to reduced
net sales from Radio Frequency Systems, mainly driven by the
divested business carved out during Q2 2023.
The slight improvement in operating result was primarily driven
by lower operating expenses and improved gross result.
Venture fund gains were approximately EUR 20 million in both
Q3 2023 and Q3 2022.
19 October 2023 6 |
| Net sales by region
EUR million Q3'23 Q3'22 YoY change
Constant
currency YoY
change Q1-Q3'23 Q1-Q3'22 YoY change
Constant
currency YoY
change
Asia Pacific 503 638 (21)% (13)% 1 608 1 847 (13)% (8)%
Europe 1 345 1 533 (12)% (11)% 4 341 4 311 1% 1%
Greater China 286 415 (31)% (24)% 966 1 225 (21)% (16)%
India 567 281 102% 121% 2 463 722 241% 255%
Latin America 262 334 (21)% (17)% 724 835 (13)% (11)%
Middle East & Africa 489 482 2% 8% 1 404 1 374 2% 6%
North America 1 256 2 275 (45)% (40)% 4 215 6 317 (33)% (32)%
Submarine Networks1
273 283 (4)% (5)% 829 831 0% 0%
Total 4 982 6 241 (20)% (15)% 16 551 17 462 (5)% (3)%
1Nokia provides net sales for the Submarine Networks business separately from the rest of the Group to improve the usefulness of disclosed information by removing volatility caused by the
specific nature of the Submarine Networks business.
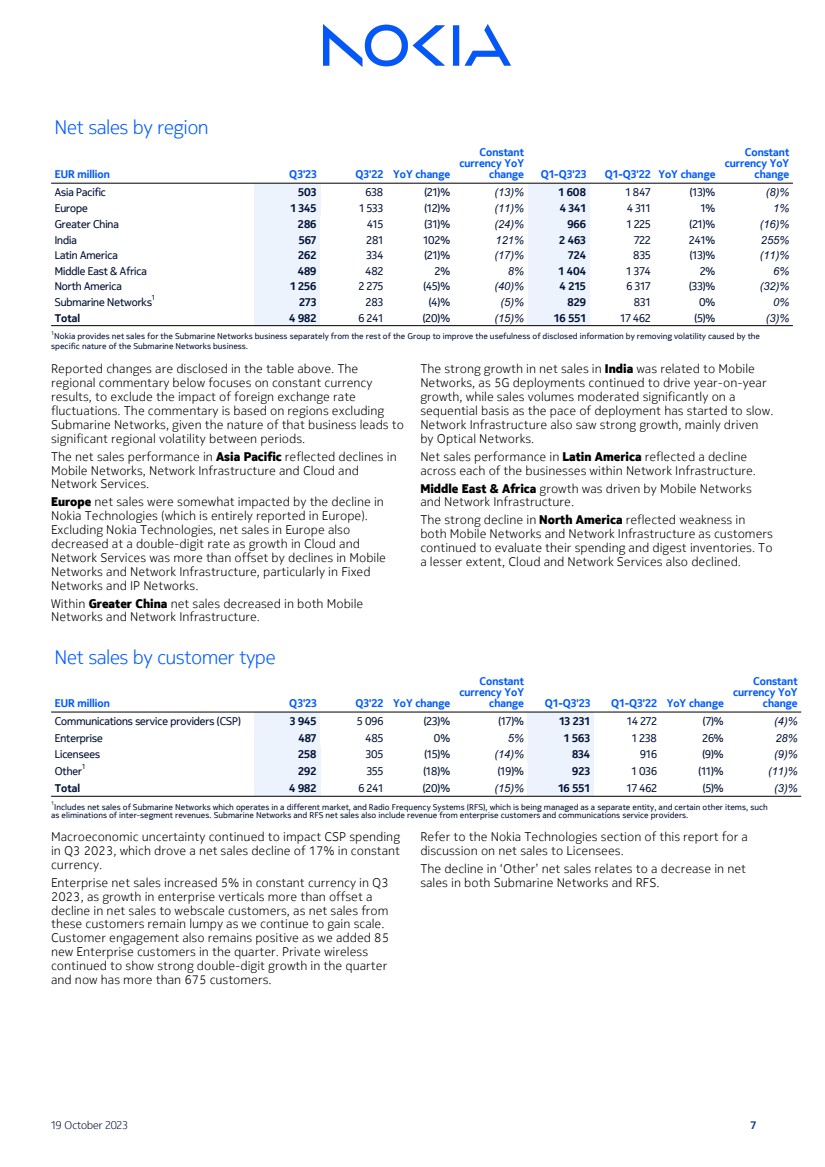
Reported changes are disclosed in the table above. The
regional commentary below focuses on constant currency
results, to exclude the impact of foreign exchange rate
fluctuations. The commentary is based on regions excluding
Submarine Networks, given the nature of that business leads to
significant regional volatility between periods.
The net sales performance in Asia Pacific reflected declines in
Mobile Networks, Network Infrastructure and Cloud and
Network Services.
Europe net sales were somewhat impacted by the decline in
Nokia Technologies (which is entirely reported in Europe).
Excluding Nokia Technologies, net sales in Europe also
decreased at a double-digit rate as growth in Cloud and
Network Services was more than offset by declines in Mobile
Networks and Network Infrastructure, particularly in Fixed
Networks and IP Networks.
Within Greater China net sales decreased in both Mobile
Networks and Network Infrastructure.
The strong growth in net sales in India was related to Mobile
Networks, as 5G deployments continued to drive year-on-year
growth, while sales volumes moderated significantly on a
sequential basis as the pace of deployment has started to slow.
Network Infrastructure also saw strong growth, mainly driven
by Optical Networks.
Net sales performance in Latin America reflected a decline
across each of the businesses within Network Infrastructure.
Middle East & Africa growth was driven by Mobile Networks
and Network Infrastructure.
The strong decline in North America reflected weakness in
both Mobile Networks and Network Infrastructure as customers
continued to evaluate their spending and digest inventories. To
a lesser extent, Cloud and Network Services also declined.
Net sales by customer type
EUR million Q3'23 Q3'22 YoY change
Constant
currency YoY
change Q1-Q3'23 Q1-Q3'22 YoY change
Constant
currency YoY
change
Communications service providers (CSP) 3 945 5 096 (23)% (17)% 13 231 14 272 (7)% (4)%
Enterprise 487 485 0% 5% 1 563 1 238 26% 28%
Licensees 258 305 (15)% (14)% 834 916 (9)% (9)%
Other1
292 355 (18)% (19)% 923 1 036 (11)% (11)%
Total 4 982 6 241 (20)% (15)% 16 551 17 462 (5)% (3)%
1
Includes net sales of Submarine Networks which operates in a different market, and Radio Frequency Systems (RFS), which is being managed as a separate entity, and certain other items, such
as eliminations of inter-segment revenues. Submarine Networks and RFS net sales also include revenue from enterprise customers and communications service providers.
Macroeconomic uncertainty continued to impact CSP spending
in Q3 2023, which drove a net sales decline of 17% in constant
currency.
Enterprise net sales increased 5% in constant currency in Q3
2023, as growth in enterprise verticals more than offset a
decline in net sales to webscale customers, as net sales from
these customers remain lumpy as we continue to gain scale.
Customer engagement also remains positive as we added 85
new Enterprise customers in the quarter. Private wireless
continued to show strong double-digit growth in the quarter
and now has more than 675 customers.
Refer to the Nokia Technologies section of this report for a
discussion on net sales to Licensees.
The decline in ‘Other’ net sales relates to a decrease in net
sales in both Submarine Networks and RFS.
19 October 2023 7 |
| Q3 2023 to Q3 2022 bridge for net sales and operating profit
EUR million Q3'23
Volume,
price, mix
and other
Venture fund
valuation
Foreign
exchange
impact
Items affecting
comparability Q3'22
Net sales 4 982 (965) — (294) — 6 241
Operating profit 241 (289) (1) 55 (42) 518
Operating margin % 4.8% 8.3%
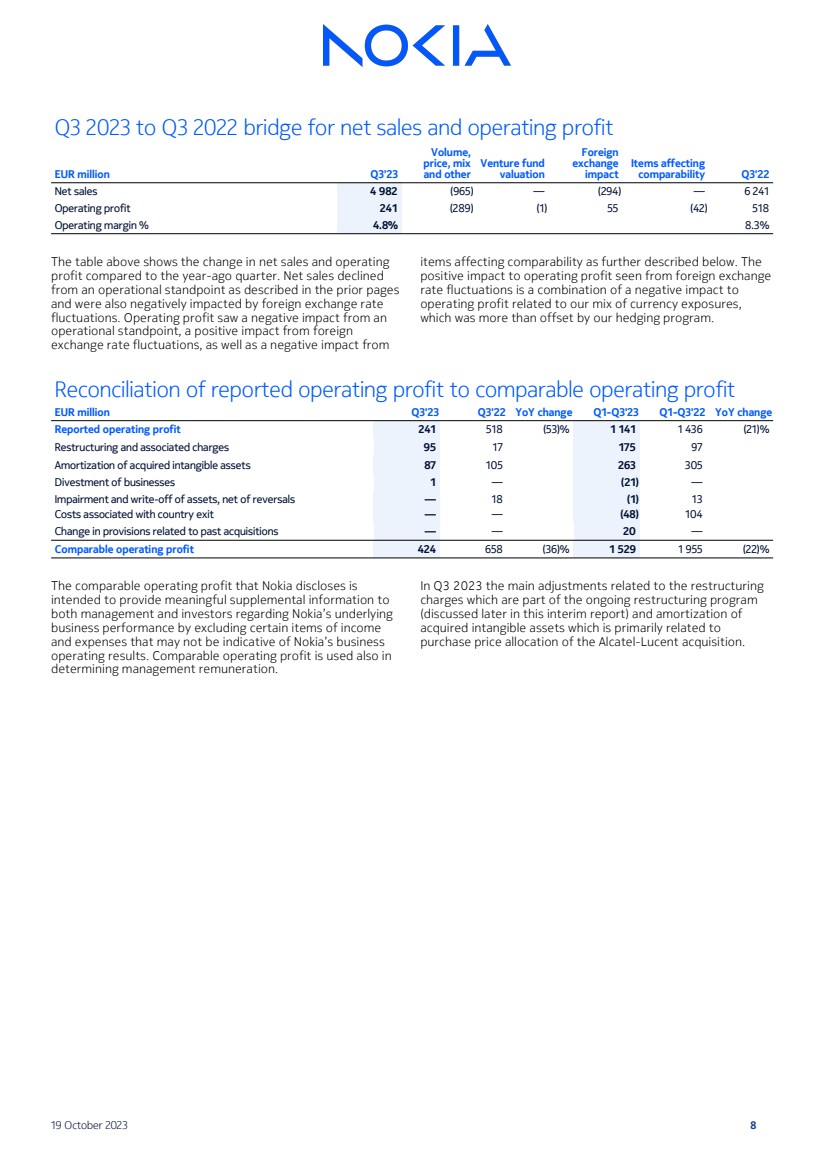
The table above shows the change in net sales and operating
profit compared to the year-ago quarter. Net sales declined
from an operational standpoint as described in the prior pages
and were also negatively impacted by foreign exchange rate
fluctuations. Operating profit saw a negative impact from an
operational standpoint, a positive impact from foreign
exchange rate fluctuations, as well as a negative impact from
items affecting comparability as further described below. The
positive impact to operating profit seen from foreign exchange
rate fluctuations is a combination of a negative impact to
operating profit related to our mix of currency exposures,
which was more than offset by our hedging program.
Reconciliation of reported operating profit to comparable operating profit
EUR million Q3'23 Q3'22 YoY change Q1-Q3'23 Q1-Q3'22 YoY change
Reported operating profit 241 518 (53)% 1 141 1 436 (21)%
Restructuring and associated charges 95 17 175 97
Amortization of acquired intangible assets 87 105 263 305
Divestment of businesses 1 — (21) —
Impairment and write-off of assets, net of reversals — 18 (1) 13
Costs associated with country exit — — (48) 104
Change in provisions related to past acquisitions — — 20 —
Comparable operating profit 424 658 (36)% 1 529 1 955 (22)%
The comparable operating profit that Nokia discloses is
intended to provide meaningful supplemental information to
both management and investors regarding Nokia’s underlying
business performance by excluding certain items of income
and expenses that may not be indicative of Nokia’s business
operating results. Comparable operating profit is used also in
determining management remuneration.
In Q3 2023 the main adjustments related to the restructuring
charges which are part of the ongoing restructuring program
(discussed later in this interim report) and amortization of
acquired intangible assets which is primarily related to
purchase price allocation of the Alcatel-Lucent acquisition.
19 October 2023 8 |
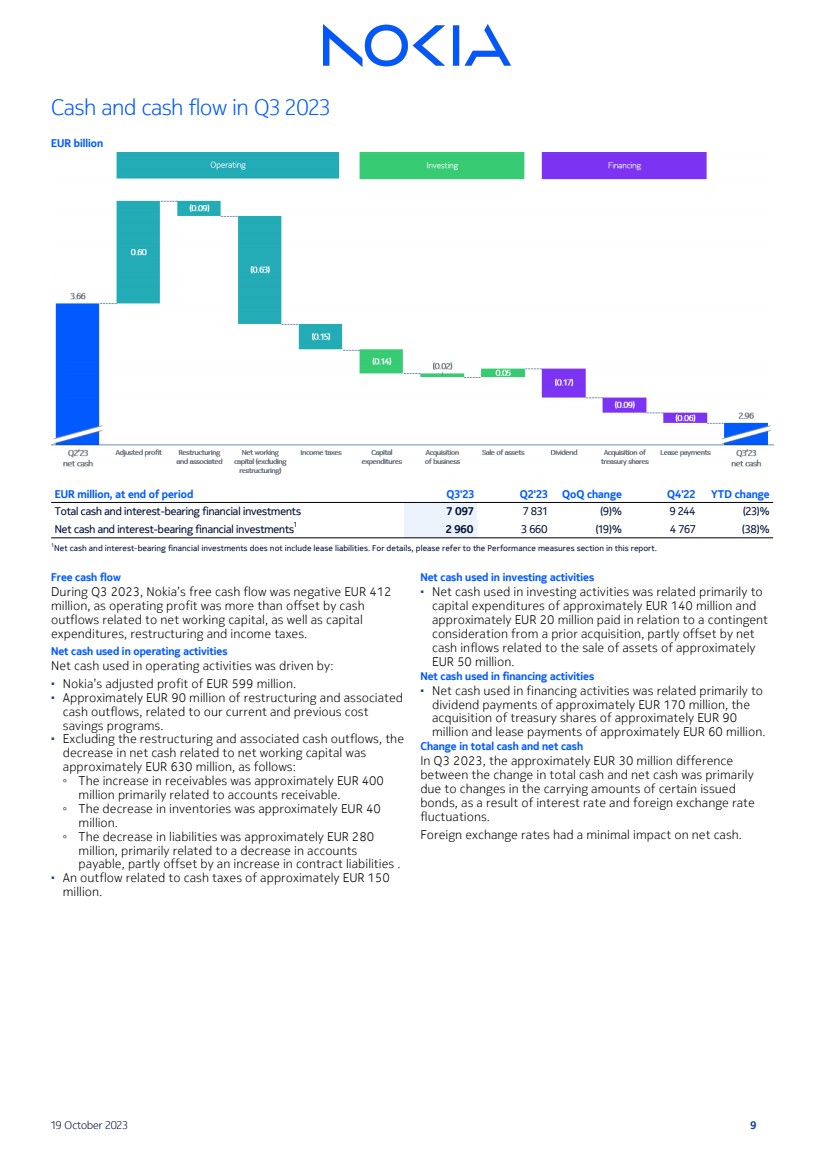
| Cash and cash flow in Q3 2023
EUR billion
EUR million, at end of period Q3'23 Q2'23 QoQ change Q4'22 YTD change
Total cash and interest-bearing financial investments 7 097 7 831 (9)% 9 244 (23)%
Net cash and interest-bearing financial investments1
2 960 3 660 (19)% 4 767 (38)%
1Net cash and interest-bearing financial investments does not include lease liabilities. For details, please refer to the Performance measures section in this report.
Free cash flow
During Q3 2023, Nokia’s free cash flow was negative EUR 412
million, as operating profit was more than offset by cash
outflows related to net working capital, as well as capital
expenditures, restructuring and income taxes.
Net cash used in operating activities
Net cash used in operating activities was driven by:
▪ Nokia’s adjusted profit of EUR 599 million.
▪ Approximately EUR 90 million of restructuring and associated
cash outflows, related to our current and previous cost
savings programs.
▪ Excluding the restructuring and associated cash outflows, the
decrease in net cash related to net working capital was
approximately EUR 630 million, as follows:
◦ The increase in receivables was approximately EUR 400
million primarily related to accounts receivable.
◦ The decrease in inventories was approximately EUR 40
million.
◦ The decrease in liabilities was approximately EUR 280
million, primarily related to a decrease in accounts
payable, partly offset by an increase in contract liabilities .
▪ An outflow related to cash taxes of approximately EUR 150
million.
Net cash used in investing activities
▪ Net cash used in investing activities was related primarily to
capital expenditures of approximately EUR 140 million and
approximately EUR 20 million paid in relation to a contingent
consideration from a prior acquisition, partly offset by net
cash inflows related to the sale of assets of approximately
EUR 50 million.
Net cash used in financing activities
▪ Net cash used in financing activities was related primarily to
dividend payments of approximately EUR 170 million, the
acquisition of treasury shares of approximately EUR 90
million and lease payments of approximately EUR 60 million.
Change in total cash and net cash
In Q3 2023, the approximately EUR 30 million difference
between the change in total cash and net cash was primarily
due to changes in the carrying amounts of certain issued
bonds, as a result of interest rate and foreign exchange rate
fluctuations.
Foreign exchange rates had a minimal impact on net cash.
19 October 2023 9 |
| January-September 2023 compared
to January–September 2022
Net sales
In the first nine months of 2023, reported net sales decreased
5%, negatively impacted by foreign exchange rate fluctuations
along with the following drivers.
On a constant currency basis, Nokia net sales decreased 3% as
growth in Cloud and Network Services was more than offset by
declines across the other business groups.
Gross margin
Both reported and comparable gross margin declined year-on-year in the first nine months of 2023. Reported gross margin
decreased 220 basis points to 38.1% and comparable gross
margin decreased 210 basis points to 38.5%. The year-to-date
gross margin decline was primarily driven by unfavorable
regional mix in Mobile Networks.
Operating profit and margin
Reported operating profit in the first nine months of 2023 was
EUR 1 141 million, or 6.9% of net sales, down from EUR 1 436
million or 8.2% in the year-ago period. Comparable operating
profit decreased to EUR 1 529 million from EUR 1 955 million
year-on-year, while comparable operating margin declined 200
basis points year-on-year to 9.2%. Comparable operating
profit decreased in the first nine months of 2023 mainly due to
lower gross profit and the impact of inflation, somewhat offset
by lower variable pay accruals year-on-year and higher other
operating income. The higher other operating income reflected
the positive impact from hedging and the sale of digital assets,
which were partly offset by the impact from Nokia's venture
fund investments. The impact of hedging in the first nine
months of 2023 was positive EUR 62 million, compared to a
negative impact of EUR 74 million in the first nine months of
2022. Nokia's venture fund investments generated a loss of
approximately EUR 30 million in the first nine months of 2023
compared to a benefit of EUR 100 million in the first nine
months of 2022.
In the first nine months of 2023, the difference between
reported and comparable operating profit was primarily related
to the amortization of acquired intangible assets, restructuring
and associated charges and the partial reversal of provision
associated with a country exit. In the first nine months of 2022,
the difference between reported and comparable operating
profit was primarily related to the amortization of acquired
intangible assets, a provision associated with a country exit and
restructuring and associated charges.
Profit for the period
Reported net profit in the first nine months of 2023 was EUR
711 million, compared to EUR 1 107 million in the year-ago
period. Comparable net profit was EUR 1 055 million, compared
to EUR 1 552 million in the year-ago period. The decrease in
comparable net profit primarily reflects a decrease in
comparable operating profit, a net negative fluctuation in
financial income and expenses and higher income taxes.
Apart from the items impacting comparability included in
operating profit (and their associated tax effects), the
difference between reported and comparable net profit in the
first nine months of 2023 was related to the impairment and
write-off of assets, the divestment of businesses and the
change in financial liability to acquire Nokia Shanghai Bell non-controlling interest. In the year-ago period, the difference
between reported and comparable net profit was related to
loss allowances on customer financing, the release of
cumulative exchange differences related to abandonment of
foreign operations and the change in financial liability to
acquire Nokia Shanghai Bell non-controlling interest.
Earnings per share
Reported diluted EPS in the first nine months of 2023 was EUR
0.13, compared to EUR 0.19 in the year-ago period.
Comparable diluted EPS in the first nine months of 2023 was
EUR 0.19 compared to EUR 0.27 in the year-ago period.
Cash performance
During the first nine months of 2023, net cash decreased
EUR 1 807 million, resulting in an end-of-period net cash
balance of EUR 3.0 billion. Total cash decreased EUR 2 147
million, resulting in total cash balance of EUR 7.1 billion. Free
cash flow was negative EUR 939 million in the first nine months
of 2023.
19 October 2023 10 |
| Sustainability
Our strategy and focus areas
Our networking technology is needed by customers and partners to maximize the opportunities of digitalization. Our ESG strategy
includes five focus areas in which Nokia can make a particularly profound difference: the environment, industrial digitalization,
security and privacy, bridging the digital divide, and responsible business. The strategy will help us achieve our stated ambition to
make ESG a competitive advantage for Nokia. Here are some achievements across our focus areas from the past quarter.
Environment
In July we announced that Nokia helped the Vietnamese telco
MobiFone lower its network energy consumption in the first
trial of Nokia’s new Digital Design service. Based on data
gathered from the network, MobiFone implemented a power
reduction of 88% of the 4G radio cells in the trial. To achieve
the result, Nokia helped MobiFone transition from traditional
network-wide or cluster-wide power settings to cell-level
settings, which helped find an optimal radio link and power
balance with overall lower transmit power.
In collaboration with our partner DHL Global Forwarding, we
redesigned one of our key intercontinental logistics routes.
Using the partner’s Multimodal Express solution we now ship
goods via sea and road as well as air freight, rather than air
freight alone. Using a combination of transport modes, we were
able to reduce the use of air freight with a resulting reduction
in emissions.
Industrial Digitalization
In August we announced that GÉANT, an organization
representing collaboration of European National Research and
Education Networks (NRENs), will deploy the latest Nokia IP/
MPLS solution. This 10-year frame agreement is led by Nomios
Group, a leading European provider of cybersecurity services
and solutions. GÉANT interconnects 40 NRENs in 40 European
countries, and links 50 million users and institutions to more
than 100 additional NRENs in every region of the world. Our
solution will triple existing network capacity for
interconnections.
Bridging the digital divide
Nokia has become the first telecom company to announce the
manufacturing of fiber-optic broadband network electronics
products and optical modules in the U.S. for use in the
Broadband Equity, Access and Deployment (BEAD) program. By
manufacturing fiber-optic technology in the U.S., Nokia will be
able to supply its products and services to critical
infrastructure projects like BEAD which are focused on
narrowing the digital divide, stimulating economic growth and
job creation. We were delighted to welcome Vice President
Kamala Harris and U.S Secretary of Commerce Gina Raimondo
to an event in Wisconsin to make this announcement.
Nokia announced in July that it had signed a five-year 5G deal
with AST SpaceMobile, Inc. Under the deal, Nokia and AST
SpaceMobile will work to achieve their joint ambition to expand
universal coverage and connect underserved communities
around the world.
Nokia’s AirScale Single RAN equipment will allow AST
SpaceMobile to provide mobile services to new and existing
subscribers in regions currently not served by terrestrial
communication networks. Following the deal AST SpaceMobile
announced on 19 September the first-ever 5G connection for
voice and data between an unmodified smartphone and a
satellite in space. Nokia RAN Technology is at the heart of this
project and these achievements highlight progress towards the
joint goal of eliminating coverage gaps and enabling billions of
people globally to stay connected through their smartphones.
In September we announced deployment of Nokia’s energy-efficient passive optical LAN solution at 100 schools in a
cutting-edge network for schools in South Korea. The
deployment, completed in collaboration with Dongkuk Systems
and Erum I&C, aims to enhance the existing infrastructure and
provide a high-capacity network to support digital learning. This
initiative is part of the South Korean Ministry of Education’s
Green Smart School program to transform existing school
facilities into smart learning environments, including the
creation of large-capacity multimedia classes.
Nokia’s solutions will be included in rural broadband PON
networks built by Mediacom Communications, the 5th largest
cable operator in the United States. Mediacom offers
broadband to 3.3 million homes and businesses in 22 states
and will deploy Nokia’s chassis-based and node-based Optical
Line Terminals to provide multi-gigabit broadband service to
rural, underserved communities.
Responsible business
At Nokia we believe in responsible business practices and act
accordingly. We collaborate with partners, customers, and
industry players to protect positive values while accelerating
innovation and progress. To this ambition, Nokia attended the
Governing AI for Humanity event at the UN General Assembly in
New York to discuss potential risks of AI and the challenges of
international cooperation.
19 October 2023 11 |
| Additional information
Cost Savings Program
In Q1 2021, we announced plans to reset our cost base,
targeting a reduction of approximately EUR 600 million by the
end of 2023.
Considering the recent macroeconomic uncertainty and its
impact on our end markets, the pace of restructuring has
increased in 2023. However, the overall size of the plan
remains unchanged and continues to depend on the evolution
of our end markets, consistent with our commentary when we
announced the plan.
We continue to expect these cost savings to result in
approximately EUR 500-600 million of restructuring and
associated charges by the end of 2023.
We continue to expect total restructuring and associated cash
outflows to be approximately EUR 1 050-1 150 million. This
total includes approximately EUR 500 million of cash outflows
related to our previous restructuring program.
In EUR million, rounded to the nearest EUR 50 million
Actual Expected amounts for
Total
2021 2022 2023 amount
Beyond
2023
Recurring gross cost savings 150 250 100 100 600
- cost of sales 50 100 50 50 250
- operating expenses 100 150 50 50 350
Restructuring and associated charges related to our most recent cost savings program 250 150 150 500-600
Restructuring and associated cash outflows1
350 300 300 150 1 050-1 150
1
Includes cash outflows related to the most recent cost savings program, as well as the remaining cash outflows related to our previous programs.
Restructuring and associated charges by business group
In EUR million, rounded to the nearest EUR 50 million
Mobile Networks 300-350
Network Infrastructure ~100
Cloud and Network Services 100-150
Total restructuring and associated charges 500-600
On 19 October 2023, Nokia announced actions being taken
across business groups to address the increasingly challenging
market environment that the company faces. The company will
reduce its cost base and increase operational efficiency while
protecting its R&D capacity and commitment to technology
leadership.
Nokia targets to lower its cost base on a gross basis (i.e. before
inflation) by between EUR 800 million and EUR 1 200 million by
the end of 2026 compared to 2023, assuming on-target
variable pay in both periods. This represents a 10-15%
reduction in personnel expenses. Nokia expects to act quickly
on the program with at least EUR 400 million of in-year savings
in 2024 and a further EUR 300 million in 2025. The program is
expected to lead to a 72 000 – 77 000 employee organization
compared to the 86 000 employees Nokia has today.
The exact scale of the program will depend on the evolution of
end market demand. The program is expected to deliver
savings on a net basis but the magnitude will depend on
inflation. The cost savings are expected to primarily be
achieved in Mobile Networks, Cloud and Network Services and
Nokia’s corporate functions. One-time restructuring charges
and cash outflows of the program are expected to be similar to
the annual cost savings achieved.
Nokia plans to provide further details in the future.
19 October 2023 12 |
| Significant events
January – September 2023
On 25 January 2023, Nokia announced it had appointed Esa
Niinimäki as Chief Legal Officer and member of the Group
Leadership Team. Niinimäki has worked at Nokia for more than
15 years where he has held multiple positions, most recently
Interim Chief Legal Officer.
On 9 February 2023, Nokia announced it commenced an offer
to purchase the outstanding EUR 750 million 2.00% notes due
15 March 2024 (the “2024 Notes”), EUR 500 million 2.375%
notes due 15 May 2025 (the “2025 Notes”) and EUR 750
million 2.00% notes due 11 March 2026 (the “2026 Notes”), up
to a maximum cash consideration of EUR 700 million (the
“Tender Offer”). The purpose of the Tender Offer is to manage
the overall indebtedness of Nokia and to extend Nokia’s debt
maturity profile in an efficient manner.
Nokia accepted tenders for EUR 372 million (49.66% of the
nominal amount) of the 2024 Notes, EUR 208 million (41.57%
of the nominal amount) of the 2025 Notes and EUR 120 million
(15.96% of the nominal amount) of the 2026 Notes. The
Tender Offer was settled on 21 February 2023.
On 21 February 2023, Nokia issued EUR 500 million 4.375%
sustainability-linked Notes due August 2031 under its 5 billion
Euro Medium-Term Note Programme. The proceeds of the new
notes are intended to fund the Tender Offer and for general
corporate purposes.
On 2 March 2023, Nokia informed it had updated its capital
management policy with a focus on sustaining investment
grade rating and improving shareholder returns consistent with
the performance of the business. Nokia now targets to
maintain a net cash position in the range of 10-15% of net
sales. Nokia intends to maintain a net cash position around this
level to ensure it can continue to invest in the necessary R&D
to maintain and further improve its technology leadership, fund
working capital requirements in support of the company’s
growth ambitions and to maintain some flexibility for bolt-on
acquisitions. Nokia’s previous target in terms of cash
management was to maintain a total cash position equivalent
to at least 30% of net sales.
On 4 April 2023, Nokia held its Annual General Meeting (AGM) in
Helsinki. Shareholders were also able to follow the AGM through
a webcast. Approximately 108 000 shareholders representing
approximately 3.2 billion shares and votes were represented at
the meeting. Among others, the following resolutions were
made:
▪ The financial statements were adopted, and the Board of
Directors and President and CEO were discharged from
liability for the financial year 2022.
▪ The AGM decided that no dividend is distributed by a
resolution of the AGM and authorized the Board to decide on
the distribution of an aggregate maximum of EUR 0.12 per
share as dividend from the retained earnings and/or as
assets from the reserve for invested unrestricted equity. The
Board will resolve separately on the amount and timing of
each distribution. The authorization is valid until the opening
of the next AGM.
▪ Sari Baldauf, Thomas Dannenfeldt, Lisa Hook, Jeanette
Horan, Thomas Saueressig, Søren Skou, Carla Smits-Nusteling and Kai Öistämö were re-elected as members of
the Board for a term ending at the close of the next AGM. In
addition, the AGM resolved to elect Timo Ahopelto and
Elizabeth Crain as new members of the Board for the same
term. In its assembly meeting that took place after the AGM,
the Board re-elected Sari Baldauf as Chair of the Board and
Søren Skou as Vice Chair of the Board.
▪ The annual fees of the Board members were increased by
EUR 15 000 except for the Board Chair.
▪ The remuneration Report of the company's governing bodies
was supported in an advisory vote.
▪ Deloitte Oy was re-elected as the auditor for Nokia for the
financial year 2024 with Authorized Public Accountant Marika
Nevalainen as the auditor in charge.
▪ The Board was authorized to resolve to repurchase a
maximum of 550 million Nokia shares and to issue a
maximum of 550 million shares through issuance of shares
or special rights entitling to shares in one or more issues. The
authorizations are effective until 3 October 2024 and they
terminated the corresponding authorizations granted by the
AGM on 5 April 2022.
On 30 June 2023, Nokia announced it had signed a new long-term patent cross-license agreement with Apple which will
replace the current license that is due to expire at the end of
2023. License covers Nokia’s fundamental inventions in 5G and
other technologies. The terms of the agreement remain
confidential between the parties.
Shares
The total number of Nokia shares on 30 September 2023,
equaled 5 632 297 576. On 30 September 2023, Nokia and its
subsidiary companies held 102 346 228 Nokia shares,
representing approximately 1.8% of the total number of Nokia
shares and voting rights.
19 October 2023 13 |
| Risk Factors
Nokia and its businesses are exposed to a number of risks and
uncertainties which include but are not limited to:
▪ Competitive intensity, which is expected to continue at a high
level as some competitors seek to take share;
▪ Our ability to ensure competitiveness of our product
roadmaps and costs through additional R&D investments;
▪ Our ability to procure certain standard components and the
costs thereof, such as semiconductors;
▪ Disturbance in the global supply chain;
▪ Accelerating inflation, increased global macro-uncertainty,
major currency fluctuations and higher interest rates;
▪ Potential economic impact and disruption of global
pandemics;
▪ War or other geopolitical conflicts, disruptions and potential
costs thereof;
▪ Other macroeconomic, industry and competitive
developments;
▪ Timing and value of new, renewed and existing patent
licensing agreements with smartphone vendors, automotive
companies, consumer electronics companies and other
licensees;
▪ Results in brand and technology licensing; costs to protect
and enforce our intellectual property rights; on-going
litigation with respect to licensing and regulatory landscape
for patent licensing;
▪ The outcomes of on-going and potential disputes and
litigation;
▪ Timing of completions and acceptances of certain projects;
▪ Our product and regional mix;
▪ Uncertainty in forecasting income tax expenses and cash
outflows, over the long-term, as they are also subject to
possible changes due to business mix, the timing of patent
licensing cash flow and changes in tax legislation, including
potential tax reforms in various countries and OECD
initiatives;
▪ Our ability to utilize our US and Finnish deferred tax assets
and their recognition on our balance sheet;
▪ Our ability to meet our sustainability and other ESG targets,
including our targets relating to greenhouse gas emissions;
as well the risk factors specified under Forward-looking
statements of this report, and our 2022 annual report on Form
20-F published on 2 March 2023 under Operating and financial
review and prospects-Risk factors.
Forward-looking statements
Certain statements herein that are not historical facts are
forward-looking statements. These forward-looking
statements reflect Nokia's current expectations and views of
future developments and include statements regarding: A)
expectations, plans, benefits or outlook related to our
strategies, product launches, growth management, licenses,
sustainability and other ESG targets, operational key
performance indicators and decisions on market exits; B)
expectations, plans or benefits related to future performance
of our businesses (including the expected impact, timing and
duration of potential global pandemics and the general or
regional macroeconomic conditions on our businesses, our
supply chain and our customers’ businesses) and any future
dividends and other distributions of profit; C) expectations and
targets regarding financial performance and results of
operations, including market share, prices, net sales, income,
margins, cash flows, the timing of receivables, operating
expenses, provisions, impairments, taxes, currency exchange
rates, hedging, investment funds, inflation, product cost
reductions, competitiveness, revenue generation in any specific
region, and licensing income and payments;
D) ability to execute, expectations, plans or benefits related to
changes in organizational structure and operating model; E)
impact on revenue with respect to litigation/renewal
discussions; and F) any statements preceded by or including
"continue", “believe”, “commit”, “estimate”, “expect”, “aim”,
“influence”, "will”, “target”, “likely”, “intend”, “may”, “could”,
“would” or similar expressions. These forward-looking
statements are subject to a number of risks and uncertainties,
many of which are beyond our control, which could cause our
actual results to differ materially from such statements. These
statements are based on management’s best assumptions and
beliefs in light of the information currently available to them.
These forward-looking statements are only predictions based
upon our current expectations and views of future events and
developments and are subject to risks and uncertainties that
are difficult to predict because they relate to events and
depend on circumstances that will occur in the future. Factors,
including risks and uncertainties that could cause these
differences, include those risks and uncertainties identified in
the Risk Factors above.
19 October 2023 14 |
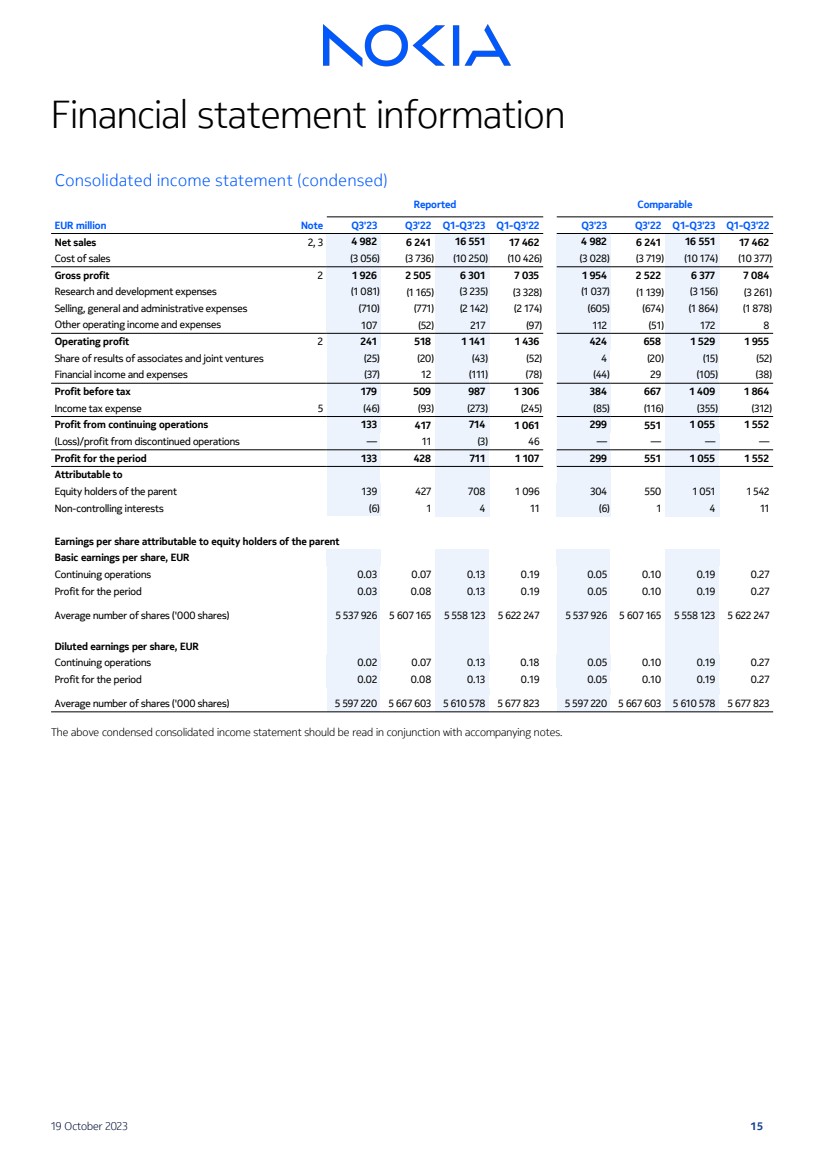
| Financial statement information
Consolidated income statement (condensed)
EUR million
Reported Comparable
Note Q3'23 Q3'22 Q1-Q3'23 Q1-Q3'22 Q3'23 Q3'22 Q1-Q3'23 Q1-Q3'22
Net sales 2, 3 4 982 6 241 16 551 17 462 4 982 6 241 16 551 17 462
Cost of sales (3 056) (3 736) (10 250) (10 426) (3 028) (3 719) (10 174) (10 377)
Gross profit 2 1 926 2 505 6 301 7 035 1 954 2 522 6 377 7 084
Research and development expenses (1 081) (1 165) (3 235) (3 328) (1 037) (1 139) (3 156) (3 261)
Selling, general and administrative expenses (710) (771) (2 142) (2 174) (605) (674) (1 864) (1 878)
Other operating income and expenses 107 (52) 217 (97) 112 (51) 172 8
Operating profit 2 241 518 1 141 1 436 424 658 1 529 1 955
Share of results of associates and joint ventures (25) (20) (43) (52) 4 (20) (15) (52)
Financial income and expenses (37) 12 (111) (78) (44) 29 (105) (38)
Profit before tax 179 509 987 1 306 384 667 1 409 1 864
Income tax expense 5 (46) (93) (273) (245) (85) (116) (355) (312)
Profit from continuing operations 133 417 714 1 061 299 551 1 055 1 552
(Loss)/profit from discontinued operations — 11 (3) 46 — — — —
Profit for the period 133 428 711 1 107 299 551 1 055 1 552
Attributable to
Equity holders of the parent 139 427 708 1 096 304 550 1 051 1 542
Non-controlling interests (6) 1 4 11 (6) 1 4 11
Earnings per share attributable to equity holders of the parent
Basic earnings per share, EUR
Continuing operations 0.03 0.07 0.13 0.19 0.05 0.10 0.19 0.27
Profit for the period 0.03 0.08 0.13 0.19 0.05 0.10 0.19 0.27
Average number of shares ('000 shares) 5 537 926 5 607 165 5 558 123 5 622 247 5 537 926 5 607 165 5 558 123 5 622 247
Diluted earnings per share, EUR
Continuing operations 0.02 0.07 0.13 0.18 0.05 0.10 0.19 0.27
Profit for the period 0.02 0.08 0.13 0.19 0.05 0.10 0.19 0.27
Average number of shares ('000 shares) 5 597 220 5 667 603 5 610 578 5 677 823 5 597 220 5 667 603 5 610 578 5 677 823
The above condensed consolidated income statement should be read in conjunction with accompanying notes.
19 October 2023 15 |
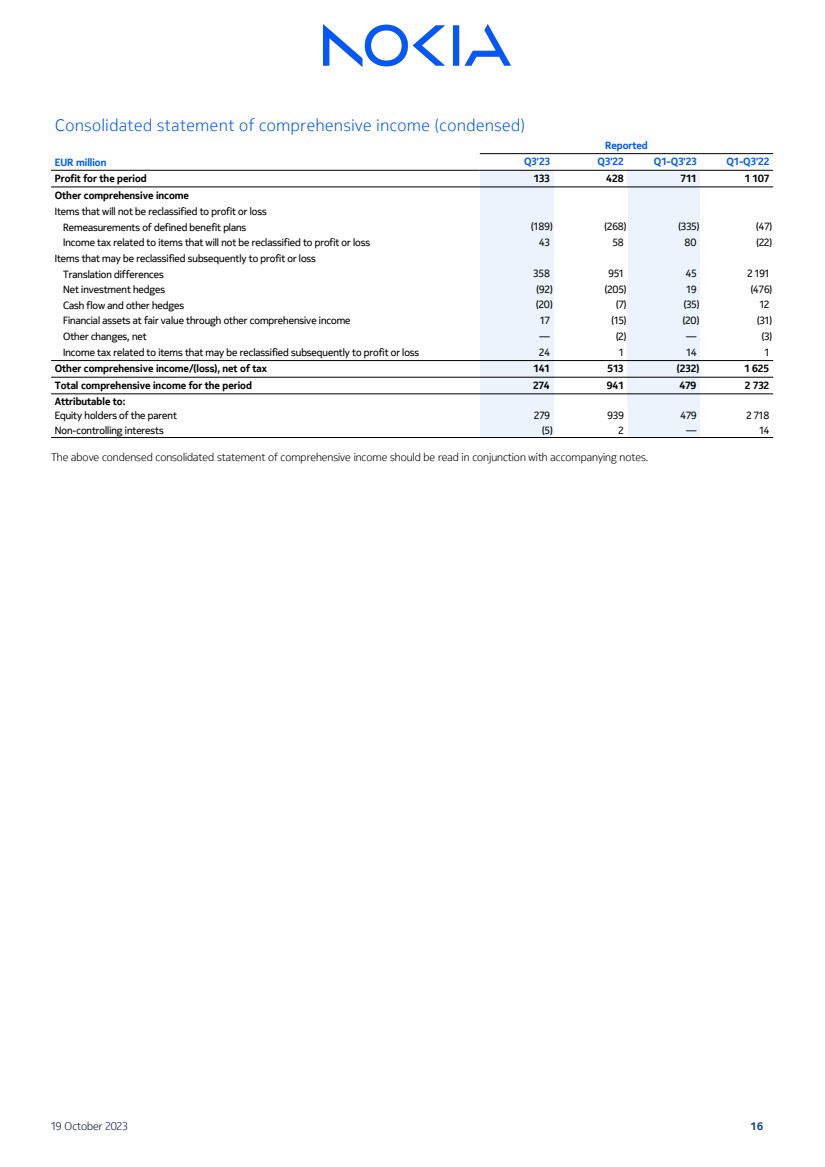
| Consolidated statement of comprehensive income (condensed)
EUR million
Reported
Q3'23 Q3'22 Q1-Q3'23 Q1-Q3'22
Profit for the period 133 428 711 1 107
Other comprehensive income
Items that will not be reclassified to profit or loss
Remeasurements of defined benefit plans (189) (268) (335) (47)
Income tax related to items that will not be reclassified to profit or loss 43 58 80 (22)
Items that may be reclassified subsequently to profit or loss
Translation differences 358 951 45 2 191
Net investment hedges (92) (205) 19 (476)
Cash flow and other hedges (20) (7) (35) 12
Financial assets at fair value through other comprehensive income 17 (15) (20) (31)
Other changes, net — (2) — (3)
Income tax related to items that may be reclassified subsequently to profit or loss 24 1 14 1
Other comprehensive income/(loss), net of tax 141 513 (232) 1 625
Total comprehensive income for the period 274 941 479 2 732
Attributable to:
Equity holders of the parent 279 939 479 2 718
Non-controlling interests (5) 2 — 14
The above condensed consolidated statement of comprehensive income should be read in conjunction with accompanying notes.
19 October 2023 16 |
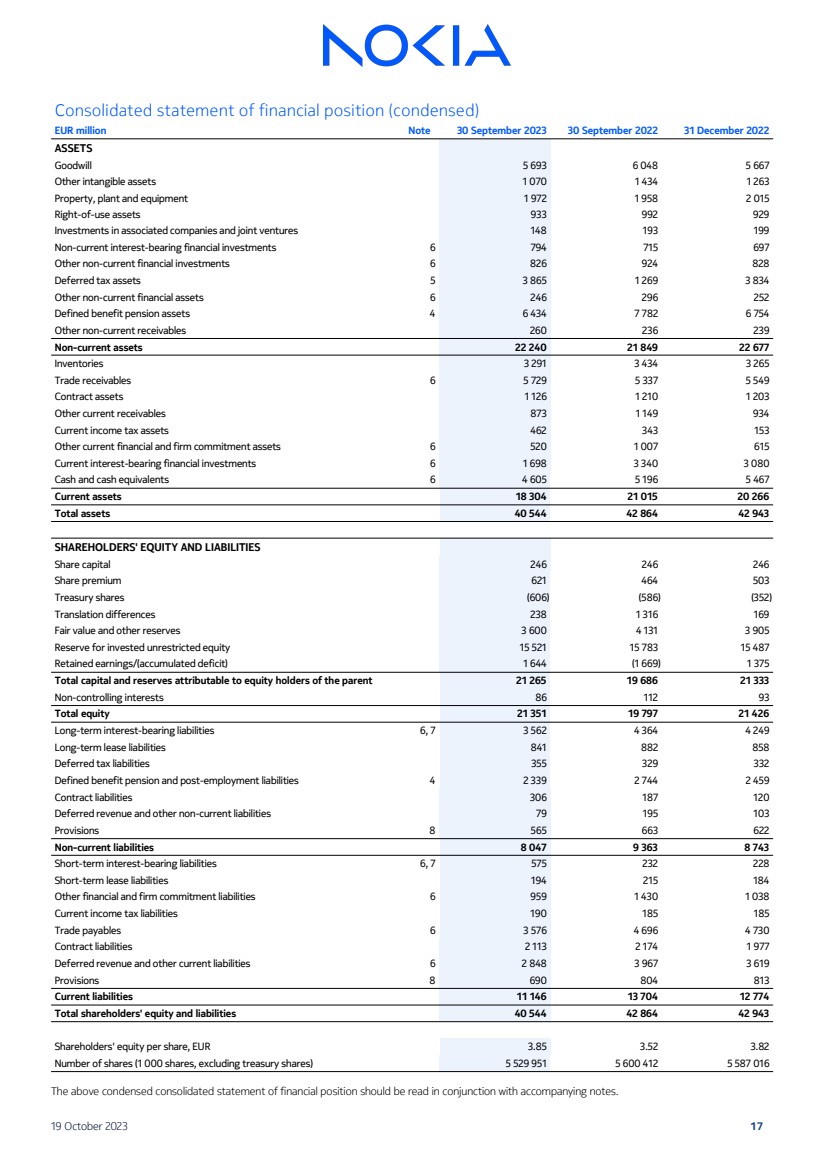
| Consolidated statement of financial position (condensed)
EUR million Note 30 September 2023 30 September 2022 31 December 2022
ASSETS
Goodwill 5 693 6 048 5 667
Other intangible assets 1 070 1 434 1 263
Property, plant and equipment 1 972 1 958 2 015
Right-of-use assets 933 992 929
Investments in associated companies and joint ventures 148 193 199
Non-current interest-bearing financial investments 6 794 715 697
Other non-current financial investments 6 826 924 828
Deferred tax assets 5 3 865 1 269 3 834
Other non-current financial assets 6 246 296 252
Defined benefit pension assets 4 6 434 7 782 6 754
Other non-current receivables 260 236 239
Non-current assets 22 240 21 849 22 677
Inventories 3 291 3 434 3 265
Trade receivables 6 5 729 5 337 5 549
Contract assets 1 126 1 210 1 203
Other current receivables 873 1 149 934
Current income tax assets 462 343 153
Other current financial and firm commitment assets 6 520 1 007 615
Current interest-bearing financial investments 6 1 698 3 340 3 080
Cash and cash equivalents 6 4 605 5 196 5 467
Current assets 18 304 21 015 20 266
Total assets 40 544 42 864 42 943
SHAREHOLDERS' EQUITY AND LIABILITIES
Share capital 246 246 246
Share premium 621 464 503
Treasury shares (606) (586) (352)
Translation differences 238 1 316 169
Fair value and other reserves 3 600 4 131 3 905
Reserve for invested unrestricted equity 15 521 15 783 15 487
Retained earnings/(accumulated deficit) 1 644 (1 669) 1 375
Total capital and reserves attributable to equity holders of the parent 21 265 19 686 21 333
Non-controlling interests 86 112 93
Total equity 21 351 19 797 21 426
Long-term interest-bearing liabilities 6, 7 3 562 4 364 4 249
Long-term lease liabilities 841 882 858
Deferred tax liabilities 355 329 332
Defined benefit pension and post-employment liabilities 4 2 339 2 744 2 459
Contract liabilities 306 187 120
Deferred revenue and other non-current liabilities 79 195 103
Provisions 8 565 663 622
Non-current liabilities 8 047 9 363 8 743
Short-term interest-bearing liabilities 6, 7 575 232 228
Short-term lease liabilities 194 215 184
Other financial and firm commitment liabilities 6 959 1 430 1 038
Current income tax liabilities 190 185 185
Trade payables 6 3 576 4 696 4 730
Contract liabilities 2 113 2 174 1 977
Deferred revenue and other current liabilities 6 2 848 3 967 3 619
Provisions 8 690 804 813
Current liabilities 11 146 13 704 12 774
Total shareholders' equity and liabilities 40 544 42 864 42 943
Shareholders' equity per share, EUR 3.85 3.52 3.82
Number of shares (1 000 shares, excluding treasury shares) 5 529 951 5 600 412 5 587 016
The above condensed consolidated statement of financial position should be read in conjunction with accompanying notes.
19 October 2023 17 |
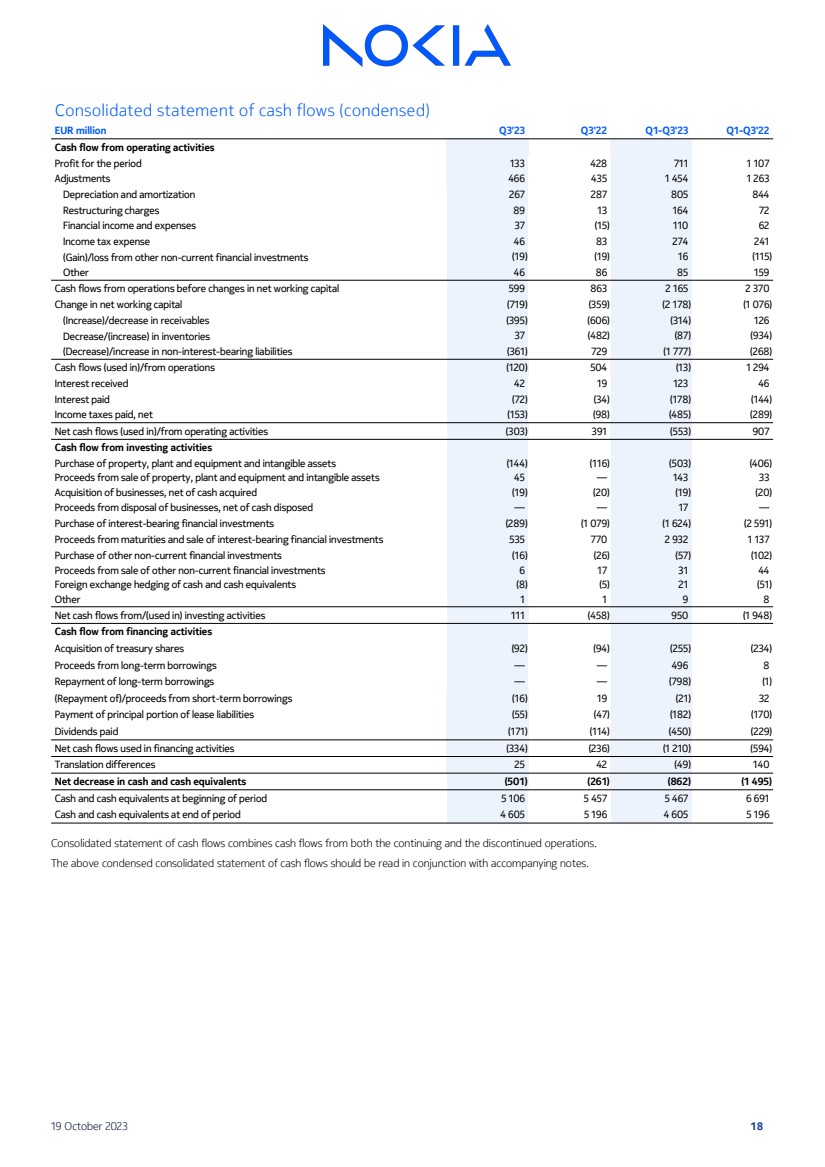
| Consolidated statement of cash flows (condensed)
EUR million Q3'23 Q3'22 Q1-Q3'23 Q1-Q3'22
Cash flow from operating activities
Profit for the period 133 428 711 1 107
Adjustments 466 435 1 454 1 263
Depreciation and amortization 267 287 805 844
Restructuring charges 89 13 164 72
Financial income and expenses 37 (15) 110 62
Income tax expense 46 83 274 241
(Gain)/loss from other non-current financial investments (19) (19) 16 (115)
Other 46 86 85 159
Cash flows from operations before changes in net working capital 599 863 2 165 2 370
Change in net working capital (719) (359) (2 178) (1 076)
(Increase)/decrease in receivables (395) (606) (314) 126
Decrease/(increase) in inventories 37 (482) (87) (934)
(Decrease)/increase in non-interest-bearing liabilities (361) 729 (1 777) (268)
Cash flows (used in)/from operations (120) 504 (13) 1 294
Interest received 42 19 123 46
Interest paid (72) (34) (178) (144)
Income taxes paid, net (153) (98) (485) (289)
Net cash flows (used in)/from operating activities (303) 391 (553) 907
Cash flow from investing activities
Purchase of property, plant and equipment and intangible assets (144) (116) (503) (406)
Proceeds from sale of property, plant and equipment and intangible assets 45 — 143 33
Acquisition of businesses, net of cash acquired (19) (20) (19) (20)
Proceeds from disposal of businesses, net of cash disposed — — 17 —
Purchase of interest-bearing financial investments (289) (1 079) (1 624) (2 591)
Proceeds from maturities and sale of interest-bearing financial investments 535 770 2 932 1 137
Purchase of other non-current financial investments (16) (26) (57) (102)
Proceeds from sale of other non-current financial investments 6 17 31 44
Foreign exchange hedging of cash and cash equivalents (8) (5) 21 (51)
Other 1 1 9 8
Net cash flows from/(used in) investing activities 111 (458) 950 (1 948)
Cash flow from financing activities
Acquisition of treasury shares (92) (94) (255) (234)
Proceeds from long-term borrowings — — 496 8
Repayment of long-term borrowings — — (798) (1)
(Repayment of)/proceeds from short-term borrowings (16) 19 (21) 32
Payment of principal portion of lease liabilities (55) (47) (182) (170)
Dividends paid (171) (114) (450) (229)
Net cash flows used in financing activities (334) (236) (1 210) (594)
Translation differences 25 42 (49) 140
Net decrease in cash and cash equivalents (501) (261) (862) (1 495)
Cash and cash equivalents at beginning of period 5 106 5 457 5 467 6 691
Cash and cash equivalents at end of period 4 605 5 196 4 605 5 196
Consolidated statement of cash flows combines cash flows from both the continuing and the discontinued operations.
The above condensed consolidated statement of cash flows should be read in conjunction with accompanying notes.
19 October 2023 18 |
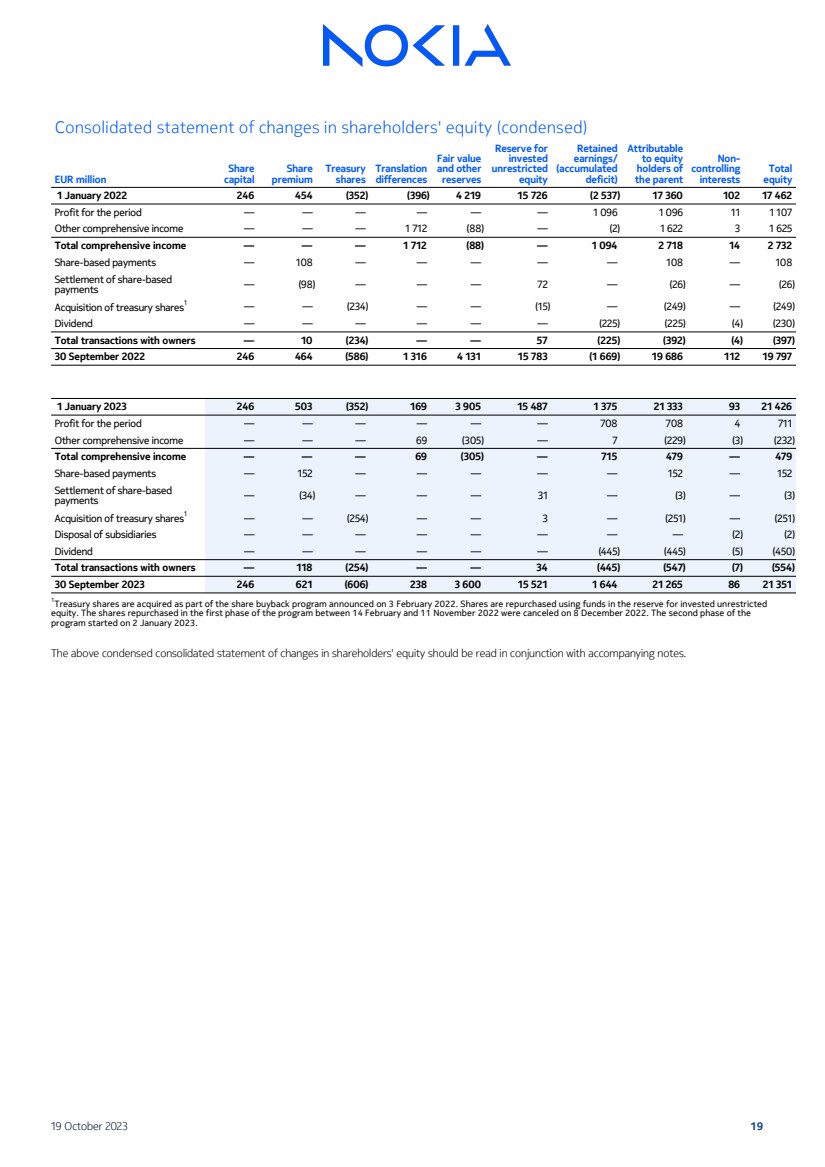
| Consolidated statement of changes in shareholders' equity (condensed)
EUR million
Share
capital
Share
premium
Treasury
shares
Translation
differences
Fair value
and other
reserves
Reserve for
invested
unrestricted
equity
Retained
earnings/
(accumulated
deficit)
Attributable
to equity
holders of
the parent
Non-controlling
interests
Total
equity
1 January 2022 246 454 (352) (396) 4 219 15 726 (2 537) 17 360 102 17 462
Profit for the period — — — — — — 1 096 1 096 11 1 107
Other comprehensive income — — — 1 712 (88) — (2) 1 622 3 1 625
Total comprehensive income — — — 1 712 (88) — 1 094 2 718 14 2 732
Share-based payments — 108 — — — — — 108 — 108
Settlement of share-based
payments — (98) — — — 72 — (26) — (26)
Acquisition of treasury shares1
— — (234) — — (15) — (249) — (249)
Dividend — — — — — — (225) (225) (4) (230)
Total transactions with owners — 10 (234) — — 57 (225) (392) (4) (397)
30 September 2022 246 464 (586) 1 316 4 131 15 783 (1 669) 19 686 112 19 797
1 January 2023 246 503 (352) 169 3 905 15 487 1 375 21 333 93 21 426
Profit for the period — — — — — — 708 708 4 711
Other comprehensive income — — — 69 (305) — 7 (229) (3) (232)
Total comprehensive income — — — 69 (305) — 715 479 — 479
Share-based payments — 152 — — — — — 152 — 152
Settlement of share-based
payments — (34) — — — 31 — (3) — (3)
Acquisition of treasury shares1
— — (254) — — 3 — (251) — (251)
Disposal of subsidiaries — — — — — — — — (2) (2)
Dividend — — — — — — (445) (445) (5) (450)
Total transactions with owners — 118 (254) — — 34 (445) (547) (7) (554)
30 September 2023 246 621 (606) 238 3 600 15 521 1 644 21 265 86 21 351
1
Treasury shares are acquired as part of the share buyback program announced on 3 February 2022. Shares are repurchased using funds in the reserve for invested unrestricted
equity. The shares repurchased in the first phase of the program between 14 February and 11 November 2022 were canceled on 8 December 2022. The second phase of the
program started on 2 January 2023.
The above condensed consolidated statement of changes in shareholders' equity should be read in conjunction with accompanying notes.
19 October 2023 19 |
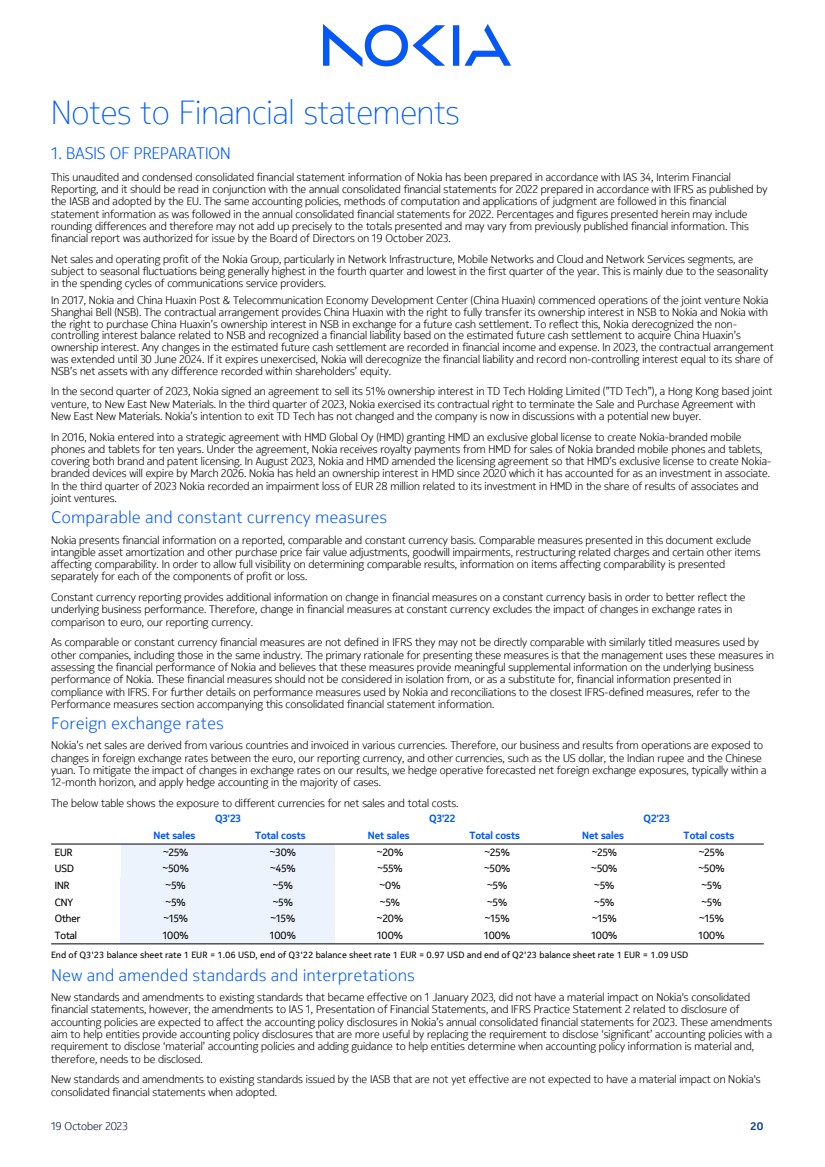
| Notes to Financial statements
1. BASIS OF PREPARATION
This unaudited and condensed consolidated financial statement information of Nokia has been prepared in accordance with IAS 34, Interim Financial
Reporting, and it should be read in conjunction with the annual consolidated financial statements for 2022 prepared in accordance with IFRS as published by
the IASB and adopted by the EU. The same accounting policies, methods of computation and applications of judgment are followed in this financial
statement information as was followed in the annual consolidated financial statements for 2022. Percentages and figures presented herein may include
rounding differences and therefore may not add up precisely to the totals presented and may vary from previously published financial information. This
financial report was authorized for issue by the Board of Directors on 19 October 2023.
Net sales and operating profit of the Nokia Group, particularly in Network Infrastructure, Mobile Networks and Cloud and Network Services segments, are
subject to seasonal fluctuations being generally highest in the fourth quarter and lowest in the first quarter of the year. This is mainly due to the seasonality
in the spending cycles of communications service providers.
In 2017, Nokia and China Huaxin Post & Telecommunication Economy Development Center (China Huaxin) commenced operations of the joint venture Nokia
Shanghai Bell (NSB). The contractual arrangement provides China Huaxin with the right to fully transfer its ownership interest in NSB to Nokia and Nokia with
the right to purchase China Huaxin’s ownership interest in NSB in exchange for a future cash settlement. To reflect this, Nokia derecognized the non-controlling interest balance related to NSB and recognized a financial liability based on the estimated future cash settlement to acquire China Huaxin’s
ownership interest. Any changes in the estimated future cash settlement are recorded in financial income and expense. In 2023, the contractual arrangement
was extended until 30 June 2024. If it expires unexercised, Nokia will derecognize the financial liability and record non-controlling interest equal to its share of
NSB’s net assets with any difference recorded within shareholders’ equity.
In the second quarter of 2023, Nokia signed an agreement to sell its 51% ownership interest in TD Tech Holding Limited (”TD Tech”), a Hong Kong based joint
venture, to New East New Materials. In the third quarter of 2023, Nokia exercised its contractual right to terminate the Sale and Purchase Agreement with
New East New Materials. Nokia’s intention to exit TD Tech has not changed and the company is now in discussions with a potential new buyer.
In 2016, Nokia entered into a strategic agreement with HMD Global Oy (HMD) granting HMD an exclusive global license to create Nokia-branded mobile
phones and tablets for ten years. Under the agreement, Nokia receives royalty payments from HMD for sales of Nokia branded mobile phones and tablets,
covering both brand and patent licensing. In August 2023, Nokia and HMD amended the licensing agreement so that HMD’s exclusive license to create Nokia-branded devices will expire by March 2026. Nokia has held an ownership interest in HMD since 2020 which it has accounted for as an investment in associate.
In the third quarter of 2023 Nokia recorded an impairment loss of EUR 28 million related to its investment in HMD in the share of results of associates and
joint ventures.
Comparable and constant currency measures
Nokia presents financial information on a reported, comparable and constant currency basis. Comparable measures presented in this document exclude
intangible asset amortization and other purchase price fair value adjustments, goodwill impairments, restructuring related charges and certain other items
affecting comparability. In order to allow full visibility on determining comparable results, information on items affecting comparability is presented
separately for each of the components of profit or loss.
Constant currency reporting provides additional information on change in financial measures on a constant currency basis in order to better reflect the
underlying business performance. Therefore, change in financial measures at constant currency excludes the impact of changes in exchange rates in
comparison to euro, our reporting currency.
As comparable or constant currency financial measures are not defined in IFRS they may not be directly comparable with similarly titled measures used by
other companies, including those in the same industry. The primary rationale for presenting these measures is that the management uses these measures in
assessing the financial performance of Nokia and believes that these measures provide meaningful supplemental information on the underlying business
performance of Nokia. These financial measures should not be considered in isolation from, or as a substitute for, financial information presented in
compliance with IFRS. For further details on performance measures used by Nokia and reconciliations to the closest IFRS-defined measures, refer to the
Performance measures section accompanying this consolidated financial statement information.
Foreign exchange rates
Nokia’s net sales are derived from various countries and invoiced in various currencies. Therefore, our business and results from operations are exposed to
changes in foreign exchange rates between the euro, our reporting currency, and other currencies, such as the US dollar, the Indian rupee and the Chinese
yuan. To mitigate the impact of changes in exchange rates on our results, we hedge operative forecasted net foreign exchange exposures, typically within a
12-month horizon, and apply hedge accounting in the majority of cases.
The below table shows the exposure to different currencies for net sales and total costs.
Q3'23 Q3'22 Q2'23
Net sales Total costs Net sales Total costs Net sales Total costs
EUR ~25% ~30% ~20% ~25% ~25% ~25%
USD ~50% ~45% ~55% ~50% ~50% ~50%
INR ~5% ~5% ~0% ~5% ~5% ~5%
CNY ~5% ~5% ~5% ~5% ~5% ~5%
Other ~15% ~15% ~20% ~15% ~15% ~15%
Total 100% 100% 100% 100% 100% 100%
End of Q3'23 balance sheet rate 1 EUR = 1.06 USD, end of Q3'22 balance sheet rate 1 EUR = 0.97 USD and end of Q2'23 balance sheet rate 1 EUR = 1.09 USD
New and amended standards and interpretations
New standards and amendments to existing standards that became effective on 1 January 2023, did not have a material impact on Nokia's consolidated
financial statements, however, the amendments to IAS 1, Presentation of Financial Statements, and IFRS Practice Statement 2 related to disclosure of
accounting policies are expected to affect the accounting policy disclosures in Nokia’s annual consolidated financial statements for 2023. These amendments
aim to help entities provide accounting policy disclosures that are more useful by replacing the requirement to disclose ‘significant’ accounting policies with a
requirement to disclose ‘material’ accounting policies and adding guidance to help entities determine when accounting policy information is material and,
therefore, needs to be disclosed.
New standards and amendments to existing standards issued by the IASB that are not yet effective are not expected to have a material impact on Nokia's
consolidated financial statements when adopted.
19 October 2023 20 |
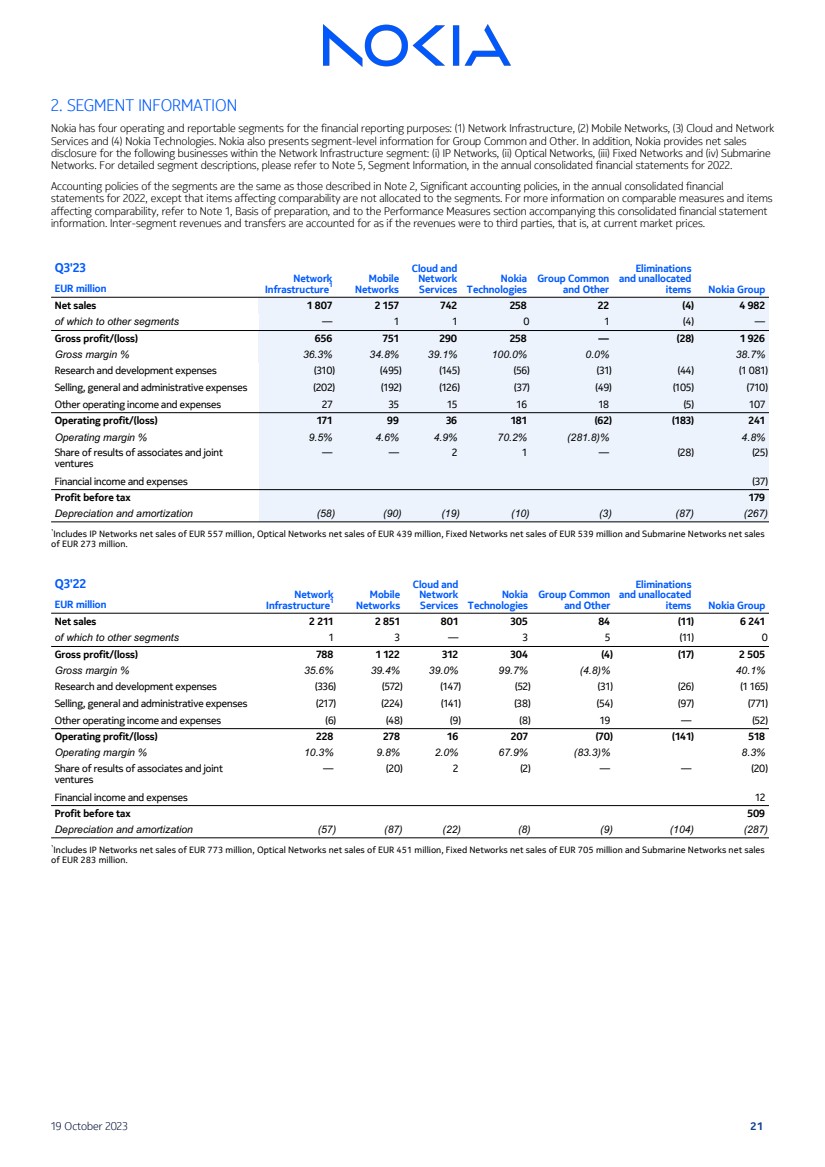
| 2. SEGMENT INFORMATION
Nokia has four operating and reportable segments for the financial reporting purposes: (1) Network Infrastructure, (2) Mobile Networks, (3) Cloud and Network
Services and (4) Nokia Technologies. Nokia also presents segment-level information for Group Common and Other. In addition, Nokia provides net sales
disclosure for the following businesses within the Network Infrastructure segment: (i) IP Networks, (ii) Optical Networks, (iii) Fixed Networks and (iv) Submarine
Networks. For detailed segment descriptions, please refer to Note 5, Segment Information, in the annual consolidated financial statements for 2022.
Accounting policies of the segments are the same as those described in Note 2, Significant accounting policies, in the annual consolidated financial
statements for 2022, except that items affecting comparability are not allocated to the segments. For more information on comparable measures and items
affecting comparability, refer to Note 1, Basis of preparation, and to the Performance Measures section accompanying this consolidated financial statement
information. Inter-segment revenues and transfers are accounted for as if the revenues were to third parties, that is, at current market prices.
Q3'23
Network
Infrastructure1
Mobile
Networks
Cloud and
Network
Services
Nokia
Technologies
Group Common
and Other
Eliminations
and unallocated
EUR million items Nokia Group
Net sales 1 807 2 157 742 258 22 (4) 4 982
of which to other segments — 1 1 0 1 (4) —
Gross profit/(loss) 656 751 290 258 — (28) 1 926
Gross margin % 36.3% 34.8% 39.1% 100.0% 0.0% 38.7%
Research and development expenses (310) (495) (145) (56) (31) (44) (1 081)
Selling, general and administrative expenses (202) (192) (126) (37) (49) (105) (710)
Other operating income and expenses 27 35 15 16 18 (5) 107
Operating profit/(loss) 171 99 36 181 (62) (183) 241
Operating margin % 9.5% 4.6% 4.9% 70.2% (281.8)% 4.8%
Share of results of associates and joint
ventures
— — 2 1 — (28) (25)
Financial income and expenses (37)
Profit before tax 179
Depreciation and amortization (58) (90) (19) (10) (3) (87) (267)
¹
Includes IP Networks net sales of EUR 557 million, Optical Networks net sales of EUR 439 million, Fixed Networks net sales of EUR 539 million and Submarine Networks net sales
of EUR 273 million.
Q3'22
Network
Infrastructure1
Mobile
Networks
Cloud and
Network
Services
Nokia
Technologies
Group Common
and Other
Eliminations
and unallocated
EUR million items Nokia Group
Net sales 2 211 2 851 801 305 84 (11) 6 241
of which to other segments 1 3 — 3 5 (11) 0
Gross profit/(loss) 788 1 122 312 304 (4) (17) 2 505
Gross margin % 35.6% 39.4% 39.0% 99.7% (4.8)% 40.1%
Research and development expenses (336) (572) (147) (52) (31) (26) (1 165)
Selling, general and administrative expenses (217) (224) (141) (38) (54) (97) (771)
Other operating income and expenses (6) (48) (9) (8) 19 — (52)
Operating profit/(loss) 228 278 16 207 (70) (141) 518
Operating margin % 10.3% 9.8% 2.0% 67.9% (83.3)% 8.3%
Share of results of associates and joint
ventures
— (20) 2 (2) — — (20)
Financial income and expenses 12
Profit before tax 509
Depreciation and amortization (57) (87) (22) (8) (9) (104) (287)
¹
Includes IP Networks net sales of EUR 773 million, Optical Networks net sales of EUR 451 million, Fixed Networks net sales of EUR 705 million and Submarine Networks net sales
of EUR 283 million.
19 October 2023 21 |
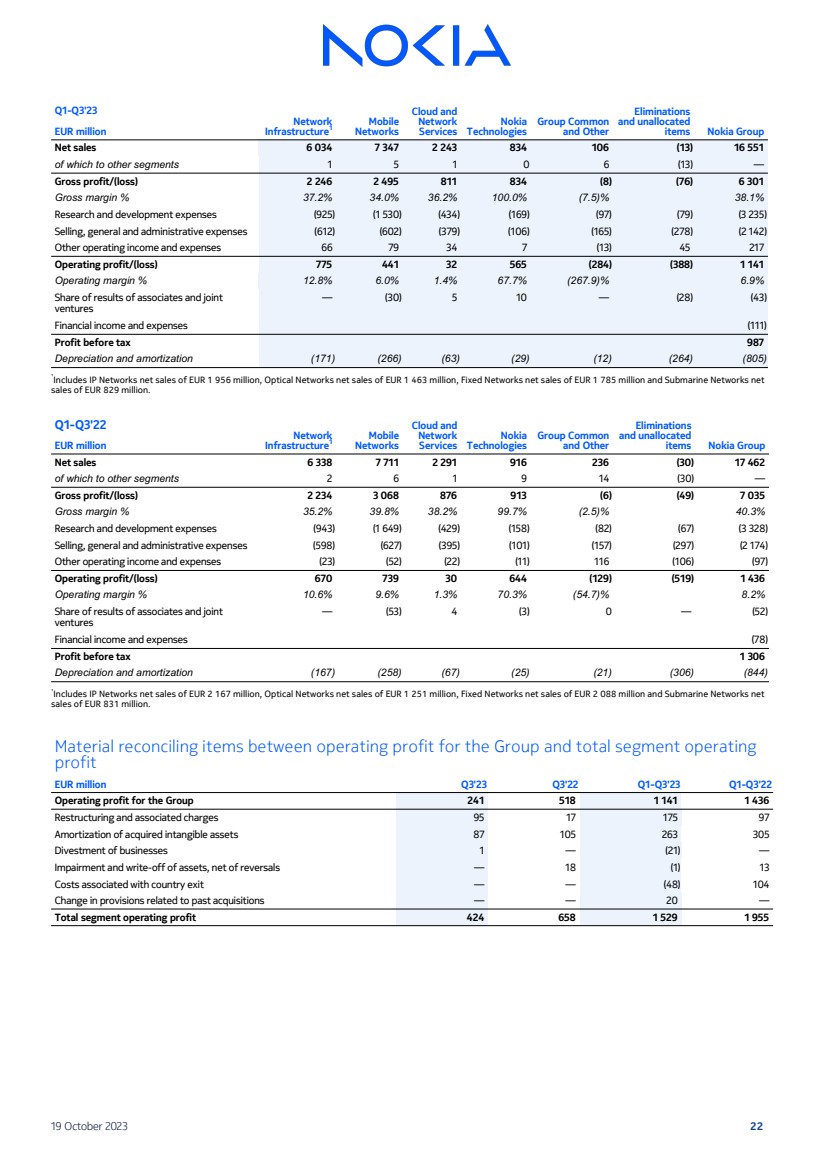
| Q1-Q3'23
Network
Infrastructure1
Mobile
Networks
Cloud and
Network
Services
Nokia
Technologies
Group Common
and Other
Eliminations
and unallocated
EUR million items Nokia Group
Net sales 6 034 7 347 2 243 834 106 (13) 16 551
of which to other segments 1 5 1 0 6 (13) —
Gross profit/(loss) 2 246 2 495 811 834 (8) (76) 6 301
Gross margin % 37.2% 34.0% 36.2% 100.0% (7.5)% 38.1%
Research and development expenses (925) (1 530) (434) (169) (97) (79) (3 235)
Selling, general and administrative expenses (612) (602) (379) (106) (165) (278) (2 142)
Other operating income and expenses 66 79 34 7 (13) 45 217
Operating profit/(loss) 775 441 32 565 (284) (388) 1 141
Operating margin % 12.8% 6.0% 1.4% 67.7% (267.9)% 6.9%
Share of results of associates and joint
ventures
— (30) 5 10 — (28) (43)
Financial income and expenses (111)
Profit before tax 987
Depreciation and amortization (171) (266) (63) (29) (12) (264) (805)
¹
Includes IP Networks net sales of EUR 1 956 million, Optical Networks net sales of EUR 1 463 million, Fixed Networks net sales of EUR 1 785 million and Submarine Networks net
sales of EUR 829 million.
Q1-Q3'22
Network
Infrastructure1
Mobile
Networks
Cloud and
Network
Services
Nokia
Technologies
Group Common
and Other
Eliminations
and unallocated
EUR million items Nokia Group
Net sales 6 338 7 711 2 291 916 236 (30) 17 462
of which to other segments 2 6 1 9 14 (30) —
Gross profit/(loss) 2 234 3 068 876 913 (6) (49) 7 035
Gross margin % 35.2% 39.8% 38.2% 99.7% (2.5)% 40.3%
Research and development expenses (943) (1 649) (429) (158) (82) (67) (3 328)
Selling, general and administrative expenses (598) (627) (395) (101) (157) (297) (2 174)
Other operating income and expenses (23) (52) (22) (11) 116 (106) (97)
Operating profit/(loss) 670 739 30 644 (129) (519) 1 436
Operating margin % 10.6% 9.6% 1.3% 70.3% (54.7)% 8.2%
Share of results of associates and joint
ventures
— (53) 4 (3) 0 — (52)
Financial income and expenses (78)
Profit before tax 1 306
Depreciation and amortization (167) (258) (67) (25) (21) (306) (844)
¹
Includes IP Networks net sales of EUR 2 167 million, Optical Networks net sales of EUR 1 251 million, Fixed Networks net sales of EUR 2 088 million and Submarine Networks net
sales of EUR 831 million.
Material reconciling items between operating profit for the Group and total segment operating
profit
EUR million Q3'23 Q3'22 Q1-Q3'23 Q1-Q3'22
Operating profit for the Group 241 518 1 141 1 436
Restructuring and associated charges 95 17 175 97
Amortization of acquired intangible assets 87 105 263 305
Divestment of businesses 1 — (21) —
Impairment and write-off of assets, net of reversals — 18 (1) 13
Costs associated with country exit — — (48) 104
Change in provisions related to past acquisitions — — 20 —
Total segment operating profit 424 658 1 529 1 955
19 October 2023 22 |
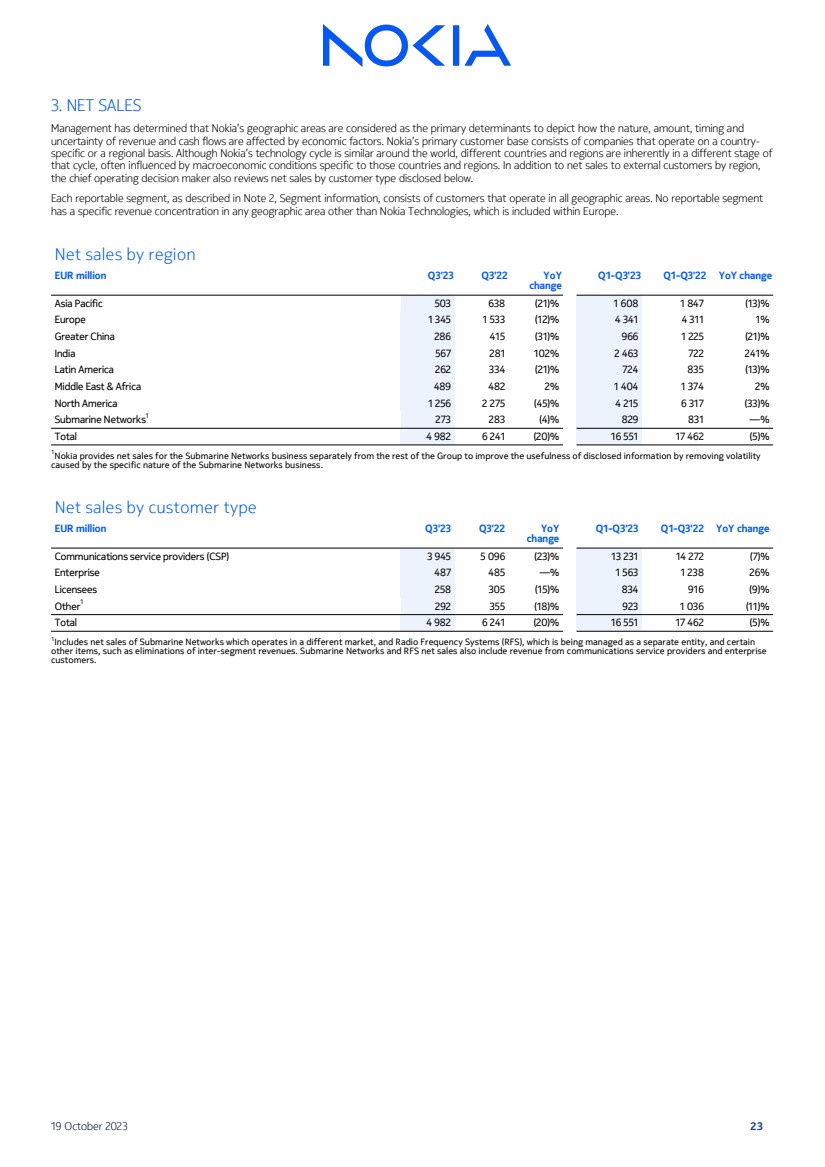
| 3. NET SALES
Management has determined that Nokia’s geographic areas are considered as the primary determinants to depict how the nature, amount, timing and
uncertainty of revenue and cash flows are affected by economic factors. Nokia’s primary customer base consists of companies that operate on a country-specific or a regional basis. Although Nokia’s technology cycle is similar around the world, different countries and regions are inherently in a different stage of
that cycle, often influenced by macroeconomic conditions specific to those countries and regions. In addition to net sales to external customers by region,
the chief operating decision maker also reviews net sales by customer type disclosed below.
Each reportable segment, as described in Note 2, Segment information, consists of customers that operate in all geographic areas. No reportable segment
has a specific revenue concentration in any geographic area other than Nokia Technologies, which is included within Europe.
Net sales by region
EUR million Q3'23 Q3'22 YoY
change
Q1-Q3'23 Q1-Q3'22 YoY change
Asia Pacific 503 638 (21)% 1 608 1 847 (13)%
Europe 1 345 1 533 (12)% 4 341 4 311 1%
Greater China 286 415 (31)% 966 1 225 (21)%
India 567 281 102% 2 463 722 241%
Latin America 262 334 (21)% 724 835 (13)%
Middle East & Africa 489 482 2% 1 404 1 374 2%
North America 1 256 2 275 (45)% 4 215 6 317 (33)%
Submarine Networks1
273 283 (4)% 829 831 —%
Total 4 982 6 241 (20)% 16 551 17 462 (5)%
1Nokia provides net sales for the Submarine Networks business separately from the rest of the Group to improve the usefulness of disclosed information by removing volatility
caused by the specific nature of the Submarine Networks business.
Net sales by customer type
EUR million Q3'23 Q3'22 YoY
change
Q1-Q3'23 Q1-Q3'22 YoY change
Communications service providers (CSP) 3 945 5 096 (23)% 13 231 14 272 (7)%
Enterprise 487 485 —% 1 563 1 238 26%
Licensees 258 305 (15)% 834 916 (9)%
Other1
292 355 (18)% 923 1 036 (11)%
Total 4 982 6 241 (20)% 16 551 17 462 (5)%
1
Includes net sales of Submarine Networks which operates in a different market, and Radio Frequency Systems (RFS), which is being managed as a separate entity, and certain
other items, such as eliminations of inter-segment revenues. Submarine Networks and RFS net sales also include revenue from communications service providers and enterprise
customers.
19 October 2023 23 |
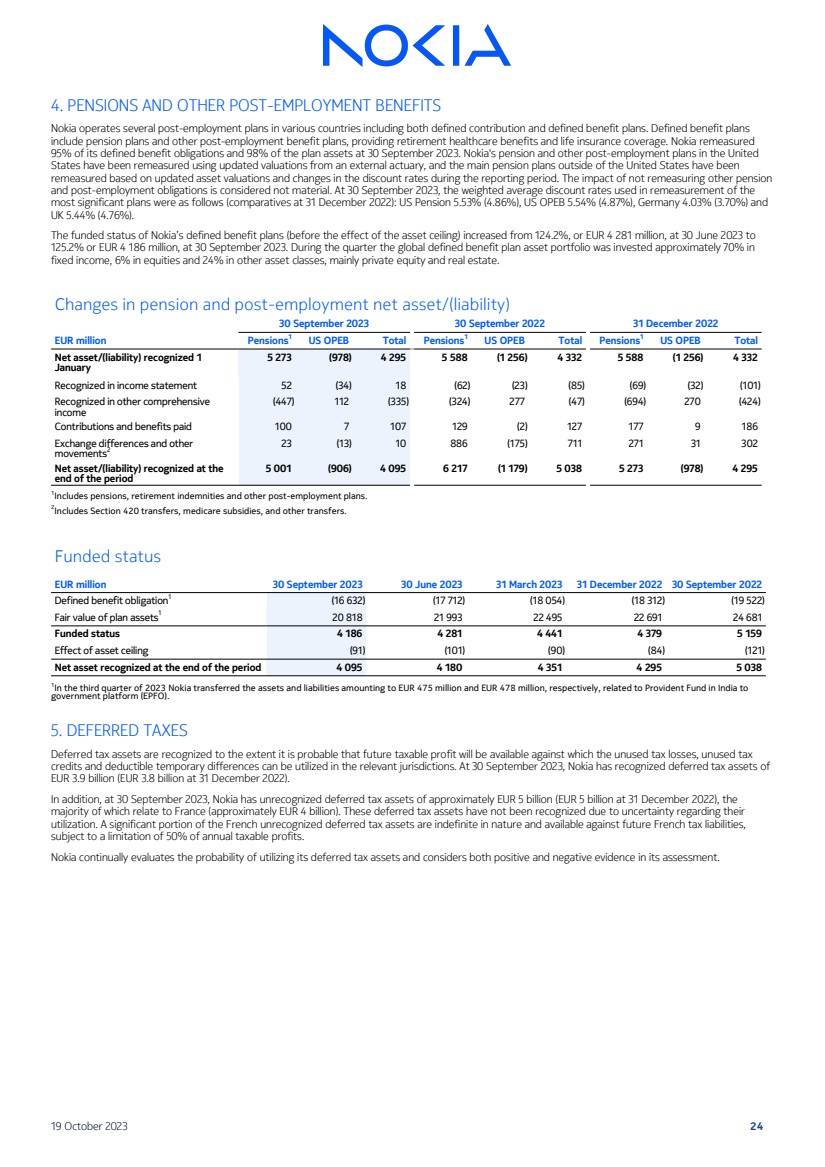
| 4. PENSIONS AND OTHER POST-EMPLOYMENT BENEFITS
Nokia operates several post-employment plans in various countries including both defined contribution and defined benefit plans. Defined benefit plans
include pension plans and other post-employment benefit plans, providing retirement healthcare benefits and life insurance coverage. Nokia remeasured
95% of its defined benefit obligations and 98% of the plan assets at 30 September 2023. Nokia's pension and other post-employment plans in the United
States have been remeasured using updated valuations from an external actuary, and the main pension plans outside of the United States have been
remeasured based on updated asset valuations and changes in the discount rates during the reporting period. The impact of not remeasuring other pension
and post-employment obligations is considered not material. At 30 September 2023, the weighted average discount rates used in remeasurement of the
most significant plans were as follows (comparatives at 31 December 2022): US Pension 5.53% (4.86%), US OPEB 5.54% (4.87%), Germany 4.03% (3.70%) and
UK 5.44% (4.76%).
The funded status of Nokia’s defined benefit plans (before the effect of the asset ceiling) increased from 124.2%, or EUR 4 281 million, at 30 June 2023 to
125.2% or EUR 4 186 million, at 30 September 2023. During the quarter the global defined benefit plan asset portfolio was invested approximately 70% in
fixed income, 6% in equities and 24% in other asset classes, mainly private equity and real estate.
Changes in pension and post-employment net asset/(liability)
30 September 2023 30 September 2022 31 December 2022
EUR million Pensions1
US OPEB Total Pensions1
US OPEB Total Pensions1
US OPEB Total
Net asset/(liability) recognized 1
January
5 273 (978) 4 295 5 588 (1 256) 4 332 5 588 (1 256) 4 332
Recognized in income statement 52 (34) 18 (62) (23) (85) (69) (32) (101)
Recognized in other comprehensive
income
(447) 112 (335) (324) 277 (47) (694) 270 (424)
Contributions and benefits paid 100 7 107 129 (2) 127 177 9 186
Exchange differences and other
movements2
23 (13) 10 886 (175) 711 271 31 302
Net asset/(liability) recognized at the
end of the period
5 001 (906) 4 095 6 217 (1 179) 5 038 5 273 (978) 4 295
1
Includes pensions, retirement indemnities and other post-employment plans.
2
Includes Section 420 transfers, medicare subsidies, and other transfers.
Funded status
EUR million 30 September 2023 30 June 2023 31 March 2023 31 December 2022 30 September 2022
Defined benefit obligation1
(16 632) (17 712) (18 054) (18 312) (19 522)
Fair value of plan assets1
20 818 21 993 22 495 22 691 24 681
Funded status 4 186 4 281 4 441 4 379 5 159
Effect of asset ceiling (91) (101) (90) (84) (121)
Net asset recognized at the end of the period 4 095 4 180 4 351 4 295 5 038
1
In the third quarter of 2023 Nokia transferred the assets and liabilities amounting to EUR 475 million and EUR 478 million, respectively, related to Provident Fund in India to
government platform (EPFO).
5. DEFERRED TAXES
Deferred tax assets are recognized to the extent it is probable that future taxable profit will be available against which the unused tax losses, unused tax
credits and deductible temporary differences can be utilized in the relevant jurisdictions. At 30 September 2023, Nokia has recognized deferred tax assets of
EUR 3.9 billion (EUR 3.8 billion at 31 December 2022).
In addition, at 30 September 2023, Nokia has unrecognized deferred tax assets of approximately EUR 5 billion (EUR 5 billion at 31 December 2022), the
majority of which relate to France (approximately EUR 4 billion). These deferred tax assets have not been recognized due to uncertainty regarding their
utilization. A significant portion of the French unrecognized deferred tax assets are indefinite in nature and available against future French tax liabilities,
subject to a limitation of 50% of annual taxable profits.
Nokia continually evaluates the probability of utilizing its deferred tax assets and considers both positive and negative evidence in its assessment.
19 October 2023 24 |
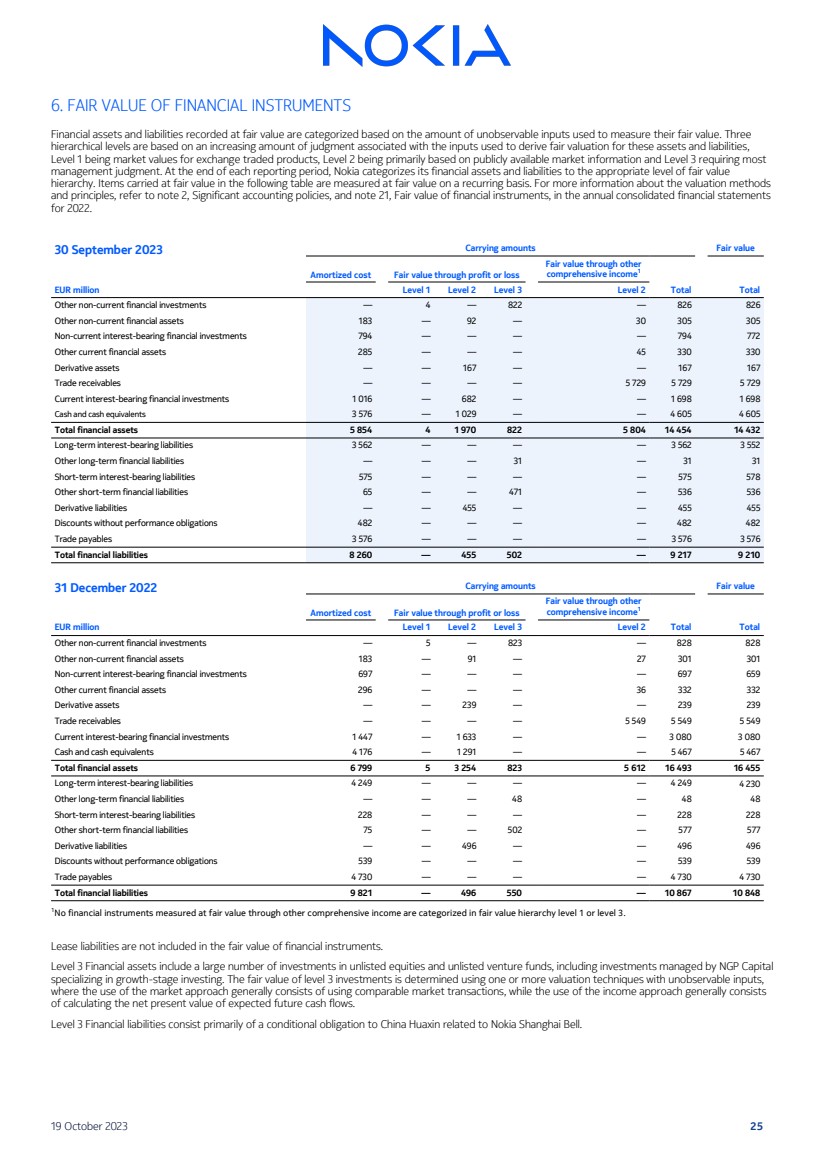
| 6. FAIR VALUE OF FINANCIAL INSTRUMENTS
Financial assets and liabilities recorded at fair value are categorized based on the amount of unobservable inputs used to measure their fair value. Three
hierarchical levels are based on an increasing amount of judgment associated with the inputs used to derive fair valuation for these assets and liabilities,
Level 1 being market values for exchange traded products, Level 2 being primarily based on publicly available market information and Level 3 requiring most
management judgment. At the end of each reporting period, Nokia categorizes its financial assets and liabilities to the appropriate level of fair value
hierarchy. Items carried at fair value in the following table are measured at fair value on a recurring basis. For more information about the valuation methods
and principles, refer to note 2, Significant accounting policies, and note 21, Fair value of financial instruments, in the annual consolidated financial statements
for 2022.
30 September 2023 Carrying amounts Fair value
Amortized cost Fair value through profit or loss
Fair value through other
comprehensive income1
EUR million Level 1 Level 2 Level 3 Level 2 Total Total
Other non-current financial investments — 4 — 822 — 826 826
Other non-current financial assets 183 — 92 — 30 305 305
Non-current interest-bearing financial investments 794 — — — — 794 772
Other current financial assets 285 — — — 45 330 330
Derivative assets — — 167 — — 167 167
Trade receivables — — — — 5 729 5 729 5 729
Current interest-bearing financial investments 1 016 — 682 — — 1 698 1 698
Cash and cash equivalents 3 576 — 1 029 — — 4 605 4 605
Total financial assets 5 854 4 1 970 822 5 804 14 454 14 432
Long-term interest-bearing liabilities 3 562 — — — — 3 562 3 552
Other long-term financial liabilities — — — 31 — 31 31
Short-term interest-bearing liabilities 575 — — — — 575 578
Other short-term financial liabilities 65 — — 471 — 536 536
Derivative liabilities — — 455 — — 455 455
Discounts without performance obligations 482 — — — — 482 482
Trade payables 3 576 — — — — 3 576 3 576
Total financial liabilities 8 260 — 455 502 — 9 217 9 210
31 December 2022 Carrying amounts Fair value
Amortized cost Fair value through profit or loss
Fair value through other
comprehensive income1
EUR million Level 1 Level 2 Level 3 Level 2 Total Total
Other non-current financial investments — 5 — 823 — 828 828
Other non-current financial assets 183 — 91 — 27 301 301
Non-current interest-bearing financial investments 697 — — — — 697 659
Other current financial assets 296 — — — 36 332 332
Derivative assets — — 239 — — 239 239
Trade receivables — — — — 5 549 5 549 5 549
Current interest-bearing financial investments 1 447 — 1 633 — — 3 080 3 080
Cash and cash equivalents 4 176 — 1 291 — — 5 467 5 467
Total financial assets 6 799 5 3 254 823 5 612 16 493 16 455
Long-term interest-bearing liabilities 4 249 — — — — 4 249 4 230
Other long-term financial liabilities — — — 48 — 48 48
Short-term interest-bearing liabilities 228 — — — — 228 228
Other short-term financial liabilities 75 — — 502 — 577 577
Derivative liabilities — — 496 — — 496 496
Discounts without performance obligations 539 — — — — 539 539
Trade payables 4 730 — — — — 4 730 4 730
Total financial liabilities 9 821 — 496 550 — 10 867 10 848
1No financial instruments measured at fair value through other comprehensive income are categorized in fair value hierarchy level 1 or level 3.
Lease liabilities are not included in the fair value of financial instruments.
Level 3 Financial assets include a large number of investments in unlisted equities and unlisted venture funds, including investments managed by NGP Capital
specializing in growth-stage investing. The fair value of level 3 investments is determined using one or more valuation techniques with unobservable inputs,
where the use of the market approach generally consists of using comparable market transactions, while the use of the income approach generally consists
of calculating the net present value of expected future cash flows.
Level 3 Financial liabilities consist primarily of a conditional obligation to China Huaxin related to Nokia Shanghai Bell.
19 October 2023 25 |
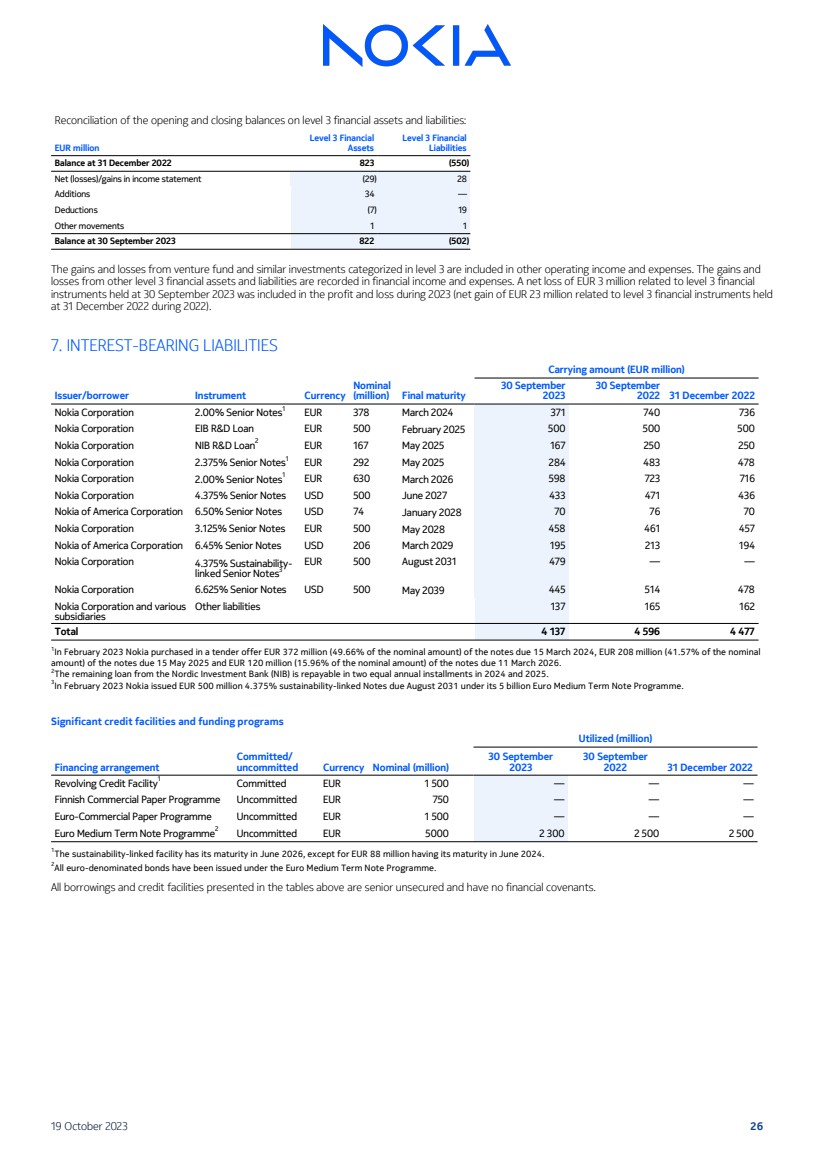
| Reconciliation of the opening and closing balances on level 3 financial assets and liabilities:
EUR million
Level 3 Financial
Assets
Level 3 Financial
Liabilities
Balance at 31 December 2022 823 (550)
Net (losses)/gains in income statement (29) 28
Additions 34 —
Deductions (7) 19
Other movements 1 1
Balance at 30 September 2023 822 (502)
The gains and losses from venture fund and similar investments categorized in level 3 are included in other operating income and expenses. The gains and
losses from other level 3 financial assets and liabilities are recorded in financial income and expenses. A net loss of EUR 3 million related to level 3 financial
instruments held at 30 September 2023 was included in the profit and loss during 2023 (net gain of EUR 23 million related to level 3 financial instruments held
at 31 December 2022 during 2022).
7. INTEREST-BEARING LIABILITIES
Carrying amount (EUR million)
Issuer/borrower Instrument Currency
Nominal
(million) Final maturity
30 September
2023
30 September
2022 31 December 2022
Nokia Corporation 2.00% Senior Notes1
EUR 378 March 2024 371 740 736
Nokia Corporation EIB R&D Loan EUR 500 February 2025 500 500 500
Nokia Corporation NIB R&D Loan2
EUR 167 May 2025 167 250 250
Nokia Corporation 2.375% Senior Notes1
EUR 292 May 2025 284 483 478
Nokia Corporation 2.00% Senior Notes1
EUR 630 March 2026 598 723 716
Nokia Corporation 4.375% Senior Notes USD 500 June 2027 433 471 436
Nokia of America Corporation 6.50% Senior Notes USD 74 January 2028 70 76 70
Nokia Corporation 3.125% Senior Notes EUR 500 May 2028 458 461 457
Nokia of America Corporation 6.45% Senior Notes USD 206 March 2029 195 213 194
Nokia Corporation 4.375% Sustainability-linked Senior Notes3
EUR 500 August 2031 479 — —
Nokia Corporation 6.625% Senior Notes USD 500 May 2039 445 514 478
Nokia Corporation and various
subsidiaries
Other liabilities 137 165 162
Total 4 137 4 596 4 477
1
In February 2023 Nokia purchased in a tender offer EUR 372 million (49.66% of the nominal amount) of the notes due 15 March 2024, EUR 208 million (41.57% of the nominal
amount) of the notes due 15 May 2025 and EUR 120 million (15.96% of the nominal amount) of the notes due 11 March 2026.
2
The remaining loan from the Nordic Investment Bank (NIB) is repayable in two equal annual installments in 2024 and 2025.
3
In February 2023 Nokia issued EUR 500 million 4.375% sustainability-linked Notes due August 2031 under its 5 billion Euro Medium Term Note Programme.
Significant credit facilities and funding programs
Utilized (million)
Financing arrangement
Committed/
uncommitted Currency Nominal (million)
30 September
2023
30 September
2022 31 December 2022
Revolving Credit Facility1
Committed EUR 1 500 — — —
Finnish Commercial Paper Programme Uncommitted EUR 750 — — —
Euro-Commercial Paper Programme Uncommitted EUR 1 500 — — —
Euro Medium Term Note Programme2
Uncommitted EUR 5000 2 300 2 500 2 500
1
The sustainability-linked facility has its maturity in June 2026, except for EUR 88 million having its maturity in June 2024.
2
All euro-denominated bonds have been issued under the Euro Medium Term Note Programme.
All borrowings and credit facilities presented in the tables above are senior unsecured and have no financial covenants.
19 October 2023 26 |
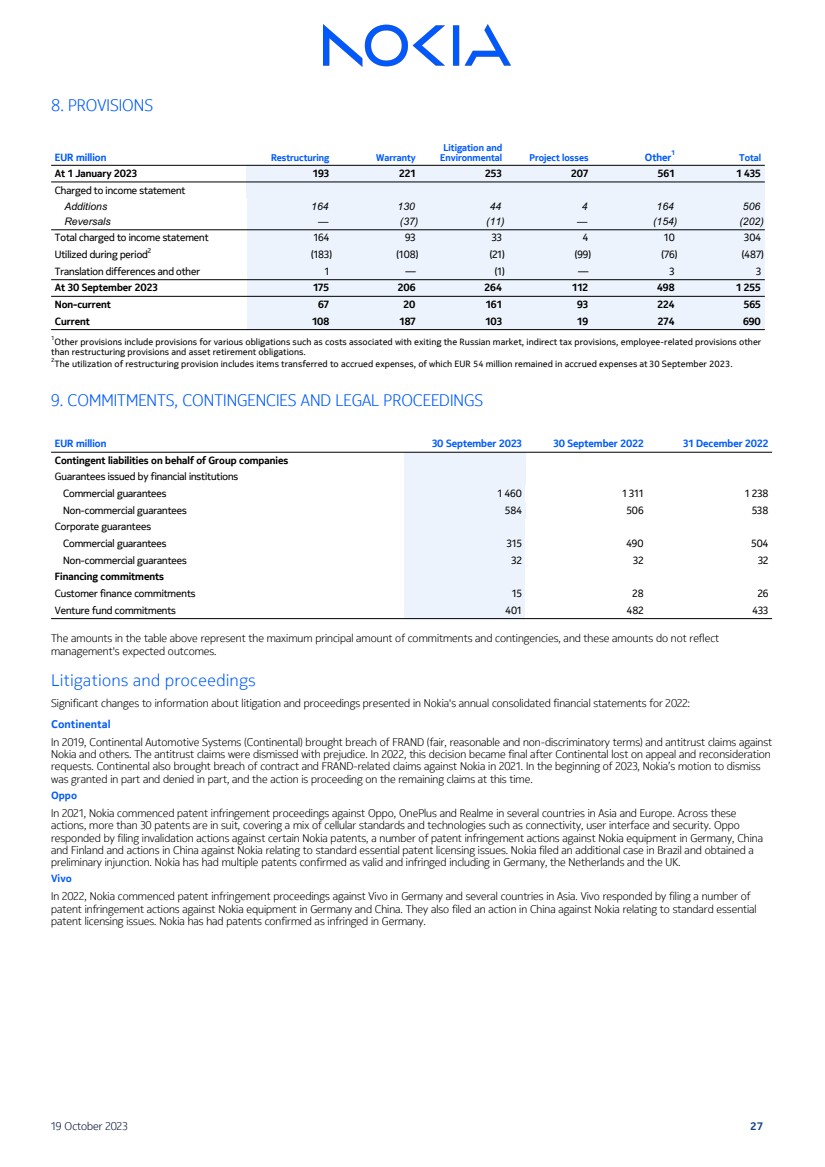
| 8. PROVISIONS
EUR million Restructuring Warranty
Litigation and
Environmental Project losses Other1
Total
At 1 January 2023 193 221 253 207 561 1 435
Charged to income statement
Additions 164 130 44 4 164 506
Reversals — (37) (11) — (154) (202)
Total charged to income statement 164 93 33 4 10 304
Utilized during period2
(183) (108) (21) (99) (76) (487)
Translation differences and other 1 — (1) — 3 3
At 30 September 2023 175 206 264 112 498 1 255
Non-current 67 20 161 93 224 565
Current 108 187 103 19 274 690
1Other provisions include provisions for various obligations such as costs associated with exiting the Russian market, indirect tax provisions, employee-related provisions other
than restructuring provisions and asset retirement obligations.
2
The utilization of restructuring provision includes items transferred to accrued expenses, of which EUR 54 million remained in accrued expenses at 30 September 2023.
9. COMMITMENTS, CONTINGENCIES AND LEGAL PROCEEDINGS
EUR million 30 September 2023 30 September 2022 31 December 2022
Contingent liabilities on behalf of Group companies
Guarantees issued by financial institutions
Commercial guarantees 1 460 1 311 1 238
Non-commercial guarantees 584 506 538
Corporate guarantees
Commercial guarantees 315 490 504
Non-commercial guarantees 32 32 32
Financing commitments
Customer finance commitments 15 28 26
Venture fund commitments 401 482 433
The amounts in the table above represent the maximum principal amount of commitments and contingencies, and these amounts do not reflect
management's expected outcomes.
Litigations and proceedings
Significant changes to information about litigation and proceedings presented in Nokia's annual consolidated financial statements for 2022:
Continental
In 2019, Continental Automotive Systems (Continental) brought breach of FRAND (fair, reasonable and non-discriminatory terms) and antitrust claims against
Nokia and others. The antitrust claims were dismissed with prejudice. In 2022, this decision became final after Continental lost on appeal and reconsideration
requests. Continental also brought breach of contract and FRAND-related claims against Nokia in 2021. In the beginning of 2023, Nokia’s motion to dismiss
was granted in part and denied in part, and the action is proceeding on the remaining claims at this time.
Oppo
In 2021, Nokia commenced patent infringement proceedings against Oppo, OnePlus and Realme in several countries in Asia and Europe. Across these
actions, more than 30 patents are in suit, covering a mix of cellular standards and technologies such as connectivity, user interface and security. Oppo
responded by filing invalidation actions against certain Nokia patents, a number of patent infringement actions against Nokia equipment in Germany, China
and Finland and actions in China against Nokia relating to standard essential patent licensing issues. Nokia filed an additional case in Brazil and obtained a
preliminary injunction. Nokia has had multiple patents confirmed as valid and infringed including in Germany, the Netherlands and the UK.
Vivo
In 2022, Nokia commenced patent infringement proceedings against Vivo in Germany and several countries in Asia. Vivo responded by filing a number of
patent infringement actions against Nokia equipment in Germany and China. They also filed an action in China against Nokia relating to standard essential
patent licensing issues. Nokia has had patents confirmed as infringed in Germany.
19 October 2023 27 |
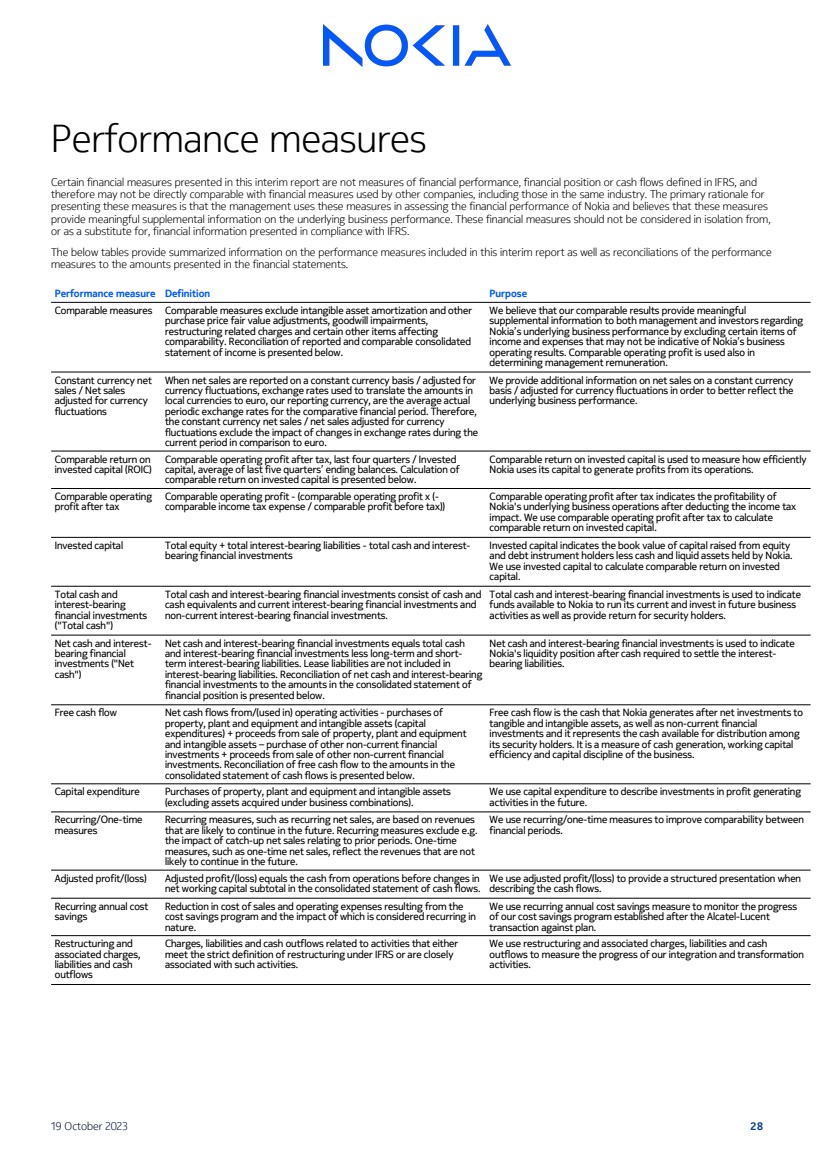
| Performance measures
Certain financial measures presented in this interim report are not measures of financial performance, financial position or cash flows defined in IFRS, and
therefore may not be directly comparable with financial measures used by other companies, including those in the same industry. The primary rationale for
presenting these measures is that the management uses these measures in assessing the financial performance of Nokia and believes that these measures
provide meaningful supplemental information on the underlying business performance. These financial measures should not be considered in isolation from,
or as a substitute for, financial information presented in compliance with IFRS.
The below tables provide summarized information on the performance measures included in this interim report as well as reconciliations of the performance
measures to the amounts presented in the financial statements.
Performance measure Definition Purpose
Comparable measures Comparable measures exclude intangible asset amortization and other
purchase price fair value adjustments, goodwill impairments,
restructuring related charges and certain other items affecting
comparability. Reconciliation of reported and comparable consolidated
statement of income is presented below.
We believe that our comparable results provide meaningful
supplemental information to both management and investors regarding
Nokia’s underlying business performance by excluding certain items of
income and expenses that may not be indicative of Nokia’s business
operating results. Comparable operating profit is used also in
determining management remuneration.
Constant currency net
sales / Net sales
adjusted for currency
fluctuations
When net sales are reported on a constant currency basis / adjusted for
currency fluctuations, exchange rates used to translate the amounts in
local currencies to euro, our reporting currency, are the average actual
periodic exchange rates for the comparative financial period. Therefore,
the constant currency net sales / net sales adjusted for currency
fluctuations exclude the impact of changes in exchange rates during the
current period in comparison to euro.
We provide additional information on net sales on a constant currency
basis / adjusted for currency fluctuations in order to better reflect the
underlying business performance.
Comparable return on
invested capital (ROIC)
Comparable operating profit after tax, last four quarters / Invested
capital, average of last five quarters’ ending balances. Calculation of
comparable return on invested capital is presented below.
Comparable return on invested capital is used to measure how efficiently
Nokia uses its capital to generate profits from its operations.
Comparable operating
profit after tax
Comparable operating profit - (comparable operating profit x (-
comparable income tax expense / comparable profit before tax))
Comparable operating profit after tax indicates the profitability of
Nokia's underlying business operations after deducting the income tax
impact. We use comparable operating profit after tax to calculate
comparable return on invested capital.
Invested capital Total equity + total interest-bearing liabilities - total cash and interest-bearing financial investments
Invested capital indicates the book value of capital raised from equity
and debt instrument holders less cash and liquid assets held by Nokia.
We use invested capital to calculate comparable return on invested
capital.
Total cash and
interest-bearing
financial investments
("Total cash")
Total cash and interest-bearing financial investments consist of cash and
cash equivalents and current interest-bearing financial investments and
non-current interest-bearing financial investments.
Total cash and interest-bearing financial investments is used to indicate
funds available to Nokia to run its current and invest in future business
activities as well as provide return for security holders.
Net cash and interest-bearing financial
investments ("Net
cash")
Net cash and interest-bearing financial investments equals total cash
and interest-bearing financial investments less long-term and short-term interest-bearing liabilities. Lease liabilities are not included in
interest-bearing liabilities. Reconciliation of net cash and interest-bearing
financial investments to the amounts in the consolidated statement of
financial position is presented below.
Net cash and interest-bearing financial investments is used to indicate
Nokia's liquidity position after cash required to settle the interest-bearing liabilities.
Free cash flow Net cash flows from/(used in) operating activities - purchases of
property, plant and equipment and intangible assets (capital
expenditures) + proceeds from sale of property, plant and equipment
and intangible assets – purchase of other non-current financial
investments + proceeds from sale of other non-current financial
investments. Reconciliation of free cash flow to the amounts in the
consolidated statement of cash flows is presented below.
Free cash flow is the cash that Nokia generates after net investments to
tangible and intangible assets, as well as non-current financial
investments and it represents the cash available for distribution among
its security holders. It is a measure of cash generation, working capital
efficiency and capital discipline of the business.
Capital expenditure Purchases of property, plant and equipment and intangible assets
(excluding assets acquired under business combinations).
We use capital expenditure to describe investments in profit generating
activities in the future.
Recurring/One-time
measures
Recurring measures, such as recurring net sales, are based on revenues
that are likely to continue in the future. Recurring measures exclude e.g.
the impact of catch-up net sales relating to prior periods. One-time
measures, such as one-time net sales, reflect the revenues that are not
likely to continue in the future.
We use recurring/one-time measures to improve comparability between
financial periods.
Adjusted profit/(loss) Adjusted profit/(loss) equals the cash from operations before changes in
net working capital subtotal in the consolidated statement of cash flows.
We use adjusted profit/(loss) to provide a structured presentation when
describing the cash flows.
Recurring annual cost
savings
Reduction in cost of sales and operating expenses resulting from the
cost savings program and the impact of which is considered recurring in
nature.
We use recurring annual cost savings measure to monitor the progress
of our cost savings program established after the Alcatel-Lucent
transaction against plan.
Restructuring and
associated charges,
liabilities and cash
outflows
Charges, liabilities and cash outflows related to activities that either
meet the strict definition of restructuring under IFRS or are closely
associated with such activities.
We use restructuring and associated charges, liabilities and cash
outflows to measure the progress of our integration and transformation
activities.
19 October 2023 28 |
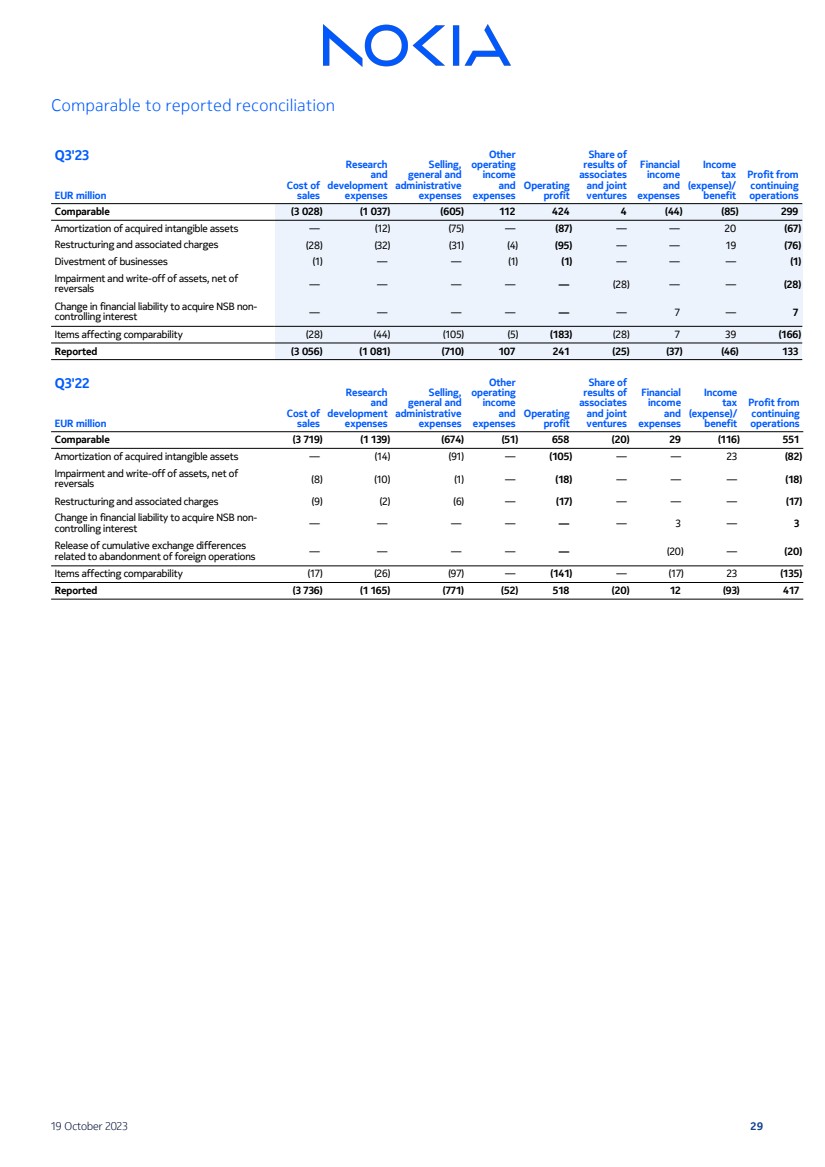
| Comparable to reported reconciliation
Q3'23
Cost of
sales
Research
and
development
expenses
Selling,
general and
administrative
expenses
Other
operating
income
and
expenses
Operating
profit
Share of
results of
associates
and joint
ventures
Financial
income
and
expenses
Income
tax
(expense)/
benefit
Profit from
continuing
EUR million operations
Comparable (3 028) (1 037) (605) 112 424 4 (44) (85) 299
Amortization of acquired intangible assets — (12) (75) — (87) — — 20 (67)
Restructuring and associated charges (28) (32) (31) (4) (95) — — 19 (76)
Divestment of businesses (1) — — (1) (1) — — — (1)
Impairment and write-off of assets, net of
reversals — — — — — (28) — — (28)
Change in financial liability to acquire NSB non-controlling interest — — — — — — 7 — 7
Items affecting comparability (28) (44) (105) (5) (183) (28) 7 39 (166)
Reported (3 056) (1 081) (710) 107 241 (25) (37) (46) 133
Q3'22
Cost of
sales
Research
and
development
expenses
Selling,
general and
administrative
expenses
Other
operating
income
and
expenses
Operating
profit
Share of
results of
associates
and joint
ventures
Financial
income
and
expenses
Income
tax
(expense)/
benefit
Profit from
continuing
EUR million operations
Comparable (3 719) (1 139) (674) (51) 658 (20) 29 (116) 551
Amortization of acquired intangible assets — (14) (91) — (105) — — 23 (82)
Impairment and write-off of assets, net of
reversals (8) (10) (1) — (18) — — — (18)
Restructuring and associated charges (9) (2) (6) — (17) — — — (17)
Change in financial liability to acquire NSB non-controlling interest — — — — — — 3 — 3
Release of cumulative exchange differences
related to abandonment of foreign operations — — — — — (20) — (20)
Items affecting comparability (17) (26) (97) — (141) — (17) 23 (135)
Reported (3 736) (1 165) (771) (52) 518 (20) 12 (93) 417
19 October 2023 29 |
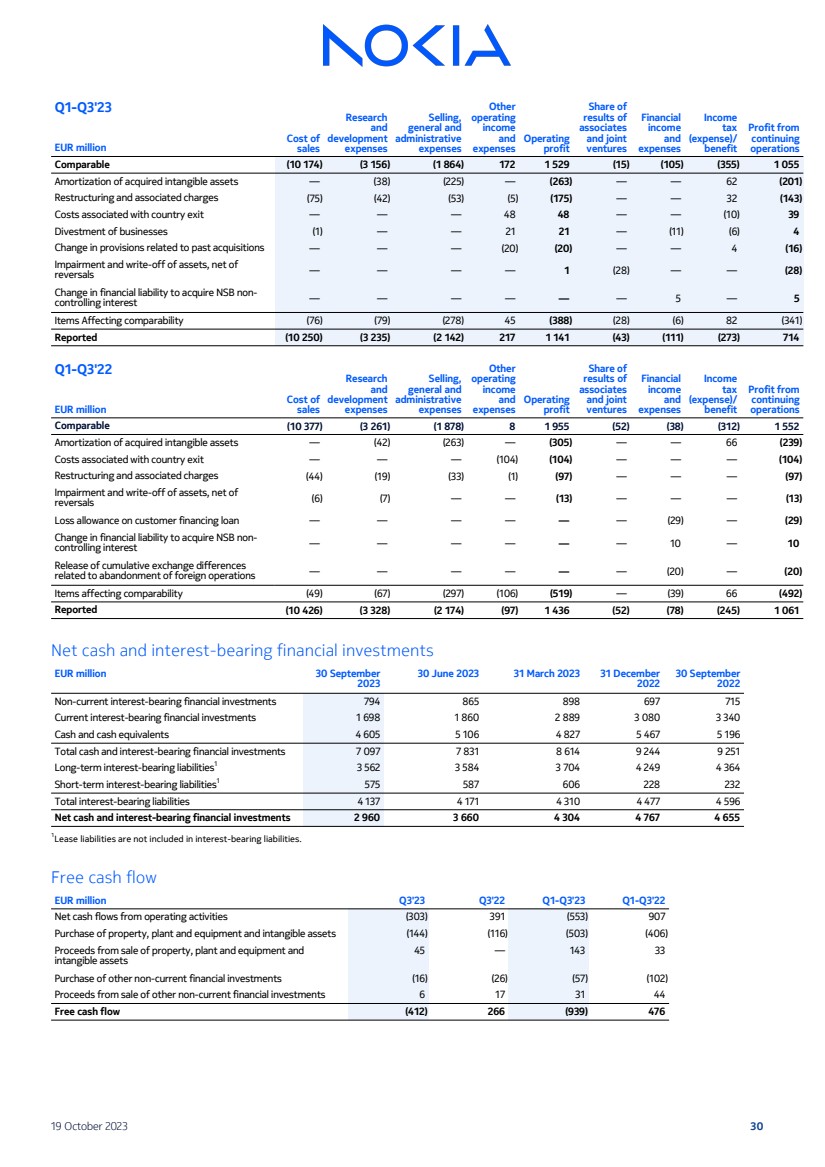
| Q1-Q3'23
Cost of
sales
Research
and
development
expenses
Selling,
general and
administrative
expenses
Other
operating
income
and
expenses
Operating
profit
Share of
results of
associates
and joint
ventures
Financial
income
and
expenses
Income
tax
(expense)/
benefit
Profit from
continuing
EUR million operations
Comparable (10 174) (3 156) (1 864) 172 1 529 (15) (105) (355) 1 055
Amortization of acquired intangible assets — (38) (225) — (263) — — 62 (201)
Restructuring and associated charges (75) (42) (53) (5) (175) — — 32 (143)
Costs associated with country exit — — — 48 48 — — (10) 39
Divestment of businesses (1) — — 21 21 — (11) (6) 4
Change in provisions related to past acquisitions — — — (20) (20) — — 4 (16)
Impairment and write-off of assets, net of
reversals — — — — 1 (28) — — (28)
Change in financial liability to acquire NSB non-controlling interest — — — — — — 5 — 5
Items Affecting comparability (76) (79) (278) 45 (388) (28) (6) 82 (341)
Reported (10 250) (3 235) (2 142) 217 1 141 (43) (111) (273) 714
Q1-Q3'22
Cost of
sales
Research
and
development
expenses
Selling,
general and
administrative
expenses
Other
operating
income
and
expenses
Operating
profit
Share of
results of
associates
and joint
ventures
Financial
income
and
expenses
Income
tax
(expense)/
benefit
Profit from
continuing
EUR million operations
Comparable (10 377) (3 261) (1 878) 8 1 955 (52) (38) (312) 1 552
Amortization of acquired intangible assets — (42) (263) — (305) — — 66 (239)
Costs associated with country exit — — — (104) (104) — — — (104)
Restructuring and associated charges (44) (19) (33) (1) (97) — — — (97)
Impairment and write-off of assets, net of
reversals (6) (7) — — (13) — — — (13)
Loss allowance on customer financing loan — — — — — — (29) — (29)
Change in financial liability to acquire NSB non-controlling interest — — — — — — 10 — 10
Release of cumulative exchange differences
related to abandonment of foreign operations — — — — — — (20) — (20)
Items affecting comparability (49) (67) (297) (106) (519) — (39) 66 (492)
Reported (10 426) (3 328) (2 174) (97) 1 436 (52) (78) (245) 1 061
Net cash and interest-bearing financial investments
EUR million 30 September
2023
30 June 2023 31 March 2023 31 December
2022
30 September
2022
Non-current interest-bearing financial investments 794 865 898 697 715
Current interest-bearing financial investments 1 698 1 860 2 889 3 080 3 340
Cash and cash equivalents 4 605 5 106 4 827 5 467 5 196
Total cash and interest-bearing financial investments 7 097 7 831 8 614 9 244 9 251
Long-term interest-bearing liabilities1
3 562 3 584 3 704 4 249 4 364
Short-term interest-bearing liabilities1
575 587 606 228 232
Total interest-bearing liabilities 4 137 4 171 4 310 4 477 4 596
Net cash and interest-bearing financial investments 2 960 3 660 4 304 4 767 4 655
1
Lease liabilities are not included in interest-bearing liabilities.
Free cash flow
EUR million Q3'23 Q3'22 Q1-Q3'23 Q1-Q3'22
Net cash flows from operating activities (303) 391 (553) 907
Purchase of property, plant and equipment and intangible assets (144) (116) (503) (406)
Proceeds from sale of property, plant and equipment and
intangible assets
45 — 143 33
Purchase of other non-current financial investments (16) (26) (57) (102)
Proceeds from sale of other non-current financial investments 6 17 31 44
Free cash flow (412) 266 (939) 476
19 October 2023 30 |
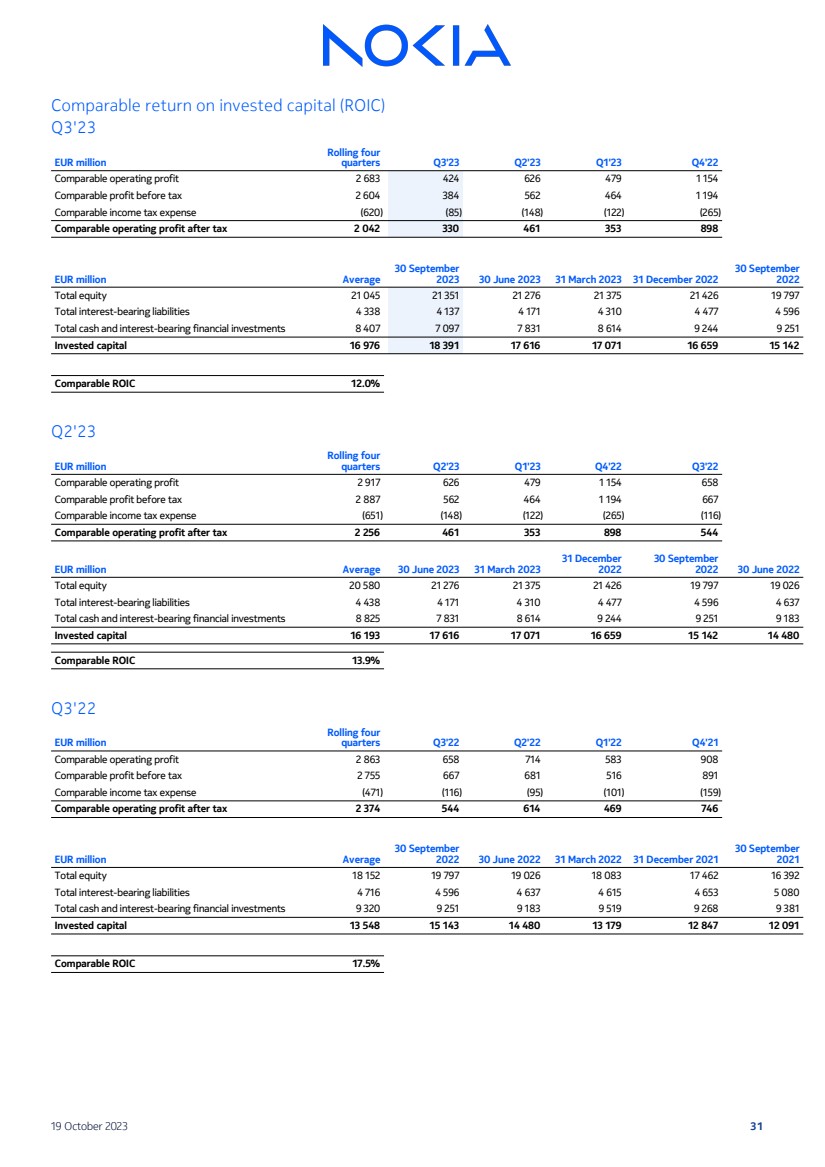
| Comparable return on invested capital (ROIC)
Q3'23
EUR million
Rolling four
quarters Q3'23 Q2'23 Q1'23 Q4'22
Comparable operating profit 2 683 424 626 479 1 154
Comparable profit before tax 2 604 384 562 464 1 194
Comparable income tax expense (620) (85) (148) (122) (265)
Comparable operating profit after tax 2 042 330 461 353 898
EUR million Average
30 September
2023 30 June 2023 31 March 2023 31 December 2022
30 September
2022
Total equity 21 045 21 351 21 276 21 375 21 426 19 797
Total interest-bearing liabilities 4 338 4 137 4 171 4 310 4 477 4 596
Total cash and interest-bearing financial investments 8 407 7 097 7 831 8 614 9 244 9 251
Invested capital 16 976 18 391 17 616 17 071 16 659 15 142
Comparable ROIC 12.0%
Q2'23
EUR million
Rolling four
quarters Q2'23 Q1'23 Q4'22 Q3'22
Comparable operating profit 2 917 626 479 1 154 658
Comparable profit before tax 2 887 562 464 1 194 667
Comparable income tax expense (651) (148) (122) (265) (116)
Comparable operating profit after tax 2 256 461 353 898 544
EUR million Average 30 June 2023 31 March 2023
31 December
2022
30 September
2022 30 June 2022
Total equity 20 580 21 276 21 375 21 426 19 797 19 026
Total interest-bearing liabilities 4 438 4 171 4 310 4 477 4 596 4 637
Total cash and interest-bearing financial investments 8 825 7 831 8 614 9 244 9 251 9 183
Invested capital 16 193 17 616 17 071 16 659 15 142 14 480
Comparable ROIC 13.9%
Q3'22
EUR million
Rolling four
quarters Q3'22 Q2'22 Q1'22 Q4'21
Comparable operating profit 2 863 658 714 583 908
Comparable profit before tax 2 755 667 681 516 891
Comparable income tax expense (471) (116) (95) (101) (159)
Comparable operating profit after tax 2 374 544 614 469 746
EUR million Average
30 September
2022 30 June 2022 31 March 2022 31 December 2021
30 September
2021
Total equity 18 152 19 797 19 026 18 083 17 462 16 392
Total interest-bearing liabilities 4 716 4 596 4 637 4 615 4 653 5 080
Total cash and interest-bearing financial investments 9 320 9 251 9 183 9 519 9 268 9 381
Invested capital 13 548 15 143 14 480 13 179 12 847 12 091
Comparable ROIC 17.5%
19 October 2023 31 |
| This financial report was approved by the Board of Directors on 19 October 2023.
Media and Investor Contacts:
Communications, tel. +358 10 448 4900 email: press.services@nokia.com
Investor Relations, tel. +358 4080 3 4080 email: investor.relations@nokia.com
• Nokia plans to publish its fourth quarter and full year 2023 results on 25 January 2024.
19 October 2023 32 |
SIGNATURE
Pursuant to the requirements
of the Securities Exchange Act of 1934, the registrant, Nokia Corporation, has duly caused this report to be signed on its behalf by
the undersigned, thereunto duly authorized.
| Date: October 19, 2023 |
|
Nokia Corporation |
| |
|
|
| |
|
|
| |
By: |
/s/
Esa Niinimäki |
| |
Name: |
Esa Niinimäki |
| |
Title: |
Chief Legal Officer |
Nokia (NYSE:NOK)
Historical Stock Chart
From Dec 2024 to Jan 2025

Nokia (NYSE:NOK)
Historical Stock Chart
From Jan 2024 to Jan 2025

