UNITED STATES
SECURITIES AND EXCHANGE COMMISSION
Washington, D.C. 20549
FORM N-CSR
CERTIFIED SHAREHOLDER REPORT OF REGISTERED
MANAGEMENT INVESTMENT COMPANIES
Investment Company Act File
Number: 811-21326
Cohen & Steers REIT and Preferred and Income Fund, Inc.
(Exact name of Registrant as specified
in charter)
1166 Avenue of the Americas, 30th Floor, New York, NY 10036
(Address of principal executive
offices) (Zip code)
Dana A. DeVivo
Cohen & Steers Capital Management, Inc.
1166 Avenue of the Americas, 30th Floor
New York, New York 10036
(Name and address of agent for service)
Registrant’s telephone number, including area code: (212)
832-3232
Date of fiscal year
end: December 31
Date of reporting
period: December 31, 2023
Item 1. Reports to Stockholders.
COHEN
& STEERS REIT AND
PREFERRED AND INCOME FUND, INC.
To Our Shareholders:
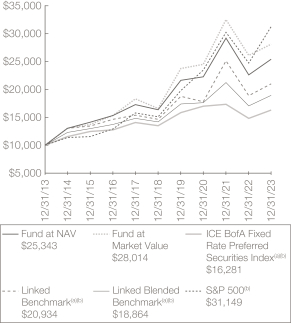
We would like to share with you our report for the year ended December 31, 2023. The total returns for Cohen & Steers REIT and Preferred and Income Fund, Inc. (the Fund) and its comparative benchmarks were:
|
|
|
|
|
|
|
|
|
| |
|
Six Months Ended
December 31, 2023 |
|
|
Year Ended
December 31, 2023 |
|
| Cohen & Steers REIT and Preferred and Income Fund at Net Asset Value(a) |
|
|
8.61 |
% |
|
|
12.47 |
% |
| Cohen & Steers REIT and Preferred and Income Fund at Market Value(a) |
|
|
10.92 |
% |
|
|
7.67 |
% |
| FTSE Nareit All Equity REITs
Index(b) |
|
|
8.15 |
% |
|
|
11.36 |
% |
| ICE BofA Fixed Rate Preferred Securities Index(b) |
|
|
5.36 |
% |
|
|
10.21 |
% |
| Blended Benchmark—50% FTSE Nareit All Equity REITs
Index/50% ICE BofA Fixed Rate Preferred Securities Index |
|
|
6.87 |
% |
|
|
10.97 |
% |
| S&P 500
Index(b) |
|
|
8.04 |
% |
|
|
26.29 |
% |
The performance data quoted represent past performance. Past performance is no guarantee of
future results. The investment return and the principal value of an investment will fluctuate and shares, if sold, may be worth more or less than their original cost. Current performance may be lower or higher than the performance data quoted.
Performance results reflect the effects of leverage, resulting from borrowings under a credit agreement. Current total returns of the Fund can be obtained by visiting our website at cohenandsteers.com. The Fund’s returns assume the reinvestment
of all dividends and distributions at prices obtained under the Fund’s dividend reinvestment plan. Index performance does not reflect the deduction of any fees, taxes or expenses. An investor cannot invest directly in an index. Performance
figures for periods shorter than one year are not annualized.
Managed Distribution Policy
The Fund, acting in accordance with an exemptive order received from the U.S. Securities and Exchange Commission (SEC) and with
approval of its Board of Directors (the Board), adopted a managed distribution policy under which the Fund intends to include long-term capital gains, where applicable, as part of the regular monthly cash distributions to its shareholders (the
Plan). The Plan
| (a) |
As a closed-end investment company, the price of the Fund’s exchange-traded shares will be set
by market forces and can deviate from the net asset value (NAV) per share of the Fund. |
| (b) |
The FTSE Nareit All Equity REITs Index contains all tax-qualified REITs with more than 50% of total
assets in qualifying real estate assets other than mortgages secured by real property that also meet minimum size and liquidity criteria. The ICE BofA Fixed Rate Preferred Securities Index tracks the performance of fixed-rate U.S. dollar-denominated
preferred securities issued in the U.S. domestic market. The S&P 500 Index is an unmanaged index of 500 large-capitalization stocks that is frequently used as a general measure of U.S. stock market performance. Benchmark returns are shown for
comparative purposes only and may not be representative of the Fund’s portfolio. |
1
COHEN
& STEERS REIT AND
PREFERRED AND INCOME FUND, INC.
gives the Fund greater flexibility to realize long-term capital gains and to distribute those gains on a regular monthly basis. In accordance with
the Plan, the Fund currently distributes $0.136 per share on a monthly basis.
The Fund may pay distributions in excess
of the Fund’s investment company taxable income and net realized gains. This excess would be a return of capital distributed from the Fund’s assets. Distributions of capital decrease the Fund’s total assets and, therefore, could have
the effect of increasing the Fund’s expense ratio. In addition, in order to make these distributions, the Fund may have to sell portfolio securities at a less than opportune time.
Shareholders should not draw any conclusions about the Fund’s investment performance from the amount of these distributions or
from the terms of the Fund’s Plan. The Fund’s total return based on NAV is presented in the table above as well as in the Consolidated Financial Highlights table.
The Plan provides that the Board may amend or terminate the Plan at any time without prior notice to Fund shareholders; however, at
this time, there are no reasonably foreseeable circumstances that might cause the termination. The termination of the Plan could have the effect of creating a trading discount (if the Fund’s stock is trading at or above NAV) or widening an
existing trading discount.
Market Review
Real estate shares rose in 2023, bolstered by generally healthy real estate fundamentals and, toward
year-end, optimism around a “soft landing” for the economy. Interest rates played an outsized role in influencing share prices throughout the year, with the market focused on the potential timing and
magnitude of a Federal Reserve (Fed) pivot following extensive monetary policy tightening. The U.S. 10-year Treasury yield fell to a low of 3.3% during the March banking crisis; it then rose steadily to 5.0%
by October, only to fall back below 4.0% (ending the year where it began). The year-end rally in real estate shares occurred as real (inflation-adjusted) rates declined and REIT debt spreads tightened, with
the market increasingly optimistic about a Fed pivot as inflation cooled. Expectations rose that the Fed could start cutting its benchmark lending rate as early as the first half of 2024.
Fund Performance
The Fund had a positive total return in the period and outperformed its blended benchmark on a net asset value basis. However, the Fund underperformed on a market price basis.
Data centers surged on robust growth prospects. The sector benefited during the year from strength in cloud demand and the early
innings of an expected multi-year tailwind from artificial intelligence (AI). Data centers have also witnessed an upward trend in pricing due to limited power availability, expensive land, high material and labor costs, and supply chain delays. The
Fund’s overweight allocation and selection in data centers contributed to relative performance as companies in the space experienced strong rental growth.
Regional malls benefited from strong leasing activity, particularly among trophy assets, as tenants looked past consumer and
economic concerns. With supply expected to remain limited, pricing power could potentially increase. An overweight allocation in the sector contributed to relative performance.
2
COHEN
& STEERS REIT AND
PREFERRED AND INCOME FUND, INC.
Net lease REITs modestly declined, with cost-of-capital challenges
potentially making external growth more difficult for most companies in the sector. The Fund’s overweight investment in the sector hindered relative performance.
Single-family homes for rent continued to benefit from favorable supply and demand fundamentals, partly resulting from high
mortgage rates and affordability challenges in the homes-for-sale market. The Fund’s overweight in the sector helped performance. Apartments trailed on decelerating
rent growth, with the previously strong Sunbelt region challenged by increased supply. Security selection in apartments detracted due to overweight positions in certain REITs with Sunbelt exposure that declined on oversupply concerns, despite a
strong labor market and continued migration to the region. Manufactured homes had a modestly positive total return in the year. The Fund’s selection in the sector hindered relative performance.
Certain sectors found favor late in the year amid a more benign interest rate environment, despite decelerating fundamentals.
Industrial outperformed on the prospect of an economic “soft landing.” But while rent growth in some U.S. cities appears to be stabilizing, other markets are still decelerating. An overweight in the industrial sector aided relative
performance. Self storage, which benefited from accelerated relocation activity during the height of the Covid-19 pandemic, experienced a decline in street rates as demand returned to more normalized levels.
However, the sector rallied late in the year on optimism that lower mortgage rates could lead to more housing transactions, driving demand for space. The Fund’s security selection in the self storage sector detracted from relative performance.
However, the negative effect of our self storage selection was partially offset by a favorable underweight allocation in the sector. Office REITs, where longer-term demand is uncertain, posted relatively modest gains for the year. Our underweight
allocation in offices contributed to relative performance.
Health care modestly outperformed the benchmark, but
performance within the sector was mixed. Senior housing companies rallied sharply, driven by growing occupancy, customer rate increases and improved labor availability. On the other hand, medical office and lab space companies generally struggled
amid challenging fundamentals. The Fund’s security selection in the sector contributed to relative performance, largely due to an overweight investment in the leading senior housing REIT and no investment in the leading lab space provider.
Telecommunications was pressured during the year as new leasing activity in the U.S. softened (due, at least in part,
to slowing tenant spending on 5G). However, mobile usage continues to climb. On average, we were underweight in the sector during the year, and this aided relative performance.
There was a meaningful performance difference between listed and private real estate in 2023. While REITs rebounded off their lows,
private real estate (which typically lags listed real estate in both up and down markets) had a negative total return. The Fund’s out-of-benchmark investment in private real estate detracted relative performance.
Preferred securities and other credit-sensitive fixed income assets had generally solid returns in 2023, while more rate-sensitive
assets (such as government bonds) had relatively modest gains, hindered at times by volatility in interest rates. Banks are the largest issuers of preferreds, and in the U.S., the sudden collapse of Silicon Valley Bank, Signature Bank and First
Republic Bank in early 2023 raised concerns about funding and contagion risk. In Europe, struggling Credit Suisse was acquired by rival UBS in March. Financial regulators took swift action to mitigate contagion risk; the Fed and other central banks
assured that funding would remain readily available in the global banking system.
3
COHEN
& STEERS REIT AND
PREFERRED AND INCOME FUND, INC.
Concerns around these events eased as the period progressed and fundamentals of the broader banking system remained healthy and
resilient. Industry data and individual company comments suggested that the well-publicized U.S. regional bank failures were idiosyncratic and not reflective of systemic risk. Credit Suisse, meanwhile, appeared to be an outlier among European banks.
Overall, the banking sector in the U.S. and Europe continued to generate solid profitability and strong capitalization. Preferred security selection in the banking sector detracted from relative performance, although the adverse effect was partially
offset by a favorable underweight in the sector.
The insurance sector performed well during the period.
Property & casualty insurance companies experienced significant premium growth due to the recovering economy, while life insurers benefited from the declining impact of the Covid pandemic. The Fund’s security selection in insurance
preferreds detracted from relative returns. However, the negative effect was partially offset by an overweight allocation in the sector.
Pipelines had a solid absolute return as company cash flows improved, supported by recovering demand and high crude oil and refined product prices. The Fund’s out-of-index investment in the pipeline sector modestly aided
relative performance. Utilities also outperformed. But while the Fund’s overweight in utilities contributed, the positive effect was more than offset by unfavorable security selection in the sector.
Impact of Leverage on Fund Performance
The Fund employs leverage as part of a yield-enhancement strategy. Leverage, which can increase total return in rising markets
(just as it can have the opposite effect in declining markets), contributed significantly to the Fund’s performance for the 12 months ended December 31, 2023.
Impact of Derivatives on Fund Performance
The Fund engaged in the buying and selling of single stock options with the intention of enhancing current income. These contracts
did not have a material impact on the Fund’s total return for the 12 months ended December 31, 2023.
In
connection with its use of leverage, the Fund pays interest on its borrowings based on a floating rate under the terms of its credit agreement. To reduce the impact that an increase in interest rates could have on the performance of the Fund with
respect to these borrowings, the Fund used interest rate swaps to exchange a portion of the floating rate for a fixed rate. The Fund also used total return swaps with the intention of managing credit risk. The Fund’s use of interest rate swaps
contributed to the Fund’s total return for the 12 months ended December 31, 2023, while the total return swaps had essentially no effect.
The Fund also used forward foreign currency exchange contracts to manage currency risk on certain Fund positions denominated in
foreign currencies. The currency forwards did not have a material effect on the Fund’s total return for the 12 months ended December 31, 2023.
4
COHEN
& STEERS REIT AND
PREFERRED AND INCOME FUND, INC.
Sincerely,
|
|
|

|
|

|
|
|
| WILLIAM F. SCAPELL |
|
JASON YABLON |
| Portfolio Manager |
|
Portfolio Manager |
|
|

|
|

|
| ELAINE ZAHARIS-NIKAS
Portfolio Manager |
|
MATHEW KIRSCHNER
Portfolio Manager |

JERRY DOROST
Portfolio Manager
The views and opinions in the preceding commentary are subject to change without notice and are as of the date of the report.
There is no guarantee that any market forecast set forth in the commentary will be realized. This material represents an assessment of the market environment at a specific point in time, should not be relied upon as investment advice and is not
intended to predict or depict performance of any investment.
Visit Cohen & Steers online at cohenandsteers.com
For more information about the Cohen & Steers family of mutual funds, visit cohenandsteers.com. Here you will
find fund net asset values, fund fact sheets and portfolio highlights, as well as educational resources and timely market updates.
Our website also provides comprehensive information about Cohen & Steers, including our
most recent press releases, profiles of our senior investment professionals and their investment approach to each asset class. The Cohen & Steers family of mutual funds specializes in liquid real assets, including real estate securities, listed
infrastructure and natural resource equities, as well as preferred securities and other income solutions.
5
COHEN
& STEERS REIT AND
PREFERRED AND INCOME FUND, INC.
Performance Review (Unaudited)
Growth of a $10,000 Investment
Average Annual Total Returns—For Periods Ended December 31, 2023
|
|
|
|
|
|
|
|
|
|
|
|
|
|
|
|
|
| |
|
1 Year |
|
|
5 Years |
|
|
10 Years |
|
|
Since Inception(c) |
|
|
Fund at NAV |
|
|
12.47 |
% |
|
|
9.22 |
% |
|
|
9.75 |
% |
|
|
9.05 |
% |
|
Fund at Market Value |
|
|
7.67 |
% |
|
|
11.11 |
% |
|
|
10.85 |
% |
|
|
8.64 |
% |
The performance data quoted represent past performance. Past performance is no guarantee of future results. The
investment return will vary and the principal value of an investment will fluctuate and shares, if sold, may be worth more or less than their original cost. Current performance may be lower or higher than the performance data quoted. Performance
results reflect the effect of leverage from utilization of borrowings under a credit agreement. Current total returns of the Fund can be obtained by visiting our website at cohenandsteers.com. The Fund’s returns assume the reinvestment of all
dividends and distributions at prices obtained under the Fund’s dividend reinvestment plan. The performance graph and table do not reflect the deduction of brokerage commissions or taxes that a shareholder would pay on Fund distributions or the
sale of Fund shares.
| (a) |
The Linked Blended Benchmark is represented by the performance of the blended benchmark consisting
of 50% FTSE Nareit Equity REITs Index and 50% ICE BofA Fixed Rate Preferred Index through March 31, 2019; and the blended benchmark consisting of 50% FTSE Nareit All Equity REITs Index and 50% ICE BofA Fixed Rate Preferred Securities Index
thereafter. |
| |
The Linked Benchmark is represented by the performance of the FTSE Nareit Equity REITs Index
through March 31, 2019 and the FTSE Nareit All Equity REITs Index thereafter. |
6
COHEN
& STEERS REIT AND
PREFERRED AND INCOME FUND, INC.
Performance Review (Unaudited)—(Continued)
| |
The FTSE Nareit Equity REITs Index contains all tax-qualified real estate investment trusts (REITs)
except timber and infrastructure REITs with more than 50% of total assets in qualifying real estate assets other than mortgages secured by real property that also meet minimum size and liquidity criteria. The FTSE Nareit All Equity REITs Index
contains all tax-qualified REITs with more than 50% of total assets in qualifying real estate assets other than mortgages secured by real property that also meet minimum size and liquidity criteria. ICE BofA Fixed Rate Preferred Securities Index
tracks the performance of fixed-rate U.S. dollar-denominated preferred securities issued in the U.S. domestic market. |
| (b) |
The comparative indexes are not adjusted to reflect expenses or other fees that the U.S. Securities
and Exchange Commission (SEC) requires to be reflected in the Fund’s performance. Index performance does not reflect the deduction of any fees, taxes or expenses. An investor cannot invest directly in an index. The Fund’s performance
assumes dividends and distributions are reinvested at prices obtained under the Fund’s dividend reinvestment plan. |
| (c) |
Commencement of investment operations is June 27, 2003. |
7
COHEN
& STEERS REIT AND
PREFERRED AND INCOME FUND, INC.
Our Leverage Strategy
(Unaudited)
Our current leverage strategy utilizes borrowings up to the maximum
permitted by the Investment Company Act of 1940 to provide additional capital for the Fund, with an objective of increasing net income available for shareholders. As of December 31, 2023, leverage represented 31% of the Fund’s managed assets.
Through a combination of variable and fixed rate financing, the Fund has locked in interest rates on a
significant portion of this additional capital through 2027 (where we effectively reduce our variable rate obligation and lock in our fixed rate obligation over various terms). Locking in a significant portion of our leveraging costs is designed to
protect the dividend-paying ability of the Fund. The use of leverage increases the volatility of the Fund’s NAV in both up and down markets. However, we believe that locking in portions of the Fund’s leveraging costs for the various terms
partially protects the Fund’s expenses from an increase in short-term interest rates.
Leverage Facts(a)(b)
|
|
|
| Leverage (as a % of managed assets) |
|
31% |
| % Variable Rate Financing |
|
19% |
| Variable Rate |
|
6.3% |
| % Fixed Rate
Financing(c) |
|
81% |
| Weighted Average Rate on Fixed Financing |
|
1.8% |
| Weighted Average Term on Fixed Financing |
|
2.6 years |
The Fund seeks to enhance its dividend yield through leverage. The use of leverage
is a speculative technique and there are special risks and costs associated with leverage. The NAV of the Fund’s shares may be reduced by the issuance and ongoing costs of leverage. So long as the Fund is able to invest in securities that
produce an investment yield that is greater than the total cost of leverage, the leverage strategy will produce higher current net investment income for shareholders. On the other hand, to the extent that the total cost of leverage exceeds the
incremental income gained from employing such leverage, shareholders would realize lower net investment income. In addition to the impact on net income, the use of leverage will have an effect of magnifying capital appreciation or depreciation for
shareholders. Specifically, in an up market, leverage will typically generate greater capital appreciation than if the Fund were not employing leverage. Conversely, in down markets, the use of leverage will generally result in greater capital
depreciation than if the Fund had been unlevered. To the extent that the Fund is required or elects to reduce its leverage, the Fund may need to liquidate investments, including under adverse economic conditions which may result in capital losses
potentially reducing returns to shareholders. There can be no assurance that a leveraging strategy will be successful during any period in which it is employed.
| (a) |
Data as of December 31, 2023. Information is subject to change. |
| (b) |
See Note 9 in Notes to Consolidated Financial Statements. |
| (c) |
Represents fixed payer interest rate swap contracts on variable rate borrowing.
|
8
COHEN
& STEERS REIT AND
PREFERRED AND INCOME FUND, INC.
December 31, 2023
Top Ten Holdings(a)
(Unaudited)
|
|
|
|
|
|
|
|
|
| Security |
|
Value |
|
|
% of
Managed
Assets |
|
|
|
|
| American Tower Corp. |
|
$ |
89,681,301 |
|
|
|
6.2 |
|
| Prologis, Inc. |
|
|
62,160,856 |
|
|
|
4.3 |
|
| Welltower, Inc. |
|
|
55,441,836 |
|
|
|
3.8 |
|
| Simon Property Group, Inc. |
|
|
46,865,085 |
|
|
|
3.3 |
|
| Invitation Homes, Inc. |
|
|
41,525,480 |
|
|
|
2.9 |
|
| Digital Realty Trust, Inc. |
|
|
40,933,584 |
|
|
|
2.8 |
|
| Realty Income Corp. |
|
|
35,998,263 |
|
|
|
2.5 |
|
| Equinix, Inc. |
|
|
32,387,953 |
|
|
|
2.3 |
|
| Crown Castle, Inc. |
|
|
27,743,051 |
|
|
|
1.9 |
|
| Sun Communities, Inc. |
|
|
26,388,792 |
|
|
|
1.8 |
|
| (a) |
Top ten holdings (excluding short-term investments and derivative instruments) are determined on
the basis of the value of individual securities held. The Fund may also hold positions in other securities issued by the companies listed above. See the Consolidated Schedule of Investments for additional details on such other positions.
|
Sector Breakdown(b)
(Based on Managed Assets)
(Unaudited)
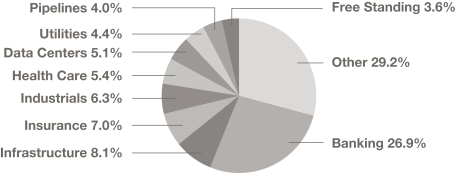
| (b) |
Excludes derivative instruments. |
9
COHEN
& STEERS REIT AND
PREFERRED AND INCOME FUND, INC.
CONSOLIDATED SCHEDULE OF INVESTMENTS
December 31, 2023
|
|
|
|
|
|
|
|
|
|
|
|
|
| |
|
|
|
|
Shares |
|
|
Value |
|
|
|
|
|
|
|
|
|
|
|
|
|
|
| COMMON STOCK—REAL
ESTATE |
|
|
70.4% |
|
|
|
|
|
|
|
|
|
| APARTMENT |
|
|
5.1% |
|
|
|
|
|
|
|
|
|
| Apartment Income REIT
Corp.(a)(b) |
|
|
|
157,962 |
|
|
$ |
5,486,020 |
|
| Camden Property
Trust(a)(b) |
|
|
|
50,906 |
|
|
|
5,054,457 |
|
| Essex Property Trust, Inc. |
|
|
|
15,869 |
|
|
|
3,934,560 |
|
| Mid-America Apartment Communities,
Inc.(a)(b) |
|
|
|
121,925 |
|
|
|
16,394,035 |
|
| UDR,
Inc.(a)(b) |
|
|
|
511,882 |
|
|
|
19,599,962 |
|
|
|
|
|
|
|
|
|
|
|
|
|
|
|
|
|
|
|
|
|
|
50,469,034 |
|
|
|
|
|
|
|
|
|
|
|
|
|
|
| DATA CENTERS |
|
|
7.4% |
|
|
|
|
|
|
|
|
|
| Digital Realty Trust,
Inc.(a)(b) |
|
|
|
304,158 |
|
|
|
40,933,584 |
|
| Equinix,
Inc.(a)(b) |
|
|
|
40,214 |
|
|
|
32,387,953 |
|
|
|
|
|
|
|
|
|
|
|
|
|
|
|
|
|
|
|
|
|
|
73,321,537 |
|
|
|
|
|
|
|
|
|
|
|
|
|
|
| DIVERSIFIED |
|
|
1.8% |
|
|
|
|
|
|
|
|
|
| WP Carey,
Inc.(b) |
|
|
|
277,716 |
|
|
|
17,998,774 |
|
|
|
|
|
|
|
|
|
|
|
| FREE STANDING |
|
|
5.2% |
|
|
|
|
|
|
|
|
|
| NETSTREIT
Corp.(a)(b) |
|
|
|
410,377 |
|
|
|
7,325,230 |
|
| Realty Income
Corp.(a)(b) |
|
|
|
626,929 |
|
|
|
35,998,263 |
|
| Spirit Realty Capital,
Inc.(a)(b)(c) |
|
|
|
179,526 |
|
|
|
7,843,491 |
|
|
|
|
|
|
|
|
|
|
|
|
|
|
|
|
|
|
|
|
|
|
51,166,984 |
|
|
|
|
|
|
|
|
|
|
|
|
|
|
| GAMING |
|
|
1.1% |
|
|
|
|
|
|
|
|
|
| VICI Properties,
Inc.(a)(b) |
|
|
|
340,856 |
|
|
|
10,866,489 |
|
|
|
|
|
|
|
|
|
|
|
| HEALTH CARE |
|
|
7.9% |
|
|
|
|
|
|
|
|
|
| Healthcare Realty Trust,
Inc.(a)(b) |
|
|
|
1,215,621 |
|
|
|
20,945,150 |
|
| Medical Properties Trust, Inc.(b) |
|
|
|
364,297 |
|
|
|
1,788,698 |
|
| Welltower,
Inc.(b) |
|
|
|
614,859 |
|
|
|
55,441,836 |
|
|
|
|
|
|
|
|
|
|
|
|
|
|
|
|
|
|
|
|
|
|
78,175,684 |
|
|
|
|
|
|
|
|
|
|
|
|
|
|
| HOTEL |
|
|
1.2% |
|
|
|
|
|
|
|
|
|
| Host Hotels & Resorts, Inc.(a)(b) |
|
|
|
600,246 |
|
|
|
11,686,790 |
|
|
|
|
|
|
|
|
|
|
|
| INDUSTRIALS |
|
|
8.7% |
|
|
|
|
|
|
|
|
|
| Americold Realty Trust,
Inc.(a)(b) |
|
|
|
583,096 |
|
|
|
17,650,316 |
|
| BG LLH, LLC (Lineage Logistics)(d)(e) |
|
|
|
61,115 |
|
|
|
6,644,979 |
|
| Prologis,
Inc.(b) |
|
|
|
466,323 |
|
|
|
62,160,856 |
|
|
|
|
|
|
|
|
|
|
|
|
|
|
|
|
|
|
|
|
|
|
86,456,151 |
|
|
|
|
|
|
|
|
|
|
|
|
|
|
See accompanying notes to consolidated financial statements.
10
COHEN
& STEERS REIT AND
PREFERRED AND INCOME FUND, INC.
CONSOLIDATED SCHEDULE OF INVESTMENTS—(Continued)
December 31, 2023
|
|
|
|
|
|
|
|
|
|
|
|
|
| |
|
|
|
|
Shares |
|
|
Value |
|
|
|
|
|
|
|
|
|
|
|
|
|
|
| INFRASTRUCTURE |
|
|
11.8% |
|
|
|
|
|
|
|
|
|
| American Tower
Corp.(a)(b) |
|
|
|
415,422 |
|
|
$
|
89,681,301 |
|
| Crown Castle,
Inc.(a)(b) |
|
|
|
240,846 |
|
|
|
27,743,051 |
|
|
|
|
|
|
|
|
|
|
|
|
|
|
|
|
|
|
|
|
|
|
117,424,352 |
|
|
|
|
|
|
|
|
|
|
|
|
|
|
| MANUFACTURED HOME |
|
|
2.7% |
|
|
|
|
|
|
|
|
|
| Sun Communities,
Inc.(a)(b) |
|
|
|
197,447 |
|
|
|
26,388,792 |
|
|
|
|
|
|
|
|
|
|
|
| OFFICE |
|
|
0.4% |
|
|
|
|
|
|
|
|
|
| Highwoods Properties,
Inc.(a)(b) |
|
|
|
188,322 |
|
|
|
4,323,873 |
|
|
|
|
|
|
|
|
|
|
|
| REGIONAL MALL |
|
|
4.7% |
|
|
|
|
|
|
|
|
|
| Simon Property Group,
Inc.(a)(b) |
|
|
|
328,555 |
|
|
|
46,865,085 |
|
|
|
|
|
|
|
|
|
|
|
| SELF STORAGE |
|
|
3.1% |
|
|
|
|
|
|
|
|
|
| Extra Space Storage,
Inc.(b) |
|
|
|
155,853 |
|
|
|
24,987,911 |
|
| Public Storage |
|
|
|
18,576 |
|
|
|
5,665,680 |
|
|
|
|
|
|
|
|
|
|
|
|
|
|
|
|
|
|
|
|
|
|
30,653,591 |
|
|
|
|
|
|
|
|
|
|
|
|
|
|
| SHOPPING CENTER |
|
|
1.9% |
|
|
|
|
|
|
|
|
|
| Kimco Realty
Corp.(b) |
|
|
|
904,912 |
|
|
|
19,283,675 |
|
|
|
|
|
|
|
|
|
|
|
| SINGLE FAMILY HOMES |
|
|
4.7% |
|
|
|
|
|
|
|
|
|
| American Homes 4 Rent, Class A(a)(b) |
|
|
|
131,926 |
|
|
|
4,744,059 |
|
| Invitation Homes,
Inc.(a)(b)(c) |
|
|
|
1,217,399 |
|
|
|
41,525,480 |
|
|
|
|
|
|
|
|
|
|
|
|
|
|
|
|
|
|
|
|
|
|
46,269,539 |
|
|
|
|
|
|
|
|
|
|
|
|
|
|
| SPECIALTY |
|
|
2.3% |
|
|
|
|
|
|
|
|
|
| Iron Mountain,
Inc.(b) |
|
|
|
280,643 |
|
|
|
19,639,397 |
|
| Lamar Advertising Co., Class A |
|
|
|
33,466 |
|
|
|
3,556,767 |
|
|
|
|
|
|
|
|
|
|
|
|
|
|
|
|
|
|
|
|
|
|
23,196,164 |
|
|
|
|
|
|
|
|
|
|
|
|
|
|
| TIMBER |
|
|
0.4% |
|
|
|
|
|
|
|
|
|
| Weyerhaeuser
Co.(a)(b) |
|
|
|
117,855 |
|
|
|
4,097,818 |
|
|
|
|
|
|
|
|
|
|
|
| TOTAL COMMON STOCK
(Identified cost—$515,602,920) |
|
|
|
|
|
|
|
698,644,332 |
|
|
|
|
|
|
|
|
|
|
|
| EXCHANGE-TRADED FUNDS |
|
|
1.2% |
|
|
|
|
|
|
|
|
|
| CORPORATE BONDS |
|
|
|
|
|
|
|
|
|
|
|
|
| Invesco Preferred ETF |
|
|
|
411,836 |
|
|
|
4,723,759 |
|
| iShares Preferred & Income Securities ETF |
|
|
|
251,269 |
|
|
|
7,837,080 |
|
|
|
|
|
|
|
|
|
|
|
| TOTAL EXCHANGE-TRADED
FUNDS
(Identified cost—$12,061,016) |
|
|
|
|
|
|
|
12,560,839 |
|
|
|
|
|
|
|
|
|
|
|
See accompanying notes to consolidated financial statements.
11
COHEN
& STEERS REIT AND
PREFERRED AND INCOME FUND, INC.
CONSOLIDATED SCHEDULE OF INVESTMENTS—(Continued)
December 31, 2023
|
|
|
|
|
|
|
|
|
|
|
|
|
| |
|
|
|
|
Shares |
|
|
Value |
|
|
|
|
|
|
|
|
|
|
|
|
|
|
| PREFERRED
SECURITIES—EXCHANGE-TRADED |
|
|
14.1% |
|
|
|
|
|
|
|
|
|
| BANKING |
|
|
5.5% |
|
|
|
|
|
|
|
|
|
| Bank of America Corp., 4.25%, Series QQ(f) |
|
|
|
221,886 |
|
|
$
|
4,109,329 |
|
| Bank of America Corp., 4.75%, Series SS(f) |
|
|
|
91,608 |
|
|
|
1,905,446 |
|
| Bank of America Corp., 5.00%, Series LL(b)(f) |
|
|
|
125,170 |
|
|
|
2,694,910 |
|
| Bank of America Corp., 5.375%, Series KK(f) |
|
|
|
181,350 |
|
|
|
4,172,863 |
|
| Bank of America Corp., 5.875%, Series HH(f) |
|
|
|
170,122 |
|
|
|
4,207,117 |
|
| Bank of America Corp., 6.00%, Series GG(b)(f) |
|
|
|
137,567 |
|
|
|
3,414,413 |
|
| Brookfield Finance, Inc., 4.625%, due 10/16/80,
Series 50 (Canada)(b) |
|
|
|
88,400 |
|
|
|
1,491,308 |
|
| Federal Agricultural Mortgage Corp., 4.875%, Series G(b)(f) |
|
|
|
93,596 |
|
|
|
1,787,684 |
|
| JPMorgan Chase & Co., 4.55%, Series JJ(f) |
|
|
|
14,749 |
|
|
|
302,355 |
|
| JPMorgan Chase & Co., 4.75%, Series GG(f) |
|
|
|
79,774 |
|
|
|
1,707,164 |
|
| JPMorgan Chase & Co., 5.75%, Series DD(f) |
|
|
|
79,336 |
|
|
|
1,983,400 |
|
| Regions Financial Corp., 5.70% to 5/15/29, Series C(b)(f)(g) |
|
|
|
70,122 |
|
|
|
1,494,300 |
|
| Texas Capital Bancshares, Inc., 5.75%, Series B(b)(f) |
|
|
|
122,300 |
|
|
|
2,256,435 |
|
| U.S. Bancorp, 5.50%, Series
K(f) |
|
|
|
61,439 |
|
|
|
1,425,999 |
|
| U.S. Bancorp, 4.00%, Series M(f) |
|
|
|
59,019 |
|
|
|
1,034,013 |
|
| Wells Fargo & Co., 4.25%, Series DD(b)(f) |
|
|
|
241,775 |
|
|
|
4,298,759 |
|
| Wells Fargo & Co., 4.375%, Series CC(f) |
|
|
|
232,850 |
|
|
|
4,289,097 |
|
| Wells Fargo & Co., 4.70%, Series AA(b)(f) |
|
|
|
194,758 |
|
|
|
3,904,898 |
|
| Wells Fargo & Co., 4.75%, Series Z(a)(b)(f) |
|
|
|
171,825 |
|
|
|
3,424,472 |
|
| Wells Fargo & Co., 5.625%, Series Y(a)(b)(f) |
|
|
|
87,479 |
|
|
|
2,093,372 |
|
| Wells Fargo & Co., 7.50%, Series L (Convertible)(f) |
|
|
|
1,801 |
|
|
|
2,153,312 |
|
|
|
|
|
|
|
|
|
|
|
|
|
|
|
|
|
|
|
|
|
|
|
|
|
54,150,646 |
|
|
|
|
|
|
|
|
|
|
|
|
|
|
| BROKERAGE |
|
|
1.7% |
|
|
|
|
|
|
|
|
|
| Morgan Stanley, 4.25%, Series O(b)(f) |
|
|
|
248,912 |
|
|
|
4,746,752 |
|
| Morgan Stanley, 4.875%, Series L(f) |
|
|
|
1,753 |
|
|
|
39,548 |
|
| Morgan Stanley, 5.85%, Series K(b)(f) |
|
|
|
187,444 |
|
|
|
4,539,894 |
|
| Morgan Stanley, 6.375%, Series I(a)(b)(f) |
|
|
|
179,679 |
|
|
|
4,448,852 |
|
| Morgan Stanley, 6.50%, Series P(b)(f) |
|
|
|
102,950 |
|
|
|
2,694,201 |
|
| Morgan Stanley, 6.875%, Series F(a)(b)(f) |
|
|
|
25,704 |
|
|
|
643,114 |
|
|
|
|
|
|
|
|
|
|
|
|
|
|
|
|
|
|
|
|
|
|
17,112,361 |
|
|
|
|
|
|
|
|
|
|
|
|
|
|
| CONSUMER STAPLE PRODUCTS |
|
|
0.6% |
|
|
|
|
|
|
|
|
|
| CHS, Inc., 6.75% to 9/30/24, Series 3(b)(f)(g) |
|
|
|
102,892 |
|
|
|
2,534,230 |
|
| CHS, Inc., 7.10% to 3/31/24, Series 2(b)(f)(g) |
|
|
|
110,595 |
|
|
|
2,761,557 |
|
See accompanying notes to consolidated financial statements.
12
COHEN
& STEERS REIT AND
PREFERRED AND INCOME FUND, INC.
CONSOLIDATED SCHEDULE OF INVESTMENTS—(Continued)
December 31, 2023
|
|
|
|
|
|
|
|
|
|
|
|
|
| |
|
|
|
|
Shares |
|
|
Value |
|
|
|
|
|
|
|
|
|
|
|
|
|
|
| CHS, Inc., 7.50%, Series
4(b)(f) |
|
|
|
28,801 |
|
|
$
|
728,089 |
|
|
|
|
|
|
|
|
|
|
|
|
|
|
|
|
|
|
|
|
|
|
6,023,876 |
|
|
|
|
|
|
|
|
|
|
|
|
|
|
| FINANCE |
|
|
0.3% |
|
|
|
|
|
|
|
|
|
| Apollo Global Management, Inc., 7.625% to 9/15/28, due 9/15/53(g) |
|
|
|
113,600 |
|
|
|
3,120,592 |
|
|
|
|
|
|
|
|
|
|
|
|
|
|
| INDUSTRIALS |
|
|
0.4% |
|
|
|
|
|
|
|
|
|
| LXP Industrial Trust, 6.50%, Series C ($50 Par Value)(b)(f) |
|
|
|
76,536 |
|
|
|
3,702,046 |
|
|
|
|
|
|
|
|
|
|
|
|
|
|
| INSURANCE |
|
|
2.6% |
|
|
|
|
|
|
|
|
|
| Allstate Corp., 7.375%, Series J(b)(f) |
|
|
|
90,206 |
|
|
|
2,435,562 |
|
| Arch Capital Group Ltd., 4.55%, Series G(b)(f) |
|
|
|
67,650 |
|
|
|
1,346,911 |
|
| Assurant, Inc., 5.25%, due 1/15/61(b) |
|
|
|
31,954 |
|
|
|
637,163 |
|
| Athene Holding Ltd., 4.875%, Series D(b)(f) |
|
|
|
102,832 |
|
|
|
1,830,410 |
|
| Athene Holding Ltd., 6.35% to 6/30/29, Series A(b)(f)(g) |
|
|
|
98,320 |
|
|
|
2,210,234 |
|
| Athene Holding Ltd., 7.75% to 12/30/27, Series E(b)(f)(g) |
|
|
|
85,591 |
|
|
|
2,168,876 |
|
| Brighthouse Financial, Inc., 5.375%, Series C(b)(f) |
|
|
|
69,060 |
|
|
|
1,272,776 |
|
| Enstar Group Ltd., 7.00% to 9/1/28, Series D(b)(f)(g) |
|
|
|
63,422 |
|
|
|
1,590,624 |
|
| Equitable Holdings, Inc., 5.25%, Series A(b)(f) |
|
|
|
51,202 |
|
|
|
1,091,627 |
|
| F&G Annuities & Life, Inc., 7.95%, due
12/15/53 |
|
|
|
108,670 |
|
|
|
2,804,773 |
|
| Lincoln National Corp., 9.00%, Series D(b)(f) |
|
|
|
98,733 |
|
|
|
2,694,423 |
|
| Prudential Financial, Inc., 5.95%, due 9/1/62(b) |
|
|
|
44,116 |
|
|
|
1,121,429 |
|
| Reinsurance Group of America, Inc., 7.125% to 10/15/27, due 10/15/52(b)(g) |
|
|
|
137,357 |
|
|
|
3,582,270 |
|
| RenaissanceRe Holdings Ltd., 4.20%, Series G (Bermuda)(a)(b)(f) |
|
|
|
39,843 |
|
|
|
686,096 |
|
|
|
|
|
|
|
|
|
|
|
|
|
|
|
|
|
|
|
|
|
|
25,473,174 |
|
|
|
|
|
|
|
|
|
|
|
|
|
|
| PIPELINES |
|
|
0.6% |
|
|
|
|
|
|
|
|
|
| Energy Transfer LP, 7.60% to 5/15/24, Series E(f)(g) |
|
|
|
119,381 |
|
|
|
2,960,649 |
|
| Energy Transfer LP, 10.364% to 1/29/24, Series D(b)(f)(g) |
|
|
|
129,530 |
|
|
|
3,277,109 |
|
|
|
|
|
|
|
|
|
|
|
|
|
|
|
|
|
|
|
|
|
|
6,237,758 |
|
|
|
|
|
|
|
|
|
|
|
|
|
|
| REGIONAL MALL |
|
|
0.2% |
|
|
|
|
|
|
|
|
|
| Brookfield Property Partners LP, 5.75%, Series A(b)(f) |
|
|
|
104,400 |
|
|
|
1,199,556 |
|
| Brookfield Property Partners LP, 6.375%, Series A2(b)(f) |
|
|
|
78,467 |
|
|
|
1,012,224 |
|
|
|
|
|
|
|
|
|
|
|
|
|
|
|
|
|
|
|
|
|
|
2,211,780 |
|
|
|
|
|
|
|
|
|
|
|
|
|
|
| TELECOMMUNICATION SERVICES |
|
|
0.8% |
|
|
|
|
|
|
|
|
|
| AT&T, Inc., 4.75%, Series C(f) |
|
|
|
62,051 |
|
|
|
1,224,266 |
|
| AT&T, Inc., 5.00%, Series A(f) |
|
|
|
73,553 |
|
|
|
1,543,878 |
|
See accompanying notes to consolidated financial statements.
13
COHEN
& STEERS REIT AND
PREFERRED AND INCOME FUND, INC.
CONSOLIDATED SCHEDULE OF INVESTMENTS—(Continued)
December 31, 2023
|
|
|
|
|
|
|
|
|
|
|
|
|
| |
|
|
|
|
Shares |
|
|
Value |
|
|
|
|
|
|
|
|
|
|
|
|
|
|
| AT&T, Inc., 5.35%, due 11/1/66(b) |
|
|
|
58,743 |
|
|
$
|
1,377,523 |
|
| Telephone & Data Systems, Inc., 6.00%, Series VV(f) |
|
|
|
17,243 |
|
|
|
264,853 |
|
| U.S. Cellular Corp., 5.50%, due 3/1/70(b) |
|
|
|
53,595 |
|
|
|
956,671 |
|
| U.S. Cellular Corp., 5.50%, due 6/1/70(b) |
|
|
|
49,989 |
|
|
|
877,807 |
|
| U.S. Cellular Corp., 6.25%, due 9/1/69(a)(b) |
|
|
|
87,323 |
|
|
|
1,698,432 |
|
|
|
|
|
|
|
|
|
|
|
|
|
|
|
|
|
|
|
|
|
|
7,943,430 |
|
|
|
|
|
|
|
|
|
|
|
|
|
|
| UTILITIES |
|
|
1.4% |
|
|
|
|
|
|
|
|
|
| Algonquin Power & Utilities Corp., 6.20% to 7/1/24, due 7/1/79,
Series 19-A (Canada)(b)(g) |
|
|
|
135,894 |
|
|
|
3,279,122 |
|
| Brookfield BRP Holdings Canada, Inc., 4.625% (Canada)(b)(f) |
|
|
|
78,000 |
|
|
|
1,220,700 |
|
| Brookfield BRP Holdings Canada, Inc., 4.875% (Canada)(b)(f) |
|
|
|
60,941 |
|
|
|
987,244 |
|
| Brookfield Infrastructure Finance ULC, 5.00%, due 5/24/81 (Canada)(b) |
|
|
|
81,825 |
|
|
|
1,373,024 |
|
| Brookfield Infrastructure Partners LP, 5.125%, Series 13 (Canada)(b)(f) |
|
|
|
93,591 |
|
|
|
1,547,995 |
|
| SCE Trust VII, 7.50%, Series M(f) |
|
|
|
200,800 |
|
|
|
5,236,864 |
|
|
|
|
|
|
|
|
|
|
|
|
|
|
|
|
|
|
|
|
|
|
13,644,949 |
|
|
|
|
|
|
|
|
|
|
|
|
|
|
| TOTAL PREFERRED
SECURITIES—EXCHANGE-TRADED
(Identified cost—$145,881,513) |
|
|
|
|
|
|
|
139,620,612 |
|
|
|
|
|
|
|
|
|
|
|
|
|
|
|
|
|
| |
|
|
Principal
Amount |
|
|
|
|
| PREFERRED SECURITIES—OVER-THE-COUNTER |
|
|
55.8% |
|
|
|
|
|
|
|
|
|
| BANKING |
|
|
33.7% |
|
|
|
|
|
|
|
|
|
| Abanca Corp. Bancaria SA, 6.00% to 1/20/26 (Spain)(f)(g)(h)(i) |
|
|
$ |
1,800,000 |
|
|
|
1,888,252 |
|
| Banco Bilbao Vizcaya Argentaria SA, 6.50% to 3/5/25,
Series 9 (Spain)(a)(b)(f)(g)(h) |
|
|
|
3,000,000 |
|
|
|
2,952,130 |
|
| Banco Bilbao Vizcaya Argentaria SA, 9.375% to 3/19/29 (Spain)(f)(g)(h) |
|
|
|
3,400,000 |
|
|
|
3,645,096 |
|
| Banco de Sabadell SA, 5.75% to 3/15/26 (Spain)(f)(g)(h)(i) |
|
|
|
800,000 |
|
|
|
839,350 |
|
| Banco de Sabadell SA, 9.375% to 7/18/28 (Spain)(f)(g)(h)(i) |
|
|
|
2,000,000 |
|
|
|
2,367,066 |
|
| Banco Mercantil del Norte SA, 6.625% to 1/24/32 (Mexico)(b)(f)(g)(h)(j) |
|
|
|
1,600,000 |
|
|
|
1,363,200 |
|
| Banco Santander SA, 9.625% to 11/21/28 (Spain)(f)(g)(h) |
|
|
|
2,200,000 |
|
|
|
2,362,672 |
|
See accompanying notes to consolidated financial statements.
14
COHEN
& STEERS REIT AND
PREFERRED AND INCOME FUND, INC.
CONSOLIDATED SCHEDULE OF INVESTMENTS—(Continued)
December 31, 2023
|
|
|
|
|
|
|
|
|
|
|
|
|
| |
|
|
|
|
Principal
Amount |
|
|
Value |
|
|
|
|
|
|
|
|
|
|
|
|
|
|
| Banco Santander SA, 9.625% to 5/21/33 (Spain)(f)(g)(h) |
|
|
$
|
4,200,000 |
|
|
$
|
4,599,000 |
|
| Bank of America Corp., 4.375% to 1/27/27, Series RR(f)(g) |
|
|
|
555,000 |
|
|
|
496,018 |
|
| Bank of America Corp., 5.875% to 3/15/28, Series FF(b)(f)(g) |
|
|
|
2,916,000 |
|
|
|
2,795,310 |
|
| Bank of America Corp., 6.10% to 3/17/25, Series AA(b)(f)(g) |
|
|
|
4,192,000 |
|
|
|
4,162,690 |
|
| Bank of America Corp., 6.125% to 4/27/27, Series TT(f)(g) |
|
|
|
4,210,000 |
|
|
|
4,230,629 |
|
| Bank of America Corp., 6.25% to 9/5/24, Series X(b)(f)(g) |
|
|
|
3,011,000 |
|
|
|
2,990,794 |
|
| Bank of America Corp., 6.30% to 3/10/26, Series DD(b)(f)(g) |
|
|
|
1,821,000 |
|
|
|
1,834,661 |
|
| Bank of America Corp., 6.50% to 10/23/24, Series Z(a)(b)(f)(g) |
|
|
|
5,363,000 |
|
|
|
5,350,416 |
|
| Bank of Ireland Group PLC, 6.00% to 9/1/25 (Ireland)(f)(g)(h)(i) |
|
|
|
1,200,000 |
|
|
|
1,309,261 |
|
| Bank of Ireland Group PLC, 7.50% to 5/19/25 (Ireland)(f)(g)(h)(i) |
|
|
|
3,200,000 |
|
|
|
3,585,810 |
|
| Bank of Nova Scotia, 4.90% to 6/4/25 (Canada)(b)(f)(g) |
|
|
|
1,880,000 |
|
|
|
1,800,386 |
|
| Bank of Nova Scotia, 8.625% to 10/27/27, due 10/27/82 (Canada)(g) |
|
|
|
3,200,000 |
|
|
|
3,332,502 |
|
| Barclays Bank PLC, 6.278% to 12/15/34, Series 1 (United Kingdom)(b)(f)(g) |
|
|
|
2,450,000 |
|
|
|
2,466,368 |
|
| Barclays PLC, 6.125% to 12/15/25 (United Kingdom)(b)(f)(g)(h) |
|
|
|
4,400,000 |
|
|
|
4,213,922 |
|
| Barclays PLC, 7.125% to 6/15/25 (United Kingdom)(f)(g)(h) |
|
|
|
1,100,000 |
|
|
|
1,367,249 |
|
| Barclays PLC, 8.00% to 3/15/29 (United Kingdom)(f)(g)(h) |
|
|
|
3,000,000 |
|
|
|
2,951,737 |
|
| Barclays PLC, 8.875% to 9/15/27 (United Kingdom)(f)(g)(h)(i) |
|
|
|
1,700,000 |
|
|
|
2,166,905 |
|
| Barclays PLC, 9.625% to 12/15/29 (United Kingdom)(f)(g)(h) |
|
|
|
4,000,000 |
|
|
|
4,165,000 |
|
| BNP Paribas SA, 4.625% to 1/12/27 (France)(b)(f)(g)(h)(j) |
|
|
|
2,600,000 |
|
|
|
2,278,342 |
|
| BNP Paribas SA, 4.625% to 2/25/31 (France)(b)(f)(g)(h)(j) |
|
|
|
1,926,000 |
|
|
|
1,556,164 |
|
| BNP Paribas SA, 7.00% to 8/16/28 (France)(b)(f)(g)(h)(j) |
|
|
|
2,200,000 |
|
|
|
2,165,187 |
|
| BNP Paribas SA, 7.375% to 8/19/25 (France)(b)(f)(g)(h)(j) |
|
|
|
1,900,000 |
|
|
|
1,907,389 |
|
| BNP Paribas SA, 7.75% to 8/16/29 (France)(b)(f)(g)(h)(j) |
|
|
|
6,800,000 |
|
|
|
6,958,236 |
|
| BNP Paribas SA, 8.50% to 8/14/28 (France)(f)(g)(h)(j) |
|
|
|
4,400,000 |
|
|
|
4,618,786 |
|
| BNP Paribas SA, 9.25% to 11/17/27 (France)(f)(g)(h)(j) |
|
|
|
5,600,000 |
|
|
|
6,002,444 |
|
| CaixaBank SA, 8.25% to 3/13/29 (Spain)(f)(g)(h)(i) |
|
|
|
2,600,000 |
|
|
|
3,048,250 |
|
| Charles Schwab Corp., 4.00% to 6/1/26, Series I(b)(f)(g) |
|
|
|
9,965,000 |
|
|
|
8,796,396 |
|
| Charles Schwab Corp., 4.00% to 12/1/30, Series H(b)(f)(g) |
|
|
|
7,520,000 |
|
|
|
5,948,770 |
|
| Charles Schwab Corp., 5.375% to 6/1/25, Series G(b)(f)(g) |
|
|
|
5,483,000 |
|
|
|
5,420,602 |
|
| Citigroup Capital III, 7.625%, due 12/1/36 (TruPS)(b) |
|
|
|
4,700,000 |
|
|
|
4,837,994 |
|
| Citigroup, Inc., 3.875% to 2/18/26, Series X(b)(f)(g) |
|
|
|
6,220,000 |
|
|
|
5,522,267 |
|
| Citigroup, Inc., 4.00% to 12/10/25, Series W(b)(f)(g) |
|
|
|
1,720,000 |
|
|
|
1,587,409 |
|
See accompanying notes to consolidated financial statements.
15
COHEN
& STEERS REIT AND
PREFERRED AND INCOME FUND, INC.
CONSOLIDATED SCHEDULE OF INVESTMENTS—(Continued)
December 31, 2023
|
|
|
|
|
|
|
|
|
|
|
|
|
| |
|
|
|
|
Principal
Amount |
|
|
Value |
|
|
|
|
|
|
|
|
|
|
|
|
|
|
| Citigroup, Inc., 4.15% to 11/15/26, Series Y(b)(f)(g) |
|
|
$
|
1,256,000 |
|
|
$
|
1,081,085 |
|
| Citigroup, Inc., 5.00% to 9/12/24, Series U(b)(f)(g) |
|
|
|
2,089,000 |
|
|
|
2,033,005 |
|
| Citigroup, Inc., 5.95% to 5/15/25, Series P(a)(b)(f)(g) |
|
|
|
5,000,000 |
|
|
|
4,900,287 |
|
| Citigroup, Inc., 6.25% to 8/15/26, Series T(b)(f)(g) |
|
|
|
2,414,000 |
|
|
|
2,388,647 |
|
| Citigroup, Inc., 7.625% to 11/15/28 (f)(g) |
|
|
|
4,228,000 |
|
|
|
4,327,781 |
|
| Citizens Financial Group, Inc., 5.65% to 10/6/25, Series F(b)(f)(g) |
|
|
|
1,481,000 |
|
|
|
1,408,679 |
|
| CoBank ACB, 6.25% to 10/1/26, Series I(f)(g) |
|
|
|
4,334,000 |
|
|
|
4,182,174 |
|
| CoBank ACB, 6.45% to 10/1/27, Series K(f)(g) |
|
|
|
2,740,000 |
|
|
|
2,664,650 |
|
| Commerzbank AG, 7.00% to 4/9/25 (Germany)(f)(g)(h)(i) |
|
|
|
1,600,000 |
|
|
|
1,544,280 |
|
| Credit Agricole SA, 4.75% to 3/23/29 (France)(b)(f)(g)(h)(j) |
|
|
|
3,400,000 |
|
|
|
2,892,716 |
|
| Credit Agricole SA, 7.25% to 9/23/28, Series EMTN (France)(f)(g)(h)(i) |
|
|
|
1,600,000 |
|
|
|
1,875,046 |
|
| Credit Agricole SA, 8.125% to 12/23/25 (France)(b)(f)(g)(h)(j) |
|
|
|
2,500,000 |
|
|
|
2,555,655 |
|
| Credit Suisse Group AG, 5.25%,Claim (Switzerland)(d)(f)(h)(j)(k) |
|
|
|
1,200,000 |
|
|
|
132,000 |
|
| Credit Suisse Group AG, 6.375%, Claim (Switzerland)(d)(f)(h)(j)(k) |
|
|
|
1,200,000 |
|
|
|
132,000 |
|
| Credit Suisse Group AG, 7.50%, Claim (Switzerland)(d)(f)(h)(j)(k) |
|
|
|
1,000,000 |
|
|
|
110,000 |
|
| Danske Bank AS, 7.00% to 6/26/25 (Denmark)(f)(g)(h)(i) |
|
|
|
1,200,000 |
|
|
|
1,185,054 |
|
| Deutsche Bank AG, 6.00% to 10/30/25 , Series 2020 (Germany)(f)(g)(h) |
|
|
|
1,000,000 |
|
|
|
909,988 |
|
| Deutsche Bank AG, 7.50% to 4/30/25 (Germany)(b)(f)(g)(h) |
|
|
|
2,000,000 |
|
|
|
1,958,491 |
|
| Deutsche Bank AG, 10.00% to 12/1/27 (Germany)(f)(g)(h)(i) |
|
|
|
4,000,000 |
|
|
|
4,829,702 |
|
| Discover Financial Services, 6.125% to 6/23/25, Series D(f)(g) |
|
|
|
790,000 |
|
|
|
765,288 |
|
| Dresdner Funding Trust I, 8.151%, due 6/30/31 (TruPS)(b)(j) |
|
|
|
1,235,906 |
|
|
|
1,370,311 |
|
| Farm Credit Bank of Texas, 5.70% to 9/15/25, Series 4(f)(g)(j) |
|
|
|
2,875,000 |
|
|
|
2,760,000 |
|
| Farm Credit Bank of Texas, 9.656% (3 Month USD Term SOFR + 4.01%)(b)(f)(j)(l) |
|
|
|
18,000 |
† |
|
|
1,797,750 |
|
| First Horizon Bank, 6.518% (3 Month USD Term SOFR + 1.11%, Floor 3.75%)(b)(f)(j)(l) |
|
|
|
2,800 |
† |
|
|
1,739,500 |
|
| Goldman Sachs Group, Inc., 3.65% to 8/10/26, Series U(b)(f)(g) |
|
|
|
2,951,000 |
|
|
|
2,624,234 |
|
See accompanying notes to consolidated financial statements.
16
COHEN
& STEERS REIT AND
PREFERRED AND INCOME FUND, INC.
CONSOLIDATED SCHEDULE OF INVESTMENTS—(Continued)
December 31, 2023
|
|
|
|
|
|
|
|
|
|
|
|
|
| |
|
|
|
|
Principal
Amount |
|
|
Value |
|
|
|
|
|
|
|
|
|
|
|
|
|
|
| HSBC Capital Funding Dollar 1 LP, 10.176% to 6/30/30, Series 2 (United
Kingdom)(f)(g)(j) |
|
|
$
|
3,432,000 |
|
|
$
|
4,365,223 |
|
| HSBC Holdings PLC, 4.60% to 12/17/30 (United Kingdom)(f)(g)(h) |
|
|
|
600,000 |
|
|
|
501,908 |
|
| HSBC Holdings PLC, 6.375% to 3/30/25 (United Kingdom)(b)(f)(g)(h) |
|
|
|
1,400,000 |
|
|
|
1,384,066 |
|
| HSBC Holdings PLC, 6.50% to 3/23/28 (United Kingdom)(a)(b)(f)(g)(h) |
|
|
|
1,700,000 |
|
|
|
1,643,969 |
|
| HSBC Holdings PLC, 8.00% to 3/7/28 (United Kingdom)(f)(g)(h) |
|
|
|
3,600,000 |
|
|
|
3,714,437 |
|
| Huntington Bancshares, Inc., 4.45% to 10/15/27, Series G(b)(f)(g) |
|
|
|
3,043,000 |
|
|
|
2,676,280 |
|
| Huntington Bancshares, Inc., 5.625% to 7/15/30, Series F(b)(f)(g) |
|
|
|
4,061,000 |
|
|
|
3,686,761 |
|
| ING Groep NV, 4.25% to 5/16/31, Series NC10 (Netherlands)(b)(f)(g)(h) |
|
|
|
1,400,000 |
|
|
|
1,021,809 |
|
| ING Groep NV, 4.875% to 5/16/29 (Netherlands)(f)(g)(h)(i) |
|
|
|
2,230,000 |
|
|
|
1,851,346 |
|
| ING Groep NV, 5.75% to 11/16/26 (Netherlands)(b)(f)(g)(h) |
|
|
|
6,200,000 |
|
|
|
5,793,086 |
|
| ING Groep NV, 6.50% to 4/16/25 (Netherlands)(b)(f)(g)(h) |
|
|
|
2,800,000 |
|
|
|
2,731,966 |
|
| ING Groep NV, 7.50% to 5/16/28 (Netherlands)(f)(g)(h)(i) |
|
|
|
1,400,000 |
|
|
|
1,401,183 |
|
| Intesa Sanpaolo SpA, 5.875% to 9/1/31, Series EMTN (Italy)(f)(g)(h)(i) |
|
|
|
750,000 |
|
|
|
748,910 |
|
| Intesa Sanpaolo SpA, 7.70% to 9/17/25 (Italy)(a)(b)(f)(g)(h)(j) |
|
|
|
4,400,000 |
|
|
|
4,334,475 |
|
| Intesa Sanpaolo SpA, 9.125% to 9/7/29 (Italy)(f)(g)(h)(i) |
|
|
|
1,600,000 |
|
|
|
1,947,866 |
|
| JPMorgan Chase & Co., 3.65% to 6/1/26, Series KK(b)(f)(g) |
|
|
|
2,376,000 |
|
|
|
2,180,298 |
|
| JPMorgan Chase & Co., 6.10% to 10/1/24, Series X(f)(g) |
|
|
|
4,622,000 |
|
|
|
4,599,529 |
|
| JPMorgan Chase & Co., 8.889% (3 Month USD Term SOFR + 3.512%),
Series Q(b)(f)(l) |
|
|
|
994,000 |
|
|
|
1,001,038 |
|
| Lloyds Banking Group PLC, 6.75% to 6/27/26 (United Kingdom)(b)(f)(g)(h) |
|
|
|
600,000 |
|
|
|
591,987 |
|
| Lloyds Banking Group PLC, 7.50% to 9/27/25 (United Kingdom)(f)(g)(h) |
|
|
|
4,400,000 |
|
|
|
4,319,878 |
|
| Lloyds Banking Group PLC, 8.00% to 9/27/29 (United Kingdom)(b)(f)(g)(h) |
|
|
|
2,300,000 |
|
|
|
2,310,345 |
|
| M&T Bank Corp., 3.50% to 9/1/26, Series I(f)(g) |
|
|
|
861,000 |
|
|
|
634,012 |
|
| M&T Bank Corp., 5.125% to 11/1/26 Series F(b)(f)(g) |
|
|
|
1,682,000 |
|
|
|
1,459,270 |
|
| Nationwide Building Society, 5.75% to 6/20/27 (United Kingdom)(f)(g)(h)(i) |
|
|
|
1,000,000 |
|
|
|
1,178,708 |
|
See accompanying notes to consolidated financial statements.
17
COHEN
& STEERS REIT AND
PREFERRED AND INCOME FUND, INC.
CONSOLIDATED SCHEDULE OF INVESTMENTS—(Continued)
December 31, 2023
|
|
|
|
|
|
|
|
|
|
|
|
|
| |
|
|
|
|
Principal
Amount |
|
|
Value |
|
|
|
|
|
|
|
|
|
|
|
|
|
|
| NatWest Group PLC, 6.00% to 12/29/25 (United Kingdom)(b)(f)(g)(h) |
|
|
$
|
5,800,000 |
|
|
$
|
5,621,988 |
|
| NatWest Group PLC, 8.00% to 8/10/25 (United Kingdom)(b)(f)(g)(h) |
|
|
|
3,500,000 |
|
|
|
3,514,892 |
|
| Nordea Bank Abp, 6.625% to 3/26/26 (Finland)(b)(f)(g)(h)(j) |
|
|
|
2,070,000 |
|
|
|
2,057,029 |
|
| PNC Financial Services Group, Inc., 6.00% to 5/15/27, Series U(b)(f)(g) |
|
|
|
4,401,000 |
|
|
|
4,178,807 |
|
| PNC Financial Services Group, Inc., 6.20% to 9/15/27, Series V(b)(f)(g) |
|
|
|
3,973,000 |
|
|
|
3,872,634 |
|
| PNC Financial Services Group, Inc., 6.25% to 3/15/30, Series W(f)(g) |
|
|
|
4,615,000 |
|
|
|
4,313,491 |
|
| Regions Financial Corp., 5.75% to 6/15/25, Series D(b)(f)(g) |
|
|
|
1,472,000 |
|
|
|
1,430,760 |
|
| Skandinaviska Enskilda Banken AB, 6.875% to 6/30/27 (Sweden)(f)(g)(h)(i) |
|
|
|
1,200,000 |
|
|
|
1,181,988 |
|
| Societe Generale SA, 5.375% to 11/18/30 (France)(b)(f)(g)(h)(j) |
|
|
|
3,000,000 |
|
|
|
2,461,899 |
|
| Societe Generale SA, 6.75% to 4/6/28 (France)(b)(f)(g)(h)(j) |
|
|
|
1,600,000 |
|
|
|
1,432,940 |
|
| Societe Generale SA, 8.00% to 9/29/25 (France)(b)(f)(g)(h)(j) |
|
|
|
3,400,000 |
|
|
|
3,399,598 |
|
| Societe Generale SA, 9.375% to 11/22/27 (France)(f)(g)(h)(j) |
|
|
|
5,200,000 |
|
|
|
5,452,814 |
|
| Societe Generale SA, 10.00% to 11/14/28 (France)(f)(g)(h)(j) |
|
|
|
2,000,000 |
|
|
|
2,142,028 |
|
| Toronto-Dominion Bank, 8.125% to 10/31/27, due 10/31/82 (Canada)(g) |
|
|
|
5,600,000 |
|
|
|
5,842,418 |
|
| Truist Financial Corp., 4.95% to 9/1/25, Series P(b)(f)(g) |
|
|
|
1,898,000 |
|
|
|
1,820,918 |
|
| Truist Financial Corp., 5.10% to 3/1/30, Series Q(b)(f)(g) |
|
|
|
3,030,000 |
|
|
|
2,760,950 |
|
| Truist Financial Corp., 5.125% to 12/15/27, Series H(a)(b)(f)(g) |
|
|
|
2,460,000 |
|
|
|
2,079,202 |
|
| UBS Group AG, 4.375% to 2/10/31 (Switzerland)(b)(f)(g)(h)(j) |
|
|
|
1,800,000 |
|
|
|
1,426,102 |
|
| UBS Group AG, 4.875% to 2/12/27 (Switzerland)(b)(f)(g)(h)(j) |
|
|
|
2,200,000 |
|
|
|
1,987,089 |
|
| UBS Group AG, 5.125% to 7/29/26 (Switzerland)(f)(g)(h)(i) |
|
|
|
1,800,000 |
|
|
|
1,706,589 |
|
| UBS Group AG, 6.875% to 8/7/25 (Switzerland)(f)(g)(h)(i) |
|
|
|
4,200,000 |
|
|
|
4,140,276 |
|
| UBS Group AG, 9.25% to 11/13/28 (Switzerland)(f)(g)(h)(j) |
|
|
|
3,400,000 |
|
|
|
3,676,342 |
|
| UBS Group AG, 9.25% to 11/13/33 (Switzerland)(f)(g)(h)(j) |
|
|
|
5,000,000 |
|
|
|
5,553,825 |
|
| U.S. Bancorp, 3.70% to 1/15/27, Series N(b)(f)(g) |
|
|
|
1,878,000 |
|
|
|
1,478,971 |
|
| U.S. Bancorp, 5.30% to 4/15/27, Series J(b)(f)(g) |
|
|
|
1,535,000 |
|
|
|
1,380,779 |
|
| Wells Fargo & Co., 3.90% to 3/15/26, Series BB(b)(f)(g) |
|
|
|
11,740,000 |
|
|
|
10,854,588 |
|
| Wells Fargo & Co., 5.875% to 6/15/25, Series U(b)(f)(g) |
|
|
|
1,732,000 |
|
|
|
1,718,276 |
|
| Wells Fargo & Co., 5.95%, due 12/15/36(a)(b) |
|
|
|
2,969,000 |
|
|
|
3,015,466 |
|
See accompanying notes to consolidated financial statements.
18
COHEN
& STEERS REIT AND
PREFERRED AND INCOME FUND, INC.
CONSOLIDATED SCHEDULE OF INVESTMENTS—(Continued)
December 31, 2023
|
|
|
|
|
|
|
|
|
|
|
|
|
| |
|
|
|
|
Principal
Amount |
|
|
Value |
|
|
|
|
|
|
|
|
|
|
|
|
|
|
| Wells Fargo & Co., 7.625% to 9/15/28(f)(g) |
|
|
$
|
5,080,000 |
|
|
$
|
5,343,200 |
|
|
|
|
|
|
|
|
|
|
|
|
|
|
|
|
|
|
|
|
|
|
333,977,192 |
|
|
|
|
|
|
|
|
|
|
|
|
|
|
| BROKERAGE |
|
|
0.6% |
|
|
|
|
|
|
|
|
|
| Goldman Sachs Capital I, 6.345%, due 2/15/34 (TruPS) |
|
|
|
3,042,000 |
|
|
|
3,202,804 |
|
| Goldman Sachs Group, Inc., 7.50% to 2/10/29, Series W(f)(g) |
|
|
|
2,551,000 |
|
|
|
2,671,902 |
|
|
|
|
|
|
|
|
|
|
|
|
|
|
|
|
|
|
|
|
|
|
5,874,706 |
|
|
|
|
|
|
|
|
|
|
|
|
|
|
| CONSUMER STAPLE PRODUCTS |
|
|
0.8% |
|
|
|
|
|
|
|
|
|
| Dairy Farmers of America, Inc., 7.875%(b)(f)(j)(m) |
|
|
|
82,000 |
† |
|
|
7,831,000 |
|
|
|
|
|
|
|
|
|
|
|
|
|
|
| ENERGY |
|
|
0.8% |
|
|
|
|
|
|
|
|
|
| BP Capital Markets PLC, 4.375% to 6/22/25 (United Kingdom)(b)(f)(g) |
|
|
|
1,350,000 |
|
|
|
1,320,321 |
|
| BP Capital Markets PLC, 4.875% to 3/22/30, due (United Kingdom)(b)(f)(g) |
|
|
|
7,450,000 |
|
|
|
7,099,273 |
|
|
|
|
|
|
|
|
|
|
|
|
|
|
|
|
|
|
|
|
|
|
8,419,594 |
|
|
|
|
|
|
|
|
|
|
|
|
|
|
| FINANCE |
|
|
0.6% |
|
|
|
|
|
|
|
|
|
| American Express Co., 3.55% to 9/15/26, Series D(b)(f)(g) |
|
|
|
2,572,000 |
|
|
|
2,211,406 |
|
| Apollo Management Holdings LP, 4.95% to 12/17/24, due 1/14/50(a)(b)(g)(j) |
|
|
|
1,424,000 |
|
|
|
1,348,542 |
|
| ARES Finance Co. III LLC, 4.125% to 6/30/26, due 6/30/51(b)(g)(j) |
|
|
|
2,365,000 |
|
|
|
2,016,064 |
|
| PNC Financial Services Group, Inc., 3.40% to 9/15/26, Series T(f)(g) |
|
|
|
742,000 |
|
|
|
595,399 |
|
|
|
|
|
|
|
|
|
|
|
|
|
|
|
|
|
|
|
|
|
|
6,171,411 |
|
|
|
|
|
|
|
|
|
|
|
|
|
|
| INSURANCE |
|
|
7.6% |
|
|
|
|
|
|
|
|
|
| Aegon Ltd., 5.50% to 4/11/28, due 4/11/48 (Netherlands)(b)(g) |
|
|
|
800,000 |
|
|
|
761,601 |
|
| Allianz SE, 3.50% to 11/17/25 (Germany)(b)(f)(g)(h)(j) |
|
|
|
1,400,000 |
|
|
|
1,244,825 |
|
| Allianz SE, 6.35% to 3/6/33, due 9/6/53 (Germany)(b)(g)(j) |
|
|
|
2,000,000 |
|
|
|
2,078,680 |
|
| American International Group, Inc., 5.75% to 4/1/28, due 4/1/48, Series A-9(g) |
|
|
|
200,000 |
|
|
|
197,347 |
|
| Assurant, Inc., 7.00% to 3/27/28, due 3/27/48(b)(g) |
|
|
|
2,900,000 |
|
|
|
2,929,050 |
|
| Athora Netherlands NV, 7.00% to 6/19/25 (Netherlands) (EUR)(f)(g)(h)(i) |
|
|
|
1,600,000 |
|
|
|
1,730,676 |
|
| AXIS Specialty Finance LLC, 4.90% to 1/15/30, due 1/15/40(b)(g) |
|
|
|
1,475,000 |
|
|
|
1,230,262 |
|
See accompanying notes to consolidated financial statements.
19
COHEN
& STEERS REIT AND
PREFERRED AND INCOME FUND, INC.
CONSOLIDATED SCHEDULE OF INVESTMENTS—(Continued)
December 31, 2023
|
|
|
|
|
|
|
|
|
|
|
|
|
| |
|
|
|
|
Principal
Amount |
|
|
Value |
|
|
|
|
|
|
|
|
|
|
|
|
|
|
| Corebridge Financial, Inc., 6.875% to 9/15/27, due 12/15/52(g) |
|
|
$
|
4,070,000 |
|
|
$
|
4,061,692 |
|
| Enstar Finance LLC, 5.50% to 1/15/27, due 1/15/42(b)(g) |
|
|
|
2,975,000 |
|
|
|
2,525,374 |
|
| Enstar Finance LLC, 5.75% to 9/1/25, due 9/1/40(a)(b)(g) |
|
|
|
2,484,000 |
|
|
|
2,330,193 |
|
| Equitable Holdings, Inc., 4.95% to 9/15/25, Series B(b)(f)(g) |
|
|
|
2,565,000 |
|
|
|
2,447,187 |
|
| Global Atlantic Fin Co., 4.70% to 7/15/26, due 10/15/51(b)(g)(j) |
|
|
|
3,582,000 |
|
|
|
3,073,615 |
|
| Hartford Financial Services Group, Inc., 7.766% (3 Month USD Term SOFR +
2.387%), due 2/12/47, Series ICON(b)(j)(l) |
|
|
|
2,200,000 |
|
|
|
1,890,343 |
|
| ILFC E-Capital Trust I, 7.186% (3
Month USD Term SOFR + 1.812%), due 12/21/65 (TruPS)(b)(j)(l) |
|
|
|
1,483,000 |
|
|
|
1,103,915 |
|
| Liberty Mutual Group, Inc., 4.125% to 9/15/26, due 12/15/51(b)(g)(j) |
|
|
|
2,346,000 |
|
|
|
1,970,300 |
|
| Lincoln National Corp., 9.25% to 12/1/27, Series C(b)(f)(g) |
|
|
|
1,395,000 |
|
|
|
1,526,032 |
|
| Markel Group, Inc., 6.00% to 6/1/25 (b)(f)(g) |
|
|
|
1,195,000 |
|
|
|
1,182,988 |
|
| MetLife Capital Trust IV, 7.875%, due 12/15/37 (TruPS)(a)(b)(j) |
|
|
|
3,181,000 |
|
|
|
3,424,593 |
|
| MetLife, Inc., 9.25%, due 4/8/38(a)(b)(j) |
|
|
|
7,665,000 |
|
|
|
8,618,606 |
|
| MetLife, Inc., 10.75%, due 8/1/39(a)(b) |
|
|
|
3,592,000 |
|
|
|
4,812,411 |
|
| Muenchener Rueckversicherungs-Gesellschaft AG in Muenchen, 5.875% to
11/23/31, due 5/23/42 (Germany)(b)(g)(j) |
|
|
|
1,400,000 |
|
|
|
1,407,000 |
|
| Nippon Life Insurance Co., 6.25% to 9/13/33, due 9/13/53 (Japan)(g)(j) |
|
|
|
986,000 |
|
|
|
1,035,417 |
|
| Phoenix Group Holdings PLC, 5.625% to 1/29/25 (United Kingdom)(f)(g)(h)(i) |
|
|
|
1,200,000 |
|
|
|
1,146,000 |
|
| Prudential Financial, Inc., 5.125% to 11/28/31, due 3/1/52(a)(b)(g) |
|
|
|
2,536,000 |
|
|
|
2,389,535 |
|
| Prudential Financial, Inc., 6.00% to 6/1/32, due 9/1/52(b)(g) |
|
|
|
3,790,000 |
|
|
|
3,781,228 |
|
| Prudential Financial, Inc., 6.75% to 12/1/32, due 3/1/53(b)(g) |
|
|
|
1,520,000 |
|
|
|
1,587,506 |
|
| QBE Insurance Group Ltd., 5.875% to 6/17/26, due 6/17/46, Series EMTN
(Australia)(g)(i) |
|
|
|
3,000,000 |
|
|
|
2,944,933 |
|
| QBE Insurance Group Ltd., 5.875% to 5/12/25 (Australia)(b)(f)(g)(j) |
|
|
|
4,200,000 |
|
|
|
4,102,523 |
|
| Rothesay Life PLC, 4.875% to 4/13/27, Series NC6 (United Kingdom)(f)(g)(h)(i) |
|
|
|
1,700,000 |
|
|
|
1,371,475 |
|
See accompanying notes to consolidated financial statements.
20
COHEN
& STEERS REIT AND
PREFERRED AND INCOME FUND, INC.
CONSOLIDATED SCHEDULE OF INVESTMENTS—(Continued)
December 31, 2023
|
|
|
|
|
|
|
|
|
|
|
|
|
| |
|
|
|
|
Principal
Amount |
|
|
Value |
|
|
|
|
|
|
|
|
|
|
|
|
|
|
| SBL Holdings, Inc., 6.50% to 11/13/26 (b)(f)(g)(j) |
|
|
$
|
3,120,000 |
|
|
$
|
1,926,600 |
|
| SBL Holdings, Inc., 7.00% to 5/13/25 (b)(f)(g)(j) |
|
|
|
2,100,000 |
|
|
|
1,398,270 |
|
| Zurich Finance Ireland Designated Activity Co., 3.00% to 1/19/31, due
4/19/51, Series EMTN (Switzerland)(g)(i) |
|
|
|
3,300,000 |
|
|
|
2,687,025 |
|
|
|
|
|
|
|
|
|
|
|
|
|
|
|
|
|
|
|
74,917,202 |
|
|
|
|
|
|
|
|
|
|
|
| PIPELINES |
|
|
5.2% |
|
|
|
|
|
|
|
|
|
| Enbridge, Inc., 5.50% to 7/15/27, due 7/15/77, Series 2017-A (Canada)(g) |
|
|
|
780,000 |
|
|
|
714,327 |
|
| Enbridge, Inc., 5.75% to 4/15/30, due 7/15/80, Series 20-A (Canada)(b)(g) |
|
|
|
4,020,000 |
|
|
|
3,715,786 |
|
| Enbridge, Inc., 6.00% to 1/15/27, due 1/15/77, Series 16-A (Canada)(b)(g) |
|
|
|
4,012,000 |
|
|
|
3,815,531 |
|
| Enbridge, Inc., 6.25% to 3/1/28, due 3/1/78 (Canada)(b)(g) |
|
|
|
5,330,000 |
|
|
|
4,936,027 |
|
| Enbridge, Inc., 7.375% to 10/15/27, due 1/15/83 (Canada)(b)(g) |
|
|
|
1,914,000 |
|
|
|
1,886,922 |
|
| Enbridge, Inc., 7.625% to 10/15/32, due 1/15/83 (Canada)(g) |
|
|
|
4,056,000 |
|
|
|
4,072,301 |
|
| Enbridge, Inc., 8.25% to 10/15/28, due 1/15/84, Series NC5 (Canada)(g) |
|
|
|
3,780,000 |
|
|
|
3,909,756 |
|
| Enbridge, Inc., 8.50% to 10/15/33, due 1/15/84 (Canada)(g) |
|
|
|
4,470,000 |
|
|
|
4,765,673 |
|
| Energy Transfer LP, 6.50% to 11/15/26 , Series H(b)(f)(g) |
|
|
|
2,170,000 |
|
|
|
2,067,533 |
|
| Energy Transfer LP, 7.125% to 5/15/30 , Series G(b)(f)(g) |
|
|
|
3,050,000 |
|
|
|
2,818,135 |
|
| Transcanada Trust, 5.50% to 9/15/29, due 9/15/79 (Canada)(b)(g) |
|
|
|
9,764,000 |
|
|
|
8,365,118 |
|
| Transcanada Trust, 5.60% to 12/7/31, due 3/7/82 (Canada)(b)(g) |
|
|
|
4,842,000 |
|
|
|
4,062,406 |
|
| Transcanada Trust, 5.875% to 8/15/26, due 8/15/76, Series 16-A (Canada)(a)(b)(g) |
|
|
|
7,225,000 |
|
|
|
6,847,696 |
|
|
|
|
|
|
|
|
|
|
|
|
|
|
|
|
|
|
|
51,977,211 |
|
|
|
|
|
|
|
|
|
|
|
| RETAIL &
WHOLESALE—STAPLES |
|
|
0.2% |
|
|
|
|
|
|
|
|
|
| Land O’ Lakes, Inc., 7.00% (b)(f)(j) |
|
|
|
1,650,000 |
|
|
|
1,237,500 |
|
| Land O’ Lakes, Inc., 7.25% (a)(b)(f)(j) |
|
|
|
945,000 |
|
|
|
741,825 |
|
|
|
|
|
|
|
|
|
|
|
|
|
|
|
|
|
|
|
1,979,325 |
|
|
|
|
|
|
|
|
|
|
|
See accompanying notes to consolidated financial statements.
21
COHEN
& STEERS REIT AND
PREFERRED AND INCOME FUND, INC.
CONSOLIDATED SCHEDULE OF INVESTMENTS—(Continued)
December 31, 2023
|
|
|
|
|
|
|
|
|
|
|
|
|
| |
|
|
|
|
Principal
Amount |
|
|
Value |
|
|
|
|
|
|
|
|
|
|
|
|
|
|
| SHOPPING CENTER |
|
|
0.7% |
|
|
|
|
|
|
|
|
|
| Scentre Group Trust 2, 4.75% to 6/24/26, due 9/24/80 (Australia)(g)(j) |
|
|
$
|
4,995,000 |
|
|
$
|
4,683,478 |
|
| Scentre Group Trust 2, 5.125% to 6/24/30, due 9/24/80 (Australia)(g)(j) |
|
|
|
2,300,000 |
|
|
|
2,054,122 |
|
|
|
|
|
|
|
|
|
|
|
|
|
|
|
|
|
|
|
6,737,600 |
|
|
|
|
|
|
|
|
|
|
|
| TELECOMMUNICATION SERVICES |
|
|
0.5% |
|
|
|
|
|
|
|
|
|
| Telefonica Europe BV, 6.135% to 2/3/30 (Spain)(f)(g)(i) |
|
|
|
1,200,000 |
|
|
|
1,365,403 |
|
| Vodafone Group PLC, 4.125% to 3/4/31, due 6/4/81 (United Kingdom)(g) |
|
|
|
4,290,000 |
|
|
|
3,699,078 |
|
|
|
|
|
|
|
|
|
|
|
|
|
|
|
|
|
|
|
5,064,481 |
|
|
|
|
|
|
|
|
|
|
|
| UTILITIES |
|
|
5.1% |
|
|
|
|
|
|
|
|
|
| Algonquin Power & Utilities Corp., 4.75% to 1/18/27, due 1/18/82
(Canada)(b)(g) |
|
|
|
4,368,000 |
|
|
|
3,695,918 |
|
| American Electric Power Co., Inc., 3.875% to 11/15/26, due 2/15/62(b)(g) |
|
|
|
2,670,000 |
|
|
|
2,254,219 |
|
| CMS Energy Corp., 4.75% to 3/1/30, due 6/1/50(b)(g) |
|
|
|
1,600,000 |
|
|
|
1,448,889 |
|
| Dominion Energy, Inc., 4.35% to 1/15/27, Series C(f)(g) |
|
|
|
4,987,000 |
|
|
|
4,446,985 |
|
| Edison International, 5.00% to 12/15/26, Series B(f)(g) |
|
|
|
1,497,000 |
|
|
|
1,397,604 |
|
| Edison International, 5.375% to 3/15/26, Series A(b)(f)(g) |
|
|
|
3,860,000 |
|
|
|
3,660,433 |
|
| Edison International, 7.875% to 3/15/29, due 6/15/54(g) |
|
|
|
2,140,000 |
|
|
|
2,161,400 |
|
| Electricite de France SA, 7.50% to 9/6/28, Series EMTN (France)(f)(g)(i) |
|
|
|
1,800,000 |
|
|
|
2,174,312 |
|
| Electricite de France SA, 9.125% to 3/15/33 (France)(b)(f)(g)(j) |
|
|
|
1,800,000 |
|
|
|
2,014,042 |
|
| Emera, Inc., 6.75% to 6/15/26, due 6/15/76, Series 16-A (Canada)(g) |
|
|
|
9,362,000 |
|
|
|
9,202,559 |
|
| Enel SpA, 6.625% to 4/16/31 , Series EMTN (Italy)(f)(g)(i) |
|
|
|
1,000,000 |
|
|
|
1,177,341 |
|
| NextEra Energy Capital Holdings, Inc., 3.80% to 3/15/27, due 3/15/82(b)(g) |
|
|
|
1,382,000 |
|
|
|
1,177,495 |
|
| NextEra Energy Capital Holdings, Inc., 5.65% to 5/1/29, due 5/1/79(a)(b)(g) |
|
|
|
2,407,000 |
|
|
|
2,270,645 |
|
| Sempra, 4.125% to 1/1/27, due 4/1/52(b)(g) |
|
|
|
3,360,000 |
|
|
|
2,900,247 |
|
| Sempra, 4.875% to 10/15/25
(a)(b)(f)(g) |
|
|
|
6,430,000 |
|
|
|
6,306,304 |
|
| Southern California Edison Co., 9.838% (3 Month USD Term SOFR + 4.461%),
Series E(b)(f)(l) |
|
|
|
1,900,000 |
|
|
|
1,912,311 |
|
See accompanying notes to consolidated financial statements.
22
COHEN
& STEERS REIT AND
PREFERRED AND INCOME FUND, INC.
CONSOLIDATED SCHEDULE OF INVESTMENTS—(Continued)
December 31, 2023
|
|
|
|
|
|
|
|
|
|
|
|
|
| |
|
|
|
|
Principal
Amount |
|
|
Value |
|
|
|
|
|
|
|
|
|
|
|
|
|
|
| Southern Co., 3.75% to 6/15/26, due 9/15/51, Series 21-A(g) |
|
|
$
|
2,336,000 |
|
|
$
|
2,132,786 |
|
|
|
|
|
|
|
|
|
|
|
|
|
|
|
|
|
|
|
50,333,490 |
|
|
|
|
|
|
|
|
|
|
|
| TOTAL PREFERRED
SECURITIES—OVER-THE-COUNTER
(Identified cost—$565,505,755) |
|
|
|
|
|
|
|
553,283,212 |
|
|
|
|
|
|
|
|
|
|
|
|
|
|
|
|
|
| |
|
|
Ownership%* |
|
|
|
|
| PRIVATE REAL
ESTATE—OFFICE |
|
|
1.3% |
|
|
|
|
|
|
|
|
|
| Legacy Gateway JV LLC, Plano, TX(m) |
|
|
|
33.6% |
|
|
|
13,053,225 |
|
|
|
|
|
|
|
|
|
|
|
| TOTAL PRIVATE REAL
ESTATE
(Identified cost—$14,071,976) |
|
|
|
|
|
|
|
13,053,225 |
|
|
|
|
|
|
|
|
|
|
|
|
|
|
| |
|
|
Shares |
|
|
|
|
| SHORT-TERM INVESTMENTS |
|
|
0.9% |
|
|
|
|
|
|
|
|
|
| MONEY MARKET
FUNDS |
|
|
|
|
|
|
|
|
|
| State Street Institutional Treasury Plus Money Market Fund, Premier Class,
5.31%(n) |
|
|
|
6,518,176 |
|
|
|
6,518,176 |
|
| State Street Institutional U.S. Government Money Market Fund, Premier
Class, 5.32%(n) |
|
|
|
2,020,000 |
|
|
|
2,020,000 |
|
|
|
|
|
|
|
|
|
|
|
| TOTAL SHORT-TERM
INVESTMENTS
(Identified cost—$8,538,176) |
|
|
|
|
|
|
|
8,538,176 |
|
|
|
|
|
|
|
|
|
|
|
| TOTAL INVESTMENTS IN
SECURITIES
(Identified cost—$1,261,661,356) |
|
|
143.7% |
|
|
|
|
|
|
|
1,425,700,396 |
|
| WRITTEN OPTION CONTRACTS
(Premiums
received—$173,104) |
|
|
(0.1) |
|
|
|
|
|
|
|
(584,969 |
) |
| LIABILITIES IN EXCESS OF
OTHER ASSETS |
|
|
(43.6) |
|
|
|
|
|
|
|
(432,877,506 |
) |
| SERIES A CUMULATIVE PREFERRED
STOCK, AT LIQUIDATION VALUE |
|
|
(0.0) |
|
|
|
|
|
|
|
(125,000 |
) |
|
|
|
|
|
|
|
|
|
|
|
|
|
| NET ASSETS (Equivalent to $20.77 per share based on
47,759,789 shares of common stock outstanding) |
|
|
100.0% |
|
|
|
|
|
|
$ |
992,112,921 |
|
|
|
|
|
|
|
|
|
|
|
|
|
|
See accompanying notes to
consolidated financial statements.
23
COHEN
& STEERS REIT AND
PREFERRED AND INCOME FUND, INC.
CONSOLIDATED SCHEDULE OF INVESTMENTS—(Continued)
December 31, 2023
Exchange-Traded Option Contracts
Written Options
|
|
|
|
|
|
|
|
|
|
|
|
|
|
|
|
|
|
|
|
|
|
|
|
|
| |
|
|
|
|
|
|
| Description |
|
Exercise
Price |
|
|
Expiration
Date |
|
|
Number of
Contracts |
|
|
Notional
Amount(o) |
|
|
Premiums
Received |
|
|
Value |
|
| Call—American Tower Corp. |
|
$ |
220.00 |
|
|
|
1/19/24 |
|
|
|
(87 |
) |
|
$ |
(1,878,156 |
) |
|
$ |
(19,801 |
) |
|
$ |
(22,620 |
) |
| Call—Public Storage |
|
|
270.00 |
|
|
|
1/19/24 |
|
|
|
(68 |
) |
|
|
(2,074,000 |
) |
|
|
(20,086 |
) |
|
|
(245,170 |
) |
| Call—Simon Property Group, Inc. |
|
|
135.00 |
|
|
|
1/19/24 |
|
|
|
(139 |
) |
|
|
(1,982,696 |
) |
|
|
(19,325 |
) |
|
|
(124,405 |
) |
| Call—Digital Realty Trust, Inc. |
|
|
145.00 |
|
|
|
2/16/24 |
|
|
|
(139 |
) |
|
|
(1,870,662 |
) |
|
|
(34,553 |
) |
|
|
(27,800 |
) |
| Call—Prologis, Inc. |
|
|
130.00 |
|
|
|
2/16/24 |
|
|
|
(154 |
) |
|
|
(2,052,820 |
) |
|
|
(18,107 |
) |
|
|
(110,880 |
) |
| Call—Sun Communities, Inc. |
|
|
145.00 |
|
|
|
2/16/24 |
|
|
|
(90 |
) |
|
|
(1,202,850 |
) |
|
|
(13,800 |
) |
|
|
(11,443 |
) |
| Call—Welltower, Inc. |
|
|
95.00 |
|
|
|
3/15/24 |
|
|
|
(217 |
) |
|
|
(1,956,689 |
) |
|
|
(47,432 |
) |
|
|
(42,651 |
) |
| |
|
|
|
|
|
|
|
|
|
|
|
|
(894 |
) |
|
$ |
(13,017,873 |
) |
|
$ |
(173,104 |
) |
|
$ |
(584,969 |
) |
| |
|
Centrally Cleared Interest Rate Swap Contracts
|
|
|
|
|
|
|
|
|
|
|
|
|
|
|
|
|
|
|
|
|
|
|
|
|
|
|
|
|
| |
|
|
|
|
|
|
|
|
Notional
Amount |
|
|
Fixed
Rate
Payable |
|
|
Fixed
Payment
Frequency |
|
Floating
Rate
Receivable
(resets
monthly) |
|
Floating
Payment
Frequency |
|
|
Maturity Date |
|
Value |
|
|
Upfront
Receipts
(Payments) |
|
|
Unrealized
Appreciation
(Depreciation) |
|
| |
$105,000,000 |
|
|
|
0.670% |
|
|
Monthly |
|
5.514%(p) |
|
|
Monthly |
|
|
9/15/25 |
|
$ |
6,549,111 |
|
|
$ |
16,828 |
|
|
$ |
6,565,939 |
|
| |
87,500,000 |
|
|
|
1.240% |
|
|
Monthly |
|
5.400%(p) |
|
|
Monthly |
|
|
2/3/26 |
|
|
5,320,680 |
|
|
|
2,579 |
|
|
|
5,323,259 |
|
| |
65,000,000 |
|
|
|
0.762% |
|
|
Monthly |
|
5.514%(p) |
|
|
Monthly |
|
|
9/15/26 |
|
|
5,381,848 |
|
|
|
12,575 |
|
|
|
5,394,423 |
|
| |
105,000,000 |
|
|
|
1.237% |
|
|
Monthly |
|
5.514%(p) |
|
|
Monthly |
|
|
9/15/27 |
|
|
9,226,626 |
|
|
|
20,922 |
|
|
|
9,247,548 |
|
|
|
|
|
|
|
|
|
|
|
|
|
|
|
|
|
|
|
$ |
26,478,265 |
|
|
$ |
52,904 |
|
|
$ |
26,531,169 |
|
| |
|
|
The total amount of all interest rate swap contracts as presented in the table above is representative of the
volume of activity for this derivative type during the year ended December 31, 2023.
See accompanying notes to consolidated financial statements.
24
COHEN
& STEERS REIT AND
PREFERRED AND INCOME FUND, INC.
CONSOLIDATED SCHEDULE OF INVESTMENTS—(Continued)
December 31, 2023
Over-the-Counter Total Return Swap Contracts
|
|
|
|
|
|
|
|
|
|
|
|
|
|
|
|
|
|
|
|
|
|
|
|
|
|
|
|
|
|
|
|
|
|
|
| |
|
|
|
|
|
|
|
|
|
| Counterparty |
|
Notional
Amount |
|
|
Fixed
Payable
Rate |
|
Fixed
Payment
Frequency |
|
|
Underlying
Reference
Entity |
|
Position |
|
|
Maturity
Date |
|
|
Value |
|
|
Premiums
Paid |
|
|
Unrealized
Appreciation
(Depreciation) |
|
| BNP Paribas |
|
$ |
|
|
6,166,292 |
|
|
0.25% |
|
|
Monthly |
|
|
BNPXCHY5
Index(q) |
|
|
Short |
|
|
|
5/15/24 |
|
|
$ |
(48,993 |
) |
|
$ |
— |
|
|
$ |
(48,993 |
) |
| BNP Paribas |
|
EUR |
|
|
5,709,537 |
|
|
0.30% |
|
|
Monthly |
|
|
BNPXCEX5
Index(r) |
|
|
Short |
|
|
|
5/15/24 |
|
|
|
(60,912 |
) |
|
|
— |
|
|
|
(60,912 |
) |
|
|
|
$ |
(109,905 |
) |
|
$ |
— |
|
|
$ |
(109,905 |
) |
| |
|
Forward Foreign Currency Exchange Contracts
|
|
|
|
|
|
|
|
|
|
|
|
|
|
|
|
|
|
|
|
|
| |
|
|
|
|
| Counterparty |
|
Contracts to
Deliver |
|
|
In Exchange
For |
|
|
Settlement
Date |
|
|
Unrealized
Appreciation
(Depreciation) |
|
| Brown Brothers Harriman |
|
EUR |
|
|
26,894,279 |
|
|
USD |
|
|
29,331,277 |
|
|
|
1/3/24 |
|
|
$ |
(358,666 |
) |
| Brown Brothers Harriman |
|
GBP |
|
|
3,644,964 |
|
|
USD |
|
|
4,600,455 |
|
|
|
1/3/24 |
|
|
|
(45,599 |
) |
| Brown Brothers Harriman |
|
USD |
|
|
29,705,807 |
|
|
EUR |
|
|
26,894,279 |
|
|
|
1/3/24 |
|
|
|
(15,864 |
) |
| Brown Brothers Harriman |
|
USD |
|
|
4,646,126 |
|
|
GBP |
|
|
3,644,964 |
|
|
|
1/3/24 |
|
|
|
(72 |
) |
| Brown Brothers Harriman |
|
EUR |
|
|
26,677,679 |
|
|
USD |
|
|
29,498,577 |
|
|
|
2/2/24 |
|
|
|
13,161 |
|
| Brown Brothers Harriman |
|
GBP |
|
|
3,708,489 |
|
|
USD |
|
|
4,727,470 |
|
|
|
2/2/24 |
|
|
|
(324 |
) |
|
|
|
|
|
|
|
|
|
|
|
|
|
|
|
|
|
|
$ |
(407,364 |
) |
| |
|
Glossary of Portfolio Abbreviations
|
|
|
| EMTN |
|
Euro Medium Term Note |
| ETF |
|
Exchange-Traded Fund |
| EUR |
|
Euro Currency |
| GBP |
|
British Pound |
| ICON |
|
Indexed Currency Option Note |
| OIS |
|
Overnight Indexed Swap |
| REIT |
|
Real Estate Investment Trust |
| SOFR |
|
Secured Overnight Financing Rate |
| TruPS |
|
Trust Preferred Securities |
| USD |
|
United States Dollar |
See accompanying notes
to consolidated financial statements.
25
COHEN
& STEERS REIT AND
PREFERRED AND INCOME FUND, INC.
CONSOLIDATED SCHEDULE OF INVESTMENTS—(Continued)
December 31, 2023
Note: Percentages indicated are
based on the net assets of the Fund.
| * |
Legacy Gateway JV LLC, owns a Class A office building located at 6860 N. Dallas Parkway,
Plano, Texas 75024. |
| (a) |
A portion of the security has been rehypothecated in connection with the Fund’s revolving
credit agreement. $410,191,832 in aggregate has been rehypothecated. |
| (b) |
All or a portion of the security is pledged as collateral in connection with the Fund’s
revolving credit agreement. $953,365,894 in aggregate has been pledged as collateral. |
| (c) |
All or a portion of the security is pledged in connection with written option contracts.
$12,957,122 in aggregate has been pledged as collateral. |
| (d) |
Non-income producing security. |
| (e) |
Restricted security. Aggregate holdings equal 0.7% of the net assets of the Fund. This security was
acquired on August 3, 2020, at a cost of $3,755,469. Security value is determined based on significant unobservable inputs (Level 3). |
| (f) |
Perpetual security. Perpetual securities have no stated maturity date, but
they may be called/redeemed by the issuer. |
| (g) |
Security converts to floating rate after the indicated fixed–rate coupon
period. |
| (h) |
Contingent Capital security (CoCo). CoCos are debt or preferred securities with loss absorption
characteristics built into the terms of the security for the benefit of the issuer. Aggregate holdings amounted to $173,160,694 which represents 17.5% of the net assets of the Fund (12.0% of the managed assets of the Fund).
|
| (i) |
Securities exempt from registration under Regulation S of the Securities Act of 1933. These
securities are subject to resale restrictions. Aggregate holdings amounted to $53,393,007 which represents 5.4% of the net assets of the Fund, of which 0.0% are illiquid. |
| (j) |
Securities exempt from registration under Rule 144A of the Securities Act of 1933. These securities
may only be resold to qualified institutional buyers. Aggregate holdings amounted to $133,830,304 which represents 13.5% of the net assets of the Fund, of which 0.3% are illiquid. |
| (k) |
Security is in default. |
| (l) |
Variable rate. Rate shown is in effect at December 31, 2023. |
| (m) |
Security value is determined based on significant unobservable inputs (Level 3).
|
| (n) |
Rate quoted represents the annualized seven-day yield.
|
| (o) |
Represents number of contracts multiplied by notional contract size multiplied by the underlying
price. |
| (p) |
Based on
USD-SOFR-OIS. Represents rates in effect at December 31, 2023. |
| (q) |
The index intends to track the performance of the CDX.NA HY. |
| (r) |
The index intends to track the performance of the iTraxx Crossover CDS.
|
See accompanying notes to
consolidated financial statements.
26
COHEN
& STEERS REIT AND
PREFERRED AND INCOME FUND, INC.
CONSOLIDATED STATEMENT OF ASSETS AND LIABILITIES
December 31, 2023
|
|
|
|
|
| ASSETS: |
|
|
|
|
| Investments in securities, at
value(a) (Identified cost—$1,261,661,356) |
|
$ |
1,425,700,396 |
|
| Cash |
|
|
911,900 |
|
| Cash collateral pledged for interest rate swap contracts |
|
|
6,699,492 |
|
| Cash collateral pledged for total return swap contracts |
|
|
30,000 |
|
| Foreign currency, at value (Identified cost—$235,562) |
|
|
235,250 |
|
| Receivable for: |
|
|
|
|
| Dividends and interest |
|
|
11,626,244 |
|
| Investment securities sold |
|
|
4,107,469 |
|
| Unrealized appreciation on forward foreign currency exchange contracts |
|
|
13,161 |
|
| Other assets |
|
|
9,882 |
|
|
|
|
|
|
| Total Assets |
|
|
1,449,333,794 |
|
|
|
|
|
|
| LIABILITIES: |
|
|
|
|
| Written option contracts, at value (Premiums received—$173,104) |
|
|
584,969 |
|
| Total return swap contracts, at value |
|
|
109,905 |
|
| Unrealized depreciation on forward foreign currency exchange contracts |
|
|
420,525 |
|
| Payable for: |
|
|
|
|
| Credit agreement |
|
|
450,000,000 |
|
| Interest expense |
|
|
2,415,125 |
|
| Investment securities purchased |
|
|
2,004,674 |
|
| Investment management fees |
|
|
784,292 |
|
| Dividends and distributions declared |
|
|
278,473 |
|
| Administration fees |
|
|
72,396 |
|
| Variation margin on interest rate swap contracts |
|
|
64,760 |
|
| Other liabilities |
|
|
360,754 |
|
|
|
|
|
|
| Total Liabilities |
|
|
457,095,873 |
|
|
|
|
|
|
| Series A Cumulative Preferred Stock (125 shares authorized and issued at $1,000 per
share) (Note 7) |
|
|
125,000 |
|
|
|
|
|
|
| TOTAL NET ASSETS APPLICABLE TO COMMON SHARES |
|
$ |
992,112,921 |
|
|
|
|
|
|
| NET ASSETS Applicable to Common Shareholders consist of: |
|
|
|
|
| Paid-in capital |
|
$ |
815,592,074 |
|
| Total distributable earnings/(accumulated loss) |
|
|
176,520,847 |
|
|
|
|
|
|
|
|
$ |
992,112,921 |
|
|
|
|
|
|
| NET ASSET VALUE PER COMMON SHARE: |
|
|
|
|
| ($992,112,921 ÷ 47,759,789 common shares outstanding) |
|
$ |
20.77 |
|
|
|
|
|
|
| MARKET PRICE PER COMMON SHARE |
|
$ |
20.16 |
|
|
|
|
|
|
| MARKET PRICE PREMIUM (DISCOUNT) TO NET ASSET VALUE PER
COMMON SHARE |
|
|
(2.94 |
)% |
|
|
|
|
|
| (a) |
Includes $953,365,894 pledged as collateral, of which $410,191,832 has been rehypothecated in
connection with the Fund’s credit agreement, as described in Note 9. |
See accompanying notes to consolidated financial statements.
27
COHEN
& STEERS REIT AND
PREFERRED AND INCOME FUND, INC.
CONSOLIDATED STATEMENT OF OPERATIONS
For the Year Ended December 31, 2023
|
|
|
|
|
| Investment Income: |
|
|
|
|
| Dividend income (net of $29,883 of foreign withholding tax) |
|
$ |
35,794,997 |
|
| Interest income |
|
|
34,527,972 |
|
| Rehypothecation income |
|
|
621,803 |
|
|
|
|
|
|
| Total Investment Income |
|
|
70,944,772 |
|
|
|
|
|
|
| Expenses: |
|
|
|
|
| Interest expense |
|
|
26,934,125 |
|
| Investment management fees |
|
|
9,051,559 |
|
| Administration fees |
|
|
968,377 |
|
| Shareholder reporting expenses |
|
|
522,531 |
|
| Custodian fees and expenses |
|
|
143,703 |
|
| Professional fees |
|
|
109,624 |
|
| Directors’ fees and expenses |
|
|
41,536 |
|
| Transfer agent fees and expenses |
|
|
28,197 |
|
| Miscellaneous |
|
|
101,777 |
|
|
|
|
|
|
| Total Expenses |
|
|
37,901,429 |
|
|
|
|
|
|
| Net Investment Income (Loss) |
|
|
33,043,343 |
|
|
|
|
|
|
| Net Realized and Unrealized Gain (Loss): |
|
|
|
|
| Net realized gain (loss) on: |
|
|
|
|
| Investments in securities |
|
|
(43,162,009 |
) |
| Written option contracts |
|
|
546,574 |
|
| Interest rate swap contracts |
|
|
14,745,594 |
|
| Total return swap contracts |
|
|
(836,755 |
) |
| Forward foreign currency exchange contracts |
|
|
(1,011,967 |
) |
| Foreign currency transactions |
|
|
76,197 |
|
|
|
|
|
|
| Net realized gain (loss) |
|
|
(29,642,366 |
) |
|
|
|
|
|
| Net change in unrealized appreciation (depreciation) on: |
|
|
|
|
| Investments in securities |
|
|
116,390,535 |
|
| Written option contracts |
|
|
(554,912 |
) |
| Interest rate swap contracts |
|
|
(9,545,782 |
) |
| Total return swap contracts |
|
|
(109,905 |
) |
| Forward foreign currency exchange contracts |
|
|
322,566 |
|
| Foreign currency translations |
|
|
4,583 |
|
|
|
|
|
|
| Net change in unrealized appreciation (depreciation) |
|
|
106,507,085 |
|
|
|
|
|
|
| Net Realized and Unrealized Gain (Loss) |
|
|
76,864,719 |
|
|
|
|
|
|
| Net Increase (Decrease) in Net Assets Resulting from Operations |
|
|
109,908,062 |
|
|
|
|
|
|
| Distributions Paid to Series A Cumulative Preferred Stockholders
(Note 7) |
|
|
(14,833 |
) |
|
|
|
|
|
| Net Increase (Decrease) in Net Assets Applicable to Common Shareholders Resulting From
Operations |
|
$ |
109,893,229 |
|
|
|
|
|
|
See accompanying notes to
consolidated financial statements.
28
COHEN
& STEERS REIT AND
PREFERRED AND INCOME FUND, INC.
CONSOLIDATED STATEMENT OF CHANGES IN NET ASSETS APPLICABLE TO
COMMON SHARES
|
|
|
|
|
|
|
|
|
| |
|
For the
Year Ended
December 31, 2023 |
|
|
For the
Year Ended
December 31, 2022 |
|
| Change in Net Assets Applicable to Common Shareholders: |
|
|
|
|
|
|
|
|
| From Operations: |
|
|
|
|
|
|
|
|
| Net investment income (loss) |
|
$ |
33,043,343 |
|
|
$ |
42,077,233 |
|
| Net realized gain (loss) |
|
|
(29,642,366 |
) |
|
|
30,465,094 |
|
| Net change in unrealized appreciation (depreciation) |
|
|
106,507,085 |
|
|
|
(378,823,462 |
) |
| Distributions paid to Series A Cumulative Preferred Stockholders |
|
|
(14,833 |
) |
|
|
(14,084 |
) |
|
|
|
|
|
|
|
|
|
| Net increase (decrease) in net assets applicable to Common Shareholders resulting from
operations |
|
|
109,893,229 |
|
|
|
(306,295,219 |
) |
|
|
|
|
|
|
|
|
|
| Distributions to Common Shareholders |
|
|
(77,937,834 |
) |
|
|
(128,711,087 |
) |
|
|
|
|
|
|
|
|
|
| Capital Stock Transactions: |
|
|
|
|
|
|
|
|
| Increase (decrease) in net assets from Fund share transactions |
|
|
588,799 |
|
|
|
2,955,526 |
|
| Increase (decrease) in net assets from offering expenses from issuance of preferred
shares |
|
|
— |
|
|
|
(19,400 |
) |
|
|
|
|
|
|
|
|
|
| Net increase (decrease) in net assets from capital stock transactions |
|
|
588,799 |
|
|
|
2,936,126 |
|
|
|
|
|
|
|
|
|
|
| Total increase (decrease) in net assets applicable to Common
Shareholders |
|
|
32,544,194 |
|
|
|
(432,070,180 |
) |
| Net Assets Applicable to Common Shareholders: |
|
|
|
|
|
|
|
|
| Beginning of year |
|
|
959,568,727 |
|
|
|
1,391,638,907 |
|
|
|
|
|
|
|
|
|
|
| End of year |
|
$ |
992,112,921 |
|
|
$ |
959,568,727 |
|
|
|
|
|
|
|
|
|
|
See accompanying notes to
consolidated financial statements.
29
COHEN
& STEERS REIT AND
PREFERRED AND INCOME FUND, INC.
CONSOLIDATED STATEMENT OF CASH FLOWS
For the Year Ended December 31, 2023
|
|
|
|
|
| Increase (Decrease) in Cash: |
|
|
|
|
| Cash Flows from Operating Activities: |
|
|
|
|
| Net increase (decrease) in net assets resulting from operations* |
|
$ |
109,908,062 |
|
| Adjustments to reconcile net increase (decrease) in net assets resulting from
operations to net cash provided by operating activities: |
|
|
|
|
| Purchases of long-term investments |
|
|
(431,708,982 |
) |
| Proceeds from sales and maturities of long-term investments |
|
|
468,168,041 |
|
| Net purchases, sales and maturities of short-term investments |
|
|
564,616 |
|
| Net amortization of premium on investments in securities |
|
|
1,702,871 |
|
| Net increase in dividends and interest receivable and other assets |
|
|
(432,126 |
) |
| Net increase in interest expense payable, accrued expenses and other
liabilities |
|
|
342,949 |
|
| Net increase in payable for variation margin on interest rate swap
contracts |
|
|
36,896 |
|
| Net decrease in premiums received from written option contracts |
|
|
(156,924 |
) |
| Net change in unrealized depreciation on written option contracts |
|
|
554,912 |
|
| Net change in unrealized appreciation on investments in securities |
|
|
(116,390,535 |
) |
| Net change in unrealized depreciation on total return swap contracts |
|
|
109,905 |
|
| Net change in unrealized appreciation on forward foreign currency exchange
contracts |
|
|
(322,566 |
) |
| Net realized loss on investments in securities |
|
|
43,162,009 |
|
|
|
|
|
|
| Cash provided by operating activities |
|
|
75,539,128 |
|
|
|
|
|
|
| Cash Flows from Financing Activities: |
|
|
|
|
| Distributions paid on Series A Cumulative Preferred Stock (net of distributions
payable) |
|
|
(14,833 |
) |
| Dividends and distributions paid |
|
|
(77,070,562 |
) |
|
|
|
|
|
| Cash used for financing activities |
|
|
(77,085,395 |
) |
|
|
|
|
|
| Increase (decrease) in cash and restricted cash |
|
|
(1,546,267 |
) |
| Cash and restricted cash at beginning of year (including foreign
currency) |
|
|
9,422,909 |
|
|
|
|
|
|
| Cash and restricted cash at end of year (including foreign currency) |
|
$ |
7,876,642 |
|
|
|
|
|
|
Supplemental Disclosure of Cash Flow Information:
For the year ended December 31, 2023, interest paid was $26,329,187.
For the year ended December 31, 2023, reinvestment of dividends was $588,799.
| * |
Does not include distributions paid to Series A Cumulative Preferred Stockholders.
|
See accompanying notes to
consolidated financial statements.
30
COHEN
& STEERS REIT AND
PREFERRED AND INCOME FUND, INC.
CONSOLIDATED STATEMENT OF CASH FLOWS—(Continued)
For the Year Ended December 31, 2023
The following table provides a reconciliation of cash and restricted cash reported within the Consolidated Statement of Assets
and Liabilities that sums to the total of such amounts shown on the Consolidated Statement of Cash Flows.
|
|
|
|
|
| Cash |
|
$ |
911,900 |
|
| Restricted cash |
|
|
6,729,492 |
|
| Foreign currency |
|
|
235,250 |
|
|
|
|
|
|
| Total cash and restricted cash shown on the Consolidated Statement of Cash
Flows |
|
$ |
7,876,642 |
|
|
|
|
|
|
Restricted cash consists of cash that has been deposited with a broker and pledged to cover the
Fund’s collateral or margin obligations under derivative contracts. It is reported on the Consolidated Statement of Assets and Liabilities as cash collateral pledged for interest rate swap contracts and cash collateral pledged for total return
swap contracts.
See accompanying notes to
consolidated financial statements.
31
COHEN
& STEERS REIT AND
PREFERRED AND INCOME FUND, INC.
CONSOLIDATED FINANCIAL HIGHLIGHTS
The following table includes selected data for a common share outstanding throughout each year and other performance
information derived from the consolidated financial statements. It should be read in conjunction with the consolidated financial statements and notes thereto.
|
|
|
|
|
|
|
|
|
|
|
|
|
|
|
|
|
|
|
|
|
| |
|
For the Year Ended December 31, |
|
| Per Share Operating Data: |
|
2023(a) |
|
|
2022(a) |
|
|
2021(a) |
|
|
2020 |
|
|
2019 |
|
| Net asset value per common share, beginning of year |
|
|
$20.10 |
|
|
|
$29.24 |
|
|
|
$23.62 |
|
|
|
$24.73 |
|
|
|
$19.98 |
|
|
|
|
|
|
|
|
|
|
|
|
|
|
|
|
|
|
|
|
|
|
| Income (loss) from investment operations: |
|
|
|
|
|
|
|
|
|
|
|
|
|
|
|
|
|
|
|
|
|
|
|
|
|
|
| Net investment income
(loss)(b) |
|
|
0.69 |
|
|
|
0.88 |
|
|
|
0.73 |
|
|
|
0.79 |
|
|
|
0.87 |
|
| Net realized and unrealized
gain (loss) |
|
|
1.61 |
|
|
|
(7.32 |
) |
|
|
6.38 |
|
|
|
(0.41 |
) |
|
|
5.37 |
|
| Distributions paid to Series A Cumulative
Preferred Stockholders |
|
|
(0.00 |
)(c) |
|
|
(0.00 |
)(c) |
|
|
— |
|
|
|
— |
|
|
|
— |
|
|
|
|
|
|
|
|
|
|
|
|
|
|
|
|
|
|
|
|
|
|
| Total from investment operations applicable to common shares |
|
|
2.30 |
|
|
|
(6.44 |
) |
|
|
7.11 |
|
|
|
0.38 |
|
|
|
6.24 |
|
|
|
|
|
|
|
|
|
|
|
|
|
|
|
|
|
|
|
|
|
|
| Less dividends and distributions to common shareholders from: |
|
|
|
|
|
|
|
|
|
|
|
|
|
|
|
|
|
|
|
|
|
|
|
|
|
|
| Net investment income |
|
|
(1.04 |
) |
|
|
(0.55 |
) |
|
|
(0.51 |
) |
|
|
(0.51 |
) |
|
|
(0.85 |
) |
| Net realized gain |
|
|
(0.59 |
) |
|
|
(2.15 |
) |
|
|
(0.98 |
) |
|
|
(0.98 |
) |
|
|
(0.64 |
) |
|
|
|
|
|
|
|
|
|
|
|
|
|
|
|
|
|
|
|
|
|
| Total dividends and distributions to common shareholders |
|
|
(1.63 |
) |
|
|
(2.70 |
) |
|
|
(1.49 |
) |
|
|
(1.49 |
) |
|
|
(1.49 |
) |
|
|
|
|
|
|
|
|
|
|
|
|
|
|
|
|
|
|
|
|
|
| Anti-dilutive effect from the issuance of reinvested shares |
|
|
0.00 |
(c) |
|
|
0.00 |
(c) |
|
|
— |
|
|
|
— |
|
|
|
— |
|
|
|
|
|
|
|
|
|
|
|
|
|
|
|
|
|
|
|
|
|
|
| Net increase (decrease) in net asset value per common share |
|
|
0.67 |
|
|
|
(9.14 |
) |
|
|
5.62 |
|
|
|
(1.11 |
) |
|
|
4.75 |
|
|
|
|
|
|
|
|
|
|
|
|
|
|
|
|
|
|
|
|
|
|
| Net asset value per common share, end
of year |
|
|
$20.77 |
|
|
|
$20.10 |
|
|
|
$29.24 |
|
|
|
$23.62 |
|
|
|
$24.73 |
|
|
|
|
|
|
|
|
|
|
|
|
|
|
|
|
|
|
|
|
|
|
| Market value per common share, end
of year |
|
|
$20.16 |
|
|
|
$20.38 |
|
|
|
$28.62 |
|
|
|
$22.83 |
|
|
|
$23.79 |
|
|
|
|
|
|
|
|
|
|
|
|
|
|
|
|
|
|
|
|
|
|
|
|
|
|
|
|
| |
|
|
|
|
|
|
|
|
|
|
|
|
|
|
|
|
|
|
|
|
| Total net asset value
return(d) |
|
|
12.47 |
% |
|
|
–22.57 |
% |
|
|
31.05 |
% |
|
|
2.87 |
% |
|
|
32.35 |
% |
|
|
|
|
|
|
|
|
|
|
|
|
|
|
|
|
|
|
|
|
|
| Total market value
return(d) |
|
|
7.67 |
% |
|
|
–19.79 |
% |
|
|
32.71 |
% |
|
|
3.36 |
% |
|
|
42.92 |
% |
|
|
|
|
|
|
|
|
|
|
|
|
|
|
|
|
|
|
|
|
|
|
|
|
|
|
|
| |
|
|
|
|
|
|
|
|
|
|
|
|
|
|
|
|
|
|
|
|
See accompanying notes to consolidated financial statements.
32
COHEN
& STEERS REIT AND
PREFERRED AND INCOME FUND, INC.
CONSOLIDATED FINANCIAL HIGHLIGHTS—(Continued)
|
|
|
|
|
|
|
|
|
|
|
|
|
|
|
|
|
|
|
|
|
| |
|
For the Year Ended December 31, |
|
| Ratios/Supplemental Data: |
|
2023(a) |
|
|
2022(a) |
|
|
2021(a) |
|
|
2020 |
|
|
2019 |
|
|
|
|
|
|
|
| Net assets applicable to common shareholders, end of year (in millions) |
|
|
$992.1 |
|
|
|
$959.6 |
|
|
|
$1,391.6 |
|
|
|
$1,123.7 |
|
|
|
$1,176.5 |
|
|
|
|
|
|
|
|
|
|
|
|
|
|
|
|
|
|
|
|
|
|
| Ratios to average daily net assets: |
|
|
|
|
|
|
|
|
|
|
|
|
|
|
|
|
|
|
|
|
|
|
|
|
|
|
| Expenses |
|
|
4.02 |
%(e) |
|
|
2.21 |
%(e) |
|
|
1.78 |
% |
|
|
2.07 |
% |
|
|
1.96 |
% |
|
|
|
|
|
|
|
|
|
|
|
|
|
|
|
|
|
|
|
|
|
| Expenses (excluding interest expense) |
|
|
1.16 |
%(e) |
|
|
1.10 |
%(e) |
|
|
1.04 |
%(d) |
|
|
1.04 |
%(d) |
|
|
1.02 |
%(d) |
|
|
|
|
|
|
|
|
|
|
|
|
|
|
|
|
|
|
|
|
|
| Net investment income (loss) |
|
|
3.51 |
%(e) |
|
|
3.67 |
%(e) |
|
|
2.77 |
% |
|
|
3.56 |
% |
|
|
3.72 |
% |
|
|
|
|
|
|
|
|
|
|
|
|
|
|
|
|
|
|
|
|
|
| Ratio of expenses to average daily
managed assets(f) |
|
|
2.72 |
% |
|
|
1.59 |
% |
|
|
1.33 |
% |
|
|
1.55 |
% |
|
|
1.49 |
% |
|
|
|
|
|
|
|
|
|
|
|
|
|
|
|
|
|
|
|
|
|
| Portfolio turnover rate |
|
|
32 |
% |
|
|
40 |
% |
|
|
40 |
% |
|
|
57 |
% |
|
|
53 |
% |
|
|
|
|
|
|
|
|
|
|
|
|
|
|
|
|
|
|
|
|
|
| Credit Agreement |
|
|
|
|
|
|
|
|
|
|
|
|
|
|
|
|
|
|
|
|
|
|
|
|
|
|
| Asset coverage ratio for credit agreement |
|
|
320 |
% |
|
|
313 |
% |
|
|
427 |
% |
|
|
381 |
% |
|
|
436 |
% |
|
|
|
|
|
|
|
|
|
|
|
|
|
|
|
|
|
|
|
|
|
| Asset coverage per $1,000 for
credit agreement |
|
|
$3,205 |
|
|
|
$3,132 |
|
|
|
$4,274 |
|
|
|
$3,809 |
|
|
|
$4,361 |
|
|
|
|
|
|
|
|
|
|
|
|
|
|
|
|
|
|
|
|
|
|
| Amount of loan outstanding
(in millions) |
|
|
$450.0 |
|
|
|
$450.0 |
|
|
|
$425.0 |
|
|
|
$400.0 |
|
|
|
$350.0 |
|
|
|
|
|
|
|
|
|
|
|
|
|
|
|
|
|
|
|
|
|
|
| Series A Cumulative Preferred Stock at liquidation value, end of year (in
000s) |
|
|
$125.0 |
|
|
|
$125.0 |
|
|
|
— |
|
|
|
— |
|
|
|
— |
|
|
|
|
|
|
|
|
|
|
|
|
|
|
|
|
|
|
|
|
|
|
| Asset coverage ratio for Series A Cumulative Preferred Stock |
|
|
320 |
% |
|
|
313 |
% |
|
|
— |
|
|
|
— |
|
|
|
— |
|
|
|
|
|
|
|
|
|
|
|
|
|
|
|
|
|
|
|
|
|
|
| Asset Coverage, per $1,000 liquidation value per share of Series A
Cumulative
Preferred Stock |
|
|
$3,204 |
|
|
|
$3,132 |
|
|
|
— |
|
|
|
— |
|
|
|
— |
|
|
|
|
|
|
|
|
|
|
|
|
|
|
|
|
|
|
|
|
|
|
| (a) |
Consolidated (see Note 1). |
| (b) |
Calculation based on average shares outstanding. |
| (c) |
Amount is less than $0.005. |
| (d) |
Total net asset value return measures the change in net asset value per share over the year
indicated. Total market value return is computed based upon the Fund’s market price per share and excludes the effects of brokerage commissions. Dividends and distributions are assumed, for purposes of these calculations, to be reinvested at
prices obtained under the Fund’s dividend reinvestment plan. |
| (e) |
Calculated on the basis of average net assets of common stock shareholders. Ratios do not reflect
the effect of dividend payments to Series A Cumulative Preferred Stockholders. |
| (f) |
Average daily managed assets represent net assets plus the outstanding balance of the credit
agreement. Ratios do not reflect the effect of dividend payments to Series A Cumulative Preferred Stockholders. |
See accompanying notes to consolidated financial statements.
33
COHEN
& STEERS REIT AND
PREFERRED AND INCOME FUND, INC.
NOTES TO CONSOLIDATED FINANCIAL STATEMENTS
Note 1. Organization and Significant Accounting Policies
Cohen & Steers REIT and Preferred and Income Fund, Inc. (the Fund) was incorporated under the laws of the State of
Maryland on March 25, 2003 and is registered under the Investment Company Act of 1940 (the 1940 Act) as a diversified, closed-end management investment company. The Fund’s investment objective is high
current income. The Fund’s secondary investment objective is capital appreciation.
Cohen & Steers RNP
Trust (the REIT Subsidiary), is a wholly-owned subsidiary of the Fund organized under the laws of the state of Maryland as a statutory trust on July 9, 2021 that commenced operations on November 30, 2021. The REIT Subsidiary acts as an investment
vehicle for the Fund in order to effect certain investments on behalf of the Fund, consistent with the Fund’s investment objectives and policies. The Fund expects that it will achieve a significant portion of its exposure to private real estate
investments through investment in the REIT Subsidiary. The REIT Subsidiary may use wholly-owned, limited liability companies to contain the exposure of individual private real estate investments. Unlike the Fund, the REIT Subsidiary may invest
without limitation in private real estate. Investments in the REIT Subsidiary are limited to 25% of the Fund’s total assets. The Consolidated Schedule of Investments includes positions of the Fund and the REIT Subsidiary. The financial
statements have been consolidated and include the accounts of the Fund and the REIT Subsidiary. All significant inter-company balances and transactions have been eliminated in consolidation.
The following is a summary of significant accounting policies consistently followed by the Fund in the preparation of its
consolidated financial statements. The Fund is an investment company and, accordingly, follows the investment company accounting and reporting guidance of the Financial Accounting Standards Board Accounting Standards Codification (ASC)
Topic 946—Investment Companies. The accounting policies of the Fund are in conformity with accounting principles generally accepted in the United States of America (GAAP). The preparation of the consolidated financial statements in
accordance with GAAP requires management to make estimates and assumptions that affect the reported amounts of assets and liabilities at the date of the consolidated financial statements and the reported amounts of income and expenses during
the reporting period. Actual results could differ from those estimates.
Portfolio Valuation: Investments in
securities that are listed on the New York Stock Exchange (NYSE) are valued, except as indicated below, at the last sale price reflected at the close of the NYSE on the business day as of which such value is being determined. If there has been no
sale on such day, the securities are valued at the mean of the closing bid and ask prices on such day or, if no ask price is available, at the bid price. Centrally cleared interest rate swaps are valued at the price determined by the relevant
exchange or clearinghouse. Forward foreign currency exchange contracts are valued daily at the prevailing forward exchange rate. Exchange-traded options are valued at their last sale price as of the close of options trading on applicable exchanges
on the valuation date. In the absence of a last sale price on such day, options are valued based upon prices provided by a third-party pricing service. Over-the-counter
(OTC) options and total return swap contracts are valued based upon prices provided by a third-party pricing service or counterparty.
Securities not listed on the NYSE but listed on other domestic or foreign securities exchanges (including NASDAQ) are valued in a similar manner. Securities traded on more than one securities
34
COHEN
& STEERS REIT AND
PREFERRED AND INCOME FUND, INC.
NOTES TO CONSOLIDATED FINANCIAL STATEMENTS—(Continued)
exchange are valued at the last sale price reflected at the close of the
exchange representing the principal market for such securities on the business day as of which such value is being determined. If after the close of a foreign market, but prior to the close of business on the day the securities are being valued,
market conditions change significantly, certain non-U.S. equity holdings may be fair valued pursuant to procedures established by the Board of Directors.
Readily marketable securities traded in the OTC market, including listed securities whose primary market is believed by
Cohen & Steers Capital Management, Inc. (the investment manager) to be OTC, are valued on the basis of prices provided by a third-party pricing service or third-party broker-dealers when such prices are believed by the investment manager,
pursuant to delegation by the Board of Directors, to reflect the fair value of such securities.
Fixed-income securities
are valued on the basis of prices provided by a third-party pricing service or third-party broker-dealers when such prices are believed by the investment manager, pursuant to delegation by the Board of Directors, to reflect the fair value of such
securities. The pricing services or broker-dealers use multiple valuation techniques to determine fair value. In instances where sufficient market activity exists, the pricing services or broker-dealers may utilize a market-based approach through
which quotes from market makers are used to determine fair value. In instances where sufficient market activity may not exist or is limited, the pricing services or broker-dealers also utilize proprietary valuation models which may consider market
transactions in comparable securities and the various relationships between securities in determining fair value and/or characteristics such as benchmark yield curves, option-adjusted spreads, credit spreads, estimated default rates, coupon rates,
anticipated timing of principal repayments, underlying collateral, and other unique security features which are then used to calculate the fair values.
Short-term debt securities with a maturity date of 60 days or less are valued at amortized cost, which approximates fair value.
Investments in open-end mutual funds are valued at net asset value (NAV).
The
Fund utilizes an independent valuation services firm (the Independent Valuation Advisor) to assist the investment manager in the determination of the Fund’s fair value of private real estate investments held by the REIT Subsidiary. Limited
scope appraisals are prepared on a monthly basis and typically include a limited comparable sales and a full discounted cash flow analysis. Annually, a full scope, detailed appraisal report is completed which typically includes market analysis, cost
approach, sales comparison approach and an income approach containing a discounted cash flow analysis. The full scope report is prepared by a third-party appraisal firm. The investment manager, including through communication with the Independent
Valuation Advisor, monitors for material events that the investment manager believes may be expected to have a material impact on the most recent estimated fair values of such private real estate investments. However, rapidly changing market
conditions or material events may not be immediately reflected in the Fund’s or REIT Subsidiary’s daily NAV. The investment manager, in conjunction with the Independent Valuation Advisor, values the private real estate investments using
the valuation methodology it deems most appropriate and consistent with industry best practices and market conditions. The investment manager expects the primary methodology used to value private real estate investments will be the income approach.
Consistent with industry practices, the income approach incorporates actual contractual lease income, professional judgments regarding
35
COHEN
& STEERS REIT AND
PREFERRED AND INCOME FUND, INC.
NOTES TO CONSOLIDATED FINANCIAL STATEMENTS—(Continued)
comparable rental and operating expense data, the capitalization or discount
rate and projections of future rent and expenses based on appropriate market evidence, and other subjective factors. Other methodologies that may also be used to value properties include, among other approaches, sales comparisons and cost
approaches. Private real estate appraisals are reported on a free and clear basis (i.e. any property-level indebtedness that may be in place is not incorporated into the valuation). Property level debt is valued separately in accordance with GAAP.
The Board of Directors has designated the investment manager as the Fund’s “Valuation Designee” under
Rule 2a-5 under the 1940 Act. As Valuation Designee, the investment manager is authorized to make fair valuation determinations, subject to the oversight of the Board of Directors. The investment manager has
established a valuation committee (Valuation Committee) to administer, implement and oversee the fair valuation process according to the policies and procedures approved annually by the Board of Directors. Among other things, these procedures allow
the Fund to utilize independent pricing services, quotations from securities and financial instrument dealers and other market sources to determine fair value.
Securities for which market prices are unavailable, or securities for which the investment manager determines that the bid and/or
ask price or a counterparty valuation does not reflect market value, will be valued at fair value, as determined in good faith by the Valuation Committee, pursuant to procedures approved by the Fund’s Board of Directors. Circumstances in which
market prices may be unavailable include, but are not limited to, when trading in a security is suspended, the exchange on which the security is traded is subject to an unscheduled close or disruption or material events occur after the close of the
exchange on which the security is principally traded. In these circumstances, the Fund determines fair value in a manner that fairly reflects the market value of the security on the valuation date based on consideration of any information or factors
it deems appropriate. These may include, but are not limited to, recent transactions in comparable securities, information relating to the specific security and developments in the markets.
For equity securities, including restricted securities, where observable inputs are limited, assumptions about market activity and
risk are used and these securities would be categorized as Level 2 or 3 in the hierarchy, depending on the relative significance of the valuation inputs. Securities, including private placements or other restricted securities, for which
observable inputs are not available are valued using alternate valuation approaches, including the market approach, the income approach and cost approach, and are categorized as Level 3 in the hierarchy. The market approach considers factors
including the price of recent investments in the same or a similar security or financial metrics of comparable securities. The income approach considers factors including expected future cash flows, security specific risks and corresponding discount
rates. The cost approach considers factors including the value of the security’s underlying assets and liabilities.
The Fund’s use of fair value pricing may cause the NAV of Fund shares to differ from the NAV that would be calculated using
market quotations. Fair value pricing involves subjective judgments and it is possible that the fair value determined for a security may be materially different than the value that could be realized upon the sale of that security.
Fair value is defined as the price that the Fund would expect to receive upon the sale of an investment or expect to pay to
transfer a liability in an orderly transaction with an independent buyer in
36
COHEN
& STEERS REIT AND
PREFERRED AND INCOME FUND, INC.
NOTES TO CONSOLIDATED FINANCIAL STATEMENTS—(Continued)
the principal market or, in the absence of a principal market, the most
advantageous market for the investment or liability. The hierarchy of inputs that are used in determining the fair value of the Fund’s investments is summarized below.
| |
• |
|
Level 1—quoted prices in active markets for identical investments |
| |
• |
|
Level 2—other significant observable inputs (including quoted prices for similar investments,
interest rates, credit risk, etc.) |
| |
• |
|
Level 3—significant unobservable inputs (including the Fund’s own assumptions in
determining the fair value of investments) |
The inputs or methodology used for valuing investments may
or may not be an indication of the risk associated with those investments. Changes in valuation techniques may result in transfers into or out of an assigned level within the disclosure hierarchy.
The following is a summary of the inputs used as of December 31, 2023 in valuing the Fund’s investments carried at value:
|
|
|
|
|
|
|
|
|
|
|
|
|
|
|
|
|
| |
|
Quoted Prices
in Active
Markets for
Identical
Investments
(Level 1) |
|
|
Other
Significant
Observable
Inputs
(Level 2) |
|
|
Significant
Unobservable
Inputs
(Level 3) |
|
|
Total |
|
| Common Stock: |
|
|
|
|
|
|
|
|
|
|
|
|
|
|
|
|
| Real Estate—Industrials |
|
$ |
79,811,172 |
|
|
$ |
— |
|
|
$ |
6,644,979 |
(a) |
|
$ |
86,456,151 |
|
| Other Industries |
|
|
612,188,181 |
|
|
|
— |
|
|
|
— |
|
|
|
612,188,181 |
|
| Exchange-Traded Funds |
|
|
12,560,839 |
|
|
|
— |
|
|
|
— |
|
|
|
12,560,839 |
|
| Preferred Securities—Exchange-Traded |
|
|
139,620,612 |
|
|
|
— |
|
|
|
— |
|
|
|
139,620,612 |
|
| Preferred
Securities—Over-the-Counter: |
|
|
|
|
|
|
|
|
|
|
|
|
|
|
|
|
| Consumer Staple Products |
|
|
— |
|
|
|
— |
|
|
|
7,831,000 |
(b) |
|
|
7,831,000 |
|
| Other Industries |
|
|
— |
|
|
|
545,452,212 |
|
|
|
— |
|
|
|
545,452,212 |
|
| Private Real Estate—Office |
|
|
— |
|
|
|
— |
|
|
|
13,053,225 |
(c) |
|
|
13,053,225 |
|
| Short-Term Investments |
|
|
— |
|
|
|
8,538,176 |
|
|
|
— |
|
|
|
8,538,176 |
|
|
|
|
|
|
|
|
|
|
|
|
|
|
|
|
|
|
| Total Investments in
Securities(d) |
|
$ |
844,180,804 |
|
|
$ |
553,990,388 |
|
|
$ |
27,529,204 |
|
|
$ |
1,425,700,396 |
|
|
|
|
|
|
|
|
|
|
|
|
|
|
|
|
|
|
| Interest Rate Swaps Contracts |
|
$ |
— |
|
|
$ |
26,531,169 |
|
|
$ |
— |
|
|
$ |
26,531,169 |
|
| Forward Foreign Currency Exchange Contracts |
|
|
— |
|
|
|
13,161 |
|
|
|
— |
|
|
|
13,161 |
|
|
|
|
|
|
|
|
|
|
|
|
|
|
|
|
|
|
| Total Derivative
Assets(d) |
|
$ |
— |
|
|
$ |
26,544,330 |
|
|
$ |
— |
|
|
$ |
26,544,330 |
|
|
|
|
|
|
|
|
|
|
|
|
|
|
|
|
|
|
| Forward Foreign Currency Exchange Contracts |
|
$ |
— |
|
|
$ |
(420,525 |
) |
|
$ |
— |
|
|
$ |
(420,525 |
) |
| Written Option Contracts |
|
|
(285,705 |
) |
|
|
(299,264 |
) |
|
|
— |
|
|
|
(584,969 |
) |
| Total Return Swaps Contracts |
|
|
— |
|
|
|
(109,905 |
) |
|
|
— |
|
|
|
(109,905 |
) |
|
|
|
|
|
|
|
|
|
|
|
|
|
|
|
|
|
| Total Derivative
Liabilities(d) |
|
$ |
(285,705 |
) |
|
$ |
(829,694 |
) |
|
$ |
— |
|
|
$ |
(1,115,399 |
) |
|
|
|
|
|
|
|
|
|
|
|
|
|
|
|
|
|
37
COHEN
& STEERS REIT AND
PREFERRED AND INCOME FUND, INC.
NOTES TO CONSOLIDATED FINANCIAL STATEMENTS—(Continued)
| (a) |
Restricted security, where observable inputs are limited, has been fair valued by the Valuation
Committee, pursuant to the Fund’s fair value procedures and classified as Level 3 security. |
| (b) |
Level 3 investments are valued by a third-party pricing service. The inputs for these securities
are not readily available or cannot be reasonably estimated. A change in the significant unobservable inputs could result in a significantly lower or higher value in such Level 3 investments. |
| (c) |
Private Real Estate, where observable inputs are limited, has been fair valued by the Valuation
Committee, pursuant to the Fund’s fair value procedures and classified as Level 3 security. See Note 1-Portfolio Valuation. |
| (d) |
Portfolio holdings are disclosed individually on the Consolidated Schedule of Investments.
|
The following is a reconciliation of investments for which significant unobservable inputs (Level 3)
were used in determining fair value:
|
|
|
|
|
|
|
|
|
|
|
|
|
| |
|
Common Stock—
Real Estate—
Industrials |
|
|
Preferred Securities—
Over-the-Counter—
Consumer Staple
Products |
|
|
Private
Real Estate—Office |
|
| Balance as of December 31, 2022 |
|
$ |
5,760,042 |
|
|
$ |
7,303,248 |
|
|
$ |
15,812,130 |
|
| Change in unrealized appreciation (depreciation) |
|
|
884,937 |
|
|
|
527,752 |
|
|
|
(2,758,905 |
) |
|
|
|
|
|
|
|
|
|
|
|
|
|
| Balance as of December 31, 2023 |
|
$ |
6,644,979 |
|
|
$ |
7,831,000 |
|
|
$ |
13,053,225 |
|
|
|
|
|
|
|
|
|
|
|
|
|
|
The change in unrealized appreciation (depreciation) attributable to securities owned on December
31, 2023 which were valued using significant unobservable inputs (Level 3) amounted to $(1,346,216).
The following
table summarizes the quantitative inputs and assumptions used for investments categorized in Level 3 of the fair value hierarchy.
|
|
|
|
|
|
|
|
|
|
|
| |
|
Fair Value at
December 31, 2023 |
|
Valuation
Technique |
|
Unobservable
Inputs |
|
Amount |
|
Valuation Impact
from an Increase
in
Input(a) |
| Common Stock—Real Estate—
Industrial |
|
$6,644,979 |
|
Market Comparable
Companies |
|
Enterprise Value/
EBITDA(b) Multiple |
|
21.1x |
|
Increase |
| Private Real
Estate—
Office |
|
$13,053,225 |
|
Discounted Cash Flow |
|
Terminal Capitalization Rate
Discount Rate |
|
7.00% |
|
Decrease |
| |
7.75% |
|
Decrease |
38
COHEN
& STEERS REIT AND
PREFERRED AND INCOME FUND, INC.
NOTES TO CONSOLIDATED FINANCIAL STATEMENTS—(Continued)
| (a) |
Represents the directional change in the fair value of the Level 3 investments that could have
resulted from an increase in the corresponding input as of year end. A decrease to the unobservable input would have had the opposite effect. Significant changes in these inputs may result in a materially higher or lower fair value measurement.
|
| (b) |
Earnings Before Interest, Taxes, Depreciation and Amortization. |
Security Transactions and Investment Income: Security transactions are recorded on trade date. Realized gains and losses on
investments sold are recorded on the basis of identified cost. Interest income, which includes the amortization of premiums and accretion of discounts, is recorded on the accrual basis. Dividend income is recorded on the ex-dividend date except for certain dividends on foreign securities, which are recorded as soon as the Fund is informed after the ex-dividend date. Distributions from real
estate investment trusts (REITs) are recorded as ordinary income, net realized capital gain or return of capital based on information reported by the REITs and management’s estimates of such amounts based on historical information. These
estimates are adjusted when the actual source of distributions is disclosed by the REITs and actual amounts may differ from the estimated amounts.
Cash: For the purposes of the Consolidated Statement of Cash Flows, the Fund defines cash as cash, including foreign
currency and restricted cash.
Foreign Currency Translation: The books and records of the Fund are maintained in
U.S. dollars. Investment securities and other assets and liabilities denominated in foreign currencies are translated into U.S. dollars based upon prevailing exchange rates on the date of valuation. Purchases and sales of investment securities and
income and expense items denominated in foreign currencies are translated into U.S. dollars based upon prevailing exchange rates on the respective dates of such transactions. The Fund does not isolate that portion of the results of operations
resulting from fluctuations in foreign exchange rates on investments from the fluctuations arising from changes in market prices of securities held. Such fluctuations are included with the net realized and unrealized gain or loss on investments.
Net realized foreign currency transaction gains or losses arise from sales of foreign currencies, (excluding gains and
losses on forward foreign currency exchange contracts, which are presented separately, if any), currency gains or losses realized between the trade and settlement dates on securities transactions, and the difference between the amounts of dividends,
interest, and foreign withholding taxes recorded on the Fund’s books and the U.S. dollar equivalent of the amounts actually received or paid. Net unrealized foreign currency translation gains and losses arise from changes in the values of
assets and liabilities, other than investments in securities, on the date of valuation, resulting from changes in exchange rates. Pursuant to U.S. federal income tax regulations, certain foreign currency gains/losses included in realized and
unrealized gains/losses are included in or are a reduction of ordinary income for federal income tax purposes.
Forward Foreign Currency Exchange Contracts: The Fund enters into forward foreign currency exchange contracts to hedge the
currency exposure associated with certain of its non-U.S. dollar denominated securities. A forward foreign currency exchange contract is a commitment between two parties to purchase or sell foreign currency at
a set price on a future date. The market value of a forward foreign currency exchange contract fluctuates with changes in foreign currency exchange rates. These
39
COHEN
& STEERS REIT AND
PREFERRED AND INCOME FUND, INC.
NOTES TO CONSOLIDATED FINANCIAL STATEMENTS—(Continued)
contracts are marked to market daily and the change in value is recorded by
the Fund as unrealized appreciation and/or depreciation on forward foreign currency exchange contracts. Realized gains or losses equal to the difference between the value of the contract at the time it was opened and the value at the time it was
closed are included in net realized gain or loss on forward foreign currency exchange contracts. For federal income tax purposes, the Fund has made an election to treat gains and losses from forward foreign currency exchange contracts as capital
gains and losses.
Forward foreign currency exchange contracts involve elements of market risk in excess of the amounts
reflected on the Consolidated Statement of Assets and Liabilities. The Fund bears the risk of an unfavorable change in the foreign exchange rate underlying the contract. Risks may also arise upon entering these contracts from the potential inability
of the counterparties to meet the terms of their contracts. In connection with these contracts, securities may be identified as collateral in accordance with the terms of the respective contracts.
Option Contracts: The Fund may purchase and write exchange-listed and OTC put or call options on securities, stock indices
and other financial instruments for hedging purposes, to enhance portfolio returns and/or reduce overall volatility.
When the Fund writes (sells) an option, an amount equal to the premium received by the Fund is recorded on the Consolidated
Statement of Assets and Liabilities as a liability. The amount of the liability is subsequently marked-to-market to reflect the current market value of the option
written. When an option expires, the Fund realizes a gain on the option to the extent of the premium received. Premiums received from writing options which are exercised or closed are added to or offset against the proceeds or amount paid on the
transaction to determine the realized gain or loss. If a put option on a security is exercised, the premium reduces the cost basis of the security purchased by the Fund. If a call option is exercised, the premium is added to the proceeds of the
security sold to determine the realized gain or loss. The Fund, as writer of an option, bears the market risk of an unfavorable change in the price of the underlying investment. Other risks include the possibility of an illiquid options market or
the inability of the counterparties to fulfill their obligations under the contracts.
Put and call options purchased
are accounted for in the same manner as portfolio securities. Premiums paid for purchasing options which expire are treated as realized losses. Premiums paid for purchasing options which are exercised or closed are added to the amounts paid or
offset against the proceeds on the underlying investment transaction to determine the realized gain or loss when the underlying transaction is executed. The risk associated with purchasing an option is that the Fund pays a premium whether or not the
option is exercised. Additionally, the Fund bears the risk of loss of the premium and change in market value should the counterparty not perform under the contract.
Over-the-Counter Total Return Swap
Contracts: In a total return swap, one party receives a periodic payment equal to the total return of a specified security, basket of securities, index, or other reference asset for a specified period of time. In return, the other party receives
a fixed or variable stream of payments, typically based upon short-term interest rates, possibly plus or minus an agreed upon spread. During the term of the outstanding swap agreement, changes in the value of the swap are recorded as unrealized
appreciation and depreciation. Periodic payments received or made are recorded as realized gains or losses. The Fund bears the risk of loss in the event of nonperformance by
40
COHEN
& STEERS REIT AND
PREFERRED AND INCOME FUND, INC.
NOTES TO CONSOLIDATED FINANCIAL STATEMENTS—(Continued)
the swap counterparty. Risks may also arise from unanticipated
movements in the value of exchange rates, interest rates, securities, index, or other reference asset.
Centrally
Cleared Interest Rate Swap Contracts: The Fund uses interest rate swaps in connection with borrowing under its credit agreement. The interest rate swaps are intended to reduce interest rate risk by countering the effect that an increase in
short-term interest rates could have on the performance of the Fund’s shares as a result of the floating rate structure of interest owed pursuant to the credit agreement. When entering into interest rate swaps, the Fund agrees to pay the other
party to the interest rate swap (which is known as the counterparty) a fixed rate payment in exchange for the counterparty’s agreement to pay the Fund a variable rate payment that was intended to approximate the Fund’s variable rate
payment obligation on the credit agreement, the accruals for which would begin at a specific date in the future (the effective date). The payment obligation is based on the notional amount of the swap. Depending on the state of interest rates in
general, the use of interest rate swaps could enhance or harm the overall performance of the Fund. Swaps are marked-to-market daily and changes in the value are recorded
as unrealized appreciation (depreciation).
Immediately following execution of the swap agreement, the swap agreement is
novated to a central counterparty (the CCP) and the Fund’s counterparty on the swap agreement becomes the CCP. The Fund is required to interface with the CCP through a broker. Upon entering into a centrally cleared swap, the Fund is required to
deposit initial margin with the broker in the form of cash or securities in an amount that varies depending on the size and risk profile of the particular swap. Securities deposited as initial margin are designated on the Consolidated Schedule of
Investments and cash deposited is recorded on the Consolidated Statement of Assets and Liabilities as cash collateral pledged for interest rate swap contracts. The daily change in valuation of centrally cleared swaps is recorded as a receivable
or payable for variation margin on interest rate swap contracts in the Consolidated Statement of Assets and Liabilities. Any upfront payments paid or received upon entering into a swap agreement would be recorded as assets or liabilities,
respectively, in the Consolidated Statement of Assets and Liabilities, and amortized or accreted over the life of the swap and recorded as realized gain (loss) in the Consolidated Statement of Operations. Payments received from or paid to
the counterparty during the term of the swap agreement, or at termination, are recorded as realized gain (loss) in the Consolidated Statement of Operations.
Swap agreements involve, to varying degrees, elements of market and counterparty risk, and exposure to loss in excess of the
related amounts reflected on the Consolidated Statement of Assets and Liabilities. Such risks involve the possibility that there will be no liquid market for these agreements, that the counterparty to the agreements may default on its obligation to
perform or disagree as to the meaning of contractual terms in the agreements and that there may be unfavorable changes in interest rates.
Dividends and Distributions to Shareholders: Dividends from net investment income and capital gain distributions are determined in accordance with U.S. federal income tax regulations, which may differ from GAAP. Dividends
from net investment income, if any, are typically declared quarterly and paid monthly. Net realized capital gains, unless offset by any available capital loss carryforward, are typically distributed to shareholders at least annually. Dividends and
distributions to shareholders are recorded on the ex-dividend date and are automatically reinvested in full and fractional shares of the
41
COHEN
& STEERS REIT AND
PREFERRED AND INCOME FUND, INC.
NOTES TO CONSOLIDATED FINANCIAL STATEMENTS—(Continued)
Fund in accordance with the Fund’s Reinvestment Plan, unless the
shareholder has elected to have them paid in cash.
The Fund has a managed distribution policy in accordance with
exemptive relief issued by the U.S. Securities and Exchange Commission (SEC). The Plan gives the Fund greater flexibility to realize long-term capital gains throughout the year and to distribute those gains on a more regular basis to shareholders.
Therefore, regular monthly distributions throughout the year may include a portion of estimated realized long-term capital gains, along with net investment income, short-term capital gains and return of capital, which is not taxable. In accordance
with the Plan, the Fund is required to adhere to certain conditions in order to distribute long-term capital gains during the year. For the year ended December 31, 2023, the Fund paid distributions from net investment income and net realized gain.
Distributions Subsequent to December 31, 2023: The following distributions have been declared by the Fund’s
Board of Directors and are payable subsequent to the period end of this report.
|
|
|
|
|
|
|
|
|
|
|
|
|
|
|
|
Ex-Date |
|
|
Record Date |
|
|
Payable Date |
|
|
Amount |
|
| |
1/16/24 |
|
|
|
1/17/24 |
|
|
|
1/31/24 |
|
|
$ |
0.136 |
|
| |
2/13/24 |
|
|
|
2/14/24 |
|
|
|
2/29/24 |
|
|
$ |
0.136 |
|
| |
3/12/24 |
|
|
|
3/13/24 |
|
|
|
3/28/24 |
|
|
$ |
0.136 |
|
Distributions to holders of Series A Cumulative Preferred Stock are accrued daily and paid
semi-annually and are determined as described in Note 7. The payments made to the holders of the Fund’s Series A Cumulative Preferred Stock are treated as dividends or distributions.
Income Taxes: It is the policy of the Fund to continue to qualify as a regulated investment company (RIC), if such
qualification is in the best interest of the shareholders, by complying with the requirements of Subchapter M of the Internal Revenue Code applicable to RICs, and by distributing substantially all of its taxable earnings to its shareholders. Also,
in order to avoid the payment of any federal excise taxes, the Fund will distribute substantially all of its net investment income and net realized gains on a calendar year basis. Accordingly, no provision for federal income or excise tax is
necessary. Dividend and interest income from holdings in non-U.S. securities is recorded net of non-U.S. taxes paid. Management has analyzed the Fund’s tax
positions taken on federal and applicable state income tax returns as well as its tax positions in non-U.S. jurisdictions in which it trades for all open tax years and has concluded that as of December 31,
2023, no additional provisions for income tax are required in the Fund’s consolidated financial statements. The Fund’s tax positions for the tax years for which the applicable statutes of limitations have not expired are subject to
examination by the Internal Revenue Service, state departments of revenue and by foreign tax authorities.
The REIT
Subsidiary intends to elect to be taxed as a REIT under Subchapter M of the Code. The REIT Subsidiary’s qualification and taxation as a REIT depends upon the REIT Subsidiary’s ability to meet on a continuing basis, through actual operating
results, certain qualification tests set forth in the Code. Those qualification tests involve the percentage of income that it earns from specified sources, the percentage of its assets that falls within specified categories, the diversity of the
ownership of its shares, and the percentage of its taxable income that the REIT Subsidiary distributes. As a REIT, the REIT Subsidiary generally will be allowed to deduct dividends paid to its shareholders and, as a result, the REIT Subsidiary will
not be subject to U.S. federal income tax on that portion of its ordinary income
42
COHEN
& STEERS REIT AND
PREFERRED AND INCOME FUND, INC.
NOTES TO CONSOLIDATED FINANCIAL STATEMENTS—(Continued)
and net capital gain that the REIT Subsidiary annually distributes to its
shareholders, as long as the REIT Subsidiary meets the minimum distribution requirements under the Code. The REIT Subsidiary intends to make distributions on a regular basis as necessary to avoid material U.S. federal income tax and to comply with
the REIT distribution requirements.
For the current open tax year and for all major jurisdictions, management of the
REIT Subsidiary has analyzed and concluded that there are no uncertain tax positions that would require recognition in the Fund’s consolidated financial statements. The REIT Subsidiary’s tax positions for the tax years for which the
applicable statutes of limitations have not expired are subject to examination by the Internal Revenue Service, state departments of revenue and by foreign tax authorities.
Note 2. Investment Management Fees, Administration Fees and Other Transactions with Affiliates
Investment Management Fees: Cohen & Steers Capital Management, Inc. serves as the Fund’s investment
manager pursuant to an investment management agreement (the investment management agreement). Under the terms of the investment management agreement, the investment manager provides the Fund with day-to-day investment decisions and generally manages the Fund’s investments in accordance with the stated policies of the Fund, subject to the supervision of the Board of Directors.
For the services provided to the Fund, the investment manager receives a fee, accrued daily and paid monthly, at the annual rate of
0.65% of the average daily managed assets of the Fund. Managed assets are equal to the net assets plus the amount of any borrowings used for leverage outstanding.
Administration Fees: The Fund has entered into an administration agreement with the investment manager under which the
investment manager performs certain administrative functions for the Fund and receives a fee, accrued daily and paid monthly, at the annual rate of 0.06% of the average daily managed assets of the Fund. For the year ended December 31, 2023, the Fund
incurred $835,528 in fees under this administration agreement. Additionally, the Fund pays State Street Bank and Trust Company as co-administrator under a fund accounting and administration agreement.
Directors’ and Officers’ Fees: Certain directors and officers of the Fund are also directors, officers
and/or employees of the investment manager. The Fund does not pay compensation to directors and officers affiliated with the investment manager except for the Chief Compliance Officer, who received compensation from the investment manager, which was
reimbursed by the Fund, in the amount of $9,967 for the year ended December 31, 2023.
Note 3. Purchases and Sales of Securities
Purchases and sales of securities, excluding short-term investments, for the year ended December 31, 2023, totaled
$433,546,374 and $468,527,742, respectively.
Note 4. Investments in Non-Consolidated Limited
Liability Company
In accordance with requirements under Regulation S-X Rules 3-09 and 4-08(g), the Fund evaluates its unconsolidated subsidiaries as significant subsidiaries under the rules and, accordingly, below is summary financial information for
the Fund’s investments in non-consolidated limited liability
43
COHEN
& STEERS REIT AND
PREFERRED AND INCOME FUND, INC.
NOTES TO CONSOLIDATED FINANCIAL STATEMENTS—(Continued)
companies at historical cost as of December 31, 2023. The Fund states its
ownership interests in non-consolidated limited liability companies at fair value.
|
|
|
|
|
| |
|
Legacy Gateway JV LLC(a) |
|
| Balance Sheet: |
|
|
|
|
| Assets: |
|
|
|
|
| Real estate, net (total cost) |
|
$ |
87,508,857 |
|
| Cash |
|
|
3,959,342 |
|
| Other current assets |
|
|
1,089,347 |
|
|
|
|
|
|
| Total Assets |
|
$ |
92,557,546 |
|
|
|
|
|
|
|
|
| Liabilities and Equity: |
|
|
|
|
| Mortgage notes payable |
|
$ |
52,000,000 |
|
| Accrued expenses and accounts payable |
|
|
1,753,809 |
|
| Tenant security deposits |
|
|
81,449 |
|
| Other liabilities |
|
|
524,665 |
|
|
|
|
|
|
| Total Liabilities |
|
|
54,359,923 |
|
|
|
|
|
|
| Equity |
|
|
38,197,623 |
|
|
|
|
|
|
| Total Liabilities and Equity |
|
$ |
92,557,546 |
|
|
|
|
|
|
|
|
| Income Statement |
|
|
|
|
| Revenue |
|
$ |
8,632,723 |
|
| Expenses |
|
|
7,518,675 |
|
|
|
|
|
|
| Net Income |
|
$ |
1,114,048 |
|
|
|
|
|
|
| (a) |
Represents summarized financial information of Legacy Gateway JV LLC, a Class A office
building located at 6860 N. Dallas Parkway, Plano, Texas 75024, which includes 100% of ownership interests in the limited liability company. |
Note 5. Derivative Investments
The following tables present the value of derivatives held at December 31, 2023 and the effect of derivatives held during the year ended December 31, 2023, along with the respective location in the consolidated financial
statements.
44
COHEN
& STEERS REIT AND
PREFERRED AND INCOME FUND, INC.
NOTES TO CONSOLIDATED FINANCIAL STATEMENTS—(Continued)
Consolidated Statement of Assets and Liabilities
|
|
|
|
|
|
|
|
|
|
|
|
|
| |
|
Assets |
|
|
Liabilities |
|
| Derivatives |
|
Location |
|
Fair Value |
|
|
Location |
|
Fair Value |
|
| Credit Risk: |
|
|
|
|
|
|
|
|
|
|
|
|
| Total Return Swap
Contracts—Over-the-Counter |
|
— |
|
$ |
— |
|
|
Total return swap
contracts, at value |
|
$ |
109,905 |
|
| Equity Risk: |
|
|
|
|
|
|
|
|
|
|
|
|
| Written Option Contracts—Exchange-Traded(a) |
|
— |
|
|
— |
|
|
Written option
contracts, at value |
|
|
584,969 |
|
| Foreign Currency Exchange Risk: |
|
|
|
|
|
|
|
|
|
|
|
|
| Forward Foreign Currency Exchange Contracts(b) |
|
Unrealized appreciation |
|
|
13,161 |
|
|
Unrealized depreciation |
|
|
420,525 |
|
| Interest Rate Risk: |
|
|
|
|
|
|
|
|
|
|
|
|
| Interest Rate
Swap Contracts(a) |
|
— |
|
|
— |
|
|
Payable for variation
margin on interest rate
swap contracts |
|
|
26,531,169 |
(c) |
| (a) |
Not subject to a master netting agreement or another similar arrangement.
|
| (b) |
Forward foreign currency exchange contracts executed with Brown Brothers Harriman are not subject
to a master netting agreement or another similar arrangement. |
| (c) |
Amount represents the cumulative net appreciation (depreciation) on interest rate swap contracts as
reported on the Consolidated Schedule of Investments. The Consolidated Statement of Assets and Liabilities only reflects the current day variation margin payable to the broker. |
45
COHEN
& STEERS REIT AND
PREFERRED AND INCOME FUND, INC.
NOTES TO CONSOLIDATED FINANCIAL STATEMENTS—(Continued)
Consolidated Statement of Operations
|
|
|
|
|
|
|
|
|
|
|
|
|
| Derivatives |
|
Location |
|
Realized
Gain (Loss) |
|
|
Change in
Unrealized
Appreciation
(Depreciation) |
|
| Credit Risk: |
|
|
|
|
|
|
|
|
|
|
| Total Return Swap Contracts |
|
Net Realized and Unrealized Gain (Loss) |
|
$ |
(836,755 |
) |
|
$ |
(109,905 |
) |
| Equity Risk: |
|
|
|
|
|
|
|
|
|
|
| Purchased Option
Contracts(a) |
|
Net Realized and Unrealized Gain (Loss) |
|
|
(333,194 |
) |
|
|
6,126 |
|
| Written Option Contracts |
|
Net Realized and Unrealized Gain (Loss) |
|
|
546,574 |
|
|
|
(554,912 |
) |
| Foreign Currency Exchange Risk: |
|
|
|
|
|
|
|
|
|
|
| Forward Foreign Currency Exchange Contracts |
|
Net Realized and Unrealized Gain (Loss) |
|
|
(1,011,967 |
) |
|
|
322,566 |
|
| Interest Rate Risk: |
|
|
|
|
|
|
|
|
|
|
| Interest Rate Swap Contracts |
|
Net Realized and Unrealized Gain (Loss) |
|
|
14,745,594 |
|
|
|
(9,545,782 |
) |
| (a) |
Purchased option contracts are included in net realized gain (loss) and change in unrealized
appreciation (depreciation) on investments in securities. |
At December 31, 2023, the Fund’s
derivative assets and liabilities (by type), which are subject to a master netting agreement, are as follows:
|
|
|
|
|
|
|
|
|
| Derivative Financial Instruments |
|
Assets |
|
|
Liabilities |
|
| Credit Risk: |
|
|
|
|
|
|
|
|
| Total Return Swap Contracts—Over-the-Counter |
|
$ |
— |
|
|
$ |
109,905 |
|
46
COHEN
& STEERS REIT AND
PREFERRED AND INCOME FUND, INC.
NOTES TO CONSOLIDATED FINANCIAL STATEMENTS—(Continued)
The following table presents the Fund’s derivative
assets and liabilities by counterparty net of amounts available for offset under a master netting agreement and net of the related collateral received and pledged by the Fund, if any, as of December 31, 2023:
|
|
|
|
|
|
|
|
|
|
|
|
|
|
|
|
|
| Counterparty |
|
Gross Amount
of Liabilities
Presented
in the Consolidated
Statement
of Assets and
Liabilities |
|
|
Financial
Instruments
and Derivatives
Available
for Offset |
|
|
Collateral
Pledged(a) |
|
|
Net Amount
of Derivative
Liabilities(b) |
|
| BNP Paribas |
|
$ |
109,905 |
|
|
$ |
— |
|
|
$ |
(30,000 |
) |
|
$ |
79,905 |
|
| (a) |
Collateral received or pledged is limited to the net derivative asset or net derivative liability
amounts. Actual collateral amounts received or pledged may be higher than amounts above. |
| (b) |
Net amount represents the net receivable from the counterparty or net payable due to the
counterparty in the event of default. |
The following summarizes the monthly average volume of the
Fund’s option contracts, total return swap contracts and forward foreign currency exchange contracts activity for the year ended December 31, 2023:
|
|
|
|
|
|
|
|
|
|
|
|
|
|
|
|
|
| |
|
Purchased
Option
Contracts(a)(b) |
|
|
Written
Option
Contracts(a)(b) |
|
|
Total Return
Swap
Contracts(b) |
|
|
Forward
Foreign
Currency
Exchange
Contracts(b) |
|
| Average Notional Amount |
|
$ |
2,177,818 |
|
|
$ |
14,453,248 |
|
|
$ |
10,514,339 |
|
|
$ |
37,637,923 |
|
| (a) |
Notional amount is calculated using the number of contracts multiplied by notional contract size
multiplied by the underlying price. |
| (b) |
Average notional amounts represent the average for all months in which the Fund had total return
swap contracts and forward foreign currency exchange contracts outstanding at month-end. For the period, this represents nine months for purchased options contracts, twelve months for written option contracts, nine months for total return swap
contracts and twelve months for forward foreign currency exchange contracts. |
Note 6. Income Tax Information
The tax character of dividends and distributions paid was as follows:
|
|
|
|
|
|
|
|
|
| |
|
For the Year Ended
December 31, |
|
| |
|
2023 |
|
|
2022 |
|
| Ordinary income |
|
$ |
49,531,546 |
|
|
$ |
63,038,440 |
|
| Long-term capital gain |
|
|
28,406,288 |
|
|
|
65,672,647 |
|
|
|
|
|
|
|
|
|
|
| Total dividends and distributions |
|
$ |
77,937,834 |
|
|
$ |
128,711,087 |
|
|
|
|
|
|
|
|
|
|
47
COHEN
& STEERS REIT AND
PREFERRED AND INCOME FUND, INC.
NOTES TO CONSOLIDATED FINANCIAL STATEMENTS—(Continued)
As of December 31, 2023, the tax basis components of
accumulated earnings, the federal tax cost and net unrealized appreciation (depreciation) in value of investments held were as follows:
|
|
|
|
|
| Cost of investments in securities for federal income tax purposes |
|
$ |
1,273,612,379 |
|
|
|
|
|
|
| Gross unrealized appreciation on investments |
|
$ |
229,822,427 |
|
| Gross unrealized depreciation on investments |
|
|
(51,728,345 |
) |
|
|
|
|
|
| Net unrealized appreciation (depreciation) on investments |
|
$ |
178,094,082 |
|
|
|
|
|
|
| Undistributed ordinary income |
|
$ |
39,508,363 |
|
|
|
|
|
|
As of December 31, 2023, the Fund has a net capital loss carryforward of $43,409,245 which may be
used to offset future capital gains. The loss is comprised of $2,845,289 of short-term capital loss carryover and $40,563,956 of long-term capital loss carryover, which under current federal income tax rules, may offset capital gains recognized in
any future period.
As of December 31, 2023, the Fund had temporary book/tax differences primarily attributable to wash
sales on portfolio securities, certain REIT dividends and certain fixed income securities and permanent book/tax differences primarily attributable to certain fixed income securities and the REIT subsidiary. To reflect reclassifications arising from
the permanent differences, paid-in capital was credited $2,856,219 and total distributable earnings/(accumulated loss) was charged $2,856,219. Net assets were not affected by this reclassification.
Note 7. Series A Cumulative Preferred Stock
On January 27, 2022, the Fund’s wholly-owned REIT Subsidiary completed a private placement of 125 shares of 12.0% Series A
Cumulative Non-Voting Preferred Stock (the Preferred Stock) for aggregate gross proceeds of $125,000. The Preferred Stock has a liquidation preference of $1,000 per share plus an amount equal to accrued but
unpaid dividends (the Liquidation Preference). The Preferred Stock dividends are cumulative at a rate of 12.0% per annum and are redeemable under certain conditions by the REIT Subsidiary or subject to mandatory redemption upon default of certain
coverage requirements at a redemption price equal to the Liquidation Preference.
Note 8. Capital Stock
The Fund is authorized to issue 100 million shares of common stock at a par value of $0.001 per share.
During the year ended December 31, 2023, the Fund issued 27,351 shares of common stock at $588,799 for the reinvestment of
dividends. During the year ended December 31, 2022, the Fund issued 137,181 shares of common stock at $2,955,526 for the reinvestment of dividends.
On December 13, 2022, the Board of Directors approved the continuation of the delegation of its authority to management to effect
repurchases, pursuant to management’s discretion and subject to market conditions and investment considerations, of up to 10% of the Fund’s common shares outstanding (Share Repurchase Program) as of January 1, 2023 through December 31,
2023.
48
COHEN
& STEERS REIT AND
PREFERRED AND INCOME FUND, INC.
NOTES TO CONSOLIDATED FINANCIAL STATEMENTS—(Continued)
During the years ended December 31, 2023 and December 31,
2022, the Fund did not effect any repurchases.
On December 12, 2023, the Board of Directors approved the continuation
of the Share Repurchase Program, which allows the Fund to repurchase up to 10% of the Fund’s common shares outstanding as of January 1, 2024 through December 31, 2024. There is no assurance that the Fund will repurchase shares in any particular
amounts or at all.
Note 9. Borrowings
The Fund has entered into an amended and restated credit agreement (the credit agreement) with BNP Paribas Prime Brokerage
International, Ltd. (BNPP) in which the Fund pays a monthly financing charge based on Secured Overnight Financing Rate (SOFR)-based variable rates. The commitment amount of the credit agreement is $450,000,000. The Fund may pay a fee of 0.45% per
annum on any unused portion of the credit agreement. BNPP may not change certain terms of the credit agreement except upon 360 days’ notice. Also, if the Fund violates certain conditions, the credit agreement may be terminated. The Fund is
required to pledge portfolio securities and/or cash as collateral in an amount up to two times the loan balance outstanding (or more depending on the terms of the credit agreement) and has granted a security interest in the securities pledged to,
and in favor of, BNPP as security for the loan balance outstanding. If the Fund fails to meet certain requirements, or maintain other financial covenants required under the credit agreement, the Fund may be required to repay immediately, in part or
in full, the loan balance outstanding under the credit agreement, necessitating the sale of portfolio securities at potentially inopportune times. The credit agreement also permits, subject to certain conditions, BNPP to rehypothecate portfolio
securities pledged by the Fund up to the amount of the loan balance outstanding and, prior to January 1, 2024, the Fund received a portion of the fees earned by BNPP in connection with the rehypothecation of portfolio securities (the
rehypothecation fee). The Fund continues to receive dividends and interest on rehypothecated securities. The Fund also has the right under the credit agreement to recall the rehypothecated securities from BNPP on demand. If BNPP fails to deliver the
recalled security in a timely manner, the Fund will be compensated by BNPP for any fees or losses related to the failed delivery or, in the event a recalled security will not be returned by BNPP, the Fund, upon notice to BNPP, may reduce the loan
balance outstanding by the amount of the recalled security failed to be returned.
As of December 31, 2023, the Fund had
outstanding borrowings of $450,000,000 at a rate of 6.3%. The carrying value of the borrowings approximates fair value. The borrowings are classified as Level 2 within the fair value hierarchy. During the year ended December 31, 2023, the Fund
borrowed an average daily balance of $450,000,000 at a weighted average borrowing cost of 5.9%.
On January 1, 2024, the
credit agreement was amended to eliminate the rehypothecation fee and reduce the margin upon which the financing charge is calculated.
Note 10. Other
In the normal course of business, the Fund enters into contracts that provide general indemnifications. The Fund’s
maximum exposure under these arrangements is dependent on claims that may be made against the Fund in the future and, therefore, cannot be estimated; however, based on experience, the risk of material loss from such claims is considered
remote.
49
COHEN
& STEERS REIT AND
PREFERRED AND INCOME FUND, INC.
NOTES TO CONSOLIDATED FINANCIAL STATEMENTS—(Continued)
Note 11. New Accounting Pronouncement
In January 2021, the Financial Accounting Standards Board (“FASB”) issued Accounting Standards Update No. 2021-01 (“ASU 2021-01”), “Reference Rate Reform (Topic 848)”. Additionally, in December 31, 2022, the Financial Accounting Standards Board
(“FASB”) issued Accounting Standards Update No. 2022-06 (“ASU 2022-06”), “Reference Rate Reform (Topic 848)”. ASU 2022-06 and ASU 2021-01 are updates to ASU 2020-04, which is in response to concerns about structural risks of interbank offered rates,
and particularly the risk of cessation of LIBOR, and the reference rate reform initiatives regulators have undertaken to identify alternative reference rates that are more observable or transaction based and less susceptible to manipulation.
ASU 2020-04 provides optional guidance for a limited period of time to ease the potential burden in accounting for (or recognizing the effects of) reference rate reform on financial reporting. ASU 2020-04 is elective and applies to all entities, subject to meeting certain criteria, that have contracts, hedging relationships, and other transactions that reference LIBOR or another reference rate expected to be
discontinued because of reference rate reform. The ASU 2021-01 update clarifies that certain optional expedients and exceptions in Topic 848 for contract modifications and hedge accounting apply to derivatives
that are affected by the discounting transition. The ASU 2022-06 update extends the period of time preparers can use the reference rate reform relief guidance by two years. ASU
2022-06 defers the sunset date of Topic 848 from December 31, 2022 to December 31, 2024, after which entities will no longer be permitted to apply the relief in Topic 848. The amendments in these updates are
effective immediately through December 31, 2024, for all entities. Management has concluded that ASU 2021-01 or ASU 2022-06 did not have a material impact on the
financial statements.
Note 12. Subsequent Events
Management has evaluated events and transactions occurring after December 31, 2023 through the date that the consolidated financial
statements were issued, and has determined that no additional disclosure in the consolidated financial statements is required.
50
COHEN
& STEERS REIT AND
PREFERRED AND INCOME FUND, INC.
REPORT OF INDEPENDENT REGISTERED PUBLIC ACCOUNTING FIRM
To the Board of Directors and Shareholders of
Cohen & Steers REIT and Preferred and Income Fund, Inc.
Opinion on the Consolidated Financial Statements
We have audited the accompanying consolidated statement of assets and liabilities, including the consolidated schedule of
investments, of Cohen & Steers REIT and Preferred and Income Fund, Inc. and its subsidiary (the “Fund”) as of December 31, 2023, the related consolidated statements of operations and cash flows for the year ended
December 31, 2023, the consolidated statement of changes in net assets for each of the two years in the period ended December 31, 2023, including the related notes, and the consolidated financial highlights for each of the five years in
the period ended December 31, 2023 (collectively referred to as the “consolidated financial statements”). In our opinion, the consolidated financial statements present fairly, in all material respects, the financial position of the
Fund as of December 31, 2023, the results of its operations and its cash flows for the year then ended, the changes in its net assets for each of the two years in the period ended December 31, 2023 and the financial highlights for each of
the five years in the period ended December 31, 2023 in conformity with accounting principles generally accepted in the United States of America.
Basis for Opinion
These consolidated financial statements are the responsibility of the Fund’s management.
Our responsibility is to express an opinion on the Fund’s consolidated financial statements based on our audits. We are a public accounting firm registered with the Public Company Accounting Oversight Board (United States) (PCAOB) and are
required to be independent with respect to the Fund in accordance with the U.S. federal securities laws and the applicable rules and regulations of the Securities and Exchange Commission and the PCAOB.
We conducted our audits of these consolidated financial statements in accordance with the standards of the PCAOB. Those standards require that we
plan and perform the audit to obtain reasonable assurance about whether the consolidated financial statements are free of material misstatement, whether due to error or fraud.
Our audits included performing procedures to assess the risks of material misstatement of the consolidated financial statements, whether due to
error or fraud, and performing procedures that respond to those risks. Such procedures included examining, on a test basis, evidence regarding the amounts and disclosures in the consolidated financial statements. Our audits also included evaluating
the accounting principles used and significant estimates made by management, as well as evaluating the overall presentation of the consolidated financial statements. Our procedures included confirmation of securities owned as of December 31,
2023 by correspondence with the custodian, transfer agent, issuer of privately offered securities and brokers; when replies were not received from brokers, we performed other auditing procedures. We believe that our audits provide a reasonable basis
for our opinion.
/s/PricewaterhouseCoopers LLP
New York, New York
February 27, 2024
We have
served as the auditor of one or more investment companies in the Cohen & Steers family of mutual funds since 1991.
51
COHEN
& STEERS REIT AND
PREFERRED AND INCOME FUND, INC.
(The following pages are unaudited)
TAX INFORMATION—2023
For the calendar year ended December 31, 2023, for individual taxpayers, the Fund designates $33,951,986 as qualified dividend
income eligible for reduced tax rates, long-term capital distributions of $28,406,288 taxable at the maximum 20% rate and $7,774,390 as qualified business income. In addition, for corporate 36.17% of the ordinary dividends paid qualified for the
dividends received deduction (DRD).
REINVESTMENT PLAN
The Fund has a dividend reinvestment plan commonly referred to as an “opt-out” plan (the Reinvestment Plan). Each common
shareholder who participates in the Reinvestment Plan will have all distributions of dividends and capital gains (Dividends) automatically reinvested in additional common shares by Computershare as agent (the Plan Agent). Shareholders who elect not
to participate in the Reinvestment Plan will receive all Dividends in cash paid by check mailed directly to the shareholder of record (or if the shares are held in street or other nominee name, then to the nominee) by the Plan Agent, as dividend
disbursing agent. Shareholders whose common shares are held in the name of a broker or nominee should contact the broker or nominee to determine whether and how they may participate in the Reinvestment Plan.
The Plan Agent serves as agent for the shareholders in administering the Reinvestment Plan. After the Fund declares a Dividend, the
Plan Agent will, as agent for the shareholders, either: (i) receive the cash payment and use it to buy common shares in the open market, on the NYSE or elsewhere, for the participants’ accounts or (ii) distribute newly issued common shares of
the Fund on behalf of the participants.
The Plan Agent will receive cash from the Fund with which to buy common shares
in the open market if, on the Dividend payment date, the NAV per share exceeds the market price per share plus estimated brokerage commissions on that date. The Plan Agent will receive the Dividend in newly issued common shares of the Fund if, on
the Dividend payment date, the market price per share plus estimated brokerage commissions equals or exceeds the NAV per share of the Fund on that date. The number of shares to be issued will be computed at a per share rate equal to the greater of
(i) the NAV or (ii) 95% of the closing market price per share on the payment date.
If the market price per share is
less than the NAV on a Dividend payment date, the Plan Agent will have until the last business day before the next ex-dividend date for the common stock, but in no event more than 30 days after the Dividend payment date (as the case may be, the
Purchase Period), to invest the Dividend amount in shares acquired in open market purchases. If at the close of business on any day during the Purchase Period on which NAV is calculated the NAV equals or is less than the market price per share plus
estimated brokerage commissions, the Plan Agent will cease making open market purchases and the uninvested portion of such Dividends shall be filled through the issuance of new shares of common stock from the Fund at the price set forth in the
immediately preceding paragraph.
Participants in the Reinvestment Plan may withdraw from the Reinvestment Plan upon
notice to the Plan Agent. Such withdrawal will be effective immediately if received not less than ten days prior to a
52
COHEN
& STEERS REIT AND
PREFERRED AND INCOME FUND, INC.
Dividend record date; otherwise, it will be effective for all subsequent Dividends. If any participant elects to have the Plan Agent sell all or
part of his or her shares and remit the proceeds, the Plan Agent is authorized to deduct a $15.00 fee plus $0.10 per share brokerage commissions.
The Plan Agent’s fees for the handling of reinvestment of Dividends will be paid by the Fund. However, each participant will
pay a pro rata share of brokerage commissions incurred with respect to the Plan Agent’s open market purchases in connection with the reinvestment of Dividends. The automatic reinvestment of Dividends will not relieve participants of any income
tax that may be payable or required to be withheld on such Dividends.
The Fund reserves the right to amend or terminate
the Reinvestment Plan. All correspondence concerning the Reinvestment Plan should be directed to the Plan Agent at 800-432-8224.
OTHER INFORMATION
A description of the policies and procedures that the Fund uses to determine how to
vote proxies relating to portfolio securities is available (i) without charge, upon request, by calling 866-227-0757, (ii) on our website at cohenandsteers.com or (iii) on the U.S. Securities and Exchange Commission’s (SEC) website at
http://www.sec.gov. In addition, the Fund’s proxy voting record for the most recent 12-month period ended June 30 is available by August 31 of each year (i) without charge, upon request, by calling
866-227-0757 or (ii) on the SEC’s website at http://www.sec.gov.
Disclosures of the Fund’s complete holdings
are required to be made monthly on Form N-PORT, with every third month made available to the public by the SEC 60 days after the end of the Fund’s fiscal quarter. The Fund’s Form N-PORT is available (i) without charge, upon request,
by calling 866-227-0757 or (ii) on the SEC’s website at http://www.sec.gov.
Please note that distributions
paid by the Fund to shareholders are subject to recharacterization for tax purposes and are taxable up to the amount of the Fund’s investment company taxable income and net realized gains. Distributions in excess of the Fund’s
investment company taxable income and net realized gains are a return of capital distributed from the Fund’s assets. To the extent this occurs, the Fund’s shareholders of record will be notified of the estimated amount of capital returned
to shareholders for each such distribution and this information will also be available at cohenandsteers.com. The final tax treatment of all distributions is reported to shareholders on their 1099-DIV forms, which are mailed after the close of each
calendar year. Distributions of capital decrease the Fund’s total assets and, therefore, could have the effect of increasing the Fund’s expense ratio. In addition, in order to make these distributions, the Fund may have to sell portfolio
securities at a less than opportune time.
Notice is hereby given in accordance with Rule 23c-1 under the 1940 Act that
the Fund may purchase, from time to time, shares of its common stock in the open market.
53
COHEN
& STEERS REIT AND
PREFERRED AND INCOME FUND, INC.
The following information in this annual shareholder report is a summary of certain information about the Fund. This information may not reflect
all of the changes that have occurred since you purchased the Fund.
Changes to the Portfolio Management Team
William F. Scapell has announced his intention to retire from the investment manager on August 1, 2024. Effective
August 1, 2024, William F. Scapell will no longer serve as a portfolio manager of the Fund. Elaine Zaharis-Nikas, Jerry Dorost, Mathew Kirschner, and Jason Yablon will continue to serve as portfolio managers of the Fund.
CURRENT INVESTMENT OBJECTIVES, PRINCIPAL INVESTMENT POLICIES AND PRINCIPAL RISKS OF THE FUND
The information contained herein is provided for informational purposes only and does not constitute a solicitation of an offer to
buy or sell Fund shares.
Investment Objectives
Cohen & Steers REIT and Preferred and Income Fund, Inc. (the Fund) is a diversified,
closed-end management investment company registered under the Investment Company Act of 1940, as amended (the 1940 Act). The Fund’s primary investment objective is high current income. The Fund’s
secondary objective is capital appreciation. The Fund’s investment objectives are considered fundamental and may not be changed without stockholder approval. The Fund’s policy of investing at least 80% of its total assets in common stocks
issued by real estate investment trusts (REITs) and preferred securities may only be changed upon 60 days’ prior written notice to the Fund’s stockholders.
Investment Strategies
Under normal market conditions, the Fund seeks to achieve its objectives through a portfolio of income producing common stock issued by REITs and preferred and other debt securities. Under normal circumstances at least 80% of the
Fund’s total assets will be invested in common stocks issued by REITs and preferred securities. The Fund’s investments in contingent capital securities (sometimes referred to as CoCos) and convertible preferred securities, which are types
of hybrid preferred securities, are considered preferred securities for purposes of this 80% policy.
The investment
manager adheres to a bottom-up, relative value investment process when selecting publicly traded real estate securities. To guide the portfolio construction process, the investment manager utilizes a proprietary valuation model that quantifies
relative valuation of real estate securities based on price-to-net asset value (“NAV”), cash flow multiple/growth ratios and a dividend discount model (“DDM”). Analysts incorporate both quantitative and qualitative analysis in
their NAV, cash flow, growth and DDM estimates. The company research process includes an evaluation of the commercial real estate supply and demand dynamics, management, strategy, property quality, financial strength, and corporate structure.
Judgments with respect to risk control, geographic and property sector diversification, liquidity and other factors are considered along with the models’ output and drive the portfolio managers’ investment decisions.
In making investment decisions with respect to preferred securities and debt securities, the investment manager seeks to select
what it believes are superior securities (i.e., securities the
54
COHEN
& STEERS REIT AND
PREFERRED AND INCOME FUND, INC.
investment manager views as undervalued on the basis of risk and return profiles). In making this determination, the investment manager evaluates
the fundamental characteristics of an issuer, including an issuer’s creditworthiness, and also takes into account prevailing market factors. In analyzing credit quality, the investment manager considers not only fundamental analysis, but also
an issuer’s corporate and capital structure and the placement of the preferred or debt securities within that structure. In evaluating relative value, the investment manager also takes into account call, conversion and other structural security
features, in addition to such factors as the likely directions of credit ratings and relative value versus other income security classes.
The Fund will not seek to achieve specific environmental, social or governance (ESG) outcomes through its portfolio of investments, nor will it pursue an overall impact or sustainable investment strategy. However, the investment
manager will incorporate consideration of relevant ESG factors into its investment decision-making. For example, although the investment manager does not generally exclude investments based on ESG factors alone, when considering an investment
opportunity with material exposure to carbon emissions regulation, this risk may be considered as one factor in the investment manager’s holistic review process.
Under normal market conditions, at least 40%, but no more than 60%, of the Fund’s total assets will be invested in common
stocks issued by real estate companies, consisting primarily of REITs. Substantially all of the common stocks issued by REITs in which the Fund seeks to invest are traded on a national securities exchange or in the over-the-counter market (OTC). The Fund defines a real estate company as a company that derives at least 50% of its revenue from the ownership, construction, financing, management or sale of commercial,
industrial, or residential real estate or has at least 50% of its assets in such real estate. A REIT is a company dedicated to owning, and usually operating, income producing real estate, or to financing real estate. REITs are generally not taxed on
income distributed to shareholders provided they distribute to their shareholders substantially all of their income and otherwise comply with the requirements of the Internal Revenue Code of 1986, as amended (the Code). As a result, REITs generally
pay relatively high dividends (as compared to other types of companies) and the Fund seeks to use these REIT dividends in an effort to meet its primary objective of high current income.
The Fund’s investments in securities of real estate companies may also include private real estate investments. Private real
estate investments include debt or equity investments in private real estate operating companies that own or manage real estate, privately offered REITs, mortgages secured by commercial or residential real estate, securities issued by real estate
companies prior to an IPO, private investments in public equity (PIPEs) and joint ventures which invest in residential and commercial real estate. The Fund expects to invest directly or indirectly in certain real estate and real estate-related
investments through one or more private, wholly owned REIT subsidiaries (each, a REIT Subsidiary). The Fund’s private real estate investments may consist of real estate joint ventures where the Fund (generally through a REIT Subsidiary)
partners with a real estate operator. These investments may include retail, office, hotel, healthcare, multifamily residential, industrial and other properties. The investment manager believes that a REIT Subsidiary will allow it to access more
attractive investment opportunities than would otherwise be the case.
Private real estate investments are generally
less liquid than public real estate investments and may involve complex investment structures. In addition, private real estate investments may have higher capital requirements, and transactions involving this asset class may be more complex than
those of public real estate investments. Making private real estate investments involves a high degree of sophistication, and returns are subject to the skill and decision-making process of the investment manager, as well as local, regional, and
national market conditions. As is common in the real estate
55
COHEN
& STEERS REIT AND
PREFERRED AND INCOME FUND, INC.
industry, many of the Fund’s investments in private real estate will be leveraged. For example, the Fund (through a REIT Subsidiary) expects
to make investments in private real estate investments which obtain debt financing consisting of property level debt. Property level debt will be secured by the real estate owned through private real estate investment. Typically, these investments
would solely own real estate assets and would borrow from a lender using the owned property as mortgage collateral. If one of the Fund’s investments were to default on a loan, the lender’s recourse would be to the mortgaged property and
the lender would typically not have a claim to other assets of the Fund or its subsidiaries. Such property level debt is generally not recourse to the Fund and the Fund will not treat these non-recourse
borrowings as senior securities (as defined in the 1940 Act) for purposes of complying with the 1940 Act’s limitations on leverage unless the financial statements of the entity holding such property-level debt are consolidated with the
Fund’s financial statements. See “Recourse Financings Risk.” The Fund intends to manage its investments to avoid treating such non-recourse borrowings as senior securities, although there is no
guarantee that the Fund will be successful in doing so, and failure to do so may impede the Fund’s ability to achieve its investment objective and decrease returns to shareholders. There is no guarantee that the Fund’s investments will be
able to obtain mortgage loans on attractive terms or at all. In certain limited cases, property level debt may be recourse to the Fund. The Fund’s private real estate investments may also include direct or indirect interests in companies or
properties with highly leveraged capital structures. The cumulative effect of the use of leverage by the Fund or the real estate investments in which the Fund invests could result in substantial losses, exceeding those that would have been incurred
had leverage not been employed. Because of the leveraged nature of the Fund’s private real estate investments, the Fund’s economic exposure to these investments may be greater than the percentage of the Fund’s total assets invested in
such investments.
Under normal market conditions, at least 40%, but no more than 60%, of the Fund’s total assets
will be invested in preferred securities. Preferred securities may pay fixed or floating dividends to investors and have “preference’’ over common stock in the payment of dividends and the liquidation of a company’s assets. This
means that a company must pay dividends on preferred stock before paying dividends on its common stock. Preferred stockholders usually have no right to vote for corporate directors or on other matters. Such securities may include, but are not
limited to, traditional preferred securities; hybrid-preferred securities that have investment and economic characteristics of both preferred stock and debt securities; floating-rate, fixed-to-floating-rate, and fixed-to-fixed preferred securities;
convertible securities; and CoCos. The Fund may also invest up to 10% of its total assets in preferred securities issued by REITs. The Fund may invest in both OTC and exchange-traded preferred securities. The Fund may invest in both taxable
securities (i.e., securities that may pay dividends that are not eligible for the corporate dividends received deduction (DRD) for corporations or for treatment as qualified dividend income (QDI) for individuals) and tax-advantaged preferred
securities (i.e., securities that may pay dividends eligible for the DRD for corporations or for treatment as QDI for individuals).
The Fund also may invest without limit in preferred or other debt securities that at the time of investment are rated below investment grade. These below investment grade quality securities are commonly referred to as “junk
bonds’’ and are regarded as having predominantly speculative characteristics with respect to the payment of interest and repayment of principal. A security will be considered to be investment grade if it is rated as such by one nationally
recognized statistical rating
56
COHEN
& STEERS REIT AND
PREFERRED AND INCOME FUND, INC.
organization (NRSRO) (for example minimum Baa3 or BBB-by Moody’s Investors Services, Inc.
(Moody’s) or S&P Global Ratings (S&P)) or, if unrated, is judged to be investment grade by the investment manager.
The Fund may invest up to 15% of its total assets in illiquid securities. The Board of Directors or its delegate has the ultimate authority to determine, to the extent permissible under the Federal securities laws, which securities
are liquid or illiquid for purposes of this limitation. The Board of Directors has delegated to the investment manager the day-to-day determination of the illiquidity of
any security held by the Fund, although it has retained oversight and ultimate responsibility for such determinations. The Board and/or the investment manager will consider factors such as (i) the nature of the market for a security (including
the institutional private resale market; the frequency of trades and quotes for the security; the number of dealers willing to purchase or sell the security; the amount of time normally needed to dispose of the security; and the method of soliciting
offers and the mechanics of transfer), (ii) the terms of certain securities or other instruments allowing for the disposition to a third party or the issuer thereof (e.g., certain repurchase obligations and demand instruments) and (iii) other
permissible relevant factors. The Fund may also invest in certain restricted securities including securities that are only eligible for resale pursuant to Rule 144A under the Securities Act of 1933 (the Securities Act) (referred to as Rule 144A
Securities) and securities of U.S. and non-U.S. issuers that are issued through private offerings without registration with the Securities and Exchange Commission (the SEC) pursuant to Regulation S under the
Securities Act.
The Fund may invest up to 20% of its total assets in debt securities, including convertible debt
securities. Common stock acquired pursuant to a conversion feature will be subject to this 20% limitation. Convertible preferred stock will not be considered debt securities for the purposes of the 20% limit on debt securities. The Fund may invest
in CoCos. CoCos are debt or preferred securities with loss absorption characteristics that provide for an automatic write-down of the principal amount or value of securities or the mandatory conversion into common shares of the issuer under certain
circumstances. A mandatory conversion might be automatically triggered, for instance, if a company fails to meet the capital minimum described in the security, the company’s regulator makes a determination that the security should convert, or
the company receives specified levels of extraordinary public support. Since the common stock of the issuer may not pay a dividend, investors in these instruments could experience a reduced income rate, potentially to zero, and conversion would
deepen the subordination of the investor (worsening the Fund’s standing in a bankruptcy). In addition, some CoCos provide for an automatic write-down of capital under such circumstances.
The Fund may invest significantly in securities of companies in the financial sector, although it will not invest more than 25% of
its total assets in any single industry within the financial sector. In addition, under normal market conditions the Fund will invest at least 40% of its total assets in common stock issued by real estate companies, consisting primarily of REITs.
This policy of investing in the financial services industry and the Fund’s concentration of its investments in the real estate industry make the Fund more susceptible to adverse economic or regulatory occurrences affecting these sectors.
The Fund may invest up to 50% of the fund’s managed assets in foreign securities, with up to 15% of the
Fund’s managed assets in emerging market issuers.
The Fund will generally not invest more than 10% of its total
assets in the securities of one issuer. The Fund may engage in portfolio trading when considered appropriate, but short-term trading will not be used as the primary means of achieving the Fund’s investment objectives. There are no limits on
portfolio
57
COHEN
& STEERS REIT AND
PREFERRED AND INCOME FUND, INC.
turnover, and investments may be sold without regard to length of time held when, in the opinion of the investment manager, investment
considerations warrant such action. A higher portfolio turnover rate results in correspondingly greater brokerage commissions and other transactional expenses that are borne by the Fund. High portfolio turnover may result in the realization of net
short-term capital gains by the Fund which, when distributed to shareholders, will be taxable as ordinary income.
The
Fund may invest in securities of other investment companies, including open-end funds, closed-end funds or ETFs, such as other funds, to the extent permitted under
Section 12(d)(1) of the 1940 Act, and the rules thereunder, or any exemption granted under the 1940 Act.
The Fund
may invest in mortgage- and asset-backed securities. Mortgage-backed securities are mortgage-related securities issued or guaranteed by the U.S. Government, its agencies and instrumentalities, or issued by
non-government entities. Mortgage related securities represent pools of mortgage loans assembled for sale to investors by various government agencies, as well as by
non-government issuers such as commercial banks, savings and loan institutions, mortgage bankers and private mortgage insurance companies. Although certain mortgage-related securities are guaranteed by a third
party or otherwise similarly secured, the market value of the security, which may fluctuate, is not guaranteed. Other asset-backed securities are structured like mortgage-backed securities, but instead of mortgage loans or interests in mortgage
loans, the underlying assets may include such items as motor vehicle installment sales or installment loan contracts, leases of various types of real and personal property, and receivables from credit card agreements and from sales of personal
property. Regular payments received in respect of such securities include both interest and principal. Asset-backed securities typically have no U.S. Government backing. Additionally, the ability of an issuer of asset-backed securities to enforce
its security interest in the underlying assets may be limited.
The Fund may, but is not required to, use, without
limit, various derivatives transactions described below to seek to generate return, facilitate portfolio management and mitigate risks. Although the investment manager may seek to use these kinds of transactions to further the Fund’s investment
objectives, no assurance can be given that they will achieve this result. The Fund may enter into exchange-listed and over-the-counter put and call options on securities
(including securities of investment companies and baskets of securities), indexes, and other financial instruments; purchase and sell financial futures contracts and options thereon; enter into various interest rate transactions, such as swaps,
caps, floors or collars or credit transactions; equity index, total return and credit default swaps; forward contracts; and structured investments. In addition, the Fund may enter into various currency transactions, such as forward currency
contracts, currency futures contracts, currency swaps or options on currency or currency futures. The Fund also may purchase and sell derivative instruments that combine features of these instruments. The Fund may invest in other types of
derivatives, structured and similar instruments which are not currently available but which may be developed in the future. The Fund may enter into short sales, provided that the dollar amount of short sales at any one time does not exceed 25% of
the net assets of the Fund, and the value of securities of any one issuer in which the Fund is short does not exceed the lesser of 2% of the value of the Fund’s net assets or 2% of the securities of any class of any issuer. These restrictions
do not limit the Fund’s ability to take short positions through transactions other than short sales, such as futures, swaps or other derivatives.
Temporary Defensive Positions. For temporary defensive purposes, the Fund may deviate from its investment objectives and,
among other things, invest all or any portion of its assets in investment grade
58
COHEN
& STEERS REIT AND
PREFERRED AND INCOME FUND, INC.
debt securities, without regard to whether the issuer is a real estate company or REIT. When and to the extent the Fund assumes a temporary
defensive position, the Fund may not pursue or achieve its investment objective.
Real Property Valuation. The
Fund has retained an independent valuation services firm (the Independent Valuation Advisor) to assist the investment manager in the determination of the Funds’ fair value of private real estate investments, including those held through in a
REIT Subsidiary. While the Independent Valuation Advisor will provide valuations of the real property investments, it is not responsible for, and does not calculate, the Fund’s or a REIT Subsidiary’s daily NAV. The Fund’s valuation
policies may change from time to time.
A REIT Subsidiary’s real property investments will primarily be through
joint ventures with an operating partner. The operating partner will be responsible (subject to oversight by the investment manager) for maintaining the joint venture’s official books and records along with other pertinent information that will
be the basis upon which the Independent Valuation Advisor will prepare their appraisals as described below.
The
Independent Valuation Advisor is expected to administer the real property valuation process for investments held by a REIT Subsidiary and is expected to select (subject to the investment manager’s approval) and manage the process associated
with third-party appraisal firms with respect to the valuation of the Fund’s real property investments.
Investments in newly acquired properties are expected to be initially valued at cost. Each property is then expected to be valued
by an independent third-party appraisal firm within approximately 90 to 120 days after it was acquired and no less than annually thereafter. Each third-party appraisal will be reviewed by the Independent Valuation Advisor and the Valuation Committee
for reasonableness. Each month, the investment manager, with the assistance of the Independent Valuation Advisor, will determine an accrual schedule for the daily value of each real property investment based on an estimated month-end income accrual
for each real property. The Fund expects that a REIT Subsidiary will use the daily values determined in such accrual schedule for purposes of calculating its NAV. Any material changes to the valuation of real property investments of such REIT
Subsidiary, and related changes to the daily accrual schedule for any real property investment, will be reflected in the NAV calculation beginning with the first NAV calculated after a revised valuation is determined and approved by the CNS
Valuation Committee.
The investment manager will monitor for material events that the investment manager believes may
be expected to have a material impact on the most recent estimated fair values of such real property investment. Possible examples of such a material change include an unexpected termination or renewal of a material lease, a material change in
vacancies, an unanticipated structural or environmental event at a property, capital market events, tenant bankruptcy, recent financial results or changes in the capital structure of the property, terrorism events, natural disasters or other force
majeure events, any regulatory changes that affect the investment, or a significant industry event or adjustment to the industry outlook that may cause the value of real property to change materially. Upon the occurrence of such a material event
that is likely to have a material impact on the most recent estimated values of the impacted real property investments and provided that the investment manager is aware that such event has occurred, the investment manager will instruct the
Independent Valuation Advisor to evaluate the impact of the event on the fair value of such investment. However, rapidly changing market conditions or material events may not be immediately reflected in the Fund’s or a REIT Subsidiary’s
daily NAV.
59
COHEN
& STEERS REIT AND
PREFERRED AND INCOME FUND, INC.
The investment manager will value the real properties using the valuation methodology it deems most appropriate and consistent with
industry best practices and market conditions. The investment manager expects the primary methodology used to value real property investments will be the income approach, whereby value is derived by determining the present value of an asset’s
stream of future cash flows (for example, discounted cash flow analysis). Consistent with industry practices, the income approach incorporates actual contractual lease income, professional judgments regarding comparable rental and operating expense
data, the capitalization or discount rate and projections of future rent and expenses based on appropriate market evidence, and other subjective factors. Other methodologies that may also be used to value properties include, among other approaches,
sales comparisons and cost approaches.
Real estate appraisals are reported on a free and clear basis (i.e. any
property-level indebtedness that may be in place is not incorporated into the valuation). Property level debt will be valued separately in accordance with GAAP. Real properties held through joint ventures generally will be valued in a manner that is
consistent with the methods described above. Once the value of a real property held by the joint venture and the fair value of any other assets and liabilities of the joint venture is determined, the value of a REIT Subsidiary’s interest in the
joint venture would then be determined by the investment manager using a hypothetical liquidation calculation to value such REIT Subsidiary’s interest in the joint venture.
Use of Leverage
The Fund currently seeks to enhance the level of its distributions and total return through the use of leverage. The Fund may
utilize leverage in an amount up to 33 1/3% (measured immediately after such borrowings) of its managed assets through borrowings, including loans from certain financial institutions and/or the issuance of debt securities (collectively, Borrowings).
Under the 1940 Act, the Fund may utilize leverage through (i) Borrowings in an aggregate amount of up to 33 1/3% of the Fund’s total assets immediately after such Borrowings and (ii) the issuance of preferred stock (Preferred Shares)
in an aggregate amount of up to 50% of the Fund’s total assets immediately after such issuance. In addition, the Fund may utilize leverage through reverse repurchase agreements (Reverse Repurchase Agreements). The Fund also may borrow money as
a temporary measure for extraordinary or emergency purposes, including the payment of dividends and the settlement of securities transactions.
The Fund may also engage in various derivatives transactions to seek to generate return, facilitate portfolio management and
mitigate risks. Certain derivatives transactions effect a form of economic leverage on the Fund’s portfolio and may be subject to the risks associated with the use of leverage. There is no assurance that the Fund will utilize leverage or, if
leverage is utilized, that it will be successful. The net asset value of the Fund’s common shares may be reduced by the issuance or incurrence costs of any leverage. See “Leverage Risk.”
Effects of Leverage.
Assuming that leverage in the form of Borrowings will represent up to 31% of the Fund’s managed assets and charge interest or involve payment at a rate set by an interest rate transaction at an annual rate of approximately 6.3%
(rate at December 31, 2023), the income generated by the Fund’s portfolio (net of estimated expenses) must exceed 1.96% in order to cover such interest payments or payment rates and other expenses specifically related to leverage. Of
course, these numbers are merely
60
COHEN
& STEERS REIT AND
PREFERRED AND INCOME FUND, INC.
estimates, used for illustration. Actual interest, or payment rates may vary frequently and may be significantly higher or lower than the rate
estimated above.
The following table is furnished in response to requirements of the SEC. It is designed to illustrate
the effect of leverage on common share total return, assuming investment portfolio total returns (comprised of income and changes in the value of investments held in the Fund’s portfolio) of -10%, -5%, 0%, 5% and 10%. These assumed investment portfolio returns are hypothetical figures and are not necessarily indicative of the investment portfolio returns expected to be experienced by the Fund. The table
assumes leverage in an aggregate amount equal to 31% of the Fund’s managed assets. See “Leverage Risk” below.
|
|
|
|
|
|
|
|
|
|
|
|
|
|
|
|
|
|
|
|
|
| Assumed Portfolio Total Return |
|
|
-10 |
% |
|
|
-5 |
% |
|
|
0 |
% |
|
|
5 |
% |
|
|
10 |
% |
| Common Share Total Return |
|
|
(17.3) |
% |
|
|
(10.1) |
% |
|
|
(2.8) |
% |
|
|
4.4 |
% |
|
|
11.7 |
% |
Common share total return is comprised of two elements–the net investment income of the Fund
after paying expenses, including interest expenses on the Fund’s Borrowings as described above and dividend payments on any preferred shares issued by the Fund and gain and losses on the value of the securities the Fund owns. As required by the
rules of the SEC, the table assumes the Fund is more likely to suffer capital losses than to enjoy capital appreciation. For example, to assume a total return of 0%, the Fund must assume that the income it receives on its investments is entirely
offset by losses in the value of those securities.
Principal Risks of the Fund
The Fund is a diversified, closed-end management investment company designed primarily as a
long-term investment and not as a trading vehicle. The Fund is not intended to be a complete investment program and, due to the uncertainty inherent in all investments, there can be no assurance that the Fund will achieve its investment objectives.
Risk of Market Price Discount from Net Asset Value. Shares of closed-end
investment companies frequently trade at a discount from their net asset value (NAV). This characteristic is a risk separate and distinct from the risk that NAV could decrease as a result of investment activities and may be greater for investors
expecting to sell their shares in a relatively short period following completion of this offering. Whether investors will realize gains or losses upon the sale of the shares will depend not upon the Fund’s NAV but entirely upon whether the
market price of the shares at the time of sale is above or below the investor’s purchase price for the shares. Because the market price of the shares is determined by factors such as relative supply of and demand for shares in the market,
general market and economic conditions, and other factors beyond the control of the Fund, Fund shares may trade at, above or below NAV, or at below or above the initial public offering price.
Investment Risk. An investment in the Fund is subject to investment risk, including the possible loss of the entire
principal amount that you invest.
Market Risk. Your investment in the Fund represents an indirect investment in
the securities owned by the Fund, a significant portion of which are traded on a national securities exchange or in the OTC markets. The value of these securities, like other investments, may move up or down, sometimes rapidly and unpredictably. The
Fund may utilize leverage, which magnifies this risk. Your shares at any point in time may be worth less than what you invested, even after taking into account the reinvestment of Fund dividends and distributions. See “Leverage Risk”
below.
61
COHEN
& STEERS REIT AND
PREFERRED AND INCOME FUND, INC.
Real Estate Market Risk. The Fund will not invest in real estate directly, but may invest in securities issued by real
estate companies, including REITs. Therefore, the Fund is also subject to the risks associated with the direct ownership of real estate. These risks include:
| |
• |
|
declines in the value of real estate; |
| |
• |
|
risks related to general and local economic conditions; |
| |
• |
|
possible lack of availability of mortgage funds; |
| |
• |
|
extended vacancies of properties; |
| |
• |
|
increases in property taxes and operating expenses; |
| |
• |
|
changes in zoning laws; |
| |
• |
|
losses due to costs resulting from the clean-up of
environmental problems; |
| |
• |
|
liability to third parties for damages resulting from environmental problems;
|
| |
• |
|
casualty or condemnation losses; |
| |
• |
|
changes in neighborhood values and the appeal of properties to tenants; |
| |
• |
|
changes in interest rates; |
| |
• |
|
failure of borrowers to pay their loans; |
| |
• |
|
early payment or restructuring of mortgage loans; |
| |
• |
|
slower mortgage origination; and |
| |
• |
|
rising construction costs. |
REIT Risk. In addition to the risks of securities linked to the real estate industry, REITs are subject to certain other
risks related to their structure and focus. REITs generally are dependent upon management skills and may not be diversified. REITs are also subject to heavy cash flow dependency, defaults by borrowers and self-liquidation. In addition, REITs could
possibly fail to (i) qualify for favorable tax treatment under applicable tax law, or (ii) maintain their exemptions from registration under the 1940 Act. The above factors may also adversely affect a borrower’s or a lessee’s
ability to meet its obligations to the REIT. In the event of a default by a borrower or lessee, the REIT may experience delays in enforcing its rights as a mortgagee or lessor and may incur substantial costs associated with protecting its
investments.
Preferred Securities Risk. There are various risks associated with investing in preferred
securities, including those described below. In addition, the on-going COVID-19 outbreak has increased certain risks associated with investing in preferred securities.
The impact of the COVID-19 outbreak could persist for years to come and the full impact to financial markets is not yet known. See “Geopolitical Risk” below for additional information regarding the
COVID-19 outbreak.
| |
• |
|
Deferral and Omission Risk. Preferred securities may include provisions that permit the
issuer, at its discretion, to defer or omit distributions for a stated period without any adverse |
62
COHEN
& STEERS REIT AND
PREFERRED AND INCOME FUND, INC.
| |
consequences to the issuer. In certain cases, deferring or omitting distributions may be mandatory. If the Fund owns a preferred security that is deferring its distributions, the Fund may be required to report
income for tax purposes although it has not yet received such income. In addition, recent changes in bank regulations may increase the likelihood for issuers to defer or omit distributions. |
| |
• |
|
Credit and Subordination Risk. Credit risk is the risk that a preferred security in the
Fund’s portfolio will decline in price or the issuer of the security will fail to make dividend, interest or principal payments when due because the issuer experiences a decline in its financial status. Preferred securities are generally
subordinated to bonds and other debt instruments in a company’s capital structure in terms of having priority to corporate income, claims to corporate assets and liquidation payments, and therefore will be subject to greater credit risk than
more senior debt instruments. |
| |
• |
|
Interest Rate Risk. Interest rate risk is the risk that preferred securities will decline in
value because of changes in market interest rates. When market interest rates rise, the market value of such securities generally will fall, and therefore the Fund may underperform during periods of rising interest rates. The Fund may be subject to
a greater risk of rising interest rates than would normally be the case due to the current period of historically low rates and the effect of government monetary policy initiatives and resulting market reaction to those initiatives. Preferred
securities without maturities or with longer periods before maturity may be more sensitive to interest rate changes. |
| |
• |
|
Prepayment and Extension Risk. Prepayment risk is the risk that changes in interest rates,
credit spreads or other factors will result in the call (repayment) of a preferred security more quickly than expected, such that the Fund may have to invest the proceeds in lower yielding securities, or that expectations of such early call will
negatively impact the market price of the security. Extension risk is the risk that changes in the interest rates or credit spreads may result in diminishing call expectations, which can cause prices to fall. |
| |
• |
|
Floating-Rate and
Fixed-to-Floating-Rate Securities Risk. The market value of floating-rate securities is a reflection of discounted expected cash flows based on expectations for
future interest rate resets. The market value of such securities may fall in a declining interest rate environment and may also fall in a rising interest rate environment if there is a lag between the rise in interest rates and the reset. This risk
may also be present with respect to fixed-to-floating-rate securities in which the Fund may invest. A secondary risk associated with declining interest rates is the risk
that income earned by the Fund on floating-rate and fixed-to-floating-rate securities will decline due to lower coupon payments on floating-rate securities.
|
| |
• |
|
Call, Reinvestment and Income Risk. During periods of declining interest rates, an issuer may
be able to exercise an option to redeem its issue at par earlier than scheduled which is generally known as call risk. Recent regulatory changes may increase call risk with respect to certain types of preferred securities. If this occurs, the Fund
may be forced to reinvest in lower yielding securities. This is known as reinvestment risk. Preferred securities frequently have call features that allow the issuer to repurchase the security prior to its stated maturity. An issuer may redeem
preferred securities if the issuer can refinance the preferred securities at a lower cost due to declining interest rates or an improvement in the credit standing of the issuer, or in the event of regulatory changes affecting the capital treatment
of a security. Another risk |
63
COHEN
& STEERS REIT AND
PREFERRED AND INCOME FUND, INC.
| |
associated with a declining interest rate environment is that the income from the Fund’s portfolio may decline over time when the Fund invests the proceeds from new share sales at market rates that are
below the portfolio’s current earnings rate. |
| |
• |
|
Liquidity Risk. Certain preferred securities may be substantially less liquid than many other
securities, such as common stocks or U.S. government securities. Illiquid securities involve the risk that the securities will not be able to be sold at the time desired by the Fund or at prices approximating the value at which the Fund is carrying
the securities on its books. |
| |
• |
|
Limited Voting Rights Risk. Generally, traditional preferred securities offer no voting rights
with respect to the issuer unless preferred dividends have been in arrears for a specified number of periods, at which time the preferred security holders may elect a number of directors to the issuer’s board of directors. Generally, once all
the arrearages have been paid, the preferred security holders no longer have voting rights. Hybrid-preferred security holders generally have no voting rights. |
| |
• |
|
Special Redemption Rights. In certain varying circumstances, an issuer of preferred securities
may redeem the securities prior to a specified date. For instance, for certain types of preferred securities, a redemption may be triggered by a change in U.S. federal income tax or securities laws. As with call provisions, a redemption by the
issuer may have a negative impact on the return of the security held by the Fund. See “Call, Reinvestment and Income Risk” above and “Regulatory Risk” below. |
| |
• |
|
New Types of Securities. From time to time, preferred securities, including hybrid-preferred
securities and contingent capital securities, have been, and may in the future be, offered having features other than those described herein. The Fund reserves the right to invest in these securities if the investment manager believes that doing so
would be consistent with the Fund’s investment objectives and policies. Since the market for these instruments would be new, the Fund may have difficulty disposing of them at a suitable price and time. In addition to limited liquidity, these
instruments may present other risks, such as high price volatility. |
Debt Securities
Risk. Debt securities generally present two primary types of risk—credit risk, which refers to the possibility that the issuer of a security will not be able to make payments of interest and principal when due, and interest rate
risk, which is the risk that debt securities will decline in value because of changes in market interest rates. Debt securities also are subject to other similar risks as preferred securities, including call risk, extension risk and liquidity risk.
Convertible Securities Risk. Although to a lesser extent than with
non-convertible fixed-income securities, the market value of convertible securities tends to decline as interest rates increase and, conversely, tends to increase as interest rates decline. In addition,
because of the conversion feature, the market value of convertible securities tends to vary with fluctuations in the market value of the underlying common stock. A unique feature of convertible securities is that as the market price of the
underlying common stock declines, convertible securities tend to trade increasingly on a yield basis, and so may not experience market value declines to the same extent as the underlying common stock. When the market price of the underlying common
stock increases, the prices of the convertible securities tend to rise as a reflection of the value of the underlying common stock. While no securities investments are without risk, investments in convertible securities generally entail less risk
than investments in common stock of the same issuer.
64
COHEN
& STEERS REIT AND
PREFERRED AND INCOME FUND, INC.
Below Investment Grade Securities Risk. The Fund may invest in below investment grade securities or securities that are
unrated but judged to be below investment grade by the investment manager. Below investment grade securities, or equivalent unrated securities, generally involve greater volatility of price and risk of loss of income and principal, and may be more
susceptible to real or perceived adverse economic and competitive industry conditions than higher grade securities. It is reasonable to expect that any adverse economic condition could disrupt the market for below investment grade securities, have
an adverse impact on the value of those securities and adversely affect the ability of the issuers of those securities to repay principal and interest on those securities.
Contingent Capital Securities Risk. Contingent capital securities (sometimes referred to as CoCos) are debt or preferred
securities with loss absorption characteristics built into the terms of the security for the benefit of the issuer, for example, an automatic write-down of principal or a mandatory conversion into common stock of the issuer under certain
circumstances, such as the issuer’s capital ratio falling below a certain level. CoCos may be subject to an automatic write-down (i.e., the automatic write-down of the principal amount or value of the securities, potentially to zero, and the
cancellation of the securities) under certain circumstances, which could result in the Fund losing a portion or all of its investment in such securities. In addition, the Fund may not have any rights with respect to repayment of the principal amount
of the securities that has not become due or the payment of interest or dividends on such securities for any period from (and including) the interest or dividend payment date falling immediately prior to the occurrence of such automatic write-down.
An automatic write-down could also result in a reduced income rate if the dividend or interest payment is based on the security’s par value. If a CoCo provides for mandatory conversion of the security into common stock of the issuer under
certain circumstances, such as an adverse event, the Fund could experience a reduced income rate, potentially to zero, as a result of the issuer’s common stock not paying a dividend. In addition, a conversion event would likely be the result of
or related to the deterioration of the issuer’s financial condition (e.g., such as a decrease in the issuer’s capital ratio) and status as a going concern, so the market price of the issuer’s common stock received by the Fund may have
declined, perhaps substantially, and may continue to decline, which may adversely affect the Fund’s NAV. Further, the issuer’s common stock would be subordinate to the issuer’s other security classes and therefore worsen the
Fund’s standing in a bankruptcy proceeding. In March 2023, a Swiss regulator required a write-down of outstanding CoCos to zero notwithstanding the fact that the equity shares continued to exist and have economic value. It is currently unclear
whether regulators of issuers in other jurisdictions will take similar actions. Notwithstanding these risks, the Fund intends to continue to invest in CoCos issued by Swiss companies and by companies in other jurisdictions. In addition, most CoCos
are considered to be high yield or “junk” securities and are therefore subject to the risks of investing in below investment grade securities. Finally, CoCo issuers can, at their discretion, suspend dividend distributions on their CoCo
securities and are more likely to do so in response to negative economic conditions and/or government regulation. Omitted distributions are typically non-cumulative and will not be paid on a future date. Any
omitted distribution may negatively impact the returns or distribution rate of the Fund.
Small-And Medium-Sized Companies Risk. Real estate companies in the industry tend to be small-to medium-sized companies in relation to the equity markets as a whole. There may be
less trading in a smaller company’s stock, which means that buy and sell transactions in that stock could have a larger impact on the stock’s price than is the case with larger company stocks. Smaller companies also may have fewer lines of
business so that changes in any one line of business may have a greater impact on a smaller company’s stock price than is the case for a larger company. Further, smaller company stocks
65
COHEN
& STEERS REIT AND
PREFERRED AND INCOME FUND, INC.
may perform differently in different cycles than larger company stocks. Accordingly, real estate company shares can, and at times will, perform
differently than large company stocks.
Common Stock Risk. The Fund may invest in common stocks. Common stocks
are subject to special risks. Although common stocks have historically generated higher average returns than fixed-income securities over the long-term, common stocks also have experienced significantly more volatility in returns. Common stocks may
be more susceptible to adverse changes in market value due to issuer specific events or general movements in the equities markets. A drop in the stock market may depress the price of common stocks held by the Fund. Common stock prices fluctuate for
many reasons, including changes to investors’ perceptions of the financial condition of an issuer or the general condition of the relevant stock market, or the occurrence of political or economic events affecting issuers. For example, an
adverse event, such as an unfavorable earnings report, may depress the value of common stock in which the Fund has invested; the price of common stock of an issuer may be particularly sensitive to general movements in the stock market; or a drop in
the stock market may depress the price of most or all of the common stocks held by the Fund. Also, common stock of an issuer in the Fund’s portfolio may decline in price if the issuer fails to make anticipated dividend payments because, among
other reasons, the issuer of the security experiences a decline in its financial condition. The common stocks in which the Fund will invest are typically subordinated to preferred securities, bonds and other debt instruments in a company’s
capital structure in terms of priority to corporate income and assets, and, therefore, will be subject to greater risk than the preferred securities or debt instruments of such issuers. In addition, common stock prices may be sensitive to rising
interest rates as the costs of capital rise and borrowing costs increase.
Financials Sector Risk. To the extent
the Fund invests in the financials sector, it will be more susceptible to adverse economic or regulatory occurrences affecting this sector, such as changes in interest rates, loan concentration and competition. In addition, the Fund will also be
subject to the risks of investing in the individual industries and securities that comprise the financials sector, including the bank, diversified financial services, credit card and insurance industries.
Derivatives and Hedging Transactions Risk. The Fund’s use of derivatives, including for the purpose of hedging interest
rate or foreign currency risks and managing the Fund’s duration, presents risks different from, and possibly greater than, the risks associated with investing directly in traditional securities. In certain types of derivatives transactions
the Fund could lose the entire amount of its investment; in other types of derivatives transactions the potential loss is theoretically unlimited. Although both OTC and exchange-traded derivatives markets may experience lack of liquidity, OTC non-standardized derivatives transactions are generally less liquid than exchange-traded instruments. In addition, the liquidity of a secondary market in an exchange-traded derivative contract may be adversely
affected by “daily price fluctuation limits” established by the exchanges which once reached, would prevent the liquidation of open positions. If it is not possible to close an open derivative position entered into by the Fund, the Fund
may be required to make cash payments of variation (or mark-to-market) margin and, if the Fund has insufficient cash, it may have to sell portfolio securities to meet
variation margin requirements at a time when it may be disadvantageous to do so. The inability to close derivatives transactions positions also could have an adverse impact on the Fund’s ability to effectively hedge its portfolio. Derivatives
transactions entered into to seek to manage the risks of the Fund’s portfolio of securities may have the effect of limiting gains from otherwise favorable market movements. The use of derivatives transactions may result in losses greater than
if they had not been
66
COHEN
& STEERS REIT AND
PREFERRED AND INCOME FUND, INC.
used. The Fund may enter into swap, cap or other transactions to attempt to protect itself from increasing interest or dividend expenses resulting
from increasing short-term interest rates on any leverage it incurs or increasing interest rates on securities held in its portfolio. A decline in interest rates may result in a decline in the value of the transaction, which may result in a decline
in the NAV of the Fund. In the event the Fund enters into forward currency contracts for hedging purposes, the Fund will be subject to currency exchange rates risk. Currency exchange rates may fluctuate significantly over short periods of time and
also can be affected unpredictably by intervention of U.S. or foreign governments or central banks, or the failure to intervene, or by currency controls or political developments in the United States or abroad. Furthermore, the ability to
successfully use derivative instruments depends on the ability of the investment manager to predict pertinent market movements, which cannot be assured. Structured notes and other related instruments carry risks similar to those of more traditional
derivatives such as futures, forward and option contracts. However, structured instruments may entail a greater degree of market risk and volatility than other types of debt obligations. The Fund will be subject to credit risk with respect to the
counterparties to certain derivatives transactions entered into by the Fund and may experience losses in the event a counterparty fails to perform its obligations under a derivative contract.
The investment manager is registered with the Commodity Futures Trading Commission as a commodity pool operator (“CPO”).
However, with respect to the Fund, the investment manager has claimed an exclusion from the definition of the CPO under the Commodity Exchange Act, as amended (the “CEA”). Accordingly, the investment manager, with respect to the Fund, is
not subject to registration or regulation as a CPO under the CEA.
Options Risk. Gains on options transactions
depend on the investment manager’s ability to predict correctly the direction of stock prices, indexes, interest rates, and other economic factors, and unanticipated changes may cause poorer overall performance for the Fund than if it had not
engaged in such transactions. A rise in the value of the security or index underlying a call option written by the Fund exposes the Fund to possible loss or loss of opportunity to realize appreciation in the value of any portfolio securities
underlying or otherwise related to the call option. By writing a put option, the Fund assumes the risk of a decline in the underlying security or index. There can be no assurance that a liquid market will exist when the Fund seeks to close out an
option position, and for certain options not traded on an exchange no market usually exists. Trading could be interrupted, for example, because of supply and demand imbalances arising from a lack of either buyers or sellers, or an options exchange
could suspend trading after the price has risen or fallen more than the maximum specified by the exchange.
Although the
Fund may be able to offset to some extent any adverse effects of being unable to liquidate an option position, that Fund may experience losses in some cases as a result of such inability, may not be able to close its position and, in such an event
would be unable to control its losses.
Interest Rate Transactions Risk. The Fund may enter into a swap or cap
transaction to attempt to protect itself from increasing dividend or interest expenses resulting from increasing short-term interest rates. A decline in interest rates may result in a decline in the value of the swap or cap, which may result in a
decline in the net asset value of the Fund. A sudden and dramatic decline in interest rates may result in a significant decline in the net asset value of the Fund.
Counterparty Risk. The Fund will be subject to credit risk with respect to the counterparties to derivatives transactions
entered into by the Fund. If a counterparty, including a futures commission
67
COHEN
& STEERS REIT AND
PREFERRED AND INCOME FUND, INC.
merchant or central clearing party, becomes bankrupt or otherwise fails to perform its obligations under a derivative contract due to financial
difficulties, the Fund may experience significant delays in obtaining any recovery under the derivative contract in bankruptcy or other reorganization proceeding. The Fund may obtain only a limited recovery or may obtain no recovery in such
circumstances.
Foreign (Non-U.S.) and Emerging Market Securities Risk.
Risks of investing in foreign securities, which can be expected to be greater for investments in emerging markets, include currency risks, future political and economic developments and possible imposition of foreign withholding or other taxes on
income or proceeds payable on the securities. In addition, there may be less publicly available information about a foreign issuer than about a domestic issuer, and foreign issuers may not be subject to the same accounting, auditing and financial
recordkeeping standards and requirements as domestic issuers.
Securities of companies in emerging markets may be more
volatile than those of companies in more developed markets. Emerging market countries generally have less developed markets and economies and, in some countries, less mature governments and governmental institutions. Political developments in
foreign countries or the United States may at times subject such countries to sanctions from the U.S. government, foreign governments and/or international institutions that could negatively affect a Fund’s investments in issuers located in,
doing business in or with assets in such countries. Investing in securities of companies in emerging markets may entail special risks relating to potential economic, political or social instability and the risks of expropriation, nationalization,
confiscation, trade sanctions or embargoes or the imposition of restrictions on foreign investment, the lack of hedging instruments, and repatriation of capital invested. The securities and real estate markets of some emerging market countries have
in the past experienced substantial market disruptions and may do so in the future. The economies of many emerging market countries may be heavily dependent on international trade and have thus been, and may continue to be, adversely affected by
trade barriers, foreign exchange controls and other protectionist measures imposed or negotiated by the countries with which they wish to trade.
Foreign Currency Risk. Although the Fund will report its NAV and pay dividends in U.S. dollars, foreign securities often are
purchased with and make any dividend and interest payments in foreign currencies. Therefore, the Fund’s investments in foreign securities will be subject to foreign currency risk, which means that the Fund’s NAV could decline solely as a
result of changes in the exchange rates between foreign currencies and the U.S. dollar. Certain foreign countries may impose restrictions on the ability of issuers of foreign securities to make payment of principal, dividends and interest to
investors located outside the country, due to blockage of foreign currency exchanges or otherwise. The Fund may, but is not required to, engage in various investments that are designed to hedge the Fund’s foreign currency risks, and such
investments are subject to the risks described under “Derivatives and Hedging Transactions Risk” above.
Foreign currency forward contracts, OTC options on foreign currencies and foreign currency swaps are subject to the risk of default
by the counterparty and can be illiquid. These currency hedging transactions, as well as the futures contracts and exchange-listed options in which the Fund may invest, are subject to many of the risks of, and can be highly sensitive to changes in
the value of, the related currency or other reference asset. As such, a small investment could have a potentially large impact on the Fund’s performance. Whether or not the Fund engages in currency hedging transactions, the Fund may experience
a decline in the value of its portfolio securities, in U.S. dollar terms, due solely to
68
COHEN
& STEERS REIT AND
PREFERRED AND INCOME FUND, INC.
fluctuations in currency exchange rates. Use of currency hedging transactions may cause the Fund to experience losses greater than if the Fund had
not engaged in such transactions.
The Fund’s transactions in foreign currencies may increase or accelerate the
Fund’s recognition of ordinary income and may affect the timing or character of the Fund’s distributions
Leverage Risk. The use of leverage is a speculative technique and there are special risks and costs associated with
leverage. The NAV of the Fund’s shares may be reduced by the issuance and ongoing costs of leverage. So long as the Fund is able to invest in securities that produce an investment yield that is greater than the total cost of leverage, the
leverage strategy will produce higher current net investment income for the shareholders. On the other hand, to the extent that the total cost of leverage exceeds the incremental income gained from employing such leverage, shareholders would realize
lower net investment income. In addition to the impact on net income, the use of leverage will have an effect of magnifying capital appreciation or depreciation for shareholders. Specifically, in an up market, leverage will typically generate
greater capital appreciation than if the Fund were not employing leverage. Conversely, in down markets, the use of leverage will generally result in greater capital depreciation than if the Fund had been unlevered. To the extent that the Fund is
required or elects to reduce its leverage, the Fund may incur applicable breakage fees under the Fund’s credit arrangement and may need to liquidate investments, including under adverse economic conditions which may result in capital losses
potentially reducing returns to shareholders. The use of leverage also results in the investment management fees payable to the investment manager being higher than if the Fund did not use leverage and can increase operating costs, which may reduce
total return. In some market conditions, the Fund may not be able to employ leverage to the extent or at the cost desired. This could prevent the Fund from executing its portfolio strategies or could otherwise depress shareholder returns. There can
be no assurance that a leveraging strategy will be successful during any period in which it is employed.
Other
Investment Companies Risk. To the extent the Fund invests a portion of its assets in investment companies, including open-end funds, closed-end funds, ETFs and other
types of pooled investment funds, those assets will be subject to the risks of the purchased investment companies’ portfolio securities, and a shareholder in the Fund will bear not only his or her proportionate share of the Fund’s
expenses, but also indirectly the expenses of the purchased investment companies. Shareholders would therefore be subject to duplicative expenses to the extent the Fund invests in other investment companies. Risks associated with investments in closed-end funds also generally include the risks associated with the Fund’s structure as a closed-end investment company, including market risk, leverage risk, risk of
market price discount from NAV, risk of anti-takeover provisions and non-diversification. In addition, investments in closed-end funds may be subject to dilution risk,
which is the risk that strategies employed by a closed-end fund, such as rights offerings, may, under certain circumstances, have the effect of reducing its share price and the Fund’s proportionate
interest. In addition, restrictions under the 1940 Act may limit the Fund’s ability to invest in other investment companies to the extent desired.
The SEC has adopted Rule 12d1-4 permitting fund of fund arrangements subject to various
conditions, and rescinding the present rule and certain exemptive relief previously granted. Once in effect, Rule 12d1-4 may adversely affect the Fund’s ability to invest in other investment companies and
could also significantly affect the Fund’s ability to redeem its investments in other investment companies, making such investments less attractive. The effects of rule and other regulatory changes are not known as of the date of this report,
but they could impact the Fund’s ability to achieve its desired
69
COHEN
& STEERS REIT AND
PREFERRED AND INCOME FUND, INC.
investment strategies or cause the Fund to incur losses, realize taxable gains distributable to shareholders, incur greater or unexpected expenses
or experience other adverse consequences.
Restricted and Illiquid Securities Risk. The Fund may invest in
investments that may be illiquid (i.e., securities that may be difficult to sell at a desirable time or price). Illiquid securities are securities that are not readily marketable and may include some restricted securities, which are
securities that may not be resold to the public without an effective registration statement under the Securities Act or, if they are unregistered, may be sold only in a privately negotiated transaction or pursuant to an exemption from registration.
Illiquid investments involve the risk that the securities will not be able to be sold at the time desired by the Fund or at prices approximating the value at which the Fund is carrying the securities on its books. Restricted securities and illiquid
securities are often more difficult to value and the sale of such securities often requires more time and results in higher brokerage charges or dealer discounts and other selling expenses than does the sale of liquid securities trading on national
securities exchanges or in the OTC markets. Contractual restrictions on the resale of securities result from negotiations between the issuer and purchaser of such securities and therefore vary substantially in length and scope. To dispose of a
restricted security that the Fund has a contractual right to sell, the Fund may first be required to cause the security to be registered. A considerable period may elapse between a decision to sell the securities and the time when the Fund would be
permitted to sell, during which time the Fund would bear market risks.
Rule 144A Securities Risk. Rule 144A
Securities are considered restricted securities because they are not registered for sale to the general public and may only be resold to certain qualified institutional buyers. Institutional markets for Rule 144A Securities that exist or may develop
may provide both readily ascertainable values for such securities and the ability to promptly sell such securities. However, if there are an insufficient number of qualified institutional buyers interested in purchasing Rule 144A Securities held by
the Fund, the Fund will be subject to liquidity risk and thus may not be able to sell the Rule 144A Securities at a desirable time or price.
Regulation S Securities Risk. Regulation S securities are offered through non-U.S. offerings without registration with the SEC pursuant to Regulation S of the Securities Act. Regulation
S securities may be relatively less liquid as a result of legal or contractual restrictions on resale. Because Regulation S securities are generally less liquid than registered securities, the Fund may take longer to liquidate these positions than
publicly traded securities or may not be able to sell them at the price desired. Furthermore, companies whose securities are not publicly traded may not be subject to the disclosure and other investor protection requirements that would be applicable
if their securities were publicly traded or otherwise offered in the United States. Accordingly, Regulation S securities may involve a high degree of business and financial risk and may result in losses to the Fund.
Private Real Estate Risk. The Fund’s investments in private real estate include additional risks. For example, lease
defaults, terminations by one or more tenants or landlord-tenant disputes may reduce the Fund’s revenues and net income. Any of these situations may result in extended periods during which there is a significant decline in revenues or no
revenues generated by a property. If this occurred, it could adversely affect the Fund’s results of operations.
The Fund’s financial position and its ability to make distributions may also be adversely affected by financial difficulties
experienced by any major tenants, including bankruptcy, insolvency or a general downturn in the business, or in the event any major tenants do not renew or extend their relationship as their lease terms expire. A tenant in bankruptcy may be able to
restrict the ability to collect unpaid rents
70
COHEN
& STEERS REIT AND
PREFERRED AND INCOME FUND, INC.
or interest during the bankruptcy proceeding. Furthermore, dealing with a tenants’ bankruptcy or other default may divert management’s
attention and cause the Fund to incur substantial legal and other costs.
The Fund’s investments in real estate
will be pressured in challenging economic and rental market conditions. If the private real estate investment is unable to re-let or renew leases for all or substantially all of the space at these properties,
if the rental rates upon such renewal or re-letting are significantly lower than expected, or if the investment’s reserves for these purposes prove inadequate, the Fund will experience a reduction in net
income and may be required to reduce or eliminate cash distributions.
The Fund may obtain only limited warranties when
it purchases an equity investment in private commercial real estate. The purchase of properties with limited warranties increases the risk that the Fund may lose some or all of its invested capital in the property, as well as the loss of rental
income from that property if an issue should arise that decreases the value of that property and is not covered by the limited warranties. If any of these results occur, it may have a material adverse effect on the Fund’s business, financial
condition and results of operations and the Fund’s ability to make distributions.
The Fund’s investments in
private real estate are expected to be substantially less liquid than many other securities, such as common stocks or U.S. government securities.
REIT Subsidiary Risk. Investments in a REIT Subsidiary are subject to risks associated with the direct ownership of real
estate. A REIT Subsidiary, and therefore the Fund, may be affected by changes in the real estate markets generally as well as changes in the values of any properties owned by a REIT Subsidiary or securing any mortgages owned by a REIT Subsidiary
(which changes in value could be influenced by market conditions for real estate in general or issues related to the particular property). If a REIT Subsidiary’s underlying assets are concentrated in properties used by a particular industry, it
will be subject to risks associated with such industry. Each REIT Subsidiary will be wholly-owned (except for its preferred shareholders) by the Fund.
Restrictions under the Internal Revenue Code applicable to regulated investment companies such as the Fund can limit investments in
private real estate, or cause such investments to be structured in a less tax-advantaged manner. Each REIT Subsidiary will not be diversified and will be subject to heavy cash flow dependency, possible lack of
availability of financing, changes in interest rates, prepayment and defaults by borrowers, self-liquidation, adverse economic conditions, adverse changes in tax laws, and the possibility of failing to maintain an exemption under the 1940 Act. Any
rental income or income from the disposition of real estate could adversely affect a REIT Subsidiary’s ability to retain its tax status, which would have adverse tax consequences. Each REIT Subsidiary is subject to the risk that it will need to
liquidate a holding at an economically inopportune time.
By investing through a REIT Subsidiary, the Fund bears the
fees and expenses of the REIT Subsidiary (including, among other things operating costs, transaction expenses, administrative and custody fees, legal expenses and custody expenses). Thus, investing through a REIT Subsidiary may cause the Fund to be
subject to higher operating expenses than if it invested directly.
To the extent a REIT Subsidiary holds mortgages, it
will be subject to the following risks: (1) during periods of declining interest rates, mortgagors may be inclined to prepay their mortgages, which prepayment may diminish the yield on securities issued by the REIT Subsidiary; and (2) when
interest rates rise, the value of the REIT Subsidiary’s investment in fixed rate obligations can be expected to decline.
71
COHEN
& STEERS REIT AND
PREFERRED AND INCOME FUND, INC.
A REIT Subsidiary may have limited diversification because it may invest in a limited number of properties, a narrow geographic
area, or a single type of property. The private real estate investments owned by a REIT Subsidiary will not be traded on a national securities exchange and an investment therein is, therefore, illiquid. These investments are also more difficult to
value than publicly traded real estate investments.
A REIT Subsidiary, and therefore the Fund, will be affected by
changes in the value of the underlying real property, fluctuations in the demand for real estate, defaults by tenants, and decreases in market rates for rent. To the extent it invests in mortgages or otherwise derives income from the collection of
interest payments, a REIT Subsidiary may be affected by the quality of credit extended, prepayments and defaults by borrowers, and changes in market interest rates, and may be more susceptible to interest rate risk.
Each REIT Subsidiary likely will depend on its ability to generate cash flow to make distributions to the Fund. The Fund’s
investments in a REIT Subsidiary could cause the Fund to recognize income in excess of cash received from those investments and, as a result, the Fund may be required to sell portfolio investments, including when it is not advantageous to do so, in
order to make distributions. By investing in a REIT Subsidiary, the Fund is indirectly exposed to risks associated with the REIT Subsidiary’s investments. A REIT Subsidiary may invest in real estate and real estate-related investments through
wholly-owned special purpose companies. Because each REIT Subsidiary will not be registered under the 1940 Act, the Fund, as an investor in the REIT Subsidiary, will not have the protections afforded to investors in registered investment companies.
Changes in the laws of the United States, under which the Fund and a REIT Subsidiary are organized, including the regulations under the Code, could result in the inability of the Fund and/or a REIT Subsidiary to operate as intended and could
negatively affect the Fund and its shareholders. Ownership of and investment through a REIT Subsidiary by a closed-end management investment company is relatively novel investment strategy. Differences between
the statutory and regulatory regimes applicable to a management investment company and a REIT present additional challenges and risks with regard to a REIT Subsidiary’s qualification as a REIT under the Code, which could result in the REIT
Subsidiary and the Fund having additional tax liability, and reduce the Fund’s current income.
A REIT Subsidiary
could default on its obligations or go bankrupt. Each REIT Subsidiary will be operated as a separate company and will observe its own corporate formalities (i.e., it will maintain its own separate books & records, and execute agreements in
its own name and on its own behalf). Accordingly, creditors and other claimants should only be able to look to the REIT Subsidiary and its assets for settlement of their claims against the REIT Subsidiary. Creditors and other claimants against the
REIT Subsidiary will not have general recourse against the Fund unless the Fund guarantees the debt or obligations of the REIT Subsidiary. See “Recourse Financings Risk.” Each REIT Subsidiary is responsible for its own legal costs in
defending against any such claims, but those legal costs may diminish its returns, and thus ultimately diminish returns to Fund shareholders. Although each REIT Subsidiary will be organized so that it is generally responsible for its own debts and
obligations, there is no guarantee that creditors and other claimants against the REIT Subsidiary will not try to reach the assets of the Fund, even where there is no legal basis for recourse to the Fund’s assets. The Fund intends to dispute
any such claims, but to the extent it does so it may incur legal costs that will diminish its returns to shareholders.
72
COHEN
& STEERS REIT AND
PREFERRED AND INCOME FUND, INC.
The REIT Subsidiary may use derivatives for speculative or hedging purposes and non-hedging
purposes (that is, to seek to increase total return). The REIT Subsidiary may incur leverage for investment or other purposes, which may increase its volatility. The REIT Subsidiary may invest without limitation in restricted and illiquid
investments and equity securities without limitation as to market capitalization, including micro-cap companies, the prices of which may be subject to erratic market movements.
Potential Conflicts of Interest Risk. The investment manager and its affiliates are involved worldwide with a broad spectrum
of financial services and asset management activities and may engage in the ordinary course of business in activities in which their interests or the interests of their other clients may conflict with those of the Fund. The investment manager and
its affiliates provide investment management services to other funds and discretionary managed accounts that follow an investment program similar to that of the Fund. Subject to the requirements of the 1940 Act, the investment manager and its
affiliates intend to engage in such activities and receive compensation from third parties for their services. Neither the investment manager nor its affiliates are under any obligation to share any investment opportunity, idea or strategy with the
Fund. As a result, other accounts of the investment manager and its affiliates may compete with the Fund for appropriate investment opportunities. The results of the Fund’s investment activities, therefore, may differ from those of other
accounts managed by the investment manager or its affiliates, and it is possible that the Fund could sustain losses during periods in which one or more of the proprietary or other accounts managed by the investment manager or its affiliates achieve
profits. The investment professionals associated with the investment manager are actively involved in other investment activities not concerning the Fund and will not be able to devote all of their time to the Fund’s business and affairs. The
investment manager and its affiliates have adopted policies and procedures designed to address potential conflicts of interests and to allocate investments among the accounts managed by the investment manager and its affiliates in a fair and
equitable manner. The Fund depends to a significant extent on the investment manager’s access to the investment professionals and senior management of the investment manager and the information and deal flow generated by the investment
manager’s investment professionals and senior management during the normal course of their investment and portfolio management activities. The senior management and the investment professionals of the investment manager source, evaluate,
analyze and monitor the Fund’s investments. The Fund’s future success will depend on the continued service of the senior management team and investment professionals of the investment manager.
The investment manager will not cause the Fund to engage in certain negotiated investments alongside affiliates unless the Fund has
received an order granting an exemption from Section 17 of the 1940 Act or unless such investments are not prohibited by Section 17(d) of the Investment Company Act or interpretations of Section 17(d) as expressed in SEC no-action letters or other available guidance. A private real estate investment may be owned by multiple Cohen & Steers funds, including the Fund. The investment manager believes that having multiple funds
invest in a single private real estate investment may result in economies of scale for shareholders as expenses will be shared across a larger asset base. However, investing alongside other Cohen & Steers funds involves certain risks.
Although any funds investing in the same private real estate investment will have similar investment strategies with respect to private real estate investments and therefore are likely to be aligned with respect to their acquisition, holding and
disposition of the investment, it is possible that the strategies of one fund might change to the extent that it no longer wishes to invest in the investment. In such a case, its ability to dispose of its interest in the private real estate
investment will be limited. Similarly, it is
73
COHEN
& STEERS REIT AND
PREFERRED AND INCOME FUND, INC.
possible that the other fund owners of the investment may wish to dispose of their interest in the investment, potentially necessitating a sale of
the investment at a time or price that the Fund believes is disadvantageous.
Real Estate Joint Venture Risk. The Fund through a
REIT Subsidiary may enter into real estate joint ventures with third parties to make investments. The Fund may also make investments in partnerships or other co-ownership arrangements or participations. Such
investments may involve risks not otherwise present with other methods of investment, including, for instance, the following risks and conflicts of interest:
| |
• |
|
the real estate joint venture partner in an investment could become insolvent or bankrupt;
|
| |
• |
|
fraud or other misconduct by the real estate joint venture partner; |
| |
• |
|
the joint venture partner will typically have day-to-day control over the investment, and the Fund’s rights regarding certain major decisions affecting the ownership of the real estate joint venture and the joint venture property, such as the sale
of the property or the making of additional capital contributions for the benefit of the property, will typically be limited. These factors may prevent the Fund from taking actions that are opposed by its real estate joint venture partner; under
certain real estate joint venture arrangements, neither party may have the power to unilaterally direct certain activities of the venture and, under certain circumstances, an impasse could result regarding cash distributions, reserves, or a proposed
sale or refinancing of the investment, and this impasse could have an adverse impact on the real estate joint venture, which could adversely impact the operations and profitability of the real estate joint venture and/or the amount and timing of
distributions the Fund receives from the real estate joint venture; |
| |
• |
|
the real estate joint venture partner may at any time have economic or business interests or goals
that are or that become in conflict with the Fund’s business interests or goals, including, for instance, the operation of the properties; |
| |
• |
|
the real estate joint venture partner may be structured differently than the Fund for tax purposes
and this could create conflicts of interest; |
| |
• |
|
the Fund will typically rely upon its real estate joint venture partner to manage the day-to day operations of the real estate joint venture and underlying assets, as well as to prepare financial information for the real estate joint venture and any failure to perform these obligations appropriately
may have a negative impact on the Fund’s performance and results of operations; |
| |
• |
|
the real estate joint venture partner may experience a change of control, which could result in new
management of the real estate joint venture partner with less experience or conflicting interests to the Fund and be disruptive to the Fund’s business; |
| |
• |
|
the real estate joint venture partner may be in a position to take action contrary to the Fund’s
instructions or requests or contrary to the Fund’s policies or objectives; |
| |
• |
|
the terms of the real estate joint ventures could restrict the Fund’s ability to sell or
transfer its interest to a third party when it desires on advantageous terms, which could result in reduced liquidity; |
| |
• |
|
the Fund or its real estate joint venture partner may have the right to cause the Fund to sell its
interest, or acquire its partner’s interest, at a time when the Fund otherwise would not have initiated such a transaction; and |
| |
• |
|
the real estate joint venture partner may not have sufficient personnel or appropriate levels of
expertise to adequately support the Fund’s initiatives. |
74
COHEN
& STEERS REIT AND
PREFERRED AND INCOME FUND, INC.
In addition, disputes between the Fund and its real estate joint venture partners may result in litigation or arbitration that
would increase the Fund’s expenses and prevent the Fund’s officers and trustees from focusing their time and efforts on the Fund’s business. Any of the above might subject the Fund to liabilities and thus reduce its returns on the
investment with that real estate joint venture partner.
Recourse Financings Risk. In certain cases, financings
for the Fund’s commercial real estate properties may be recourse to the Fund. Generally, commercial real estate financings are structured as non-recourse to the borrower, which limits a lender’s
recourse to the property pledged as collateral for the loan, and not the other assets of the borrower or to any parent of borrower, in the event of a loan default. However, lenders customarily will require that a creditworthy parent entity enter
into so-called “recourse carveout” guarantees to protect the lender against certain bad-faith or other intentional acts of the borrower in violation of the
loan documents.
Valuation Risk. The Fund is subject to valuation risk, which is the risk that one or more of the
assets in which the Fund invests are priced incorrectly, due to factors such as incomplete data, market instability or human error. If the Fund ascribes a higher value to assets and their value subsequently drops or fails to rise because of market
factors, returns on the Fund’s investment may be lower than expected and could experience losses. Within the parameters of the Fund’s valuation guidelines, the valuation methodologies used to value the Fund’s assets, in particular the
Fund’s private real estate investments, will involve subjective judgments and projections and that ultimately may not materialize. Ultimate realization of the value of an asset depends to a great extent on economic, market and other conditions
beyond the Fund’s control and the control of the investment manager and the Fund’s independent valuation firms. Rapidly changing market conditions or material events may not be immediately reflected in the Fund’s daily NAV.
Mortgage-and Asset-Backed Securities Risk. The risks associated with mortgage-related securities include:
(1) credit risk associated with the performance of the underlying mortgage properties and of the borrowers owning these properties; (2) adverse changes in economic conditions and circumstances, which are more likely to have an adverse
impact on mortgage-related securities secured by loans on certain types of commercial properties than on those secured by loans on residential properties; (3) prepayment risk, which can lead to significant fluctuations in value of the
mortgage-related security; (4) loss of all or part of the premium, if any, paid; and (5) decline in the market value of the security, whether resulting from changes in interest rates or prepayments on the underlying mortgage collateral.
Asset-backed securities involve certain risks in addition to those presented by mortgage-related securities:
(1) primarily, these securities do not have the benefit of the same security interest in the underlying collateral as mortgage-related securities and are more dependent on the borrower’s ability to pay; (2) credit card receivables are
generally unsecured, and the debtors are entitled to the protection of a number of state and Federal consumer credit laws, many of which give debtors the right to set off certain amounts owed on the credit cards, thereby reducing the balance due;
and (3) most issuers of automobile receivables permit the servicers to retain possession of the underlying obligations. If these obligations are sold to another party, there is a risk that the purchaser would acquire an interest superior to
that of the holders of the related automobile receivables. In addition, because of the large number of vehicles involved in a typical issuance and technical requirements under state laws, the trustee for the holders of the automobile receivables may
not have an effective security interest in all of the obligations
75
COHEN
& STEERS REIT AND
PREFERRED AND INCOME FUND, INC.
backing such receivables. There is a possibility that recoveries on repossessed collateral may not, in some cases, be able to support payments on
these securities.
Tax Risk. The Fund may invest in preferred securities or other securities the Federal income
tax treatment of which may not be clear or may be subject to recharacterization by the Internal Revenue Service. It could be more difficult for the Fund to comply with the tax requirements applicable to regulated investment companies if the tax
characterization of the Fund’s investments or the tax treatment of the income from such investments were successfully challenged by the Internal Revenue Service.
Additional Risk Considerations
Active Management Risk. As an actively managed portfolio, the value of the Fund’s investments could decline because the financial condition of an issuer may change (due to such factors as management performance, reduced
demand or overall market changes), financial markets may fluctuate or overall prices may decline, or the investment manager’s investment techniques could fail to achieve the Fund’s investment objectives or negatively affect the Fund’s
investment performance.
Portfolio Turnover Risk. The Fund may engage in portfolio trading when considered
appropriate, but short-term trading will not be used as the primary means of achieving the Fund’s investment objectives. There are no limits on portfolio turnover, and investments may be sold without regard to length of time held when, in the
opinion of the investment manager, investment considerations warrant such action. A higher portfolio turnover rate results in correspondingly greater brokerage commissions and other transactional expenses that are borne by the Fund. High portfolio
turnover may result in the realization of net short-term capital gains by the Fund that, when distributed to shareholders, would be taxable to such shareholders as ordinary income.
Anti-Takeover Provisions. Certain provisions of the Fund’s Articles of Incorporation and Bylaws could limit the ability
of other entities or persons to acquire control of the Fund or change the Fund’s structure. The provisions may have the effect of depriving stockholders of an opportunity to sell their shares at a premium over prevailing market prices or have
the effect of inhibiting the conversion of the Fund to an open-end fund.
Geopolitical Risk: Occurrence of global
events similar to those in recent years, such as war (including Russia’s military invasion of Ukraine), terrorist attacks, natural or environmental disasters, country instability, infectious disease epidemics or pandemics, such as that caused
by COVID-19, market instability, debt crises and downgrades, embargoes, tariffs, sanctions and other trade barriers and other governmental trade or market control programs, the potential exit of a country from its respective union and related
geopolitical events, may result in market volatility and may have long-lasting impacts on U.S. and global economies and financial markets. Supply chain disruptions or significant changes in the supply or prices of commodities or other economic
inputs may have material and unexpected effects on both global securities markets and individual countries, regions, sectors, companies or industries. Events occurring in one region of the world may negatively impact industries and regions that are
not otherwise directly impacted by the events. Additionally, those events, as well as other changes in foreign and domestic political and economic conditions, could adversely affect individual issuers or related groups of issuers, securities
markets, interest rates, secondary trading, credit ratings, inflation, investor sentiment and other factors affecting the value of the Fund’s investments.
76
COHEN
& STEERS REIT AND
PREFERRED AND INCOME FUND, INC.
Although the long-term economic fallout of COVID-19 is difficult to predict, it has contributed to, and may continue to contribute
to, market volatility, inflation and systemic economic weakness. COVID-19 and efforts to contain its spread may also exacerbate other pre-existing political, social, economic, market and financial risks. In addition, the U.S. government and other
central banks across Europe, Asia, and elsewhere announced and/or adopted economic relief packages in response to COVID-19. The end of any such program could cause market downturns, disruptions and volatility, particularly if markets view the ending
as premature. The U.S. federal government ended the COVID-19 public emergency declaration on May 11, 2023, however, the effects of the COVID-19 pandemic are expected to continue and the risk that new variants of COVID-19 may emerge remains.
Therefore the economic outlook, particularly for certain industries and businesses, remains inherently uncertain.
On
January 31, 2020, the United Kingdom (“UK”) withdrew from the European Union (“EU”) (referred to as Brexit). An agreement between the UK and the EU governing their future trade relationship became effective January 1, 2021.
Brexit has resulted in volatility in European and global markets and could have potentially significant negative long-term impacts on financial markets in the UK and throughout Europe.
On February 24, 2022, Russia launched a large-scale invasion of Ukraine significantly amplifying already existing geopolitical
tensions. The United States and many other countries have instituted various economic sanctions against Russia, Russian individuals and entities and Belarus. The extent and duration of the military action, sanctions imposed and other punitive
actions taken (including any Russian retaliatory responses to such sanctions and actions), and resulting disruptions in Europe and globally cannot be predicted, but could be significant and have a severe adverse effect on the global economy,
securities markets and commodities markets globally, including through global supply chain disruptions, increased inflationary pressures and reduced economic activity. Ongoing conflicts in the Middle East could have similar negative impacts. To the
extent the Fund has exposure to the energy sector, the Fund may be especially susceptible to these risks. Furthermore, in March 2023, the shut-down of certain financial institutions raised economic concerns over disruption in the U.S. banking
system. There can be no certainty that the actions taken by the U.S. government to strengthen public confidence in the U.S. banking system will be effective in mitigating the effects of financial institution failures on the economy and restoring
public confidence in the U.S. banking system. These disruptions may also make it difficult to value the Fund’s portfolio investments and cause certain of the Fund’s investments to become illiquid. The strengthening or weakening of the U.S.
dollar relative to other currencies may, among other things, adversely affect the Fund’s investments denominated in non-U.S. dollar currencies. It is difficult to predict when similar events affecting the U.S. or global financial markets may
occur, the effects that such events may have, and the duration of those effects.
Regulatory Risk: The U.S.
government has proposed and adopted multiple regulations that could have a long-lasting impact on the Fund and on the mutual fund industry in general. The SEC’s final rules, related requirements and amendments to modernize reporting and
disclosure, along with other potential upcoming regulations, could, among other things, restrict the Fund’s ability to engage in transactions and/or increase overall expenses of the Fund. In addition to Rule 18f-4, which governs the way
derivatives are used by registered investment companies, the SEC, Congress, various exchanges and regulatory and self-regulatory authorities, both domestic and foreign, have undertaken reviews of the use of derivatives by registered investment
companies, which could affect the nature and extent of instruments used by the Fund. The Fund and the instruments in which it invests may be subject to new
77
COHEN
& STEERS REIT AND
PREFERRED AND INCOME FUND, INC.
or additional regulatory constraints in the future. While the full extent of all of these regulations is still unclear, these regulations and
actions may adversely affect both the Fund and the instruments in which the Fund invests and its ability to execute its investment strategy. For example, climate change regulation (such as decarbonization legislation, other mandatory controls to
reduce emissions of greenhouse gases, or related disclosure requirements) could significantly affect the Fund or its investments by, among other things, increasing compliance costs or underlying companies’ operating costs and capital
expenditures. Similarly, regulatory developments in other countries may have an unpredictable and adverse impact on the Fund.
Cyber Security Risk. With the increased use of technologies such as the Internet and the dependence on computer systems to perform necessary business functions, the Fund and its service providers (including the investment
manager) may be susceptible to operational and information security risks resulting from cyber-attacks and/or other technological malfunctions. In general, cyber-attacks are deliberate, but unintentional events may have similar effects.
Cyber-attacks include, among others, stealing or corrupting data maintained online or digitally, preventing legitimate users from accessing information or services on a website, releasing confidential information without authorization, gaining
unauthorized access to digital systems for purposes of misappropriating assets and causing operational disruption. Cyber-attacks may also be carried out in a manner that does not require gaining unauthorized access, such as causing denial-of-service. Successful cyber-attacks against, or security breakdowns of, the Fund, the investment manager, or a custodian, transfer agent, or other affiliated or
third-party service provider may adversely affect the Fund or its shareholders. For instance, cyber-attacks may interfere with the processing of shareholder transactions, affect the Fund’s ability to calculate its NAV, cause the release of
private shareholder information or confidential Fund information, impede trading, cause reputational damage, and subject the Fund to regulatory fines, penalties or financial losses, reimbursement or other compensation costs, and additional
compliance costs. Furthermore, as a result of breaches in cyber security or other operational and technology disruptions or failures, an exchange or market may close or issue trading halts on specific securities or an entire market, which may result
in the Fund being, among other things, unable to buy or sell certain securities or financial instruments or unable to accurately price its investments. While the Fund has established business continuity plans and systems designed to prevent
cyber-attacks, there are inherent limitations in such plans and systems including the possibility that certain risks have not been identified. Similar types of cyber security risks also are present for issuers of securities in which the Fund
invests, which could result in material adverse consequences for such issuers, and may cause the Fund’s investment in such securities to lose value.
Each of the Fund and the investment manager may have limited ability to prevent or mitigate cyber-attacks or security or technology
breakdowns affecting the Fund’s third-party service providers. While the Fund has established business continuity plans and systems designed to prevent or reduce the impact of cyber-attacks, such plans and systems are subject to inherent
limitations.
Investment Restrictions
The Fund has adopted certain investment limitations. Under these limitations, the Fund may not:
| |
1. |
Issue senior securities (including borrowing money for other than temporary purposes) except in
conformity with the limits set forth in the 1940 Act; or pledge its assets other than to secure such issuances or borrowings or in connection with permitted investment strategies; provided that, notwithstanding the foregoing, the Fund may borrow up
to an additional 5% of its total assets for temporary purposes; |
78
COHEN
& STEERS REIT AND
PREFERRED AND INCOME FUND, INC.
| |
2. |
Act as an underwriter of securities issued by other persons, except insofar as the Fund may be
deemed an underwriter in connection with the disposition of securities; |
| |
3. |
Purchase or sell real estate, mortgages on real estate or commodities, except that the Fund may
invest in securities of companies that deal in real estate or are engaged in the real estate business, including REITs, and securities secured by real estate or interests therein and the Fund may hold and sell real estate or mortgages on real estate
acquired through default, liquidation, or other distributions of an interest in real estate as a result of the Fund’s ownership of such securities; |
| |
4. |
Purchase or sell commodities or commodity futures contracts, except that the Fund may invest in
financial futures contracts, options thereon and such similar instruments; |
| |
5. |
Make loans to other persons except through the lending of securities held by it (but not to exceed
a value of one-third of total assets), through the use of repurchase agreements, and by the purchase of debt securities; |
| |
6. |
Invest more than 25% of its total assets in securities of issuers in any one industry other than
the real estate industry, in which at least 25% of the Fund’s total assets will be invested; provided, however, that such limitation shall not apply to obligations issued or guaranteed by the United States Government or by its agencies or
instrumentalities; |
| |
7. |
Invest in oil, gas or other mineral exploration programs, development programs or leases, except
that the Fund may purchase securities of companies engaging in whole or in part in such activities; or |
| |
8. |
Pledge, mortgage or hypothecate its assets except in connection with permitted borrowings.
|
The investment restrictions numbered 1 through 6 described herein have been adopted as fundamental
policies of the Fund. Under the 1940 Act, a fundamental policy may not be changed without the approval of the holders of a “majority of the outstanding” voting securities of the Fund.
79
COHEN
& STEERS REIT AND
PREFERRED AND INCOME FUND, INC.
MANAGEMENT OF THE FUND
The business and affairs of the Fund are managed under the direction of the Board of Directors. The Board of Directors approves all significant agreements between the Fund and persons or companies furnishing services to it,
including the Fund’s agreements with its investment advisor, administrator, co-administrator, custodian and transfer agent. The management of the Fund’s day-to-day operations is delegated to its officers, the investment advisor, administrator and co-administrator, subject always to the investment objective and policies
of the Fund and to the general supervision of the Board of Directors.
The Board of Directors and officers of the Fund
and their principal occupations during at least the past five years are set forth below. The statement of additional information (SAI) contains additional information about the directors as of the date thereof and additional information about the
directors is also included in the Fund’s most recent proxy statement, which are available, without charge, upon request by calling 866-277-0757.
|
|
|
|
|
|
|
|
|
|
|
|
|
| Name, Address and
Year of Birth(1)
|
|
Position(s) Held
With Fund |
|
Term of
Office(2)
|
|
Principal Occupation
During At Least The Past 5 Years (Including Other
Directorships Held) |
|
Number of
Funds Within Fund Complex
Overseen by Director (Including
the Fund) |
|
|
Length
of Time
Served(3) |
|
|
|
|
|
|
| Interested Directors(4) |
|
|
|
|
|
|
|
|
|
|
|
|
|
|
|
|
|
|
| Joseph M. Harvey
1963 |
|
Director, Chair |
|
Until Next Election of Directors |
|
Chief Executive Officer since 2022 and President since 2003 of Cohen & Steers Capital Management, Inc. (CSCM), and Chief
Executive Officer since 2022 and President since 2004 of Cohen & Steers, Inc. (CNS). Chief Investment Officer of CSCM from 2003 to
2019. Prior to that, Senior Vice President and Director of Investment Research of CSCM. |
|
|
20 |
|
|
Since 2014 |
|
|
|
|
|
|
| Adam M. Derechin
1964 |
|
Director |
|
Until Next Election of Directors |
|
Chief Operating Officer of CSCM since 2003 and CNS since 2004. President and Chief Executive Officer of the Funds from 2005 to 2021. |
|
|
20 |
|
|
Since 2021 |
|
|
|
|
|
| Independent Directors |
|
|
|
|
|
|
|
|
|
|
|
|
|
|
|
|
| Michael G. Clark
1965 |
|
Director |
|
Until Next Election of Directors |
|
CFA; From 2006 to 2011, President and Chief Executive Officer of DWS Funds and Managing Director of Deutsche Asset Management. |
|
|
20 |
|
|
Since 2011 |
(table continued on next page)
80
COHEN
& STEERS REIT AND
PREFERRED AND INCOME FUND, INC.
(table continued from previous page)
|
|
|
|
|
|
|
|
|
|
|
| Name, Address and
Year of Birth(1)
|
|
Position(s) Held
With Fund |
|
Term of
Office(2)
|
|
Principal Occupation
During At Least The Past 5 Years (Including Other
Directorships Held) |
|
Number of
Funds Within Fund Complex
Overseen by Director (Including
the Fund) |
|
Length
of Time
Served(3) |
|
|
|
|
|
|
| George Grossman
1953 |
|
Director |
|
Until Next Election of Directors |
|
Attorney-at-law. |
|
20 |
|
Since 1993 |
|
|
|
|
|
|
| Dean A. Junkans
1959 |
|
Director |
|
Until Next Election of Directors |
|
CFA; Advisor to SigFig (a registered investment advisor) from July 2018 to July 2022; Chief Investment Officer at Wells Fargo Private Bank from 2004 to 2014 and Chief Investment Officer of the Wealth, Brokerage
and Retirement group at Wells Fargo & Company from 2011 to 2014; former Member and Chair, Claritas Advisory Committee at the CFA Institute from 2013 to 2015; former Adjunct Professor and Executive-In-Residence, Bethel University, 2015 to
2022; former Board Member and Investment Committee Member, Bethel University Foundation, 2010 to 2022; former Corporate Executive Board Member of the National Chief Investment Officers Circle, 2010 to 2015; former Member of the Board of Governors of
the University of Wisconsin Foundation, River Falls, 1996 to 2004; U.S. Army Veteran, Gulf War. |
|
20 |
|
Since 2015 |
(table continued on next page)
81
COHEN
& STEERS REIT AND
PREFERRED AND INCOME FUND, INC.
(table continued from previous page)
|
|
|
|
|
|
|
|
|
|
|
| Name, Address and
Year of Birth(1)
|
|
Position(s) Held
With Fund |
|
Term of
Office(2)
|
|
Principal Occupation
During At Least The Past 5 Years (Including Other
Directorships Held) |
|
Number of
Funds Within Fund Complex
Overseen by Director (Including
the Fund) |
|
Length
of Time
Served(3) |
|
|
|
|
|
|
| Gerald J. Maginnis
1955 |
|
Director |
|
Until Next Election of Directors |
|
Philadelphia Office Managing Partner, KPMG LLP from 2006 to 2015; Partner in Charge, KPMG Pennsylvania Audit Practice from 2002 to 2008; President, Pennsylvania Institute of Certified Public Accountants (PICPA)
from 2014 to 2015; Member, PICPA Board of Directors from 2012 to 2016; Member, Council of the American Institute of Certified Public Accountants (AICPA) from 2013 to 2017; Member, Board of Trustees of AICPA Foundation from 2015 to 2020; Board Member
and Audit Committee Chairman of inTEST Corporation since 2020; Chairman of the Advisory Board of Centri Consulting LLC since 2022. |
|
20 |
|
Since 2015 |
|
|
|
|
|
|
| Jane F. Magpiong
1960 |
|
Director |
|
Until Next Election of Directors |
|
President, Untap Potential since 2013; Senior Managing Director, TIAA-CREF, from 2011 to 2013; National Head of Wealth Management, TIAA- CREF, from 2008 to 2011; President, Bank of America Private Bank from
2005 to 2008; Executive Vice President, Fleet Private Clients Group, from 2003 to 2004. |
|
20 |
|
Since 2015 |
(table continued on next page)
82
COHEN
& STEERS REIT AND
PREFERRED AND INCOME FUND, INC.
(table continued from previous page)
|
|
|
|
|
|
|
|
|
|
|
| Name, Address and
Year of Birth(1)
|
|
Position(s) Held
With Fund |
|
Term of
Office(2)
|
|
Principal Occupation
During At Least The Past 5 Years (Including Other
Directorships Held) |
|
Number of
Funds Within Fund Complex
Overseen by Director (Including
the Fund) |
|
Length
of Time
Served(3) |
|
|
|
|
|
|
| Daphne L. Richards
1966 |
|
Director |
|
Until Next Election of Directors |
|
President and CIO of Ledge Harbor Management since 2016;
Investment Committee Member of the Berkshire Taconic Community Foundation since 2015; Member of the Advisory Board of Northeast Dutchess Fund since
2016; former Independent Director of Cartica Management, LLC, 2015 to 2022; formerly worked at Bessemer Trust Company from 1999 to 2014; Frank Russell Company from 1996 to 1999; Union Bank of Switzerland from 1993 to 1996; Credit Suisse from 1990 to
1993; Hambros International Venture Capital Fund from 1988 to 1989. |
|
20 |
|
Since 2017 |
(table continued on next page)
83
COHEN
& STEERS REIT AND
PREFERRED AND INCOME FUND, INC.
(table continued from previous page)
|
|
|
|
|
|
|
|
|
|
|
| Name, Address and
Year of Birth(1)
|
|
Position(s) Held
With Fund |
|
Term of
Office(2)
|
|
Principal Occupation
During At Least The Past 5 Years (Including Other
Directorships Held) |
|
Number of
Funds Within Fund Complex
Overseen by Director (Including
the Fund) |
|
Length
of Time
Served(3) |
|
|
|
|
|
|
| Ramona Rogers-Windsor 1960 |
|
Director |
|
Until Next Election of Directors |
|
CFA; Member, Capital Southwest Board of Directors since 2021; Member, Thomas Jefferson University Board of Trustees since 2020; and its insurance subsidiary board, Partners Insurance Company, Inc., since 2023;
Managing Director, Public Investments Department, Northwestern Mutual Investment Management Company, LLC from 2012 to 2019; former Member, Milwaukee Film, LLC Board of Directors from 2016 to 2019. |
|
20 |
|
Since 2021 |
| (1) |
The address for each Director is 1166 Avenue of the Americas, 30th Floor, New York, NY 10036. |
| (2) |
On March 12, 2008, the Board of Directors adopted a mandatory retirement policy stating a Director
must retire from the Board on December 31st of the year in which he or she turns 75 years of age. |
| (3) |
The length of time served represents the year in which the Director was first elected or appointed
to any fund in the Cohen & Steers Fund Complex. |
| (4) |
“Interested persons,” as defined in the 1940 Act, on the basis of their affiliation with
the Advisor (Interested Directors). |
84
COHEN
& STEERS REIT AND
PREFERRED AND INCOME FUND, INC.
The officers of the Fund (other than Mr. Harvey, whose biography is provided above), their address, their year of birth and their
principal occupations for at least the past five years are set forth below.
|
|
|
|
|
|
|
| Name, Address and
Year of
Birth(1) |
|
Position(s) Held
With Fund |
|
Principal Occupation During At Least
the Past 5 Years |
|
Length
of
Time
Served(2) |
|
|
|
|
| James Giallanza
1966 |
|
President and Chief Executive Officer |
|
Executive Vice President of CSCM since 2014. Prior to that, Senior Vice President of CSCM since 2006. |
|
Since 2006 |
|
|
|
|
| Albert Laskaj
1977 |
|
Treasurer and Chief Financial Officer |
|
Senior Vice President of CSCM since 2019. Prior to that, Vice President of CSCM since 2015. |
|
Since 2015 |
|
|
|
|
| Dana A. DeVivo
1981 |
|
Secretary and Chief Legal Officer |
|
Senior Vice President of CSCM since 2019. Prior to that, Vice President of CSCM since 2013. |
|
Since
2015 |
|
|
|
|
| Stephen Murphy
1966 |
|
Chief Compliance Officer and Vice President |
|
Senior Vice President of CSCM since 2019. Prior to that, Managing Director at Mirae Asset Securities (USA) Inc. since 2017. |
|
Since 2019 |
|
|
|
|
| Yigal D. Jhirad
1964 |
|
Vice President |
|
Senior Vice President of CSCM since 2007. |
|
Since
2007 |
|
|
|
|
| William F. Scapell
1967 |
|
Vice President |
|
Executive Vice President of CSCM since 2014. Prior to that, Senior Vice President of CSCM since 2003. |
|
Since 2003 |
|
|
|
|
| Mathew Kirschner
1979 |
|
Vice President |
|
Senior Vice President of CSCM since 2019. Prior to that, Vice President of CSCM since 2010. |
|
Since 2020 |
|
|
|
|
| Jason Yablon
1979 |
|
Vice President |
|
Executive Vice President of CSCM effective January 2022. Prior to that, Senior Vice President of CSCM since 2014. |
|
Since 2020 |
| (1) |
The address of each officer is 1166 Avenue of the Americas, 30th Floor New York, NY 10036. |
| (2) |
Officers serve one-year terms. The length of time served represents the year in which the officer
was first elected as an officer of any fund in the Cohen & Steers fund complex. All of the officers listed above are officers of one or more of the other funds in the complex. |
85
COHEN
& STEERS REIT AND
PREFERRED AND INCOME FUND, INC.
Cohen & Steers Privacy Policy
|
|
|
| |
|
| Facts |
|
What Does Cohen & Steers Do With Your Personal Information? |
|
|
| Why? |
|
Financial companies choose how they share your personal information. Federal law gives consumers the right to limit some but not all sharing. Federal law also requires
us to tell you how we collect, share, and protect your personal information. Please read this notice carefully to understand what we do. |
|
|
| What? |
|
The types of personal information we collect and share depend on the product or service
you have with us. This information can include: • Social Security number and account balances
• Transaction history and account transactions
• Purchase history and wire
transfer instructions |
|
|
| How? |
|
All financial companies need to share customers’ personal information to run their everyday business. In the section below, we list the reasons financial
companies can share their customers’ personal information; the reasons Cohen & Steers chooses to share; and whether you can limit this sharing. |
|
|
|
|
|
| Reasons we can share your personal information |
|
Does Cohen & Steers
share? |
|
Can you limit this
sharing? |
|
|
|
| For our everyday business purposes—
such as to process your transactions, maintain your account(s), respond to court orders and legal investigations, or reports to
credit bureaus |
|
Yes |
|
No |
|
|
|
| For our marketing purposes—
to offer our products and services to you |
|
Yes |
|
No |
|
|
|
| For joint marketing with other financial companies— |
|
No |
|
We don’t share |
|
|
|
| For our affiliates’ everyday business purposes—
information about your transactions and experiences |
|
No |
|
We don’t share |
|
|
|
| For our affiliates’ everyday business purposes—
information about your creditworthiness |
|
No |
|
We don’t share |
|
|
|
| For our affiliates to market to you— |
|
No |
|
We don’t share |
|
|
|
| For non-affiliates to market to you— |
|
No |
|
We don’t share |
|
|
|
|
|
|
|
|
| |
|
|
| Questions? Call 866-227-0757 |
|
|
|
|
86
COHEN
& STEERS REIT AND
PREFERRED AND INCOME FUND, INC.
Cohen & Steers Privacy Policy—(Continued)
|
|
|
| |
|
| Who we are |
|
|
|
|
| Who is providing this notice? |
|
Cohen & Steers Capital Management, Inc., Cohen & Steers Asia Limited, Cohen & Steers Japan Limited, Cohen & Steers UK Limited,
Cohen & Steers Ireland Limited, Cohen & Steers Singapore Private Limited, Cohen & Steers Securities, LLC, Cohen & Steers Private Funds and Cohen & Steers Open and Closed-End
Funds (collectively, Cohen & Steers). |
|
|
| What we do |
|
|
|
|
| How does Cohen & Steers protect my personal information? |
|
To protect your personal information from unauthorized access and use, we use security measures that comply with federal law. These measures include computer
safeguards and secured files and buildings. We restrict access to your information to those employees who need it to perform their jobs, and also require companies that provide services on our behalf to protect your information. |
|
|
| How does Cohen & Steers collect my personal information? |
|
We collect your personal information, for example, when you:
• Open an account or buy
securities from us
• Provide account information or give us your contact information
• Make deposits or
withdrawals from your account We also collect your personal
information from other companies. |
|
|
| Why can’t I limit all sharing? |
|
Federal law gives you the right to limit only:
• sharing for
affiliates’ everyday business purposes—information about your creditworthiness
• affiliates from using your information to market to you
• sharing for non-affiliates to market to you
State law and individual companies may give you additional rights to limit sharing. |
|
|
| Definitions |
|
|
|
|
| Affiliates |
|
Companies related by common ownership or control. They can be financial and
nonfinancial companies.
• Cohen & Steers does not share with affiliates. |
|
|
| Non-affiliates |
|
Companies not related by common ownership or control. They can be financial and
nonfinancial companies.
• Cohen & Steers does not share with
non-affiliates. |
|
|
| Joint marketing |
|
A formal agreement between non-affiliated
financial companies that together market financial products or services to you.
• Cohen & Steers does not jointly market. |
87
COHEN
& STEERS REIT AND
PREFERRED AND INCOME FUND, INC.
Cohen & Steers Open-End Mutual Funds
COHEN & STEERS REALTY
SHARES
| • |
|
Designed for investors seeking total return, investing primarily in U.S. real estate securities |
| • |
|
Symbols: CSJAX, CSJCX, CSJIX, CSRSX, CSJRX, CSJZX |
COHEN & STEERS REAL ESTATE SECURITIES
FUND
| • |
|
Designed for investors seeking total return, investing primarily in U.S. real estate securities |
| • |
|
Symbols: CSEIX, CSCIX, CREFX, CSDIX, CIRRX, CSZIX |
COHEN & STEERS INSTITUTIONAL REALTY SHARES
| • |
|
Designed for institutional investors seeking total return, investing primarily in U.S. real estate securities |
COHEN &
STEERS GLOBAL REALTY SHARES
| • |
|
Designed for investors seeking total return, investing primarily in global real estate equity securities |
| • |
|
Symbols: CSFAX, CSFCX, CSSPX, GRSRX, CSFZX |
COHEN & STEERS INTERNATIONAL REALTY FUND
| • |
|
Designed for investors seeking total return, investing primarily in international (non-U.S.) real estate securities |
| • |
|
Symbols: IRFAX, IRFCX, IRFIX, IRFRX, IRFZX |
COHEN & STEERS REAL ASSETS FUND
| • |
|
Designed for investors seeking total return and the maximization of real returns during inflationary environments by investing primarily in real assets |
| • |
|
Symbols: RAPAX, RAPCX, RAPIX, RAPRX, RAPZX
|
COHEN & STEERS PREFERRED
SECURITIES AND INCOME FUND
| • |
|
Designed for investors seeking total return (high current income and capital appreciation), investing primarily in preferred and debt securities issued by U.S. and
non-U.S. companies |
| • |
|
Symbols: CPXAX, CPXCX, CPXFX, CPXIX, CPRRX, CPXZX |
COHEN & STEERS LOW DURATION PREFERRED
AND INCOME FUND
| • |
|
Designed for investors seeking high current income and capital preservation by investing in low-duration preferred and other income securities issued by U.S.
and non-U.S. companies |
| • |
|
Symbols: LPXAX, LPXCX, LPXFX, LPXIX, LPXRX, LPXZX |
COHEN & STEERS MLP & ENERGY OPPORTUNITY
FUND
| • |
|
Designed for investors seeking total return, investing primarily in midstream energy master limited partnership (MLP) units and related stocks |
| • |
|
Symbols: MLOAX, MLOCX, MLOIX, MLORX, MLOZX |
COHEN & STEERS GLOBAL INFRASTRUCTURE FUND
| • |
|
Designed for investors seeking total return, investing primarily in global infrastructure securities |
| • |
|
Symbols: CSUAX, CSUCX, CSUIX, CSURX, CSUZX |
Distributed by Cohen & Steers Securities, LLC.
Please consider the investment objectives, risks,
charges and expenses of any Cohen & Steers U.S. registered open-end fund carefully before investing. A summary prospectus and prospectus containing this and other information can be obtained by
calling 800-330-7348 or by visiting cohenandsteers.com. Please read the summary prospectus and prospectus carefully before investing.
88
COHEN
& STEERS REIT AND
PREFERRED AND INCOME FUND, INC.
OFFICERS AND DIRECTORS
Joseph M. Harvey
Director, Chair
and Vice President
Adam M. Derechin
Director
Michael G. Clark
Director
George Grossman
Director
Dean A. Junkans
Director
Gerald J. Maginnis
Director
Jane F. Magpiong
Director
Daphne L.
Richards
Director
Ramona Rogers-Windsor
Director
James Giallanza
President and Chief Executive Officer
Albert Laskaj
Treasurer and Chief Financial Officer
Dana A. DeVivo
Secretary and
Chief Legal Officer
Stephen Murphy
Chief Compliance Officer
and Vice President
Yigal D. Jhirad
Vice President
William F. Scapell
Vice President
Mathew Kirschner
Vice President
Jason
Yablon
Vice President
KEY INFORMATION
Investment Manager and Administrator
Cohen & Steers Capital Management, Inc.
1166 Avenue of the Americas, 30th Floor
New York, NY 10036
(212) 832-3232
Co-administrator
and Custodian
State Street Bank and Trust Company
One Congress Street, Suite 1
Boston, MA 02114-2016
Transfer
Agent
Computershare
150 Royall Street
Canton, MA
02021
(866) 227-0757
Legal Counsel
Ropes &
Gray LLP
1211 Avenue of the Americas
New York, NY 10036
|
|
|
| New York Stock Exchange Symbol: |
|
RNP |
Website: cohenandsteers.com
This report is for shareholder information. This is not a prospectus intended for use in the purchase or sale of Fund shares. Performance data
quoted represent past performance. Past performance is no guarantee of future results and your investment may be worth more or less at the time you sell your shares.
89
eDelivery AVAILABLE
Stop traditional mail delivery;
receive your shareholder reports
and prospectus online.
Sign up at cohenandsteers.com

Annual Report December 31, 2023
Cohen & Steers
REIT and
Preferred and
Income Fund
(RNP)
RNPAR
Item 2. Code of Ethics.
The Registrant has adopted a code of ethics as defined in Item 2 of Form N-CSR (the “Code of
Ethics”) that applies to its Principal Executive Officer and Principal Financial Officer. The Code of Ethics was in effect during the reporting period. In December 2023, the Registrant amended the Code of Ethics to make immaterial stylistic
updates. The Registrant has not granted any waiver, including an implicit waiver, from a provision of the Code of Ethics, as described in Form N-CSR, during the reporting period. A current copy of the
Code of Ethics is available on the Registrant’s website at https://assets.cohenandsteers.com/assets/content/uploads/Code_of_Ethics_for_Principal_Executive_and_Principal_Financial_Officers_of_the_Funds.pdf. Upon request, a copy of the Code of
Ethics can be obtained free of charge by calling 800-330-7348 or writing to the Secretary of the Registrant, 1166 Avenue of the Americas, 30th Floor, New York, NY 10036.
Item 3. Audit Committee Financial Expert.
The Registrant’s board has determined that Gerald J. Maginnis qualifies as an audit committee financial expert based on his years of
experience in the public accounting profession. The Registrant’s board has determined that Michael G. Clark qualifies as an audit committee financial expert based on his years of experience in the public accounting profession and the investment
management and financial services industry. The Registrant’s board has determined that Ramona Rogers-Windsor qualifies as an audit committee financial expert based on her years of experience in the investment management and financial services
industry. Each of Messrs. Maginnis and Clark and Ms. Rogers-Windsor is a member of the board’s audit committee, and each is independent as such term is defined in Form N-CSR.
Item 4. Principal Accountant Fees and Services.
(a) – (d) Aggregate fees billed to the Registrant for the last two fiscal years ended December 31, 2023 and December 31, 2022
for professional services rendered by the Registrant’s principal accountant were as follows:
|
|
|
|
|
| |
|
2023 |
|
2022 |
| Audit Fees |
|
$67,714 |
|
$66,148 |
| Audit-Related Fees |
|
$0 |
|
$0 |
| Tax Fees |
|
$18,964 |
|
$18,501 |
| All Other Fees |
|
$0 |
|
$0 |
Tax fees were billed in connection with tax compliance services, including the preparation and review of
federal and state tax returns and the computation of corporate and franchise tax amounts.
(e)(1) The Registrant’s audit committee is
required to pre-approve audit and non-audit services performed for the Registrant by the principal accountant. The audit committee also is required to pre-approve
non-audit services performed by the Registrant’s principal accountant for the Registrant’s investment advisor (not including any sub-advisor whose role is
primarily portfolio management and is subcontracted with or overseen by another investment advisor) and/or to any entity controlling, controlled by or under common control with the Registrant’s investment advisor that provides ongoing services
to the Registrant, if the engagement for services relates directly to the operations and financial reporting of the Registrant.
The audit
committee may delegate pre-approval authority to one or more of its members who are independent members of the board of directors of the Registrant. The member or members to whom such
authority is delegated shall report any pre-approval decisions to the audit committee at its next scheduled meeting. The audit committee may not delegate its responsibility to pre-approve services to be performed by the Registrant’s principal accountant to the investment advisor.
(e)(2) No services included in (b) – (d) above were approved by the audit committee pursuant to paragraphs (c)(7)(i)(C) of Rule 2-01 of Regulation S-X.
(f) Not applicable.
(g) For the fiscal years ended December 31, 2023 and December 31, 2022, the aggregate fees billed by the Registrant’s principal
accountant for non-audit services rendered to the Registrant and for non-audit services rendered to the Registrant’s investment advisor (not including any sub-advisor whose role is primarily portfolio management and is subcontracted with or overseen by another investment advisor) and/or to any entity controlling, controlled by or under common control with the
Registrant’s investment advisor that provides ongoing services to the Registrant were:
|
|
|
|
|
| |
|
2023 |
|
2022 |
| Registrant |
|
$18,964 |
|
$18,501 |
| Investment Advisor |
|
$0 |
|
$0 |
(h) The Registrant’s audit committee considered whether the provision of
non-audit services that were rendered to the Registrant’s investment advisor (not including any sub-advisor whose role is primarily portfolio management and is
subcontracted with or overseen by another investment advisor) and/or to any entity controlling, controlled by or under common control with the Registrant’s investment advisor that provides ongoing services to the Registrant that were not
required to be pre-approved pursuant to paragraph (c)(7)(ii) of Rule 2-01 of Regulation S-X was compatible with maintaining the
principal accountant’s independence.
(i) Not applicable.
(j) Not applicable.
Item 5. Audit
Committee of Listed Registrants.
The Registrant has a separately-designated standing audit committee established in accordance with
Section 3(a)(58)(A) of the Securities Exchange Act of 1934. The members of the committee are Gerald J. Maginnis (chairman), Michael G. Clark and Ramona Rogers-Windsor.
Item 6. Schedule of Investments.
Included in Item 1 above.
Item 7.
Disclosure of Proxy Voting Policies and Procedures for Closed-End Management Investment Companies.
The Registrant has delegated voting of proxies in respect of portfolio holdings to Cohen & Steers Capital Management, Inc.
(“C&S”), in accordance with the policies and procedures set forth below.
COHEN & STEERS CAPITAL MANAGEMENT, INC.
STATEMENT OF POLICIES AND PROCEDURES REGARDING THE VOTING OF SECURITIES
This statement sets forth the policies and procedures that Cohen & Steers Capital Management, Inc., and its affiliated advisors
(“Cohen & Steers”, “we” or “us”) follow in exercising voting rights with respect to securities held in its client portfolios. All proxy-voting rights that are exercised by Cohen & Steers shall be
subject to this Statement of Policy and Procedures.
General Proxy Voting Guidelines
Objectives
Voting rights are an
important component of corporate governance. Cohen & Steers has three overall objectives in exercising voting rights:
| |
• |
|
Responsibility. Cohen & Steers shall seek to ensure that there is an effective means in place
to hold companies accountable for their actions. While management must be accountable to its board, the board must be accountable to a company’s shareholders. Although accountability can be promoted in a variety of ways, protecting shareholder
voting rights may be among our most important tools. |
| |
• |
|
Rationalizing Management and Shareholder Concerns. Cohen & Steers seeks to ensure that the
interests of a company’s management and board are aligned with those of the company’s shareholders. In this respect, compensation must be structured to reward the creation of shareholder value. |
| |
• |
|
Shareholder Communication. Since companies are owned by their shareholders, Cohen & Steers
seeks to ensure that management effectively communicates with its owners about the company’s business operations and financial performance. It is only with effective communication that shareholders will be able to assess the performance of
management and to make informed decisions on when to buy, sell or hold a company’s securities. |
General Principles
In exercising voting rights, Cohen & Steers shall conduct itself in accordance with the general principles set forth
below.
| |
• |
|
The ability to exercise a voting right with respect to a security is a valuable right and, therefore, must be
viewed as part of the asset itself. |
| |
• |
|
In exercising voting rights, Cohen & Steers shall engage in a careful evaluation of issues that may
materially affect the rights of shareholders and the value of the security. |
| |
• |
|
Consistent with general fiduciary duties, the exercise of voting rights shall always be conducted with
reasonable care, prudence and diligence. |
| |
• |
|
In exercising voting rights on behalf of clients, Cohen & Steers shall conduct itself in the same
manner as if Cohen & Steers were the beneficial owner of the securities. |
| |
• |
|
To the extent reasonably possible, Cohen & Steers shall participate in each shareholder voting
opportunity. |
| |
• |
|
Voting rights shall not automatically be exercised in favor of management-supported proposals.
|
| |
• |
|
Cohen & Steers, and its officers and employees, shall never accept any item of value in consideration
of a favorable proxy vote. |
General Guidelines
Set forth below are general guidelines that Cohen & Steers shall follow in exercising proxy voting rights:
| |
• |
|
Prudence. In making a proxy voting decision, Cohen & Steers shall give appropriate
consideration to all relevant facts and circumstances, including the value of the securities to be voted and the likely effect any vote may have on that value. Since voting rights must be exercised on the basis of an informed judgment, investigation
shall be a critical initial step. |
| |
• |
|
Third Party Views. While Cohen & Steers may consider the views of third parties,
Cohen & Steers shall never base a proxy voting decision solely on the opinion of a third party. Rather, decisions shall be based on a reasonable and good faith determination as to how best to maximize shareholder value.
|
| |
• |
|
Shareholder Value. Just as the decision whether to purchase or sell a security is a matter of judgment,
determining whether a specific proxy resolution will increase the market value of a security is a matter of judgment as to which informed parties may differ. In determining how a proxy vote may affect the economic value of a security,
Cohen & Steers shall consider both short-term and long-term views about a company’s business and prospects, especially in light of our projected holding period on the stock (e.g., Cohen & Steers may discount long-term
views on a short-term holding). |
Specific Guidelines
Board and Director Proposals
Election of
Directors
Voting for Director Nominees in Uncontested Elections
Votes on director nominees are made on a case-by-case basis
using a “mosaic” approach, where all factors are considered and no single factor is determinative. In evaluating director nominees, Cohen & Steers considers the following factors:
| • |
|
Whether the nominee attended less than 75 percent of the board and committee meetings without a valid
excuse for the absences; |
| • |
|
Whether the nominee is an inside or affiliated outside director and sits on the audit, compensation, or
nominating committees and/or the full board serves as the audit, compensation, or nominating committees or the company does not have one of these committees; |
| • |
|
Whether the board ignored a significant shareholder proposal that was approved by a majority of the votes cast
in the previous year; |
| • |
|
Whether the board, without shareholder approval, instituted a new poison pill plan, extended an existing plan,
or adopted a new plan upon the expiration of an existing plan during the past year; |
| • |
|
Whether the nominee is the chairman or CEO of a publicly-traded company who serves on more than two
(2) public company boards; |
| • |
|
In the case of nominees other than the chairman or CEO, whether the nominee serves on more than four
(4) public company boards; |
| • |
|
If the nominee is an incumbent director, the length of tenure taking into account tenure limits recommended by
local corporate governance codes1; |
| • |
|
Whether the nominee has a material related party transaction or a material conflict of interest with the
company; |
| • |
|
Whether the nominee (or the entire board) has a record of making poor corporate or strategic decisions or has
demonstrated an overall lack of good business judgment; |
| • |
|
Material failures of governance, stewardship, or fiduciary responsibilities at the company;
|
| • |
|
Materials failures of risk oversight including, but not limited to: |
| |
• |
|
Large or serial fines from regulatory bodies; |
| |
• |
|
Demonstrably poor risk oversight of environment and social issues, including climate change;
|
| |
• |
|
Significant adverse legal judgments or settlements; |
| |
• |
|
Hedging of company stock by employees or directors of a company; or |
| |
• |
|
Significant pledging of company stock in the aggregate by officers or directors of a company;
|
| • |
|
Whether the board has oversight of material climate-related risks and opportunities including, but not limited
to: |
| |
• |
|
The transition and physical risks the company faces related to climate change on its operations and
investments in terms of the impact on its business and financial condition, including the company’s related disclosures; |
| |
• |
|
How the board identifies, measures and manages such risks; and |
| |
• |
|
The board’s oversight of climate-related risk as a part of governance, strategy, risk management, and
metrics and targets; |
| • |
|
Actions related to a nominee’s service on other boards that raise substantial doubt about such
nominee’s ability to effectively oversee management and serve the best interests of shareholders at any company; and |
| • |
|
In the case of a nominee that is the chair of the nominating committee (or other directors on a case-by-case basis), whether the company’s board lacks diversity including, but not limited to, diversity of gender, ethnicity, race and background.
|
Voting for Director Nominees in Contested Elections
Votes in a contested election of directors are evaluated on a
case-by-case basis considering the long-term financial performance of the company relative to its industry management’s track record, the qualifications of the
nominees and other relevant factors.
Board Composition and Gender Diversity
Cohen & Steers encourages companies to continue to evolve diversity and inclusion practices. Cohen & Steers generally votes
against the chair of the nominating committee (or other directors on a case-by-case basis) at companies where the post-election board contains no female directors if the
board has not included a female director during the last 12 months and the company has not articulated a plan to include a qualified female nominee.
| 1 |
For example, in the UK, independent directors of publicly traded companies with tenure exceeding nine
(9) years are reclassified as non-independent unless the company can explain why they remain independent. |
Non-Disclosure of Board Nominees
Cohen & Steers generally votes against the election of director nominees if the names of the nominees are not disclosed prior to the
meeting. However, Cohen & Steers recognizes that companies in certain emerging markets may have legitimate reasons for not disclosing nominee names. In such cases, if a company discloses a legitimate reason why such nominee names have not
been disclosed, Cohen & Steers may vote for the nominees even if nominee names are not disclosed.
Majority Vote Requirement for Directors
(SP)2
Cohen & Steers generally votes for proposals asking the board
to amend the company’s governance documents (charter or bylaws) to provide that director nominees will be elected by the affirmative vote of the majority of votes cast.
Separation of Chairman and CEO (SP)
Cohen & Steers generally votes for proposals to separate the CEO and chairman positions. However, Cohen & Steers does
recognize that under certain circumstances, it may be in the company’s best interest for the CEO and chairman positions to be held by one person.
Independent Chairman (SP)
Cohen & Steers reviews on a case-by-case basis
proposals requiring the chairman’s position to be filled by an independent director taking into account the company’s current board leadership and governance structure, company performance, and any other factors that may be relevant.
Lead Independent Director (SP)
In cases where the CEO and chairman roles are combined or the chairman is not independent, Cohen & Steers votes for the appointment
of a lead independent director.
Board Independence (SP)
Cohen & Steers believes that boards should have a majority of independent directors. Therefore, Cohen & Steers vote for
proposals that require the board to be comprised of a majority of independent directors.
In general, Cohen & Steers considers a
director independent if the director satisfies the independence definition set forth in local corporate governance codes and/or the applicable listing standards of the exchange on which the company’s stock is listed.
In addition, Cohen & Steers generally considers a director independent if the director has no significant financial, familial or
other ties with the company that may pose a conflict and has not been employed by the company in an executive capacity.
Board Size (SP)
Cohen & Steers generally votes for proposals to limit the size of the board to 15 members or less.
Classified Boards (SP)
Cohen & Steers generally votes in favor of proposals to declassify boards of directors. In voting on proposals to declassify a board
of directors, Cohen & Steers evaluates all facts and circumstances, including whether: (i) the current management and board have a history of making good corporate and strategic decisions and (ii) the proposal is in the best
interests of shareholders.
| 2 |
“SP” refers to a shareholder proposal. |
Tiered Boards (non-U.S.)
Cohen & Steers votes in favor of unitary boards as opposed to tiered board structures. Cohen & Steers believes that unitary
boards offer flexibility while, with a tiered structure, there is a risk of upper tier directors becoming remote from the business, while lower tier directors become deprived of contact with outsiders of wider experience. No director should be
excluded from the requirement to submit him/herself for re-election on a regular basis.
Independent
Committees (SP)
Cohen & Steers votes for proposals requesting that a board’s audit, compensation and nominating
committees consist only of independent directors.
Adoption of a Board with Audit Committee Structure (JAPAN)
Cohen & Steers votes for article amendments to adopt a board with an audit committee structure unless the structure obstructs
shareholders’ ability to submit proposals on income allocation related issues or the company already has a 3-committee (U.S. style) structure.
Non-Disclosure of Board Compensation
Cohen & Steers generally votes against the election of director nominees at companies if the compensation paid to such directors is
not disclosed prior to the meeting. However, Cohen & Steers recognizes that companies in certain emerging markets may have legitimate reasons for not disclosing such compensation. In such cases, if a company discloses a legitimate reason
why such compensation should not be disclosed, Cohen & Steers may vote for the nominees even if compensation is not disclosed.
Director
and Officer Indemnification and Liability Protection
Cohen & Steers votes in favor of proposals providing
indemnification for directors and officers for acts conducted in the normal course of business that is consistent with the laws of the jurisdiction of formation. Cohen & Steers also vote in favor of proposals that expand coverage for
directors and officers where, despite an unsuccessful legal defense, the director or officer acted in good faith and in the best interests of the company. Cohen & Steers votes against proposals that would expand indemnification beyond
coverage of legal expenses to coverage of acts, such as gross negligence, that are violations of fiduciary obligations.
Directors’ Liability (non-U.S.)
These proposals ask shareholders to give discharge from responsibility for all
decisions made during the previous financial year. Depending on the country, this resolution may or may not be legally binding, may not release the board from its legal responsibility, and does not necessarily eliminate the possibility of future
shareholder action (although it does make such action more difficult to pursue).
Cohen & Steers will generally vote for the
discharge of directors, including members of the management board and/or supervisory board, unless the board is not fulfilling its fiduciary duties as evidenced by:
| • |
|
A lack of oversight or actions by board members that amount to malfeasance or poor supervision, such as
operating in private or company interest rather than in shareholder interest; |
| • |
|
Any legal issues (e.g., civil/criminal) aimed to hold the board liable for past or current actions that
constitute a breach of trust, such as price fixing, insider trading, bribery, fraud, or other illegal actions; or |
| • |
|
Other egregious governance issues where shareholders are likely to bring legal action against the company or
its directors. |
Directors’ Contracts (non-U.S.)
Best market practice about the appropriate length of directors’ service contracts varies by jurisdiction. As such, Cohen &
Steers votes these proposals on a case-by-case basis taking into account the best interests of the company and its shareholders and local market practice.
Compensation Proposals
Votes
on Executive Compensation. “Say-on-Pay” votes are determined on a
case-by-case basis taking into account the reasonableness of the company’s compensation structure and the adequacy of the disclosure.
Cohen & Steers generally votes against in circumstances where there are an unacceptable number of problematic pay practices
including:
| • |
|
Poor linkage between executive pay and company performance and profitability; |
| • |
|
The presence of objectionable structural features in the compensation plan, such as excessive perquisites,
golden parachutes, tax-gross up provisions, and automatic benchmarking of pay in the top half of the peer group; and |
| • |
|
A lack of proportionality in the plan relative to the company’s size and peer group.
|
Additional Disclosure of Executive and Director Pay (SP). Cohen & Steers generally votes for
shareholder proposals that seek additional disclosure of executive and director pay information.
Frequency of Shareholder Votes on
Executive Compensation. Cohen & Steers generally votes for annual shareholder advisory votes to approve executive compensation.
Golden Parachutes. In general, Cohen & Steers votes against golden parachutes because they impede potential takeovers that
shareholders should be free to consider. Cohen & Steers opposes the use of employment agreements that result in excessive cash payments and generally withhold our vote at the next shareholder meeting for directors who approved golden
parachutes.
In the context of an acquisition, merger, consolidation, or proposed sale, Cohen & Steers votes on a case-by-case basis on proposals to approve golden parachute payments. Factors that may result in a vote against include:
| • |
|
Potentially excessive severance payments; |
| • |
|
Agreements that include excessive excise tax gross-up provisions;
|
| • |
|
Single-trigger payments upon a change in control (“CIC”), including cash payments and the
acceleration of performance-based equity despite the failure to achieve performance measures; |
| • |
|
Single-trigger vesting of equity based on a definition of change in control that requires only shareholder
approval of the transaction (rather than consummation); |
| • |
|
Recent amendments or other changes that may make packages so attractive as to encourage transactions that may
not be in the best interests of shareholders; or |
| • |
|
The company’s assertion that a proposed transaction is conditioned on shareholder approval of the golden
parachute advisory vote. |
Non-Executive Director Remuneration (non-U.S.). Cohen & Steers evaluates these proposals on a case-by-case basis taking into account the remuneration mix and
the adequacy of the disclosure. Cohen & Steers believes that non-executive directors should be compensated with a mix of cash and equity to align their interests with the interests of shareholders.
The details of such remuneration should be fully disclosed and provided with sufficient time for us to consider our vote.
Approval of Annual Bonuses for Directors and Statutory Auditors (JAPAN). Cohen &
Steers generally supports the payment of annual bonuses to directors and statutory auditors except in cases of scandals or extreme underperformance.
Equity Compensation Plans. Votes on proposals related to compensation plans are determined on a case-by-case basis taking into account plan features and equity grant practices, where positive factors may counterbalance negative factors (and vice versa), as evaluated based on three pillars:
| • |
|
Plan Cost: the total estimated cost of the company’s equity plans relative to industry/market cap peers
measured by the company’s estimated shareholder value transfer (SVT) in relation to peers, considering: |
| |
• |
|
SVT based on new shares requested plus shares remaining for future grants, plus outstanding
unvested/unexercised grants; and |
| |
• |
|
SVT based only on new shares requested plus shares remaining for future grants. |
| |
• |
|
Automatic single-trigger award vesting upon a CIC; |
| |
• |
|
Discretionary vesting authority; |
| |
• |
|
Liberal share recycling on various award types; and |
| |
• |
|
Minimum vesting period for grants made under the plan. |
| |
• |
|
The company’s three year burn rate relative to its industry/market cap peers; |
| |
• |
|
Vesting requirements for most recent CEO equity grants (3-year
look-back); |
| |
• |
|
The estimated duration of the plan based on the sum of shares remaining available and the new shares requested
divided by the average annual shares granted in the prior three years; |
| |
• |
|
The proportion of the CEO’s most recent equity grants/awards subject to performance conditions;
|
| |
• |
|
Whether the company maintains a claw-back policy; and |
| |
• |
|
Whether the company has established post exercise/vesting shareholding requirements. |
Cohen & Steers generally votes against compensation plan proposals if the combination of factors indicates that the plan, overall is
not, in the interests of shareholders, or if any of the following apply:
| • |
|
Awards may vest in connection with a liberal CIC; |
| • |
|
The plan would permit re-pricing or cash buyout of underwater options
without shareholder approval; |
| • |
|
The plan is a vehicle for problematic pay practices or a pay-for-performance disconnect; or |
| • |
|
Any other plan features that are determined to have a significant negative impact on shareholder interests.
|
Equity Compensation Plans (non-U.S.). Cohen & Steers evaluates
these proposals on a case-by-case basis. Share option plans should be clearly explained and fully disclosed to both shareholders and participants and put to shareholders
for approval. Each director’s share options should be detailed, including exercise prices, expiration dates and the market price of the shares at the date of exercise. They should take into account appropriate levels of dilution. Options should
vest in reference to challenging performance criteria, which are disclosed in advance. Share options should be fully expensed so that shareholders can assess their true cost to the company. The assumptions and methodology behind the expensing
calculation should also be disclosed to shareholders.
Long-Term Incentive Plans
(non-U.S.). A long-term incentive plan refers to any arrangement, other than deferred bonuses and retirement benefit plans, which require one or more conditions in respect of service and/or performance to
be satisfied over more than one financial year.
Cohen & Steers evaluates these proposals on a case-by-case basis. Cohen & Steers generally votes in favor of plans with robust incentives and challenging performance criteria that are fully disclosed to shareholders in advance and vote against
plans that are excessive or contain easily achievable
performance metrics or where there is excessive discretion delegated to remuneration committees. Cohen & Steers would expect remuneration committees to explain why criteria are
considered to be challenging and how they align the interests of shareholders with the interests of the plan participants. Cohen & Steers will also vote against proposals that lack sufficient disclosure.
Transferable Stock Options. Cohen & Steers evaluates on a
case-by-case basis proposals to grant transferable stock options or otherwise permit the transfer of outstanding stock options, including the cost of the proposal and
alignment with shareholder interests.
Approval of Cash or
Cash-and-Stock Bonus Plans. Cohen & Steers votes to approve cash or
cash-and-stock bonus plans that seek to exempt executive compensation from limits on deductibility imposed by Section 162(m) of the Internal Revenue Code.
Employee Stock Purchase Plans. Cohen & Steers votes for the approval of employee stock purchase plans, although
Cohen & Steers generally believes the discounted purchase price should not exceed 15% of the current market price.
401(k)
Employee Benefit Plans. Cohen & Steers votes for proposals to implement a 401(k) savings plan for employees.
Pension
Arrangements (non-U.S.). Cohen & Steers evaluates these proposals on a case-by-case basis. Pension arrangements
should be transparent and cost-neutral to shareholders. Cohen & Steers believes it is inappropriate for executives to participate in pension arrangements that are materially different than those offered to other employees (such as
continuing to participate in a final salary arrangement when employees have been transferred to a money purchase plan). One-off payments into individual director’s pension plans, changes to pension
entitlements, and waivers concerning early retirement provisions must be fully disclosed and justified to shareholders.
Stock
Ownership Requirements (SP). Cohen & Steers supports proposals requiring senior executives and directors to hold a minimum amount of stock in a company (often expressed as a percentage of annual compensation), which may include
restricted stock or restricted stock units.
Stock Holding Periods (SP). Cohen & Steers generally votes against proposals
requiring executives to hold stock received upon option exercise for a specific period of time.
Recovery of Incentive Compensation
(SP). Cohen & Steers generally votes for proposals to recover incentive bonuses or other incentive payments made to senior executives if it is later determined that fraud, misconduct, or negligence significantly contributed to a
restatement of financial results that led to the award of incentive compensation.
Capital Structure Changes and Anti-Takeover Proposals
Increase to Authorized Shares. Cohen & Steers generally votes for increases in authorized shares, provided that
the increase is not greater than three times the number of shares outstanding and reserved for issuance (including shares reserved for stock-related plans and securities convertible into common stock, but not shares reserved for any poison pill
plan).
Blank Check Preferred Stock. Cohen & Steers generally votes against proposals authorizing the creation of new
classes of preferred stock without specific voting, conversion, distribution and other rights, and proposals to increase the number of authorized blank check preferred shares. Cohen & Steers may vote in favor of these proposals if
Cohen & Steers receives reasonable assurances that (i) the preferred stock was authorized by the board for legitimate capital formation purposes and not for anti-takeover purposes, and (ii) no preferred stock will be issued with
voting power that is disproportionate to the economic interests of the preferred stock. These representations should be made either in the proxy statement or in a separate letter from the company to us.
Pre-Emptive Rights. Cohen & Steers
generally votes against the issuance of equity shares with pre-emptive rights. However, Cohen & Steers may vote for shareholder pre-emptive rights where such pre-emptive rights are necessary taking into account the best interests of the company’s shareholders. In addition, we acknowledge that international local practices may call for shareholder pre-emptive rights when a company seeks authority to issue shares (e.g., UK authority for the issuance of only up to 5% of outstanding shares without pre-emptive
rights). While Cohen & Steers prefers that companies be permitted to issue shares without pre-emptive rights, in deference to international local practices, Cohen & Steers will approve
issuance requests with pre-emptive rights.
Dual Class Capitalizations.
Because classes of common stock with unequal voting rights limit the rights of certain shareholders, Cohen & Steers votes against the adoption of a dual or multiple class capitalization structure. Cohen & Steers supports the one-share, one-vote principle for voting.
Restructurings/Recapitalizations. Cohen & Steers reviews proposals to increase common and/or preferred shares and to issue
shares as part of a debt restructuring plan on a case-by-case basis. In voting, Cohen & Steers considers the following:
| • |
|
Dilution: how much will the ownership interest of existing shareholders be reduced, and how extreme will
dilution to any future earnings be? |
| • |
|
Change in control: will the transaction result in a change in control of the company? |
| • |
|
Bankruptcy: generally approve proposals that facilitate debt restructurings unless there are clear signs of
self-dealing or other abuses. |
Share Repurchase Programs. Cohen & Steers generally votes in favor of
such programs where the repurchase would be in the long-term best interests of shareholders and where we believe that this is a good use of the company’s cash.
Cohen & Steers will vote against such programs when shareholders’ interests could be better served by deployment of the cash for
alternative uses, or where the repurchase is a defensive maneuver or an attempt to entrench management.
Targeted Share Placements
(SP). Cohen & Steers votes these proposals on a case-by-case basis. These proposals ask companies to seek shareholder approval before placing 10% or more of
their voting stock with a single investor. The proposals are typically in reaction to the placement of a large block of voting stock in an employee stock option plan, parent capital fund or with a single friendly investor, with the aim of protecting
the company against a hostile tender offer.
Shareholder Rights Plans. Cohen & Steers reviews proposals to ratify
shareholder rights plans (poison pills) on a case-by-case basis taking into consideration the length of the plan.
Shareholder Rights Plans (JAPAN). Cohen & Steers reviews proposals on a case-by-case basis examining not only the features of the plan itself but also factors including share price movements, shareholder composition, board composition, and the company’s announced plans to
improve shareholder value.
Reincorporation Proposals. Proposals to change a company’s jurisdiction of incorporation are
examined on a case-by-case basis. When evaluating such proposals, Cohen & Steers reviews management’s rationale for the proposal, changes to the
charter/bylaws, and differences in the applicable laws governing the companies.
Voting on State Takeover Statutes (SP).
Cohen & Steers reviews on a case-by-case basis proposals to opt in or out of state takeover statutes (including control share acquisition statutes, control
share cash-out statutes, freeze-out provisions, fair price provisions, stakeholder laws, poison pill endorsements, severance pay and labor contract provisions and
disgorgement provisions). In voting on these proposals, Cohen & Steers takes into account whether the proposal is in the long-term best interests of the company and whether it would be in the best interests of the company to thwart a
shareholder’s attempt to control the board of directors.
Mergers and Corporate Restructurings
Mergers and Acquisitions. Votes on mergers and acquisitions are considered on a case-by-case basis, taking into account the anticipated financial and operating benefits, offer price (cost vs. premium), prospects of the combined companies, how the deal was negotiated and changes in
corporate governance and their impact on shareholder rights.
Cohen & Steers votes against proposals that require a
super-majority of shareholders to approve a merger or other significant business combination.
Nonfinancial Effects of a Merger or
Acquisition. Some companies have proposed charter provisions that specify that the board of directors may examine the nonfinancial effects of a merger or acquisition on the company. This provision would allow the board to evaluate the impact a
proposed change in control would have on employees, host communities, suppliers and/or others. Cohen & Steers generally vote against proposals to adopt such charter provisions. Directors should base their decisions solely on the financial
interests of the shareholders.
Spin-offs. Cohen & Steers evaluates spin-offs on a case-by-case basis taking into account the tax and regulatory advantages, planned use of sale proceeds, market focus, and managerial incentives.
Asset Sales. Cohen & Steers evaluates asset sales on a
case-by-case basis taking into account the impact on the balance sheet/working capital, value received for the assets, and potential elimination of diseconomies.
Liquidations. Cohen & Steers evaluates liquidations on a
case-by-case basis taking into account management’s efforts to pursue other alternatives, appraisal value of the assets, and the compensation plan for executives
managing the liquidation.
Issuance of Debt (non-U.S.). Cohen & Steers evaluates
these proposals on a case-by-case basis. Reasons for increased bank borrowing powers are numerous and varied, including allowing for normal growth of the company, the
financing of acquisitions, and allowing increased financial leverage. Management may also attempt to borrow as part of a takeover defense. Cohen & Steers generally votes in favor of proposals that will enhance a company’s long-term
prospects. Cohen & Steers votes against any uncapped or poorly-defined increase in bank borrowing powers or borrowing limits, issuances that would result in the company reaching an unacceptable level of financial leverage or a material
reduction in shareholder value, or where such borrowing is expressly intended as part of a takeover defense.
Ratification of Auditors
Cohen & Steers generally votes for proposals to ratify auditors, auditor remuneration and/or proposals authorizing the board to fix
audit fees, unless:
| • |
|
an auditor has a financial interest in or association with the company, and is therefore not independent;
|
| • |
|
there is reason to believe that the independent auditor has rendered an opinion that is neither accurate nor
indicative of the company’s financial position; |
| • |
|
the name of the proposed auditor and/or fees paid to the audit firm are not disclosed by the company prior to
the meeting; |
| • |
|
the auditors are being changed without explanation; or |
| • |
|
fees paid for non-audit related services are excessive and/or exceed
fees paid for audit services or limits set by local best practice recommendations or law. |
Where fees for non-audit services include fees related to
significant one-time capital structure events, initial public offerings, bankruptcy emergence, and spinoffs, and the company makes public disclosure of the amount and nature of those fees, then such fees may
be excluded from the non-audit fees considered in determining whether non-audit related fees are excessive.
Auditor Rotation
Cohen & Steers evaluates auditor rotation proposals on a
case-by-case basis taking into account the following factors: the tenure of the audit firm; establishment and disclosure of a review process whereby the auditor is
regularly evaluated for both audit quality and competitive pricing; length of the rotation period advocated in the proposal; and any significant audit related issues.
Auditor Indemnification
Cohen & Steers generally votes against auditor indemnification and limitation of liability. However, Cohen & Steers
recognizes there may be situations where indemnification and limitations on liability may be appropriate.
Annual Accounts and Reports (non-U.S.)
Annual reports and accounts should be detailed and transparent and should be
submitted to shareholders for approval in a timely manner as prescribed by law. They should meet accepted reporting standards such as those prescribed by the International Accounting Standards Board (IASB).
Cohen & Steers generally approves proposals relating to the adoption of annual accounts provided that:
| • |
|
The report has been examined by an independent external accountant and the accuracy of material items in the
report is not in doubt; |
| • |
|
The report complies with legal and regulatory requirements and best practice provisions in local markets;
|
| • |
|
the company discloses which portion of the remuneration paid to the external accountant relates to auditing
activities and which portion relates to non-auditing advisory assignments; |
| • |
|
A report on the implementation of risk management and internal control measures is incorporated, including an in-control statement from company management; |
| • |
|
A report should include a statement of compliance with relevant codes of best practice for markets where they
exist (e.g., for UK companies a statement of compliance with the Corporate Governance Code should be made, together with detailed explanations about any area(s) of non-compliance);
|
| • |
|
A conclusive response is given to all queries from shareholders; and |
| • |
|
Other concerns about corporate governance have not been identified. |
Appointment of Internal Statutory Auditor (JAPAN)
Cohen & Steers evaluates these proposals on a
case-by-case basis taking into account the work history of each nominee. If the nominee is designated as independent but has worked the majority of his or her career for
one of the company’s major shareholders, lenders, or business partners, Cohen & Steers considers the nominee affiliated and will withhold support.
Shareholder Access and Voting Proposals
Proxy Access. Cohen & Steers reviews proxy access proposals on a case-by-case basis taking into account the parameters of proxy access use in light of a company’s specific circumstances. Cohen & Steers generally supports proposals that provide shareholders
with a reasonable opportunity to use the right without stipulating overly restrictive or onerous parameters for use and also provide assurances that the mechanism will not be subject to abuse by short-term investors, investors without a substantial
investment in the company or investors seeking to take control of the board.
Bylaw Amendments. Cohen & Steers votes on a case-by-case basis on proposals requesting companies grant shareholders the ability to amend bylaws. Similar to proxy access, Cohen & Steers generally supports proposals that provide assurances that
this right will not be subject to abuse by short-term investors or investors without a substantial investment in a company.
Reimbursement of Proxy Solicitation Expenses (SP). In the absence of compelling reasons, Cohen & Steers will generally
not support such proposals.
Shareholder Ability to Call Special Meetings (SP). Cohen & Steers votes on a case-by-case basis on proposals requesting companies amend their governance documents (bylaws and/or charter) in order to allow shareholders to call special meetings.
Shareholder Ability to Act by Written Consent (SP). Cohen & Steers generally votes against proposals to allow or facilitate
shareholder action by written consent to provide reasonable protection of minority shareholder rights.
Shareholder Ability to Alter
the Size of the Board. Cohen & Steers generally votes for proposals that seek to fix the size of the board and vote against proposals that give the board the ability to alter the size of the board without shareholder approval. While
Cohen & Steers recognizes the importance of such proposals, these proposals may be set forth in order to promote the agenda(s) of certain special interest groups and could be disruptive to management of the company.
Cumulative Voting (SP). Having the ability to cumulate votes for the election of directors (i.e., to cast more than one vote for a
director) generally increases shareholders’ rights to effect change in the management of a company. However, Cohen & Steers acknowledges that cumulative voting promotes special candidates who may not represent the interests of all, or
even a majority, of shareholders. Therefore, when voting on proposals to institute cumulative voting, Cohen & Steers evaluates all facts and circumstances surrounding such proposal and generally vote against cumulative voting where the
company has good corporate governance practices in place, including majority voting for director elections and a de-classified board.
Supermajority Vote Requirements (SP). Cohen & Steers generally supports proposals that seek to lower supermajority voting
requirements.
Confidential Voting. Cohen & Steers votes for proposals requesting that companies adopt confidential
voting, use independent tabulators, and use independent inspectors of election as long as such proposals permit management to request that dissident groups honor its confidential voting policy in the case of proxy contests.
Virtual Shareholder Meetings (SP). Cohen & Steers generally votes for management proposals allowing for the convening of
shareholder meetings by electronic means, so long as they do not preclude in-person meetings and companies allow for comparable rights and opportunities for shareholders to participate electronically as they
would have during an in-person meeting.
Date/Location of Meeting (SP). Cohen &
Steers votes against shareholder proposals to change the date or location of the shareholders’ meeting.
Adjourn Meeting if Votes
Are Insufficient. Cohen & Steers generally votes against open-end requests for adjournment of a shareholder meeting. However, where management specifically states the reason for requesting an
adjournment and the requested adjournment is necessary to permit a proposal that would otherwise be supported under this policy to be carried out, the adjournment request will be supported.
Disclosure of Shareholder Proponents (SP). Cohen & Steers votes for shareholder
proposals requesting that companies disclose the names of shareholder proponents. Shareholders may wish to contact the proponents of a shareholder proposal for additional information.
Environmental and Social Proposals
Cohen & Steers believes that well-managed companies should be identifying, evaluating and assessing environmental and social issues
and, where material to its business, managing exposure to environmental and social risks related to these issues. When considering management or shareholder proposals relating to these issues, because of the diverse nature of environmental and
social proposals, Cohen & Steers evaluates these proposals on a case-by-case basis. The principles guiding our evaluation of these proposals include, but are
not limited to:
| |
• |
|
The current level of publicly available disclosure from the company or other publicly available sources,
including if the company already discloses similar information through existing reports or policies; |
| |
• |
|
Whether implementation of a proposal is likely to enhance or protect shareholder value; |
| |
• |
|
Whether a proposal can be implemented at a reasonable cost |
| |
• |
|
Whether the information requested concerns business issues that relate to a meaningful percentage of the
company’s business; |
| |
• |
|
The degree to which the company’s stated position on the issues raised in the proposal could affect its
reputation or sales; |
| |
• |
|
Whether the company has already responded in some appropriate manner to the request embodied in the proposal;
|
| |
• |
|
What other companies in the relevant industry have done in response to the issue addressed in the proposal;
and |
| |
• |
|
Whether implementation would reveal proprietary or confidential information that could place the company at a
competitive disadvantage. |
Environmental Proposals (SP). Cohen & Steers acknowledges that environmental
considerations can pose significant investment risks and opportunities. Therefore, Cohen & Steers generally votes in favor of proposals requesting a company disclose information that will aid in the determination of material environmental
issues impacting the company and, where material to its business, how the company is managing exposure to environmental risks related to these issues, taking into consideration the following factors:
| • |
|
The general factors listed above; and |
| • |
|
Whether the issues presented have already been effectively dealt with through governmental regulation or
legislation. |
In particular in relation to climate-related risk and opportunities material to its business, we expect
companies to help their investors understand how they may be impacted by such risk and opportunities, and how these factors are considered within strategy in a manner consistent with the company’s business model and sector. The principles
guiding our evaluation of these proposals are:
| • |
|
The general factors listed above; |
| • |
|
The transition and physical risks the company faces related to climate change on its operations and investment
in terms of the impact on its business and financial condition, including the company’s related disclosures; |
| • |
|
How the company identifies, measures and manages such risks; and |
| • |
|
The company’s approach to climate-related risk as part of governance, strategy, risk management, and
metrics and targets. |
Social Proposals (SP). Cohen & Steers acknowledges that social considerations can
pose significant risks and opportunities. There, Cohen & Steers generally votes in favor of proposals requesting a company disclose information that will aid in the determination of material social issues impacting the company and, where
material to its business, how the company is managing exposure to social risks related to these issues.
Cohen & Steers believes
board and workforce diversity are beneficial to the decision-making process and can enhance long-term profitability. Therefore, Cohen & Steers generally votes in favor of proposals that seek to increase board and workforce diversity
including, but not limited to, diversity of gender, ethnicity, race and background. Cohen & Steers votes all other social proposals on a case-by-case basis,
including, but not limited to, proposals related to political and charitable contributions, lobbying, and gender equality and the gender pay gap.
Miscellaneous Proposals
Bundled Proposals. Cohen & Steers reviews on a
case-by-case basis bundled or “conditioned” proposals. For items that are conditioned upon each other, Cohen & Steers examines the benefits and costs
of the bundled items. In instances where the combined effect of the conditioned items is not in shareholders’ best interests, Cohen & Steers votes against such proposals. If the combined effect is positive, Cohen & Steers
supports such proposals. In the case of bundled director proposals, Cohen & Steers will vote for the entire slate only if Cohen & Steers would have otherwise voted for each director on an individual basis.
Other Business. Cohen & Steers generally votes against proposals to approve other business where Cohen & Steers
cannot determine the exact nature of the proposal(s) to be voted on.
Item 8. Portfolio Managers of
Closed-End Investment Companies.
Information pertaining to the portfolio managers of the
Registrant, as of March 8, 2024, is set forth below.
|
|
|
| William F. Scapell
• Vice President
• Portfolio manager since inception |
|
Executive Vice President of C&S since 2014. Prior to that, Senior Vice President of C&S since 2003. |
|
|
| Elaine Zaharis-Nikas
• Portfolio manager since 2022 |
|
Senior Vice President of C&S since 2014. Prior to that, Vice President of C&S since 2005. |
|
|
| Jason A. Yablon
• Vice President
• Portfolio manager since 2012 |
|
Executive Vice President of C&S since January, 2022. Prior to that, Senior Vice President of C&S since 2014. Prior
to that, Vice President of C&S since 2008. |
|
|
|
| Mathew Kirschner
• Vice President
• Portfolio manager since 2019 |
|
Senior Vice President of C&S since 2019. Prior to that, Vice President of C&S since 2010. |
|
|
| Jerry Dorost
• Portfolio manager since 2022 |
|
Senior Vice President of C&S since 2019. Prior to that, Vice President of C&S since 2012. |
C&S utilizes a team-based approach in managing the Registrant. Mr. Yablon, Mr. Kirschner,
Ms. Zaharis-Nikas and Mr. Dorost direct and supervise the execution of the Registrant’s investment strategy, and lead and guide the other members of the team. Mr. Scapell manages the Registrant’s preferred securities
investments.
Each portfolio manager listed above manages other investment companies and/or investment vehicles and accounts in addition
to the Registrant. The following tables show, as of December 31, 2023, the number of other accounts each portfolio manager managed in each of the listed categories and the total assets in the other accounts managed within each category. Two
(2) of the 35 accounts managed by Mr. Yablon, and two (2) of the 29 accounts managed by Mr. Kirschner, with total assets of $262.3 million, are subject to performance-based fees.
|
|
|
|
|
|
|
| William F. Scapell |
|
Number of accounts |
|
Total assets |
|
|
|
|
| • Registered investment companies |
|
13 |
|
$ |
19,028,040,201 |
|
|
|
|
| • Other pooled investment vehicles |
|
16 |
|
$ |
3,022,141,466 |
|
|
|
|
| • Other accounts |
|
23 |
|
$ |
3,059,241,045 |
|
|
|
|
| Elaine Zaharis-Nikas |
|
Number of accounts |
|
Total assets |
|
|
|
|
| • Registered investment companies |
|
11 |
|
$ |
16,246,158,888 |
|
|
|
|
| • Other pooled investment vehicles |
|
15 |
|
$ |
2,992,498,179 |
|
|
|
|
| • Other accounts |
|
20 |
|
$ |
2,542,143,053 |
|
|
|
|
| Jason A. Yablon |
|
Number of accounts |
|
Total assets |
|
|
|
|
| • Registered investment companies |
|
11 |
|
$ |
25,108,313,462 |
|
|
|
|
| • Other pooled investment vehicles |
|
18 |
|
$ |
8,578,716,880 |
|
|
|
|
| • Other accounts |
|
35 |
|
$ |
6,111,105,698 |
|
|
|
|
| Mathew Kirschner |
|
Number of accounts |
|
Total assets |
|
|
|
|
| • Registered investment companies |
|
10 |
|
$ |
23,280,799,586 |
|
|
|
|
| • Other pooled investment vehicles |
|
20 |
|
$ |
10,627,016,270 |
|
|
|
|
| • Other accounts |
|
29 |
|
$ |
5,624,061,401 |
|
|
|
|
|
|
|
|
| Jerry Dorost |
|
Number of accounts |
|
Total assets |
|
|
|
|
| • Registered investment companies |
|
9 |
|
$ |
13,057,000,329 |
|
|
|
|
| • Other pooled investment vehicles |
|
15 |
|
$ |
2,992,498,179 |
|
|
|
|
| • Other accounts |
|
20 |
|
$ |
2,542,143,053 |
|
Share Ownership. The following table indicates the dollar range of securities of the Registrant owned
by the Registrant’s portfolio managers as of December 31, 2023:
|
|
|
| |
|
Dollar Range of Securities
Owned |
|
William F. Scapell |
|
$10,001–$50,000 |
|
Elaine Zaharis-Nikas |
|
None |
|
Jason A. Yablon |
|
None |
|
Mathew Kirschner |
|
None |
|
Jerry Dorost |
|
None |
Conflicts of Interest. It is possible that conflicts of interest may arise in connection with the
portfolio manager’s management of the Registrant’s investments on the one hand and the investments of other accounts or vehicles for which the portfolio managers are responsible on the other. For example, a portfolio manager may have
conflicts of interest in allocating management time, resources and investment opportunities among the Registrant and the other accounts or vehicles he advises. In addition, due to differences in the investment strategies or restrictions among the
Registrant and the other accounts, a portfolio manager may take action with respect to another account that differs from the action taken with respect to the Registrant.
In some cases, another account managed by a portfolio manager may provide more revenue to the Registrant’s investment advisor. While this
may appear to create additional conflicts of interest for the portfolio manager in the allocation of management time, resources and investment opportunities, the investment advisor strives to ensure that portfolio managers endeavor to exercise their
discretion in a manner that is equitable to all interested persons. In this regard, in the absence of specific account-related impediments (such as client-imposed restrictions or lack of available cash), it is the policy of the investment advisor to
allocate investment ideas pro rata to all accounts with the same primary investment objective.
In addition, certain of the portfolio
managers may from time to time manage one or more accounts on behalf of the Registrant’s investment advisor and its affiliated companies (the “CNS Accounts”). Certain securities held and traded in the CNS Accounts also may be held and
traded in one or more client accounts. It is the policy of the investment advisor however not to put the interests of the CNS Accounts ahead of the interests of client accounts. The investment advisor may aggregate orders of client accounts with
those of the CNS Accounts; however, under no circumstances will preferential treatment be given to the CNS Accounts. For all orders involving the CNS Accounts, purchases or sales will be allocated prior to trade placement, and orders that are only
partially filled will be allocated across all accounts in proportion to the shares each account, including the CNS Accounts, was designated to receive prior to trading. As a result, it is expected that the CNS Accounts will receive the same average
price as other accounts included in the aggregated order. Shares will not be allocated or re-allocated to the CNS Accounts after trade execution or after the average price is known. In the event so few shares
of an order
are executed that a pro-rata allocation is not practical, a rotational system of allocation may be used; however, the CNS Accounts will never be part of
that rotation or receive shares of a partially filled order other than on a pro-rata basis.
Because certain CNS Accounts are managed with a cash management objective, it is possible that a security will be sold out of the CNS Accounts
but continue to be held for one or more client accounts. In situations when this occurs, such security will remain in a client account only if the portfolio manager, acting in its reasonable judgment and consistent with its fiduciary duties,
believes this is appropriate for, and consistent with the objectives and profile of, the client account.
Advisor Compensation
Structure. Compensation of the investment advisor’s portfolio managers and other investment professionals has three primary components: (1) a base salary, (2) an annual cash bonus and (3) annual stock-based compensation
consisting generally of restricted stock units of the investment advisor’s parent, CNS. The investment advisor’s investment professionals, including the portfolio managers, also receive certain retirement, insurance and other benefits that
are broadly available to all of its employees. Compensation of the investment advisor’s investment professionals is reviewed primarily on an annual basis.
Method to Determine Compensation. The Registrant’s investment advisor compensates its portfolio managers based primarily on the
total return performance of funds and accounts managed by the portfolio manager versus appropriate peer groups or benchmarks. C&S uses a variety of benchmarks to evaluate each portfolio managers’ performance for compensation purposes,
including the FTSE Nareit All Equity REITs Index, ICE BofA Fixed Rate Preferred Securities Index and other broad based indexes based on the asset classes managed by each portfolio manager. In evaluating the performance of a portfolio manager,
primary emphasis is normally placed on one- and three-year performance, with secondary consideration of performance over longer periods of time. Performance is evaluated on a
pre-tax and pre-expense basis. In addition to rankings within peer groups of funds on the basis of absolute performance, consideration may also be given to risk-adjusted
performance. For funds and accounts with a primary investment objective of high current income, consideration will also be given to the fund’s and account’s success in achieving this objective. For portfolio managers responsible for
multiple funds and accounts, investment performance is evaluated on an aggregate basis. The investment advisor has three funds or accounts with performance-based advisory fees. Portfolio managers are also evaluated on the basis of their success in
managing their dedicated team of analysts. Base compensation for portfolio managers of the investment advisor varies in line with the portfolio manager’s seniority and position with the firm.
Salaries, bonuses and stock-based compensation are also influenced by the operating performance of the investment advisor and CNS. While the
annual salaries of the investment advisor’s portfolio managers are fixed, cash bonuses and stock based compensation may fluctuate significantly from year to year, based on changes in manager performance and other factors.
Item 9. Purchases of Equity Securities by Closed-End Management Investment Company and Affiliated Purchasers.
None.
Note: On
December 12, 2023, the Board of Directors of the Fund approved continuation of the delegation of its authority to management to effect repurchases, pursuant to management’s discretion and subject to market conditions and investment
considerations, of up to 10% of the Fund’s common shares outstanding (“Share Repurchase Program”) as of January 1, 2024 through December 31, 2024.
Item 10. Submission of Matters to a Vote of Security Holders.
There have been no material changes to the procedures by which shareholders may recommend nominees to the Registrant’s Board implemented
after the Registrant last provided disclosure in response to this Item.
Item 11. Controls and Procedures.
| (a) |
The Registrant’s principal executive officer and principal financial officer have concluded that the
Registrant’s disclosure controls and procedures are reasonably designed to ensure that information required to be disclosed by the Registrant in this Form N-CSR was recorded, processed, summarized and
reported within the time periods specified in the Securities and Exchange Commission’s rules and forms, based upon such officers’ evaluation of these controls and procedures as of a date within 90 days of the filing date of this report.
|
| (b) |
There were no changes in the Registrant’s internal control over financial reporting that occurred
during the period covered by this report that have materially affected, or are reasonably likely to materially affect, the Registrant’s internal control over financial reporting. |
Item 12. Disclosure of Securities Lending Activities for Closed-End Management Investment Companies.
| (a) |
For the fiscal year ended December 31, 2023, the Registrant had the following dollar amounts of income
and fees/compensation related to its securities lending activities: |
|
|
|
|
|
| |
|
Total |
|
| Gross income from securities lending activities |
|
|
$888,290 |
|
| Fees
and/or compensation for securities lending activities and related services |
|
|
|
|
| Fees paid
to securities lending agent from a revenue split |
|
|
$266,487 |
|
| Fees paid
for cash collateral management services (including fees deducted from a pooled cash collateral reinvestment vehicle) that are not included in the revenue split |
|
|
— |
|
|
Administrative fees that are not included in the revenue split |
|
|
— |
|
|
Indemnification fee not included in the revenue split |
|
|
— |
|
| Rebates
paid to borrowers; |
|
|
— |
|
| Other
fees relating to the securities lending program not included in the revenue split |
|
|
— |
|
| Aggregate fees/compensation for securities lending activities and related services |
|
|
$266,487 |
|
| Net income from securities lending activities |
|
|
$621,803 |
|
| (b) |
During the Registrant’s most recent fiscal year ended December 31, 2023, BNP Paribas
(“BNPP”) served as the Registrant’s securities lending agent. |
As a securities lending agent, BNPP is
responsible for the implementation and administration of the Registrant’s securities lending program. Pursuant to its respective Securities Lending Agreement (“Securities Lending Agreement”) with the Registrant, BNPP, as a general
matter, performs various services, including the following:
| |
• |
|
Monitoring daily the value of the loaned securities and collateral (i.e. the collateral posted by the
party borrowing); |
| |
• |
|
Negotiation of loan terms; |
| |
• |
|
Selection of securities to be loaned; |
| |
• |
|
Recordkeeping and account servicing; |
| |
• |
|
Monitoring of dividend activity and material proxy votes relating to loaned securities, and;
|
| |
• |
|
Arranging for return of loaned securities to the Registrant at loan termination. |
BNPP is compensated for the above-described services from its securities lending revenue split. The table above shows what the Registrant
earned and the fees and compensation it paid in connections with its securities lending activities during its most recent fiscal year.
Item 13.
Exhibits.
(a)(1) Not applicable.
(a)
(2) Certifications of principal executive officer and principal financial officer as required by Rule 30a-2(a) under the Investment Company Act of 1940.
(a)(3) Not applicable.
(a)(4) Not applicable.
(b) Certifications
of principal executive officer and principal financial officer as required by Rule 30a-2(b) under the Investment Company Act of 1940.
(c) Registrant’s notices to shareholders pursuant to Registrant’s exemptive order granting an exemption from
Section 19(b) of the 1940 Act and Rule 19b-1 thereunder regarding distributions pursuant to the Registrant’s Managed Distribution Plan.
SIGNATURES
Pursuant to the requirements of the Securities Exchange Act of 1934 and the Investment Company Act of 1940, the Registrant has duly caused
this report to be signed on its behalf by the undersigned, thereunto duly authorized.
COHEN & STEERS REIT AND PREFERRED AND INCOME FUND, INC.
|
|
|
|
|
|
|
|
|
|
By: |
|
/s/ James Giallanza |
|
|
|
|
Name: James Giallanza
Title: Principal Executive Officer
(President and Chief Executive Officer) |
|
|
|
|
|
Date: |
|
March 8, 2024 |
Pursuant to the requirements of the Securities Exchange Act of 1934 and the Investment Company Act of 1940,
this report has been signed below by the following persons on behalf of the Registrant and in the capacities and on the dates indicated.
|
|
|
|
|
|
|
|
|
|
By: |
|
/s/ James Giallanza |
|
|
|
|
Name: James Giallanza
Title: Principal Executive Officer
(President and Chief Executive Officer) |
|
|
|
|
|
By: |
|
/s/ Albert Laskaj |
|
|
|
|
Name: Albert Laskaj
Title: Principal Financial Officer
(Treasurer and Chief Financial Officer) |
|
|
|
|
Date: March 8, 2024 |
EX-99.CERT
EXHIBIT 13 (a)(2)
RULE 30a-2(a) CERTIFICATIONS
I, James Giallanza, certify that:
| 1. |
I have reviewed this report on Form N-CSR of Cohen & Steers
REIT and Preferred and Income Fund, Inc.; |
| 2. |
Based on my knowledge, this report does not contain any untrue statement of a material fact or omit to state
a material fact necessary to make the statements made, in light of the circumstances under which such statements were made, not misleading with respect to the period covered by this report; |
| 3. |
Based on my knowledge, the financial statements, and other financial information included in this report,
fairly present in all material respects the financial condition, results of operations, changes in net assets, and cash flows (if the financial statements are required to include a statement of cash flows) of the Registrant as of, and for, the
periods presented in this report; |
| 4. |
The Registrant’s other certifying officer and I are responsible for establishing and maintaining
disclosure controls and procedures (as defined in Rule 30a-3(c) under the Investment Company Act of 1940) and internal control over financial reporting (as defined in Rule
30a-3(d) under the Investment Company Act of 1940) for the Registrant and have: |
| |
(a) |
designed such disclosure controls and procedures, or caused such disclosure controls and procedures to be
designed under our supervision, to ensure that material information relating to the Registrant, including its consolidated subsidiaries, is made known to us by others within those entities, particularly during the period in which this report is
being prepared; |
| |
(b) |
designed such internal control over financial reporting, or caused such internal control over financial
reporting to be designed under our supervision, to provide reasonable assurance regarding the reliability of financial reporting and the preparation of financial statements for external purposes in accordance with generally accepted accounting
principles; |
| |
(c) |
evaluated the effectiveness of the Registrant’s disclosure controls and procedures and presented in
this report our conclusions about the effectiveness of the disclosure controls and procedures, as of a date within 90 days prior to the filing date of this report based on such evaluation; and |
| |
(d) |
disclosed in this report any change in the Registrant’s internal control over financial reporting that
occurred during the period covered by this report that has materially affected, or is reasonably likely to materially affect, the Registrant’s internal control over financial reporting; and |
| 5. |
The Registrant’s other certifying officer and I have disclosed to the Registrant’s auditors and
the audit committee of the Registrant’s board of directors (or persons performing the equivalent functions): |
| |
(a) |
all significant deficiencies and material weaknesses in the design or operation of internal control over
financial reporting which are reasonably likely to adversely affect the Registrant’s ability to record, process, summarize, and report financial information; and |
| |
(b) |
any fraud, whether or not material, that involves management or other employees who have a significant role
in the Registrant’s internal control over financial reporting. |
|
| /s/ James Giallanza |
| James Giallanza |
| Principal Executive Officer (President and
Chief Executive Officer) |
EXHIBIT 13 (a)(2)
RULE 30a-2(a) CERTIFICATIONS
I, Albert Laskaj, certify that:
| 1. |
I have reviewed this report on Form N-CSR of Cohen & Steers
REIT and Preferred and Income Fund, Inc.; |
| 2. |
Based on my knowledge, this report does not contain any untrue statement of a material fact or omit to state
a material fact necessary to make the statements made, in light of the circumstances under which such statements were made, not misleading with respect to the period covered by this report; |
| 3. |
Based on my knowledge, the financial statements, and other financial information included in this report,
fairly present in all material respects the financial condition, results of operations, changes in net assets, and cash flows (if the financial statements are required to include a statement of cash flows) of the Registrant as of, and for, the
periods presented in this report; |
| 4. |
The Registrant’s other certifying officer and I are responsible for establishing and maintaining
disclosure controls and procedures (as defined in Rule 30a-3(c) under the Investment Company Act of 1940) and internal control over financial reporting (as defined in Rule
30a-3(d) under the Investment Company Act of 1940) for the Registrant and have: |
| |
(a) |
designed such disclosure controls and procedures, or caused such disclosure controls and procedures to be
designed under our supervision, to ensure that material information relating to the Registrant, including its consolidated subsidiaries, is made known to us by others within those entities, particularly during the period in which this report is
being prepared; |
| |
(b) |
designed such internal control over financial reporting, or caused such internal control over financial
reporting to be designed under our supervision, to provide reasonable assurance regarding the reliability of financial reporting and the preparation of financial statements for external purposes in accordance with generally accepted accounting
principles; |
| |
(c) |
evaluated the effectiveness of the Registrant’s disclosure controls and procedures and presented in
this report our conclusions about the effectiveness of the disclosure controls and procedures, as of a date within 90 days prior to the filing date of this report based on such evaluation; and |
| |
(d) |
disclosed in this report any change in the Registrant’s internal control over financial reporting that
occurred during the period covered by this report that has materially affected, or is reasonably likely to materially affect, the Registrant’s internal control over financial reporting; and |
| 5. |
The Registrant’s other certifying officer and I have disclosed to the Registrant’s auditors and
the audit committee of the Registrant’s board of directors (or persons performing the equivalent functions): |
| |
(a) |
all significant deficiencies and material weaknesses in the design or operation of internal control over
financial reporting which are reasonably likely to adversely affect the Registrant’s ability to record, process, summarize, and report financial information; and |
| |
(b) |
any fraud, whether or not material, that involves management or other employees who have a significant role
in the Registrant’s internal control over financial reporting. |
|
| /s/ Albert Laskaj |
| Albert Laskaj |
| Principal Financial Officer |
| (Treasurer and Chief Financial Officer) |
EX-99.906CERT
EXHIBIT 13 (b)
RULE 30a-2(b) CERTIFICATIONS
In connection with the Report of Cohen & Steers
REIT and Preferred and Income Fund, Inc. (the “Company”) on Form N-CSR as filed with the Securities and Exchange Commission on the date hereof (the “Report”), I, James Giallanza, Principal
Executive Officer of the Company, certify, pursuant to 18 U.S.C. §1350, as adopted pursuant to Section 906 of the Sarbanes-Oxley Act of 2002, that:
| (1) |
The Report fully complies with the requirements of Section 13(a) or 15(d) of the Securities Exchange
Act of 1934, as applicable; and |
| (2) |
The information contained in the Report fairly presents, in all material respects, the financial condition
and results of operations of the Company. |
|
| /s/ James Giallanza |
| James Giallanza |
| Principal Executive Officer |
| (President and Chief Executive Officer) |
| Date: March 8, 2024 |
EXHIBIT 13 (b)
RULE 30a-2(b) CERTIFICATIONS
In connection with the Report of Cohen & Steers REIT and Preferred and Income Fund, Inc. (the “Company”) on
Form N-CSR as filed with the Securities and Exchange Commission on the date hereof (the “Report”), I, Albert Laskaj, Principal Financial Officer of the Company, certify, pursuant to 18 U.S.C.
§1350, as adopted pursuant to Section 906 of the Sarbanes-Oxley Act of 2002, that:
| (1) |
The Report fully complies with the requirements of Section 13(a) or 15(d) of the Securities Exchange
Act of 1934, as applicable; and |
| (2) |
The information contained in the Report fairly presents, in all material respects, the financial condition
and results of operations of the Company. |
|
| /s/ Albert Laskaj |
| Albert Laskaj |
| Principal Financial Officer |
| (Treasurer and Chief Financial Officer) |
| Date: March 8, 2024 |
EXHIBIT 13(c)
Notification of Sources of Distribution
Pursuant to Section 19(a) of the Investment Company Act of 1940
Cohen & Steers REIT and Preferred and Income Fund, Inc. (RNP)
Cohen & Steers REIT and Preferred and Income Fund, Inc. (NYSE: RNP) (the “Fund”), acting in accordance with an exemptive
order received from the Securities and Exchange Commission and with approval of its Board of Directors, adopted a managed distribution policy under which the Fund intends to include long-term capital gains, where applicable, as part of the regular
monthly cash distributions to its shareholders. This policy will give the Fund greater flexibility to realize long-term capital gains and to distribute those gains on a regular monthly basis.
The Board of Directors of the Fund declared a monthly distribution per share for the month of July 2023. Please review the following
information and important disclosures set forth below.
|
|
|
|
|
|
|
| Amount of Distribution |
|
Ex-Dividend Date |
|
Record Date |
|
Payable Date |
| $0.136 |
|
July 11, 2023 |
|
July 12, 2023 |
|
July 31, 2023 |
The following table sets forth the estimated amounts of the current distribution and the cumulative
distributions paid this fiscal year-to-date from the sources indicated in the table. All amounts are expressed per common share.
|
|
|
|
|
|
|
|
|
|
|
|
|
|
|
|
|
| DISTRIBUTION ESTIMATES |
|
July 2023 |
|
|
YEAR-TO-DATE
(YTD)
July 31, 2023* |
|
| Source |
|
Per Share
Amount |
|
|
% of Current
Distribution |
|
|
Per Share
Amount |
|
|
% of 2023
Distributions |
|
| Net Investment Income |
|
$ |
0.1360 |
|
|
|
100.00 |
% |
|
$ |
0.3430 |
|
|
|
36.03 |
% |
| Net Realized Short-Term Capital Gains |
|
$ |
0.0000 |
|
|
|
0.00 |
% |
|
$ |
0.0000 |
|
|
|
0.00 |
% |
| Net Realized Long-Term Capital Gains |
|
$ |
0.0000 |
|
|
|
0.00 |
% |
|
$ |
0.6090 |
|
|
|
63.97 |
% |
| Return of Capital (or other Capital Source) |
|
$ |
0.0000 |
|
|
|
0.00 |
% |
|
$ |
0.0000 |
|
|
|
0.00 |
% |
|
|
|
|
|
|
|
|
|
|
|
|
|
|
|
|
|
| Total Current Distribution |
|
$ |
0.1360 |
|
|
|
100.00 |
% |
|
$ |
0.9520 |
|
|
|
100.00 |
% |
|
|
|
|
|
|
|
|
|
|
|
|
|
|
|
|
|
You should not draw any conclusions about the Fund’s investment performance from the amount of this
distribution or from the terms of the Fund’s managed distribution policy. The amounts and sources of distributions reported in this Notice are only estimates, are likely to change over time, and are not being provided for tax reporting
purposes. The actual amounts and sources of the amounts for accounting and tax reporting purposes will depend upon the Fund’s investment experience during the remainder of its fiscal year and may be subject to changes based on tax
regulations. The amounts and sources of distributions year-to-date may be subject to additional adjustments.
| * |
THE FUND WILL SEND YOU A FORM 1099-DIV FOR THE CALENDAR YEAR THAT
WILL TELL YOU HOW TO REPORT THESE DISTRIBUTIONS FOR FEDERAL INCOME TAX PURPOSES. |
The Fund’s Year-to-date Cumulative Total Return for fiscal year 2023 (January 1, 2023 through June 30, 2023) is set forth below. Shareholders should take note of the relationship
between the Year-to-date Cumulative Total Return with the Fund’s Cumulative Distribution Rate for 2023. In addition, the Fund’s Average Annual Total Return for
the five-year period ending June 30, 2023 is set forth below. Shareholders should note the relationship between the Average Annual Total Return with the Fund’s Current Annualized Distribution Rate for 2023. The performance and distribution
rate information disclosed in the table is based on the Fund’s net asset value per share (NAV). The Fund’s NAV is calculated as the total market value of all the securities and other assets held by the Fund minus the total liabilities,
divided by the total number of shares outstanding. While NAV performance may be indicative of the Fund’s investment performance, it does not measure the value of a shareholder’s individual investment in the Fund. The value of a
shareholder’s investment in the Fund is determined by the Fund’s market price, which is based on the supply and demand for the Fund’s shares in the open market.
Fund Performance and Distribution Rate Information:
|
|
|
|
|
| Year-to-date
January 1, 2023 to June 30, 2023 |
|
|
|
|
| Year-to-date
Cumulative Total Return1 |
|
|
3.55 |
% |
| Cumulative Distribution Rate2 |
|
|
4.76 |
% |
|
|
| Five-year period ending June 30, 2023 |
|
|
|
|
| Average Annual Total Return3 |
|
|
6.46 |
% |
| Current Annualized Distribution
Rate4 |
|
|
8.17 |
% |
| 1. |
Year-to-date Cumulative
Total Return is the percentage change in the Fund’s NAV over the year-to-date time period including distributions paid and assuming reinvestment of those
distributions. |
| 2. |
Cumulative Distribution Rate for the Fund’s current fiscal period (January 1, 2023 through
July 31, 2023) measured on the dollar value of distributions in the year-to-date period as a percentage of the Fund’s NAV as of June 30, 2023.
|
| 3. |
Average Annual Total Return represents the compound average of the Annual NAV Total Returns of the Fund for
the five-year period ending June 30, 2023. Annual NAV Total Return is the percentage change in the Fund’s NAV over a year including distributions paid and assuming reinvestment of those distributions. |
| 4. |
The Current Annualized Distribution Rate is the current fiscal period’s distribution rate annualized as
a percentage of the Fund’s NAV as of June 30, 2023. |
This Fund has a managed distribution policy that seeks to
deliver the Fund’s long term total return potential through regular monthly distributions declared at a fixed rate per share. Distributions may be paid in part or in full from net investment income, realized capital gains and by returning
capital, or a combination thereof. Shareholders should note, however, that if the Fund’s aggregate net investment income and net realized capital gains are less than the amount of the distribution level, the difference will be distributed from
the Fund’s assets and will constitute a return of the shareholder’s capital. A return of capital is not taxable; rather it reduces a shareholder’s tax basis in his or her shares of the Fund. The Board of Directors of the Fund may
amend, terminate or suspend the managed distribution policy at any time, which could have an adverse effect on the market price of the Fund’s shares.
Shareholders should not use the information provided in preparing their tax returns. Shareholders will receive a Form 1099-DIV for the calendar year indicating how to report fund distributions for federal income tax purposes.
EXHIBIT 13(c)
Notification of Sources of Distribution
Pursuant to Section 19(a) of the Investment Company Act of 1940
Cohen & Steers REIT and Preferred and Income Fund, Inc. (RNP)
Cohen & Steers REIT and Preferred and Income Fund, Inc. (NYSE: RNP) (the “Fund”), acting in accordance with an exemptive
order received from the Securities and Exchange Commission and with approval of its Board of Directors, adopted a managed distribution policy under which the Fund intends to include long-term capital gains, where applicable, as part of the regular
monthly cash distributions to its shareholders. This policy will give the Fund greater flexibility to realize long-term capital gains and to distribute those gains on a regular monthly basis.
The Board of Directors of the Fund declared a monthly distribution per share for the month of August 2023. Please review the following
information and important disclosures set forth below.
|
|
|
|
|
|
|
| Amount of Distribution |
|
Ex-Dividend Date |
|
Record Date |
|
Payable Date |
| $0.136 |
|
August 15, 2023 |
|
August 16, 2023 |
|
August 31, 2023 |
The following table sets forth the estimated amounts of the current distribution and the cumulative
distributions paid this fiscal year-to-date from the sources indicated in the table. All amounts are expressed per common share.
|
|
|
|
|
|
|
|
|
|
|
|
|
|
|
|
|
| DISTRIBUTION ESTIMATES |
|
August 2023 |
|
|
YEAR-TO-DATE
(YTD)
August 31, 2023* |
|
| Source |
|
Per Share
Amount |
|
|
% of Current
Distribution |
|
|
Per Share
Amount |
|
|
% of 2023
Distributions |
|
| Net Investment Income |
|
$ |
0.1360 |
|
|
|
100.00 |
% |
|
$ |
0.4790 |
|
|
|
44.03 |
% |
| Net Realized Short-Term Capital Gains |
|
$ |
0.0000 |
|
|
|
0.00 |
% |
|
$ |
0.0000 |
|
|
|
0.00 |
% |
| Net Realized Long-Term Capital Gains |
|
$ |
0.0000 |
|
|
|
0.00 |
% |
|
$ |
0.6090 |
|
|
|
55.97 |
% |
| Return of Capital (or other Capital Source) |
|
$ |
0.0000 |
|
|
|
0.00 |
% |
|
$ |
0.0000 |
|
|
|
0.00 |
% |
|
|
|
|
|
|
|
|
|
|
|
|
|
|
|
|
|
| Total Current Distribution |
|
$ |
0.1360 |
|
|
|
100.00 |
% |
|
$ |
1.0880 |
|
|
|
100.00 |
% |
|
|
|
|
|
|
|
|
|
|
|
|
|
|
|
|
|
You should not draw any conclusions about the Fund’s investment performance from the amount of this
distribution or from the terms of the Fund’s managed distribution policy. The amounts and sources of distributions reported in this Notice are only estimates, are likely to change over time, and are not being provided for tax reporting
purposes. The actual amounts and sources of the amounts for accounting and tax reporting purposes will depend upon the Fund’s investment experience during the remainder of its fiscal year and may be subject to changes based on tax
regulations. The amounts and sources of distributions year-to-date may be subject to additional adjustments.
| * |
THE FUND WILL SEND YOU A FORM 1099-DIV FOR THE CALENDAR YEAR THAT
WILL TELL YOU HOW TO REPORT THESE DISTRIBUTIONS FOR FEDERAL INCOME TAX PURPOSES. |
The Fund’s Year-to-date Cumulative Total Return for fiscal year 2023 (January 1, 2023 through July 31, 2023) is set forth below. Shareholders should take note of the relationship
between the Year-to-date Cumulative Total Return with the Fund’s Cumulative Distribution Rate for 2023. In addition, the Fund’s Average Annual Total Return for
the five-year period ending July 31, 2023 is set forth below. Shareholders should note the relationship between the Average Annual Total Return with the Fund’s Current Annualized Distribution Rate for 2023. The performance and distribution
rate information disclosed in the table is based on the Fund’s net asset value per share (NAV). The Fund’s NAV is calculated as the total market value of all the securities and other assets held by the Fund minus the total liabilities,
divided by the total number of shares outstanding. While NAV performance may be indicative of the Fund’s investment performance, it does not measure the value of a shareholder’s individual investment in the Fund. The value of a
shareholder’s investment in the Fund is determined by the Fund’s market price, which is based on the supply and demand for the Fund’s shares in the open market.
Fund Performance and Distribution Rate Information:
|
|
|
|
|
| Year-to-date
January 1, 2023 to July 31, 2023 |
|
|
|
|
| Year-to-date
Cumulative Total Return1 |
|
|
6.20 |
% |
| Cumulative Distribution Rate2 |
|
|
5.35 |
% |
|
|
| Five-year period ending July 31, 2023 |
|
|
|
|
| Average Annual Total Return3 |
|
|
6.74 |
% |
| Current Annualized Distribution
Rate4 |
|
|
8.02 |
% |
| 1. |
Year-to-date Cumulative
Total Return is the percentage change in the Fund’s NAV over the year-to-date time period including distributions paid and assuming reinvestment of those
distributions. |
| 2. |
Cumulative Distribution Rate for the Fund’s current fiscal period (January 1, 2023 through
August 31, 2023) measured on the dollar value of distributions in the year-to-date period as a percentage of the Fund’s NAV as of July 31, 2023.
|
| 3. |
Average Annual Total Return represents the compound average of the Annual NAV Total Returns of the Fund for
the five-year period ending July 31, 2023. Annual NAV Total Return is the percentage change in the Fund’s NAV over a year including distributions paid and assuming reinvestment of those distributions. |
| 4. |
The Current Annualized Distribution Rate is the current fiscal period’s distribution rate annualized as
a percentage of the Fund’s NAV as of July 31, 2023. |
This Fund has a managed distribution policy that seeks to
deliver the Fund’s long term total return potential through regular monthly distributions declared at a fixed rate per share. Distributions may be paid in part or in full from net investment income, realized capital gains and by returning
capital, or a combination thereof. Shareholders should note, however, that if the Fund’s aggregate net investment income and net realized capital gains are less than the amount of the distribution level, the difference will be distributed from
the Fund’s assets and will constitute a return of the shareholder’s capital. A return of capital is not taxable; rather it reduces a shareholder’s tax basis in his or her shares of the Fund. The Board of Directors of the Fund may
amend, terminate or suspend the managed distribution policy at any time, which could have an adverse effect on the market price of the Fund’s shares.
Shareholders should not use the information provided in preparing their tax returns. Shareholders will receive a Form 1099-DIV for the calendar year indicating how to report fund distributions for federal income tax purposes.
EXHIBIT 13(c)
Notification of Sources of Distribution
Pursuant to Section 19(a) of the Investment Company Act of 1940
Cohen & Steers REIT and Preferred and Income Fund, Inc. (RNP)
Cohen & Steers REIT and Preferred and Income Fund, Inc. (NYSE: RNP) (the “Fund”), acting in accordance with an exemptive
order received from the Securities and Exchange Commission and with approval of its Board of Directors, adopted a managed distribution policy under which the Fund intends to include long-term capital gains, where applicable, as part of the regular
monthly cash distributions to its shareholders. This policy will give the Fund greater flexibility to realize long-term capital gains and to distribute those gains on a regular monthly basis.
The Board of Directors of the Fund declared a monthly distribution per share for the month of September 2023. Please review the following
information and important disclosures set forth below.
|
|
|
|
|
|
|
| Amount of Distribution |
|
Ex-Dividend Date |
|
Record Date |
|
Payable Date |
| $0.136 |
|
September 12, 2023 |
|
September 13, 2023 |
|
September 29, 2023 |
The following table sets forth the estimated amounts of the current distribution and the cumulative
distributions paid this fiscal year-to-date from the sources indicated in the table. All amounts are expressed per common share.
|
|
|
|
|
|
|
|
|
|
|
|
|
|
|
|
|
| DISTRIBUTION ESTIMATES |
|
September 2023 |
|
|
YEAR-TO-DATE
(YTD)
September 30, 2023* |
|
| Source |
|
Per Share
Amount |
|
|
% of
Current
Distribution |
|
|
Per Share
Amount |
|
|
% of 2023
Distributions |
|
| Net Investment Income |
|
$ |
0.1360 |
|
|
|
100.00 |
% |
|
$ |
0.6150 |
|
|
|
50.25 |
% |
| Net Realized Short-Term Capital Gains |
|
$ |
0.0000 |
|
|
|
0.00 |
% |
|
$ |
0.0000 |
|
|
|
0.00 |
% |
| Net Realized Long-Term Capital Gains |
|
$ |
0.0000 |
|
|
|
0.00 |
% |
|
$ |
0.6090 |
|
|
|
49.75 |
% |
| Return of Capital (or other Capital Source) |
|
$ |
0.0000 |
|
|
|
0.00 |
% |
|
$ |
0.0000 |
|
|
|
0.00 |
% |
|
|
|
|
|
|
|
|
|
|
|
|
|
|
|
|
|
| Total Current Distribution |
|
$ |
0.1360 |
|
|
|
100.00 |
% |
|
$ |
1.2240 |
|
|
|
100.00 |
% |
|
|
|
|
|
|
|
|
|
|
|
|
|
|
|
|
|
You should not draw any conclusions about the Fund’s investment performance from the amount of this
distribution or from the terms of the Fund’s managed distribution policy. The amounts and sources of distributions reported in this Notice are only estimates, are likely to change over time, and are not being provided for tax reporting
purposes. The actual amounts and sources of the amounts for accounting and tax reporting purposes will depend upon the Fund’s investment experience during the remainder of its fiscal year and may be subject to changes based on tax
regulations. The amounts and sources of distributions year-to-date may be subject to additional adjustments.
| * |
THE FUND WILL SEND YOU A FORM 1099-DIV FOR THE CALENDAR YEAR THAT
WILL TELL YOU HOW TO REPORT THESE DISTRIBUTIONS FOR FEDERAL INCOME TAX PURPOSES. |
The Fund’s Year-to-date Cumulative Total Return for fiscal year 2023 (January 1, 2023 through August 31, 2023) is set forth below. Shareholders should take note of the relationship
between the Year-to-date Cumulative Total Return with the Fund’s Cumulative Distribution Rate for 2023. In addition, the Fund’s Average Annual Total Return for
the five-year period ending August 31, 2023 is set forth below. Shareholders should note the relationship between the Average Annual Total Return with the Fund’s Current Annualized Distribution Rate for 2023. The performance and
distribution rate information disclosed in the table is based on the Fund’s net asset value per share (NAV). The Fund’s NAV is calculated as the total market value of all the securities and other assets held by the Fund minus the total
liabilities, divided by the total number of shares outstanding. While NAV performance may be indicative of the Fund’s investment performance, it does not measure the value of a shareholder’s individual investment in the Fund. The value of
a shareholder’s investment in the Fund is determined by the Fund’s market price, which is based on the supply and demand for the Fund’s shares in the open market.
Fund Performance and Distribution Rate Information:
|
|
|
|
|
|
Year-to-date January 1, 2023
to August 31, 2023 |
|
| Year-to-date
Cumulative Total Return1 |
|
|
3.02 |
% |
| Cumulative Distribution Rate2 |
|
|
5.55 |
% |
|
| Five-year period ending August 31, 2023 |
|
| Average Annual Total Return3 |
|
|
5.57 |
% |
| Current Annualized Distribution
Rate4 |
|
|
8.33 |
% |
| 1. |
Year-to-date Cumulative
Total Return is the percentage change in the Fund’s NAV over the year-to-date time period including distributions paid and assuming reinvestment of those
distributions. |
| 2. |
Cumulative Distribution Rate for the Fund’s current fiscal period (January 1, 2023 through
September 30, 2023) measured on the dollar value of distributions in the year-to-date period as a percentage of the Fund’s NAV as of August 31, 2023.
|
| 3. |
Average Annual Total Return represents the compound average of the Annual NAV Total Returns of the Fund for
the five-year period ending August 31, 2023. Annual NAV Total Return is the percentage change in the Fund’s NAV over a year including distributions paid and assuming reinvestment of those distributions. |
| 4. |
The Current Annualized Distribution Rate is the current fiscal period’s distribution rate annualized as
a percentage of the Fund’s NAV as of August 31, 2023. |
This Fund has a managed distribution policy that seeks
to deliver the Fund’s long term total return potential through regular monthly distributions declared at a fixed rate per share. Distributions may be paid in part or in full from net investment income, realized capital gains and by returning
capital, or a combination thereof. Shareholders should note, however, that if the Fund’s aggregate net investment income and net realized capital gains are less than the amount of the distribution level, the difference will be distributed from
the Fund’s assets and will constitute a return of the shareholder’s capital. A return of capital is not taxable; rather it reduces a shareholder’s tax basis in his or her shares of the Fund. The Board of Directors of the Fund may
amend, terminate or suspend the managed distribution policy at any time, which could have an adverse effect on the market price of the Fund’s shares.
Shareholders should not use the information provided in preparing their tax returns. Shareholders will receive a Form 1099-DIV for the calendar year indicating how to report fund distributions for federal income tax purposes.
EXHIBIT 13(c)
Notification of Sources of Distribution
Pursuant to Section 19(a) of the Investment Company Act of 1940
Cohen & Steers REIT and Preferred and Income Fund, Inc. (RNP)
Cohen & Steers REIT and Preferred and Income Fund, Inc. (NYSE: RNP) (the “Fund”), acting in accordance with an exemptive
order received from the Securities and Exchange Commission and with approval of its Board of Directors, adopted a managed distribution policy under which the Fund intends to include long-term capital gains, where applicable, as part of the regular
monthly cash distributions to its shareholders. This policy will give the Fund greater flexibility to realize long-term capital gains and to distribute those gains on a regular monthly basis.
The Board of Directors of the Fund declared a monthly distribution per share for the month of October 2023. Please review the following
information and important disclosures set forth below.
|
|
|
|
|
|
|
| Amount of Distribution |
|
Ex-Dividend Date |
|
Record Date |
|
Payable Date |
| $0.136 |
|
October 10, 2023 |
|
October 11, 2023 |
|
October 31, 2023 |
The following table sets forth the estimated amounts of the current distribution and the cumulative
distributions paid this fiscal year-to-date from the sources indicated in the table. All amounts are expressed per common share.
|
|
|
|
|
|
|
|
|
|
|
|
|
|
|
|
|
| DISTRIBUTION ESTIMATES |
|
October 2023 |
|
|
YEAR-TO-DATE
(YTD)
October 31, 2023* |
|
| Source |
|
Per Share
Amount |
|
|
% of
Current
Distribution |
|
|
Per Share
Amount |
|
|
% of 2023
Distributions |
|
| Net Investment Income |
|
$ |
0.1360 |
|
|
|
100.00 |
% |
|
$ |
0.7652 |
|
|
|
56.26 |
% |
| Net Realized Short-Term Capital Gains |
|
$ |
0.0000 |
|
|
|
0.00 |
% |
|
$ |
0.0000 |
|
|
|
0.00 |
% |
| Net Realized Long-Term Capital Gains |
|
$ |
0.0000 |
|
|
|
0.00 |
% |
|
$ |
0.5948 |
|
|
|
43.74 |
% |
| Return of Capital (or other Capital Source) |
|
$ |
0.0000 |
|
|
|
0.00 |
% |
|
$ |
0.0000 |
|
|
|
0.00 |
% |
|
|
|
|
|
|
|
|
|
|
|
|
|
|
|
|
|
| Total Current Distribution |
|
$ |
0.1360 |
|
|
|
100.00 |
% |
|
$ |
1.3600 |
|
|
|
100.00 |
% |
|
|
|
|
|
|
|
|
|
|
|
|
|
|
|
|
|
You should not draw any conclusions about the Fund’s investment performance from the amount of this
distribution or from the terms of the Fund’s managed distribution policy. The amounts and sources of distributions reported in this Notice are only estimates, are likely to change over time, and are not being provided for tax reporting
purposes. The actual amounts and sources of the amounts for accounting and tax reporting purposes will depend upon the Fund’s investment experience during the remainder of its fiscal year and may be subject to changes based on tax
regulations. The amounts and sources of distributions year-to-date may be subject to additional adjustments.
| * |
THE FUND WILL SEND YOU A FORM 1099-DIV FOR THE CALENDAR YEAR THAT
WILL TELL YOU HOW TO REPORT THESE DISTRIBUTIONS FOR FEDERAL INCOME TAX PURPOSES. |
The Fund’s Year-to-date Cumulative Total Return for fiscal year 2023 (January 1, 2023 through September 30, 2023) is set forth below. Shareholders should take note of the
relationship between the Year-to-date Cumulative Total Return with the Fund’s Cumulative Distribution Rate for 2023. In addition, the Fund’s Average Annual
Total Return for the five-year period ending September 30, 2023 is set forth below. Shareholders should note the relationship between the Average Annual Total Return with the Fund’s Current Annualized Distribution Rate for 2023. The
performance and distribution rate information disclosed in the table is based on the Fund’s net asset value per share (NAV). The Fund’s NAV is calculated as the total market value of all the securities and other assets held by the Fund
minus the total liabilities, divided by the total number of shares outstanding. While NAV performance may be indicative of the Fund’s investment performance, it does not measure the value of a shareholder’s individual investment in the
Fund. The value of a shareholder’s investment in the Fund is determined by the Fund’s market price, which is based on the supply and demand for the Fund’s shares in the open market.
Fund Performance and Distribution Rate Information:
|
|
|
|
|
| Year-to-date
January 1, 2023 to September 30, 2023 |
|
|
|
|
| Year-to-date
Cumulative Total Return1 |
|
|
-3.10 |
% |
| Cumulative Distribution Rate2 |
|
|
7.44 |
% |
|
|
| Five-year period ending September 30, 2023 |
|
|
|
|
| Average Annual Total Return3 |
|
|
4.66 |
% |
| Current Annualized Distribution
Rate4 |
|
|
8.92 |
% |
| 1. |
Year-to-date Cumulative
Total Return is the percentage change in the Fund’s NAV over the year-to-date time period including distributions paid and assuming reinvestment of those
distributions. |
| 2. |
Cumulative Distribution Rate for the Fund’s current fiscal period (January 1, 2023 through
October 31, 2023) measured on the dollar value of distributions in the year-to-date period as a percentage of the Fund’s NAV as of September 30, 2023.
|
| 3. |
Average Annual Total Return represents the compound average of the Annual NAV Total Returns of the Fund for
the five-year period ending September 30, 2023. Annual NAV Total Return is the percentage change in the Fund’s NAV over a year including distributions paid and assuming reinvestment of those distributions. |
| 4. |
The Current Annualized Distribution Rate is the current fiscal period’s distribution rate annualized as
a percentage of the Fund’s NAV as of September 30, 2023. |
This Fund has a managed distribution policy that
seeks to deliver the Fund’s long term total return potential through regular monthly distributions declared at a fixed rate per share. Distributions may be paid in part or in full from net investment income, realized capital gains and by
returning capital, or a combination thereof. Shareholders should note, however, that if the Fund’s aggregate net investment income and net realized capital gains are less than the amount of the distribution level, the difference will be
distributed from the Fund’s assets and will constitute a return of the shareholder’s capital. A return of capital is not taxable; rather it reduces a shareholder’s tax basis in his or her shares of the Fund. The Board of Directors of
the Fund may amend, terminate or suspend the managed distribution policy at any time, which could have an adverse effect on the market price of the Fund’s shares.
Shareholders should not use the information provided in preparing their tax returns. Shareholders will receive a Form 1099-DIV for the calendar year indicating how to report fund distributions for federal income tax purposes.
EXHIBIT 13(c)
Notification of Sources of Distribution
Pursuant to Section 19(a) of the Investment Company Act of 1940
Cohen & Steers REIT and Preferred and Income Fund, Inc. (RNP)
Cohen & Steers REIT and Preferred and Income Fund, Inc. (NYSE: RNP) (the “Fund”), acting in accordance with an exemptive
order received from the Securities and Exchange Commission and with approval of its Board of Directors, adopted a managed distribution policy under which the Fund intends to include long-term capital gains, where applicable, as part of the regular
monthly cash distributions to its shareholders. This policy will give the Fund greater flexibility to realize long-term capital gains and to distribute those gains on a regular monthly basis.
The Board of Directors of the Fund declared a monthly distribution per share for the month of November 2023. Please review the following
information and important disclosures set forth below.
|
|
|
|
|
|
|
| Amount of Distribution |
|
Ex-Dividend Date |
|
Record Date |
|
Payable Date |
| $0.136 |
|
November 14, 2023 |
|
November 15, 2023 |
|
November 30, 2023 |
The following table sets forth the estimated amounts of the current distribution and the cumulative
distributions paid this fiscal year-to-date from the sources indicated in the table. All amounts are expressed per common share.
|
|
|
|
|
|
|
|
|
|
|
|
|
|
|
|
|
| DISTRIBUTION ESTIMATES |
|
November 2023 |
|
|
YEAR-TO-DATE
(YTD)
November 30, 2023* |
|
| Source |
|
Per Share
Amount |
|
|
% of Current
Distribution |
|
|
Per Share
Amount |
|
|
% of 2023
Distributions |
|
| Net Investment Income |
|
$ |
0.1360 |
|
|
|
100.00 |
% |
|
$ |
0.9012 |
|
|
|
60.24 |
% |
| Net Realized Short-Term Capital Gains |
|
$ |
0.0000 |
|
|
|
0.00 |
% |
|
$ |
0.0000 |
|
|
|
0.00 |
% |
| Net Realized Long-Term Capital Gains |
|
$ |
0.0000 |
|
|
|
0.00 |
% |
|
$ |
0.5948 |
|
|
|
39.76 |
% |
| Return of Capital (or other Capital Source) |
|
$ |
0.0000 |
|
|
|
0.00 |
% |
|
$ |
0.0000 |
|
|
|
0.00 |
% |
|
|
|
|
|
|
|
|
|
|
|
|
|
|
|
|
|
| Total Current Distribution |
|
$ |
0.1360 |
|
|
|
100.00 |
% |
|
$ |
1.4960 |
|
|
|
100.00 |
% |
|
|
|
|
|
|
|
|
|
|
|
|
|
|
|
|
|
You should not draw any conclusions about the Fund’s investment performance from the amount of this
distribution or from the terms of the Fund’s managed distribution policy. The amounts and sources of distributions reported in this Notice are only estimates, are likely to change over time, and are not being provided for tax reporting
purposes. The actual amounts and sources of the amounts for accounting and tax reporting purposes will depend upon the Fund’s investment experience during the remainder of its fiscal year and may be subject to changes based on tax
regulations. The amounts and sources of distributions year-to-date may be subject to additional adjustments.
| * |
THE FUND WILL SEND YOU A FORM 1099-DIV FOR THE CALENDAR YEAR THAT
WILL TELL YOU HOW TO REPORT THESE DISTRIBUTIONS FOR FEDERAL INCOME TAX PURPOSES. |
The Fund’s Year-to-date Cumulative Total Return for fiscal year 2023 (January 1, 2023 through October 31, 2023) is set forth below. Shareholders should take note of the relationship
between the Year-to-date Cumulative Total Return with the Fund’s Cumulative Distribution Rate for 2023. In addition, the Fund’s Average Annual Total Return for
the five-year period ending October 31, 2023 is set forth below. Shareholders should note the relationship between the Average Annual Total Return with the Fund’s Current Annualized Distribution Rate for 2023. The performance and
distribution rate information disclosed in the table is based on the Fund’s net asset value per share (NAV). The Fund’s NAV is calculated as the total market value of all the securities and other assets held by the Fund minus the total
liabilities, divided by the total number of shares outstanding. While NAV performance may be indicative of the Fund’s investment performance, it does not measure the value of a shareholder’s individual investment in the Fund. The value of
a shareholder’s investment in the Fund is determined by the Fund’s market price, which is based on the supply and demand for the Fund’s shares in the open market.
Fund Performance and Distribution Rate Information:
|
|
|
|
|
| Year-to-date
January 1, 2023 to October 31, 2023 |
|
|
|
|
| Year-to-date
Cumulative Total Return1 |
|
|
-6.31 |
% |
| Cumulative Distribution Rate2 |
|
|
8.53 |
% |
|
|
| Five-year period ending October 31, 2023 |
|
|
|
|
| Average Annual Total Return3 |
|
|
4.56 |
% |
| Current Annualized Distribution
Rate4 |
|
|
9.30 |
% |
| 1. |
Year-to-date Cumulative
Total Return is the percentage change in the Fund’s NAV over the year-to-date time period including distributions paid and assuming reinvestment of those
distributions. |
| 2. |
Cumulative Distribution Rate for the Fund’s current fiscal period (January 1, 2023 through
November 30, 2023) measured on the dollar value of distributions in the year-to-date period as a percentage of the Fund’s NAV as of October 31, 2023.
|
| 3. |
Average Annual Total Return represents the compound average of the Annual NAV Total Returns of the Fund for
the five-year period ending October 31, 2023. Annual NAV Total Return is the percentage change in the Fund’s NAV over a year including distributions paid and assuming reinvestment of those distributions. |
| 4. |
The Current Annualized Distribution Rate is the current fiscal period’s distribution rate annualized as
a percentage of the Fund’s NAV as of October 31, 2023. |
This Fund has a managed distribution policy that seeks
to deliver the Fund’s long term total return potential through regular monthly distributions declared at a fixed rate per share. Distributions may be paid in part or in full from net investment income, realized capital gains and by returning
capital, or a combination thereof. Shareholders should note, however, that if the Fund’s aggregate net investment income and net realized capital gains are less than the amount of the distribution level, the difference will be distributed from
the Fund’s assets and will constitute a return of the shareholder’s capital. A return of capital is not taxable; rather it reduces a shareholder’s tax basis in his or her shares of the Fund. The Board of Directors of the Fund may
amend, terminate or suspend the managed distribution policy at any time, which could have an adverse effect on the market price of the Fund’s shares.
Shareholders should not use the information provided in preparing their tax returns. Shareholders will receive a Form 1099-DIV for the calendar year indicating how to report fund distributions for federal income tax purposes.
EXHIBIT 13(c)
Notification of Sources of Distribution
Pursuant to Section 19(a) of the Investment Company Act of 1940
Cohen & Steers REIT and Preferred and Income Fund, Inc. (RNP)
Cohen & Steers REIT and Preferred and Income Fund, Inc. (NYSE: RNP) (the “Fund”), acting in accordance with an exemptive
order received from the Securities and Exchange Commission and with approval of its Board of Directors, adopted a managed distribution policy under which the Fund intends to include long-term capital gains, where applicable, as part of the regular
monthly cash distributions to its shareholders. This policy will give the Fund greater flexibility to realize long-term capital gains and to distribute those gains on a regular monthly basis.
The Board of Directors of the Fund declared a monthly distribution per share for the month of December 2023. Please review the following
information and important disclosures set forth below.
|
|
|
|
|
|
|
| Amount of Distribution |
|
Ex-Dividend Date |
|
Record Date |
|
Payable Date |
| $0.136 |
|
December 12, 2023 |
|
December 13, 2023 |
|
December 29, 2023 |
The following table sets forth the estimated amounts of the current distribution and the cumulative
distributions paid this fiscal year-to-date from the sources indicated in the table. All amounts are expressed per common share.
|
|
|
|
|
|
|
|
|
|
|
|
|
|
|
|
|
| DISTRIBUTION ESTIMATES |
|
December 2023 |
|
|
YEAR-TO-DATE
(YTD)
December 31, 2023* |
|
| Source |
|
Per Share
Amount |
|
|
% of Current
Distribution |
|
|
Per Share
Amount |
|
|
% of 2023
Distributions |
|
| Net Investment Income |
|
$ |
0.1360 |
|
|
|
100.00 |
% |
|
$ |
1.0372 |
|
|
|
63.55 |
% |
| Net Realized Short-Term Capital Gains |
|
$ |
0.0000 |
|
|
|
0.00 |
% |
|
$ |
0.0000 |
|
|
|
0.00 |
% |
| Net Realized Long-Term Capital Gains |
|
$ |
0.0000 |
|
|
|
0.00 |
% |
|
$ |
0.5948 |
|
|
|
36.45 |
% |
| Return of Capital (or other Capital Source) |
|
$ |
0.0000 |
|
|
|
0.00 |
% |
|
$ |
0.0000 |
|
|
|
0.00 |
% |
|
|
|
|
|
|
|
|
|
|
|
|
|
|
|
|
|
| Total Current Distribution |
|
$ |
0.1360 |
|
|
|
100.00 |
% |
|
$ |
1.6320 |
|
|
|
100.00 |
% |
|
|
|
|
|
|
|
|
|
|
|
|
|
|
|
|
|
You should not draw any conclusions about the Fund’s investment performance from the amount of this
distribution or from the terms of the Fund’s managed distribution policy. The amounts and sources of distributions reported in this Notice are only estimates, are likely to change over time, and are not being provided for tax reporting
purposes. The actual amounts and sources of the amounts for accounting and tax reporting purposes will depend upon the Fund’s investment experience during the remainder of its fiscal year and may be subject to changes based on tax
regulations. The amounts and sources of distributions year-to-date may be subject to additional adjustments.
| * |
THE FUND WILL SEND YOU A FORM 1099-DIV FOR THE CALENDAR YEAR THAT
WILL TELL YOU HOW TO REPORT THESE DISTRIBUTIONS FOR FEDERAL INCOME TAX PURPOSES. |
The Fund’s Year-to-date Cumulative Total Return for fiscal year 2023 (January 1, 2023 through November 30, 2023) is set forth below. Shareholders should take note of the
relationship between the Year-to-date Cumulative Total Return with the Fund’s Cumulative Distribution Rate for 2023. In addition, the Fund’s Average Annual
Total Return for the five-year period ending November 30, 2023 is set forth below. Shareholders should note the relationship between the Average Annual Total Return with the Fund’s Current Annualized Distribution Rate for 2023. The
performance and distribution rate information disclosed in the table is based on the Fund’s net asset value per share (NAV). The Fund’s NAV is calculated as the total market value of all the securities and other assets held by the Fund
minus the total liabilities, divided by the total number of shares outstanding. While NAV performance may be indicative of the Fund’s investment performance, it does not measure the value of a shareholder’s individual investment in the
Fund. The value of a shareholder’s investment in the Fund is determined by the Fund’s market price, which is based on the supply and demand for the Fund’s shares in the open market.
Fund Performance and Distribution Rate Information:
|
|
|
|
|
| Year-to-date
January 1, 2023 to November 30, 2023 |
|
|
|
|
| Year-to-date
Cumulative Total Return1 |
|
|
5.16 |
% |
| Cumulative Distribution Rate2 |
|
|
8.35 |
% |
|
|
| Five-year period ending November 30, 2023 |
|
|
|
|
| Average Annual Total Return3 |
|
|
6.54 |
% |
| Current Annualized Distribution
Rate4 |
|
|
8.35 |
% |
| 1. |
Year-to-date Cumulative
Total Return is the percentage change in the Fund’s NAV over the year-to-date time period including distributions paid and assuming reinvestment of those
distributions. |
| 2. |
Cumulative Distribution Rate for the Fund’s current fiscal period (January 1, 2023 through
December 31, 2023) measured on the dollar value of distributions in the year-to-date period as a percentage of the Fund’s NAV as of November 30, 2023.
|
| 3. |
Average Annual Total Return represents the compound average of the Annual NAV Total Returns of the Fund for
the five-year period ending November 30, 2023. Annual NAV Total Return is the percentage change in the Fund’s NAV over a year including distributions paid and assuming reinvestment of those distributions. |
| 4. |
The Current Annualized Distribution Rate is the current fiscal period’s distribution rate annualized as
a percentage of the Fund’s NAV as of November 30, 2023. |
This Fund has a managed distribution policy that
seeks to deliver the Fund’s long term total return potential through regular monthly distributions declared at a fixed rate per share. Distributions may be paid in part or in full from net investment income, realized capital gains and by
returning capital, or a combination thereof. Shareholders should note, however, that if the Fund’s aggregate net investment income and net realized capital gains are less than the amount of the distribution level, the difference will be
distributed from the Fund’s assets and will constitute a return of the shareholder’s capital. A return of capital is not taxable; rather it reduces a shareholder’s tax basis in his or her shares of the Fund. The Board of Directors of
the Fund may amend, terminate or suspend the managed distribution policy at any time, which could have an adverse effect on the market price of the Fund’s shares.
Shareholders should not use the information provided in preparing their tax returns. Shareholders will receive a Form 1099-DIV for the calendar year indicating how to report fund distributions for federal income tax purposes.
Cohen and Steers REIT an... (NYSE:RNP)
Historical Stock Chart
From Apr 2024 to May 2024

Cohen and Steers REIT an... (NYSE:RNP)
Historical Stock Chart
From May 2023 to May 2024
