Panoro Minerals Ltd. (TSXV: PML, Lima: PML, Frankfurt: PZM)
(“Panoro”, the “Company”) Panoro is pleased to announce
the final results from the recently completed leach test from
Column #4 at the 100% owned Antilla Copper Project.
The revised estimate for copper recovery from
the secondary sulphides is 79.9% in a period of 150 days. This is
an increase from the Preliminary Economic Assessment (PEA),
announced in May 2018 which, which included an estimated 72.5%
copper recovery over a 200 day period.
“The results of the Antilla column leach testing
program have demonstrated significant upside potential to the
Antilla Project economics. The project is well situated, with
low capital intensity, low operating costs and strong
economics. We are confident that the strategic review of the
projects’ roadmap to feasibility and development will yield
positive outcomes in the near future,” stated Luquman Shaheen,
President & CEO of Panoro Minerals.
The leach test results from Column #4 have
increased the estimated recoveries and reduced the recovery time of
each of the four mineralogical zones included in the Antilla
Project mine plan in the PEA as summarized in the table below.
| Mineralogical Zone |
Copper Recovery Estimates |
| Current Estimates |
2018 PEA Estimates |
Change |
|
Cu Recovery(%) |
Period (days) |
Cu Recovery(%) |
Period(days) |
Cu Recovery(%) |
Period(days) |
|
Cover |
72.9 |
150 |
31.1 |
200 |
+ 41.8 |
- 50 |
|
Leach Cap |
74.4 |
38.0 |
+ 36.4 |
|
Secondary Sulphides |
79.9 |
72.5 |
+ 7.4 |
|
Primary Sulphides |
69.7 |
21.2 |
+ 48.5 |
The PEA mine plan includes 117 million tonnes of
secondary sulphides corresponding to 98% of the feed to the heap
leach pad. The balance of the feed to the heap leach is made
up of Cover, Leach Cap and Primary Sulphides.
The recoveries estimated for the PEA were
derived from bottle roll tests and mineralogic testwork available
at the time of the completion of the PEA. The column test
program was initiated early in 2018 while the PEA was underway.
Leach tests from Columns #1, #2 and #3 were completed in July 2018
and #4 was completed in August 2018.
The PEA recovery estimates were based on
analytical extraction data. The revised estimates are based on an
assessment of the actual and likely extractions under a
thermophilic leach scenario. Also, the PEA estimates included
days under acid leach in the laboratory testwork. The new estimates
assume bioleaching from the start.
The original objective of the test program was
to determine copper extraction from supergene (secondary sulphide)
material under simulated mesophilic bio-leach conditions (medium
temperature) at a range of crush sizes. These tests were successful
and indicated that overall process recoveries of 72.5% were
achievable. Leaching of primary sulphides such as chalcopyrite or
enargite is limited under mesophilic conditions. The leach cycle of
Column #4 was extended and the column transitioned to thermophilic
conditions (up to 55ºC temperature) to determine to what
extent the small amounts of primary sulphides within the material
would be leached. Transitioning to thermophilic conditions led to a
significant improvement in the global leach extraction with 85%
copper extraction being achieved. Overall process recovery is
estimated to be 94% of leach extraction for each zone where the
leach extraction estimates are summarized in the table below.
|
Mineralogical Zone |
Cu Extraction(%) |
|
Cover |
77.6 |
|
Leach Cap |
79.2 |
|
Secondary Sulphides |
85.0 |
|
Primary Sulphides |
74.2 |
Extraction numbers are based on laboratory
column leach tests of supergene material under simulated mesophilic
and thermophilic bioleach conditions. Additional laboratory
bioleach testwork will be completed as part of the next stage of
engineering for the project. Heap bioleaching has been successfully
implemented over the past 30 years. Examples of current and
historical copper heap bioleach projects are the Cerro Verde mine,
Peru (Freeport McMoran), the La Granja project, Peru (Rio Tinto),
the Cerro Colorado mine, Chile (BHP), the Quebrada Blanca mine,
Chile (Teck Resources), the Zaldivar mine, Chile (Barrick), the
Lince II mine, Chile (Antofagasta Plc), in addition to others.
The column leach program, together with
associated mineralogical and bottle roll leach testwork has been
conducted at Aminpro Laboratories, an ISO 9001 and 14001 Laboratory
based in Lima, Peru. All works were designed and supervised by
Andrew Carter, General Manager UK of the Mining and Minerals arm of
Tetra Tech.
About Panoro
Panoro Minerals is a uniquely positioned Peru
focused copper exploration and development company. The
Company is advancing its flagship project, Cotabambas
Copper-Gold-Silver Project and its Antilla Copper-Molybdenum
Project, both located in the strategically important area of
southern Peru. The Company is well financed to expand, enhance and
advance its projects in the region where infrastructure such as
railway, roads, ports, water supply, power generation and
transmission are readily available and expanding quickly. The
region boasts the recent investment of over US$15 billion into the
construction or expansion of four large open pit copper mines.
Since 2007, the Company has completed over
80,000 meters of exploration drilling at these two key projects
leading to substantial increases in the mineral resource base for
each, as summarized in the table below.
Summary of Cotabambas and Antilla
Project Resources
|
Project |
ResourceClassification |
MillionTonnes |
Cu (%) |
Au (g/t) |
Ag (g/t) |
Mo (%) |
| Cotabambas Cu/Au/Ag |
Indicated |
117.1 |
0.42 |
0.23 |
2.74 |
0.001 |
|
Inferred |
605.3 |
0.31 |
0.17 |
2.33 |
0.002 |
| @ 0.20% CuEq cutoff, effective October 2013,
Tetratech |
| Antilla Cu/Mo |
Indicated |
291.8 |
0.34 |
- |
- |
0.01 |
|
Inferred |
90.5 |
0.26 |
- |
- |
0.007 |
| @ 0.175% CuEq cutoff, effective May 2016,
Tetratech |
Preliminary Economic Assessments (PEA) have been
completed for both the Cotabambas and Antilla Projects, the key
results are summarized below.
Summary of Cotabambas and Antilla
Project PEA Results
| Key Project Parameters |
|
Cotabambas Cu/Au/Ag Project1 |
Antilla Cu Project2 |
| Process Feed, life of mine |
million tonnes |
483.1 |
118.7 |
| Process Feed, daily |
Tonnes |
80,000 |
20,000 |
| Strip Ratio, life of mine |
|
1.25 : 1 |
1.38: 1 |
| BeforeTax1 |
NPV7.5% |
million USD |
1,053 |
520 |
|
IRR |
% |
20.4 |
34.7 |
|
Payback |
Years |
3.2 |
2.6 |
| After Tax1 |
NPV7.5% |
million USD |
684 |
305 |
|
IRR |
% |
16.7 |
25.9 |
|
Payback |
Years |
3.6 |
3.0 |
| Annual Average PayableMetals |
Cu |
thousand tonnes |
70.5 |
21.0 |
|
Au |
thousand ounces |
95.1 |
- |
|
Ag |
thousand ounces |
1,018.4 |
- |
|
Mo |
thousand tonnes |
- |
- |
| Initial Capital Cost |
million USD |
1,530 |
250 |
- Project economics estimated at commodity prices of; Cu =
US$3.00/lb, Au = US$1,250/oz, Ag = US$18.50/oz, Mo = US$12/lb
- Project economics estimated at long term commodity price of Cu
= US$3.05/lb and Short term commodity price of Cu = US$3.20,
US$3.15 and US$3.10 for Years 1,2 and 3 of operations,
respectively.
|
The PEAs are considered preliminary in nature
and include Inferred Mineral Resources that are considered too
speculative to have the economic considerations applied that would
enable classification as Mineral Reserves. There is no certainty
that the conclusions within the updated PEA will be realized.
Mineral Resources are not Mineral Reserves and do not have
demonstrated economic viability.
Luis Vela, a Qualified Person under National
Instrument 43-101, has reviewed and approved the scientific and
technical information in this press release.
On behalf of the Board of Panoro
Minerals Ltd.
Luquman Shaheen. PEng, PE, MBAPresident & CEO
FOR FURTHER INFORMATION, CONTACT:
| Panoro Minerals
Ltd. Luquman Shaheen, President & CEO Phone:
604.684.4246 Fax: 604.684.4200 Email: info@panoro.com Web:
www.panoro.com |
Renmark Financial Communications Inc. Laura Welsh
Tel.: (416) 644-2020 or (416) 939-3989 blwelsh@renmarkfinancial.com
www.renmarkfinancial.com |
| |
|
CAUTION REGARDING FORWARD LOOKING
STATEMENTS: Information and statements
contained in this news release that are not historical facts are
“forward-looking information” within the meaning of applicable
Canadian securities legislation and involve risks and
uncertainties.
Forward-looking statements are subject to a
variety of known and unknown risks, uncertainties and other factors
which could cause actual events or results to differ materially
from those expressed or implied by the forward-looking statements,
including, without limitation:
- risks relating to metal price fluctuations;
- risks relating to estimates of mineral resources, production,
capital and operating costs, decommissioning or reclamation
expenses, proving to be inaccurate;
- the inherent operational risks associated with mining and
mineral exploration, development, mine construction and operating
activities, many of which are beyond Panoro’s control;
- risks relating to Panoro’s ability to enforce Panoro’s legal
rights under permits or licenses or risk that Panoro’s will become
subject to litigation or arbitration that has an adverse
outcome;
- risks relating to Panoro’s projects being in Peru, including
political, economic and regulatory instability;
- risks relating to the uncertainty of applications to obtain,
extend or renew licenses and permits;
- risks relating to potential challenges to Panoro’s right to
explore and/or develop its projects;
- risks relating to mineral resource estimates being based on
interpretations and assumptions which may result in less mineral
production under actual circumstances;
- risks relating to Panoro’s operations being subject to
environmental and remediation requirements, which may increase the
cost of doing business and restrict Panoro’s operations;
- risks relating to being adversely affected by environmental,
safety and regulatory risks, including increased regulatory burdens
or delays and changes of law;
- risks relating to inadequate insurance or inability to obtain
insurance;
- risks relating to the fact that Panoro’s properties are not yet
in commercial production;
- risks relating to fluctuations in foreign currency exchange
rates, interest rates and tax rates; and
- risks relating to Panoro’s ability to raise funding to continue
its exploration, development and mining activities.
This list is not exhaustive of the factors that
may affect the forward-looking information and statements contained
in this news release. Should one or more of these risks and
uncertainties materialize, or should underlying assumptions prove
incorrect, actual results may vary materially from those described
in the forward‑looking information. The forward‑looking
information contained in this news release is based on beliefs,
expectations and opinions as of the date of this news
release. For the reasons set forth above, readers are
cautioned not to place undue reliance on forward-looking
information. Panoro does not undertake to update any
forward-looking information and statements included herein, except
in accordance with applicable securities laws.
Neither the TSX Venture Exchange nor its
Regulation Services Provider (as that term is defined in the
policies of the TSX Venture Exchange) accepts responsibility for
the adequacy or accuracy of this release.
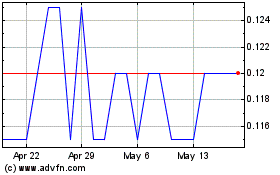
Panoro Minerals (TSXV:PML)
Historical Stock Chart
From Oct 2024 to Nov 2024

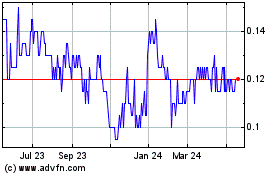
Panoro Minerals (TSXV:PML)
Historical Stock Chart
From Nov 2023 to Nov 2024


