Remedent, Inc. (OTCBB: REMI), an international company specializing
in research, development, and manufacturing of oral care and
cosmetic dentistry products, reported results for the fourth
quarter and for the year ended March 31, 2011 (in US Dollars).
Net sales for the fourth quarter increased 17% to $2.8 million
from $2.4 million in the same year ago quarter. The increase in
sales is attributable to increased sales in Asia.
Loss from operations in the fourth quarter was a loss of
$933,000 compared to a loss of $462,330 in the same year ago
quarter.
Net sales for the year increased by $4.25 million, 52% to $12.5
million in the year ended March 31, 2011 as compared to $8.25
million of sales in the year ended March 31, 2010. Net loss for the
year ended March 31, 2011 was $1.5 million or $(.08) per share, as
compared with a loss of $2.4 million, or $(0.12) per share for the
year ended March 31, 2010.
Cash and Cash equivalents totaled $1.6 million at March 31, 2011
as opposed to $614,000 at March 31, 2010.
Management Commentary:
"Our investment in our Chinese operations continues to exceed
our expectations. For the year ended March 31, 2011, Glamsmile Asia
generated approximately $850,000 in net income prior to tax. We
anticipate further growth in China as a new fourth studio is
expected to open in Wenzhou, China in September 2011.
"Our net loss for the year was negatively impacted by an
impairment loss of $750,000 for Soca Networks Singapore, an
investment made in a production facility to produce our Glamsmile
veneers. The investment was made in two installments of $375,000
each, with the last payment being made in March 2008. Since
management believes that the time-frame for recovery cannot be
predicted with any certainty and as a result we took a 100%
impairment allowance at year-end. In addition to this, our results
were also impacted by the write off of approximately $100,000 for
certain patents which are unrelated to our veneer market and
current strategic plan. In addition, our results also reflect a
deferred revenue of $475,250 for an advance payment we received for
veneers. Upon delivery of the veneers, the cost of goods sold will
be recorded and the revenue recognized.
"For the remainder of the fiscal year, management intends to
focus its efforts and resources on expanding and developing its
Chinese operations, where it sees growth and potential. This focus
may include changing the name of our entity from Remedent, Inc. to
Glamsmile Inc., and seeking additional board members who have
relevant experience with our business, particularly in the dental
market in Asia. In addition, management intends to focus on
reducing current and future corporate overhead expenses, by
consolidating some of its operations and repositioning the strategy
of its USA and European operations on establishing revenue streams
through royalty agreements for its products.
"We certainly are looking forward to getting Glamsmile Asia
positioned as one of the leading dental brands luxury brands in
China as well as the neighboring nearby other emerging Asian
markets," said Guy De Vreese, the CEO of Remedent.
Conference Call Information:
Remedent will host a conference call on Tuesday, July 19, 2011
at 10:00 a.m. Eastern Time (7:00 a.m. Pacific Time) to discuss
these results and its strategic plans for the future. A question
and answer session will follow management's presentation.
To participate in this call, dial the appropriate number 5-10
minutes prior to the start time. Date: Tuesday, July 19, 2011 Time:
10:00 a.m. Eastern Time. (7:00 a.m. Pacific Time) Dial in Number:
1-866-226-1792
A telephone replay of the call will be available until August
15, 2011 Toll Free Replay Number: 1-800-408-3053 Replay Password:
6787766
About Remedent
Remedent, Inc. specializes in the research, development,
manufacturing and marketing of oral care and cosmetic dentistry
products. The company serves the professional dental industry with
breakthrough technology for dental veneers. These products are
supported by a line of professional veneer whitening and teeth
sensitivity solutions. Headquartered in Belgium, Remedent
distributes its products to more than 35 countries worldwide. For
more information, go to www.remedent.com.
Forward-Looking Statements
Statements in this press release that are "forward-looking
statements" are based on current expectations and assumptions that
are subject to risks and uncertainties. Such forward-looking
statements involve known and unknown risks, uncertainties and other
unknown factors that could cause Remedent's actual operating
results to be materially different from any historical results or
from any future results expressed or implied by such
forward-looking statements. In addition to statements that
explicitly describe these risks and uncertainties, readers are
urged to consider statements that contain terms such as "believes,"
"belief," "expects," "expect," "intends," "intend," "anticipate,"
"anticipates," "plans," "plan," "projects," "project," to be
uncertain and forward-looking. Actual results could differ
materially because of factors such as Remedent's ability to achieve
the synergies and value creation contemplated by the proposed
transaction. For further information regarding risks and
uncertainties associated with Remedent's business, please refer to
the risk factors described in Remedent's filings with the
Securities and Exchange Commission, including, but not limited to,
its annual report on Form 10-K and quarterly reports on Form 10-Q.
We undertake no duty to revise or update any forward-looking
statements to reflect events or circumstances after the date of
this press release.
REMEDENT, INC. AND SUBSIDIARIES
CONSOLIDATED STATEMENTS OF OPERATIONS

                                              For the years ended March 31,
                                             ------------------------------
                                                  2011            2010
                                             --------------  --------------
Net sales                                    $   12,581,708  $    8,247,940
Cost of sales                                     3,947,699       4,322,680
                                             --------------  --------------
  Gross profit                                    8,634,009       3,925,260
                                             --------------  --------------
Operating Expenses
      Research and development                      429,244         271,195
      Sales and marketing                         2,220,686       1,352,260
      General and administrative                  4,972,982       4,524,324
      Depreciation and amortization                 779,883         726,499
                                             --------------  --------------
  TOTAL OPERATING EXPENSES                        8,402,795       6,874,278
                                             --------------  --------------
OPERATING INCOME (LOSS)                             231,214      (2,949,018)
                                             --------------  --------------
NON-OPERATING (EXPENSE) INCOME
      Impairment of long-term investments
       and advances                                (750,000)             --
      Warrants issued pursuant to
       Distribution Agreements                           --        (168,238)
      Interest expense                             (260,235)       (171,364)
      Interest income                               159,289         170,244
                                             --------------  --------------
  TOTAL OTHER INCOME (EXPENSES)                    (850,946)       (169,358)
                                             --------------  --------------
LOSS FROM CONTINUING OPERATIONS BEFORE
 INCOME TAXES                                      (619,732)     (3,118,376)
Income tax expense                                 (220,297)        (14,242)
                                             --------------  --------------
NET INCOME (LOSS)                                  (840,029)     (3,132,618)
NET INCOME (LOSS) ATTRIBUTABLE TO NON-
 CONTROLLING INTERESTS                             (707,146)       (782,703)
                                             --------------  --------------
NET LOSS ATTRIBUTABLE TO REMEDENT INC.
 Common Stockholders                         $   (1,547,175) $   (2,349,915)
                                             ==============  ==============
LOSS PER SHARE
    Basic and fully diluted                  $        (0.08) $        (0.12)
                                             ==============  ==============
WEIGHTED AVERAGE SHARES OUTSTANDING
    Basic and fully diluted                      19,995,969      19,995,969
                                             ==============  ==============

Net Loss attributable to Remedent, Inc.
 common shareholders                         $   (1,547,175) $   (2,349,915)
OTHER COMPREHENSIVE INCOME (LOSS):
  Foreign currency translation adjustment          (184,890)         (9,464)
                                             --------------  --------------
Total Other Comprehensive loss                   (1,732,065)     (2,359,379)

LESS: COMPREHENSIVE INCOME ATTRIBUTABLE TO
 NON-CONTROLLING INTEREST                            21,996           7,130

                                             --------------  --------------
COMPREHENSIVE (LOSS) ATTRIBUTABLE TO
 REMEDENT, INC. common shareholders          $   (1,710,069) $   (2,366,509)
                                             ==============  ==============


REMEDENT, INC. AND SUBSIDIARIES
CONSOLIDATED BALANCE SHEETS
                                             March 31, 2011  March 31, 2010
                                             --------------  --------------
ASSETS
CURRENT ASSETS:
Cash and cash equivalents                    $    1,662,520  $      613,466
  Accounts receivable, net of allowance for
   doubtful accounts of $28,975 at March 31,
   2011 and $65,845 at March 31, 2010             2,764,651         806,931
Inventories, net                                  2,164,046       2,161,692
Prepaid expense                                     762,953         920,487
                                             --------------  --------------
  Total current assets                            7,354,170       4,502,576
                                             --------------  --------------
PROPERTY AND EQUIPMENT, NET                       1,401,735       1,735,719
OTHER ASSETS
Long term investments and advances                       --         750,000
Patents, net                                        166,746         246,992
Goodwill                                            699,635         699,635
                                             --------------  --------------
  Total assets                               $    9,622,286  $    7,934,922
                                             ==============  ==============
LIABILITIES AND STOCKHOLDERS' EQUITY
 (DEFICIT)
CURRENT LIABILITIES:
Current portion, long term debt              $      184,679  $      215,489
Line of Credit                                    2,160,674         674,600
Short term loan                                     400,000              --
Accounts payable                                  1,744,253       1,932,684
Accrued liabilities                               1,256,148         491,536
Deferred revenue                                    475,250              --
Due to related parties                               95,354         268,484
                                             --------------  --------------
  Total current liabilities                       6,316,358       3,582,793
Long term debt less current portion                 273,557         425,882
                                             --------------  --------------
  Total liabilities                               6,589,915       4,008,675
                                             --------------  --------------

EQUITY:
  Preferred Stock $0.001 par value
   (10,000,000 shares authorized, none
   issued and outstanding)                               --              --
  Common stock, $0.001 par value;
   (50,000,000 shares authorized, 19,995,969
   shares issued and outstanding at March
   31, 2011 and March 31, 2010 respectively)         19,996          19,996
  Treasury stock, at cost; 723,000 shares
   outstanding at March 31, 2011 and March
   31, 2010 respectively                           (831,450)       (831,450)
Additional paid-in capital                       24,855,883      24,742,201
Accumulated deficit                             (21,113,118)    (19,565,943)
Accumulated other comprehensive income
 (loss) (foreign currency translation
 adjustment)                                       (834,949)       (650,059)
Obligation to issue shares                           97,500          97,500
                                             --------------  --------------
  Total Remedent, Inc. stockholders' equity       2,193,862       3,812,245
                                             --------------  --------------
Non-controlling interest                            838,509         114,002
                                             --------------  --------------
Total stockholders' equity                        3,032,371       3,926,247
                                             --------------  --------------
  Total liabilities and equity               $    9,622,286  $    7,934,922
                                             ==============  ==============
CONTACT: Stephen Ross 310 922 5685 docktor99@aol.com
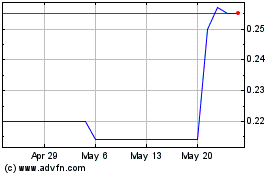
Elysee Development (PK) (USOTC:ASXSF)
Historical Stock Chart
From Jun 2024 to Jul 2024

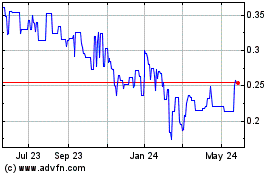
Elysee Development (PK) (USOTC:ASXSF)
Historical Stock Chart
From Jul 2023 to Jul 2024
