Half Yearly Report -5-
August 23 2010 - 1:00AM
UK Regulatory
|                             |          |  |          |  |          |  |
+-----------------------------+----------+--+----------+--+----------+--+
| Liabilities                 |          |  |          |  |          |  |
+-----------------------------+----------+--+----------+--+----------+--+
| Bank and other loans        |   10,562 |  |   12,797 |  |    2,337 |  |
+-----------------------------+----------+--+----------+--+----------+--+
| Trade and other payables    |   42,050 |  |   28,490 |  |   23,077 |  |
+-----------------------------+----------+--+----------+--+----------+--+
| Retirement benefit          |   12,170 |  |   11,050 |  |    8,910 |  |
| obligations                 |          |  |          |  |          |  |
+-----------------------------+----------+--+----------+--+----------+--+
| Provisions                  |    2,146 |  |    1,950 |  |    1,700 |  |
+-----------------------------+----------+--+----------+--+----------+--+
| Total non-current           |   66,928 |  |   54,287 |  |   36,024 |  |
| liabilities                 |          |  |          |  |          |  |
+-----------------------------+----------+--+----------+--+----------+--+
| Trade and other payables    |  120,800 |  |   79,661 |  |   87,698 |  |
+-----------------------------+----------+--+----------+--+----------+--+
| Provisions                  |    1,647 |  |    1,547 |  |    2,164 |  |
+-----------------------------+----------+--+----------+--+----------+--+
| Current tax liabilities     |    1,500 |  |        - |  |        - |  |
+-----------------------------+----------+--+----------+--+----------+--+
| Total current liabilities   |  123,947 |  |   81,208 |  |   89,862 |  |
+-----------------------------+----------+--+----------+--+----------+--+
| Total liabilities           |  190,875 |  |  135,495 |  |  125,886 |  |
+-----------------------------+----------+--+----------+--+----------+--+
|                             |          |  |          |  |          |  |
+-----------------------------+----------+--+----------+--+----------+--+
| Total equity and            |  883,671 |  |  758,225 |  |  818,452 |  |
| liabilities                 |          |  |          |  |          |  |
+-----------------------------+----------+--+----------+--+----------+--+
These condensed consolidated interim financial statements were approved by the
Board of directors on 20 August 2010.
Bovis Homes Group PLC
Group statement of changes in equity

+----------------------------+-----------+--+---------+----------+----------+--+
| (unaudited)                |     Total |  |  Issued |    Share |    Total |  |
|                            |           |  |         |          |          |  |
+----------------------------+-----------+--+---------+----------+----------+--+
| For the six months ended   |  retained |  | capital |  premium |          |  |
| 30 June 2010               |           |  |         |          |          |  |
+----------------------------+-----------+--+---------+----------+----------+--+
|                            |  earnings |  |         |          |          |  |
+----------------------------+-----------+--+---------+----------+----------+--+
|                            |    GBP000 |  |  GBP000 |   GBP000 |   GBP000 |  |
+----------------------------+-----------+--+---------+----------+----------+--+
| Balance at 1 January 2009  |   414,654 |  |  60,497 |  157,127 |  632,278 |  |
+----------------------------+-----------+--+---------+----------+----------+--+
| Total comprehensive income |    (9,744 | )|       - |        - |   (9,744 | )|
| and expense                |           |  |         |          |          |  |
+----------------------------+-----------+--+---------+----------+----------+--+
| Deferred tax on other      |       (19 | )|       - |        - |      (19 | )|
| employee benefits          |           |  |         |          |          |  |
+----------------------------+-----------+--+---------+----------+----------+--+
| Issue of share capital     |         - |  |      17 |      101 |      118 |  |
+----------------------------+-----------+--+---------+----------+----------+--+
| Share based payments       |        97 |  |       - |        - |       97 |  |
+----------------------------+-----------+--+---------+----------+----------+--+
| Balance at 30 June 2009    |   404,988 |  |  60,514 |  157,228 |  622,730 |  |
+----------------------------+-----------+--+---------+----------+----------+--+
| Balance at 1 January 2009  |   414,654 |  |  60,497 |  157,127 |  632,278 |  |
+----------------------------+-----------+--+---------+----------+----------+--+
| Total comprehensive income |       459 |  |       - |        - |      459 |  |
| and expense                |           |  |         |          |          |  |
+----------------------------+-----------+--+---------+----------+----------+--+
| Deferred tax on other      |        (2 | )|         |          |       (2 | )|
| employee benefits          |           |  |         |          |          |  |
+----------------------------+-----------+--+---------+----------+----------+--+
| Issue of share capital     |         - |  |   6,073 |   53,054 |   59,127 |  |
+----------------------------+-----------+--+---------+----------+----------+--+
| Share based payments       |       704 |  |       - |        - |      704 |  |
+----------------------------+-----------+--+---------+----------+----------+--+
| Balance at 31 December     |   415,815 |  |  66,570 |  210,181 |  692,566 |  |
| 2009                       |           |  |         |          |          |  |
+----------------------------+-----------+--+---------+----------+----------+--+
| Balance at 1 January 2010  |   415,815 |  |  66,570 |  210,181 |  692,566 |  |
+----------------------------+-----------+--+---------+----------+----------+--+
| Total comprehensive income |       (12 | )|       - |        - |      (12 | )|
| and expense                |           |  |         |          |          |  |
+----------------------------+-----------+--+---------+----------+----------+--+
| Deferred tax on other      |        (2 | )|         |          |       (2 | )|
| employee benefits          |           |  |         |          |          |  |
+----------------------------+-----------+--+---------+----------+----------+--+
| Issue of share capital     |         - |  |      37 |      217 |      254 |  |
+----------------------------+-----------+--+---------+----------+----------+--+
| Share based payments       |       (10 | )|       - |        - |      (10 | )|
+----------------------------+-----------+--+---------+----------+----------+--+
| Balance at 30 June 2010    |   415,791 |  |  66,607 |  210,398 |  692,796 |  |
+----------------------------+-----------+--+---------+----------+----------+--+
Bovis Homes Group PLC
Group statement of cash flows
+-----------------------------+----------+--+----------+--+----------+--+
| For the six months ended 30 |      Six |  |      Six |  |     Year |  |
| June 2010                   |   months |  |   months |  |    ended |  |
|                             |    ended |  |    ended |  |          |  |
+-----------------------------+----------+--+----------+--+----------+--+
| (unaudited)                 |  30 June |  |  30 June |  |   31 Dec |  |
|                             |     2010 |  |     2009 |  |     2009 |  |
+-----------------------------+----------+--+----------+--+----------+--+
|                             |   GBP000 |  |   GBP000 |  |   GBP000 |  |
+-----------------------------+----------+--+----------+--+----------+--+
|                             |          |  |          |  |          |  |
+-----------------------------+----------+--+----------+--+----------+--+
| Cash flows from operating   |          |  |          |  |          |  |
| activities                  |          |  |          |  |          |  |
+-----------------------------+----------+--+----------+--+----------+--+
| Profit/(loss) for the       |    2,393 |  |   (6,576 | )|    3,490 |  |
| period                      |          |  |          |  |          |  |
+-----------------------------+----------+--+----------+--+----------+--+
| Depreciation                |      328 |  |      420 |  |      769 |  |
+-----------------------------+----------+--+----------+--+----------+--+
| Impairment of assets        |      247 |  |        - |  |      245 |  |
+-----------------------------+----------+--+----------+--+----------+--+
| Financial income            |   (1,363 | )|     (764 | )|   (2,304 | )|
+-----------------------------+----------+--+----------+--+----------+--+
| Financial expense           |    2,634 |  |    6,708 |  |   16,375 |  |
+-----------------------------+----------+--+----------+--+----------+--+
| Loss/(profit) on sale of    |        4 |  |      (10 | )|        3 |  |
| property, plant and         |          |  |          |  |          |  |
| equipment                   |          |  |          |  |          |  |
+-----------------------------+----------+--+----------+--+----------+--+
| Equity-settled share-based  |     (10) |  |       97 |  |      704 |  |
| payment (credit)/expense    |          |  |          |  |          |  |
+-----------------------------+----------+--+----------+--+----------+--+
| Income tax expense/(credit) |    1,126 |  |   (2,031 | )|    1,307 |  |
+-----------------------------+----------+--+----------+--+----------+--+
| Write-down/(release) of     |        - |  |    8,895 |  |   (2,664 | )|
| inventories                 |          |  |          |  |          |  |
+-----------------------------+----------+--+----------+--+----------+--+
| Share of results of joint   |       30 |  |        - |  |        - |  |
| ventures                    |          |  |          |  |          |  |
+-----------------------------+----------+--+----------+--+----------+--+
| Add back of profit not      |      963 |  |        - |  |        - |  |
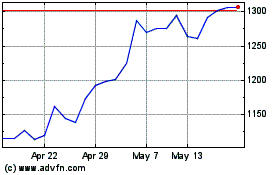
Vistry (LSE:VTY)
Historical Stock Chart
From Jul 2024 to Aug 2024

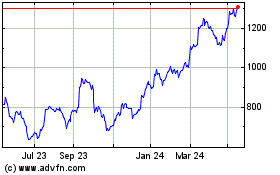
Vistry (LSE:VTY)
Historical Stock Chart
From Aug 2023 to Aug 2024
