|
|
|
|
|
BOARD OF DIRECTORS AND
CORPORATE GOVERNANCE |
Board and Committee Self-Evaluations
Pursuant to our Corporate Governance Guidelines and committee charters, the Board and its committees annually conduct self-assessments. The Corporate Governance and Nominating Committee oversees the process and reviews the content and format of the evaluations to help ensure that the feedback solicited is relevant and appropriate. Self-evaluation topics generally include, among other matters, Board and committee composition and structure, effectiveness of the Board and committees, meeting agendas and governance and Board interaction with management. The results of these assessments are discussed with the full Board and each Committee respectively, and based on the results, the Board and the Committees implement enhancements and other modifications as appropriate. Individual feedback is provided to Board members by the Chair of the Board.
Management Succession Planning
Our Corporate Governance and Nominating Committee plays a strategic role in the oversight of talent management and succession planning for the Chief Executive Officer, other executive officer positions and senior leadership roles across the company. On at least an annual basis, the Corporate Governance and Nominating Committee reviews the Company’s succession plan, which includes a discussion regarding transition and succession in the case of an emergency or unplanned vacancy. In 2022 and 2023, the Corporate Governance and Nominating Committee played an integral role in sourcing, evaluating and ultimately recommending successors to our former President and Chief Executive Officer, Mark L. Schiller, and our former Executive Vice President and Chief Financial Officer, Christopher J. Bellairs.
Director Orientation and Continuing Education
Our Corporate Governance Guidelines require the Company to maintain an orientation process to onboard new directors. As part of this process, the Company’s management conducts an orientation program for new directors, and each new director receives materials and briefings to permit such director to become familiar with the Company’s business, finances, corporate governance and compensation practices and policies. The Company also provides, on an ongoing basis, additional opportunities for directors to further familiarize themselves with the Company’s business, finances and operations, which may include, among other things, presentations from members of management of the Company and visits to the Company’s operational sites.
In addition, the Company arranges for outside speakers to speak at Board and committee meetings on topics relevant to the Company’s business, and directors are encouraged to attend a variety of external continuing education programs at the Company’s expense, including programs offered by the National Association of Corporate Directors. Directors participate in such educational opportunities to stay abreast of best practices in corporate governance and the latest trends on subject matters relevant to the Company and its business.
Website Access to Corporate Governance Documents
We have adopted a “Code of Ethics,” as defined in the regulations of the SEC, which applies to all of our directors and employees, including our principal executive officer, principal financial officer and principal accounting officer. Copies of the charters for committees of our Board, as well as our Corporate Governance Guidelines and Code of Business Conduct and Ethics, are available free of charge on our website at hain.com under Investors — Corporate Governance or by writing to Investor Relations, The Hain Celestial Group, Inc., 221 River Street, Hoboken, New Jersey 07030. If the Company ever were to amend or waive any provision of its Code of Business Conduct and Ethics that applies to the Company’s principal executive officer, principal financial officer, principal accounting officer or any person performing similar functions, the Company intends to satisfy its disclosure obligations, if any, with respect to any such waiver or amendment by posting such information on its website set forth above rather than by filing a Current Report on Form 8-K. The information on our website is not, and shall not be deemed to be, a part of this proxy statement or incorporated into any of our other filings made with the SEC.
|
|
|
|
|
| HAIN CELESTIAL 2023 Proxy Statement |
|
|
25 |
|
Pay vs Performance Disclosure - USD ($)
|
12 Months Ended |
Jun. 30, 2023 |
Jun. 30, 2022 |
Jun. 30, 2021 |
| Pay vs Performance Disclosure |
|
|
|
| Pay vs Performance Disclosure, Table |
Pay Versus Performance Table The following table shows, for fiscal years 2021, 2022 and 2023, the “Total” compensation of our current and former CEOs and the average “Total” compensation for our other NEOs, as presented in the Summary Compensation Table, CAP for our current and former CEOs and the average CAP for other NEOs, Company total shareholder return, total shareholder return of the S&P Food & Beverage Select Industry Index, net income (loss) and our Company selected financial performance measure, Adjusted EBITDA.
|
|
|
|
|
|
|
|
|
|
|
|
|
|
|
|
|
|
|
|
|
|
|
|
|
|
|
|
|
|
|
|
|
|
|
|
|
|
|
|
|
|
|
|
|
|
|
|
|
|
|
|
|
|
|
|
|
|
|
|
|
|
|
Summary Compensation Table Total for Current CEO 1 ($) |
|
Summary Compensation Table Total for Former CEO 2 ($) |
|
Compensation Actually Paid to Current CEO 3 ($) |
|
Compensation Actually Paid to Former CEO 3 ($) |
|
Average Summary Compensation Table Total for Non-CEO NEOs 4 ($) |
|
Average Compensation Actually Paid to Non-CEO NEOs 5 ($) |
|
Value of Initial
Fixed $100
Investment
Based On: |
|
Net Income (Loss) 8 (Thousands) ($) |
|
Adjusted EBITDA 9 (Thousands) |
| |
Company Total Shareholder Return 6 ($) |
|
Peer Group Total Shareholder Return 7 ($) |
2023 |
|
|
|
4,765,456 |
|
|
|
|
7,741,908 |
|
|
|
|
3,752,004 |
|
|
|
|
847,657 |
|
|
|
|
1,646,461 |
|
|
|
|
551,002 |
|
|
|
|
39.70 |
|
|
|
|
135.55 |
|
|
|
|
(116,537 |
) |
|
|
|
166,622 |
|
2022 |
|
|
|
— |
|
|
|
|
7,326,221 |
|
|
|
|
— |
|
|
|
|
8,910,969 |
|
|
|
|
2,631,605 |
|
|
|
|
2,762,642 |
|
|
|
|
75.34 |
|
|
|
|
131.35 |
|
|
|
|
77,873 |
|
|
|
|
200,616 |
|
2021 |
|
|
|
— |
|
|
|
|
2,886,066 |
|
|
|
|
— |
|
|
|
|
6,666,132 |
|
|
|
|
989,397 |
|
|
|
|
2,191,715 |
|
|
|
|
127.32 |
|
|
|
|
136.26 |
|
|
|
|
77,364 |
|
|
|
|
258,938 |
|
| 1 |
The amount shown in this column reflects the amount reported in the Total column of the Summary Compensation Table for fiscal year 2023 for Wendy P. Davidson, who has served as our President and CEO since January 1, 2023. |
| 2 |
The amounts shown in this column reflect the amounts reported in the Total column of the Summary Compensation Table for each applicable fiscal year for Mark L. Schiller, our former President and CEO who departed that role on December 31, 2022. |
| 3 |
The amounts shown in these columns reflect the “compensation actually paid” as calculated under SEC rules to Ms. Davidson for fiscal year 2023 and to Mr. Schiller for each applicable fiscal year. The following table shows those calculations. |
|
|
|
|
|
|
|
|
|
|
|
|
|
|
|
|
|
|
|
|
|
|
|
|
Calculation of “Compensation Actually Paid” Under SEC Rules – Current CEO and Former CEO a |
|
Current CEO –
Wendy P. Davidson |
|
Former CEO –
Mark L. Schiller |
| |
|
|
|
|
|
|
|
Amount reported in Total column of Summary Compensation Table |
|
|
|
4,765,456 |
|
|
|
|
7,741,908 |
|
|
|
|
7,326,221 |
|
|
|
|
2,886,066 |
|
Deduction for amount reported in Stock Awards column of Summary Compensation Table ( , grant date fair value of stock awards) |
|
|
|
(3,066,503) |
|
|
|
|
(5,612,067 |
) |
|
|
|
(6,024,187 |
) |
|
|
|
— |
|
Increase for fair value at fiscal year-end of equity awards granted during the fiscal year that remain outstanding at fiscal year-end b |
|
|
|
2,053,051 |
|
|
|
|
464,267 |
|
|
|
|
2,079,133 |
|
|
|
|
— |
|
Increase/deduction for change in fair value during the fiscal year of equity awards granted in a prior fiscal year that remain outstanding at fiscal year-end b |
|
|
|
— |
|
|
|
|
— |
|
|
|
|
— |
|
|
|
|
3,749,953 |
|
Increase/deduction for change in fair value during the fiscal year, as of the vesting date, of equity awards granted in a prior fiscal year that vested in the fiscal year b |
|
|
|
— |
|
|
|
|
(55,420 |
) |
|
|
|
5,529,802 |
|
|
|
|
30,113 |
|
Deduction for fair value at prior fiscal year-end of equity awards granted in a prior fiscal year that failed to meet vesting conditions and were forfeited during the fiscal year b |
|
|
|
— |
|
|
|
|
(1,691,031 |
) |
|
|
|
— |
|
|
|
|
— |
|
“Compensation Actually Paid” under SEC rules |
|
|
|
|
|
|
|
|
|
|
|
|
|
|
|
|
|
|
|
|
| |
a |
The following components of the calculation of “compensation actually paid” under SEC rules were not applicable: adjustments for defined benefit and actuarial pension plans; additions for equity awards that were both granted and vested during the same fiscal year; and additions for the value of dividends or other earnings paid on equity awards during the fiscal year and not otherwise included in the total compensation for the fiscal year. |
| |
b |
For all equity awards, our methodology for calculating the fair value remained consistent between the grant date fair value measurement and the subsequent fair value measurements, provided that certain changes to assumptions are reflected in subsequent fair value measurements of PSU awards. Fair values for PSU awards that are based on relative total shareholder return or absolute total shareholder return are measured using a Monte Carlo simulation model in accordance with FASB ASC Topic 718, as described in Note 13 to the Consolidated Financial Statements contained in the Company’s Annual Report on Form 10-K for the fiscal year ended June 30, 2023. For both the Company and constituents of the peer group used for PSU awards based on relative total shareholder return, actual performance through the measurement date is taken into account. Additionally, the Monte Carlo simulation model requires the use of certain assumptions, which include assumptions relating to expected share price volatility, risk-free interest rate and, for relative total shareholder return PSUs, correlation coefficients, which factors inherently change over time. |
| 4 |
The amounts shown in this column reflect, for each applicable fiscal year, the average of the amounts reported in the Total column of the Summary Compensation Table for the Company’s named executive officers other than the CEO. The named executive officers included for this purpose for each applicable year are as follows: (i) for fiscal year 2023, Wolfgang Goldenitsch, Kristy M. Meringolo, Christopher J. Bellairs and David J. Karch (former); (ii) for fiscal year 2022, Christopher J. Bellairs, Wolfgang Goldenitsch, Kristy M. Meringolo, David J. Karch (former), Javier H. Idrovo (former) and Christopher J. Boever (former); and (iii) for fiscal year 2021, Kristy M. Meringolo, Javier H. Idrovo (former), Christopher J. Boever (former) and Jeryl Wolfe (former). |
| 5 |
The amounts shown in this column reflect, for each applicable fiscal year, the average amount of “compensation actually paid” as calculated under SEC rules to the Company’s named executive officers other than the CEO. The following table shows those calculations. |
|
|
|
|
|
|
|
|
|
|
|
|
|
|
|
|
|
Calculation of “Compensation Actually Paid” Under SEC Rules – Average for Non-CEO Named Executive Officers a |
|
|
|
|
|
|
|
|
|
Average amount reported in Total column of Summary Compensation Table |
|
|
1,646,461 |
|
|
|
2,631,605 |
|
|
|
989,397 |
|
Deduction for average amount reported in Stock Awards column of Summary Compensation Table ( , grant date fair value of stock awards) b |
|
|
(915,950 |
) |
|
|
(2,108,881 |
) |
|
|
— |
|
Increase for average amount of fair value at fiscal year-end of equity awards granted during the fiscal year that remain outstanding at fiscal year-end b |
|
|
297,368 |
|
|
|
589,053 |
|
|
|
— |
|
Increase/deduction for average amount of change in fair value during the fiscal year of equity awards granted in a prior fiscal year that remain outstanding at fiscal year-end b |
|
|
(239,242 |
) |
|
|
(3,500 |
) |
|
|
1,145,052 |
|
Increase/deduction for average amount of change in fair value during the fiscal year, as of the vesting date, of equity awards granted in a prior fiscal year that vested in the fiscal year b |
|
|
(28,615 |
) |
|
|
1,654,365 |
|
|
|
57,266 |
|
Deduction for average amount of fair value at prior fiscal year-end of equity awards granted in a prior fiscal year that failed to meet vesting conditions and were forfeited during the fiscal year b |
|
|
(209,020 |
) |
|
|
— |
|
|
|
— |
|
Average “Compensation Actually Paid” under SEC rules |
|
|
|
|
|
|
|
|
|
|
|
|
| |
a |
The following components of the calculation of “compensation actually paid” under SEC rules were not applicable: adjustments for defined benefit and actuarial pension plans; additions for equity awards that were both granted and vested during the same fiscal year; and additions for the value of dividends or other earnings paid on equity awards during the fiscal year and not otherwise included in the total compensation for the fiscal year. |
| |
b |
For all equity awards, our methodology for calculating the fair value remained consistent between the grant date fair value measurement and the subsequent fair value measurements, provided that certain changes to assumptions are reflected in subsequent fair value measurements of PSU awards. Fair values for PSU awards that are based on relative total shareholder return or absolute total shareholder return are measured using a Monte Carlo simulation model in accordance with FASB ASC Topic 718, as described in Note 13 to the Consolidated Financial Statements contained in the Company’s Annual Report on Form 10-K for the fiscal year ended June 30, 2023. For both the Company and constituents of the peer group used for PSU awards based on relative total shareholder return, actual performance through the measurement date is taken into account. Additionally, the Monte Carlo simulation model requires the use of certain assumptions, which include assumptions relating to expected share price volatility, risk-free interest rate and, for relative total shareholder return PSUs, correlation coefficients, which factors inherently change over time. |
| 6 |
The amounts shown in the column reflect the cumulative total shareholder return on our common stock during the period from June 30, 2020 through the end of the applicable fiscal year, assuming an investment of $100 in our common stock as of the market close on June 30, 2020. |
| 7 |
The amounts shown in the column reflect the cumulative total shareholder return of the S&P Food & Beverage Select Industry Index, the published industry index used in the performance graph included in the Company’s Annual Report on Form 10-K for the fiscal year ended June 30, 2023, during the period from June 30, 2020 through the end of the applicable fiscal year, assuming an investment of $100 as of the market close on June 30, 2020. |
| 8 |
Represents the amount of net income (loss) reflected in the Company’s audited financial statements for each applicable fiscal year. |
| 9 |
Represents the amount of Adjusted EBITDA reported by the Company for each applicable fiscal year. Adjusted EBITDA is the measure selected by the Company under SEC rules as the most important performance measure used to link CAP for the NEOs to Company performance during fiscal year 2023. Adjusted EBITDA is a non-GAAP financial measure. See Appendix A to this proxy statement for additional information on Adjusted EBITDA. |
|
|
|
| Company Selected Measure Name |
Adjusted EBITDA
|
|
|
| Named Executive Officers, Footnote |
The named executive officers included for this purpose for each applicable year are as follows: (i) for fiscal year 2023, Wolfgang Goldenitsch, Kristy M. Meringolo, Christopher J. Bellairs and David J. Karch (former); (ii) for fiscal year 2022, Christopher J. Bellairs, Wolfgang Goldenitsch, Kristy M. Meringolo, David J. Karch (former), Javier H. Idrovo (former) and Christopher J. Boever (former); and (iii) for fiscal year 2021, Kristy M. Meringolo, Javier H. Idrovo (former), Christopher J. Boever (former) and Jeryl Wolfe (former).
|
|
|
| Peer Group Issuers, Footnote |
The amounts shown in the column reflect the cumulative total shareholder return of the S&P Food & Beverage Select Industry Index, the published industry index used in the performance graph included in the Company’s Annual Report on Form 10-K for the fiscal year ended June 30, 2023, during the period from June 30, 2020 through the end of the applicable fiscal year, assuming an investment of $100 as of the market close on June 30, 2020.
|
|
|
| Adjustment To PEO Compensation, Footnote |
| 3 |
The amounts shown in these columns reflect the “compensation actually paid” as calculated under SEC rules to Ms. Davidson for fiscal year 2023 and to Mr. Schiller for each applicable fiscal year. The following table shows those calculations. |
|
|
|
|
|
|
|
|
|
|
|
|
|
|
|
|
|
|
|
|
|
|
|
|
Calculation of “Compensation Actually Paid” Under SEC Rules – Current CEO and Former CEO a |
|
Current CEO –
Wendy P. Davidson |
|
Former CEO –
Mark L. Schiller |
| |
|
|
|
|
|
|
|
Amount reported in Total column of Summary Compensation Table |
|
|
|
4,765,456 |
|
|
|
|
7,741,908 |
|
|
|
|
7,326,221 |
|
|
|
|
2,886,066 |
|
Deduction for amount reported in Stock Awards column of Summary Compensation Table ( , grant date fair value of stock awards) |
|
|
|
(3,066,503) |
|
|
|
|
(5,612,067 |
) |
|
|
|
(6,024,187 |
) |
|
|
|
— |
|
Increase for fair value at fiscal year-end of equity awards granted during the fiscal year that remain outstanding at fiscal year-end b |
|
|
|
2,053,051 |
|
|
|
|
464,267 |
|
|
|
|
2,079,133 |
|
|
|
|
— |
|
Increase/deduction for change in fair value during the fiscal year of equity awards granted in a prior fiscal year that remain outstanding at fiscal year-end b |
|
|
|
— |
|
|
|
|
— |
|
|
|
|
— |
|
|
|
|
3,749,953 |
|
Increase/deduction for change in fair value during the fiscal year, as of the vesting date, of equity awards granted in a prior fiscal year that vested in the fiscal year b |
|
|
|
— |
|
|
|
|
(55,420 |
) |
|
|
|
5,529,802 |
|
|
|
|
30,113 |
|
Deduction for fair value at prior fiscal year-end of equity awards granted in a prior fiscal year that failed to meet vesting conditions and were forfeited during the fiscal year b |
|
|
|
— |
|
|
|
|
(1,691,031 |
) |
|
|
|
— |
|
|
|
|
— |
|
“Compensation Actually Paid” under SEC rules |
|
|
|
|
|
|
|
|
|
|
|
|
|
|
|
|
|
|
|
|
| |
a |
The following components of the calculation of “compensation actually paid” under SEC rules were not applicable: adjustments for defined benefit and actuarial pension plans; additions for equity awards that were both granted and vested during the same fiscal year; and additions for the value of dividends or other earnings paid on equity awards during the fiscal year and not otherwise included in the total compensation for the fiscal year. |
| |
b |
For all equity awards, our methodology for calculating the fair value remained consistent between the grant date fair value measurement and the subsequent fair value measurements, provided that certain changes to assumptions are reflected in subsequent fair value measurements of PSU awards. Fair values for PSU awards that are based on relative total shareholder return or absolute total shareholder return are measured using a Monte Carlo simulation model in accordance with FASB ASC Topic 718, as described in Note 13 to the Consolidated Financial Statements contained in the Company’s Annual Report on Form 10-K for the fiscal year ended June 30, 2023. For both the Company and constituents of the peer group used for PSU awards based on relative total shareholder return, actual performance through the measurement date is taken into account. Additionally, the Monte Carlo simulation model requires the use of certain assumptions, which include assumptions relating to expected share price volatility, risk-free interest rate and, for relative total shareholder return PSUs, correlation coefficients, which factors inherently change over time. |
|
|
|
| Non-PEO NEO Average Total Compensation Amount |
$ 1,646,461
|
$ 2,631,605
|
$ 989,397
|
| Non-PEO NEO Average Compensation Actually Paid Amount |
$ 551,002
|
2,762,642
|
2,191,715
|
| Adjustment to Non-PEO NEO Compensation Footnote |
| 5 |
The amounts shown in this column reflect, for each applicable fiscal year, the average amount of “compensation actually paid” as calculated under SEC rules to the Company’s named executive officers other than the CEO. The following table shows those calculations. |
|
|
|
|
|
|
|
|
|
|
|
|
|
|
|
|
|
Calculation of “Compensation Actually Paid” Under SEC Rules – Average for Non-CEO Named Executive Officers a |
|
|
|
|
|
|
|
|
|
Average amount reported in Total column of Summary Compensation Table |
|
|
1,646,461 |
|
|
|
2,631,605 |
|
|
|
989,397 |
|
Deduction for average amount reported in Stock Awards column of Summary Compensation Table ( , grant date fair value of stock awards) b |
|
|
(915,950 |
) |
|
|
(2,108,881 |
) |
|
|
— |
|
Increase for average amount of fair value at fiscal year-end of equity awards granted during the fiscal year that remain outstanding at fiscal year-end b |
|
|
297,368 |
|
|
|
589,053 |
|
|
|
— |
|
Increase/deduction for average amount of change in fair value during the fiscal year of equity awards granted in a prior fiscal year that remain outstanding at fiscal year-end b |
|
|
(239,242 |
) |
|
|
(3,500 |
) |
|
|
1,145,052 |
|
Increase/deduction for average amount of change in fair value during the fiscal year, as of the vesting date, of equity awards granted in a prior fiscal year that vested in the fiscal year b |
|
|
(28,615 |
) |
|
|
1,654,365 |
|
|
|
57,266 |
|
Deduction for average amount of fair value at prior fiscal year-end of equity awards granted in a prior fiscal year that failed to meet vesting conditions and were forfeited during the fiscal year b |
|
|
(209,020 |
) |
|
|
— |
|
|
|
— |
|
Average “Compensation Actually Paid” under SEC rules |
|
|
|
|
|
|
|
|
|
|
|
|
| |
a |
The following components of the calculation of “compensation actually paid” under SEC rules were not applicable: adjustments for defined benefit and actuarial pension plans; additions for equity awards that were both granted and vested during the same fiscal year; and additions for the value of dividends or other earnings paid on equity awards during the fiscal year and not otherwise included in the total compensation for the fiscal year. |
| |
b |
For all equity awards, our methodology for calculating the fair value remained consistent between the grant date fair value measurement and the subsequent fair value measurements, provided that certain changes to assumptions are reflected in subsequent fair value measurements of PSU awards. Fair values for PSU awards that are based on relative total shareholder return or absolute total shareholder return are measured using a Monte Carlo simulation model in accordance with FASB ASC Topic 718, as described in Note 13 to the Consolidated Financial Statements contained in the Company’s Annual Report on Form 10-K for the fiscal year ended June 30, 2023. For both the Company and constituents of the peer group used for PSU awards based on relative total shareholder return, actual performance through the measurement date is taken into account. Additionally, the Monte Carlo simulation model requires the use of certain assumptions, which include assumptions relating to expected share price volatility, risk-free interest rate and, for relative total shareholder return PSUs, correlation coefficients, which factors inherently change over time. |
|
|
|
| Compensation Actually Paid vs. Total Shareholder Return |
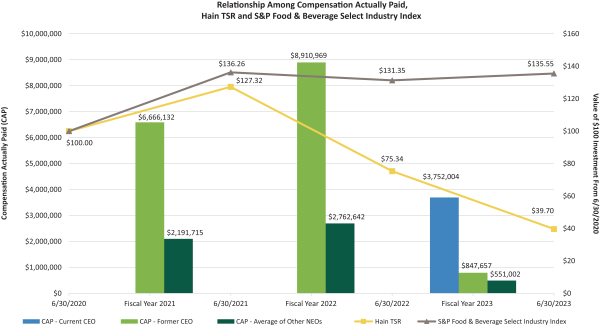
The following graph shows the relationship among (1) the CAP to our current CEO and our former CEO and the average of the CAP to our remaining NEOs in fiscal years 2021, 2022 and 2023, (2) the cumulative total shareholder return on our common stock and (3) the cumulative total shareholder return of the S&P Food & Beverage Select Industry Index, in the case of clauses (2) and (3) during the period from June 30, 2020 through June 30, 2023, assuming an investment of $100 as of the market close on June 30, 2020.
|
|
|
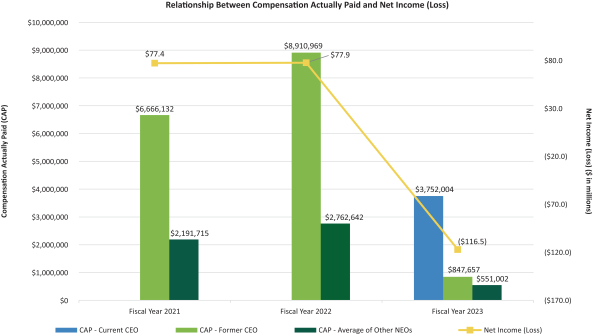
| Compensation Actually Paid vs. Net Income |
The following graph shows the relationship between (1) the CAP to our current CEO and our former CEO and the average of the CAP to our remaining NEOs and (2) net income (loss), in each case in fiscal years 2021, 2022 and 2023.
|
|
|
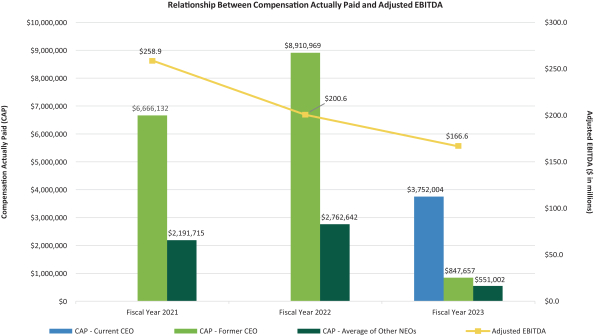
| Compensation Actually Paid vs. Company Selected Measure |
The following graph shows the relationship between (1) the CAP to our current CEO and our former CEO and the average of the CAP to our remaining NEOs and (2) Adjusted EBITDA, in each case in fiscal years 2021, 2022 and 2023.
|
|
|
| Total Shareholder Return Vs Peer Group |
The following graph shows the relationship among (1) the CAP to our current CEO and our former CEO and the average of the CAP to our remaining NEOs in fiscal years 2021, 2022 and 2023, (2) the cumulative total shareholder return on our common stock and (3) the cumulative total shareholder return of the S&P Food & Beverage Select Industry Index, in the case of clauses (2) and (3) during the period from June 30, 2020 through June 30, 2023, assuming an investment of $100 as of the market close on June 30, 2020.
|
|
|
| Tabular List, Table |
Following is a list of the most important performance measures used to link CAP for the NEOs to Company performance during fiscal year 2023:
| |
• |
|
Objectives, Goals, Strategies and Measures (OGSMs) |
| |
• |
|
Relative Total Shareholder Return |
| |
• |
|
Company Total Shareholder Return |
|
|
|
| Total Shareholder Return Amount |
$ 39.7
|
75.34
|
127.32
|
| Peer Group Total Shareholder Return Amount |
135.55
|
131.35
|
136.26
|
| Net Income (Loss) |
$ (116,537,000)
|
$ 77,873,000
|
$ 77,364,000
|
| Company Selected Measure Amount |
166,622,000
|
200,616,000
|
258,938,000
|
| Measure:: 1 |
|
|
|
| Pay vs Performance Disclosure |
|
|
|
| Name |
Adjusted EBITDA
|
|
|
| Non-GAAP Measure Description |
Represents the amount of Adjusted EBITDA reported by the Company for each applicable fiscal year. Adjusted EBITDA is the measure selected by the Company under SEC rules as the most important performance measure used to link CAP for the NEOs to Company performance during fiscal year 2023. Adjusted EBITDA is a non-GAAP financial measure. See Appendix A to this proxy statement for additional information on Adjusted EBITDA.
|
|
|
| Measure:: 2 |
|
|
|
| Pay vs Performance Disclosure |
|
|
|
| Name |
Net Sales
|
|
|
| Measure:: 3 |
|
|
|
| Pay vs Performance Disclosure |
|
|
|
| Name |
Objectives, Goals, Strategies and Measures (OGSMs)
|
|
|
| Measure:: 4 |
|
|
|
| Pay vs Performance Disclosure |
|
|
|
| Name |
Relative Total Shareholder Return
|
|
|
| Measure:: 5 |
|
|
|
| Pay vs Performance Disclosure |
|
|
|
| Name |
Company Total Shareholder Return
|
|
|
| Mark L Schiller [Member] |
|
|
|
| Pay vs Performance Disclosure |
|
|
|
| PEO Total Compensation Amount |
$ 7,741,908
|
$ 7,326,221
|
$ 2,886,066
|
| PEO Actually Paid Compensation Amount |
$ 847,657
|
8,910,969
|
6,666,132
|
| PEO Name |
Mark L. Schiller
|
|
|
| Wendy P Davidson [Member] |
|
|
|
| Pay vs Performance Disclosure |
|
|
|
| PEO Total Compensation Amount |
$ 4,765,456
|
|
|
| PEO Actually Paid Compensation Amount |
$ 3,752,004
|
|
|
| PEO Name |
Wendy P. Davidson
|
|
|
| PEO | Mark L Schiller [Member] | Deduction for amount reported in Stock Awards |
|
|
|
| Pay vs Performance Disclosure |
|
|
|
| Adjustment to Compensation, Amount |
$ (5,612,067)
|
(6,024,187)
|
|
| PEO | Mark L Schiller [Member] | Increase for fair value at fiscal year-end of equity awards granted during the fiscal year that remain outstanding |
|
|
|
| Pay vs Performance Disclosure |
|
|
|
| Adjustment to Compensation, Amount |
464,267
|
2,079,133
|
|
| PEO | Mark L Schiller [Member] | Increase/deduction for change in fair value during the fiscal year of equity awards granted in a prior fiscal year that remain outstanding |
|
|
|
| Pay vs Performance Disclosure |
|
|
|
| Adjustment to Compensation, Amount |
|
|
3,749,953
|
| PEO | Mark L Schiller [Member] | Increase/deduction for change in fair value during the fiscal year, as of the vesting date, of equity awards granted in a prior fiscal year that vested in the fiscal year |
|
|
|
| Pay vs Performance Disclosure |
|
|
|
| Adjustment to Compensation, Amount |
(55,420)
|
5,529,802
|
30,113
|
| PEO | Mark L Schiller [Member] | Deduction for fair value at prior fiscal year-end of equity awards granted in a prior fiscal year that failed to meet vesting conditions and were forfeited during the fiscal year |
|
|
|
| Pay vs Performance Disclosure |
|
|
|
| Adjustment to Compensation, Amount |
(1,691,031)
|
|
|
| PEO | Wendy P Davidson [Member] | Deduction for amount reported in Stock Awards |
|
|
|
| Pay vs Performance Disclosure |
|
|
|
| Adjustment to Compensation, Amount |
(3,066,503)
|
|
|
| PEO | Wendy P Davidson [Member] | Increase for fair value at fiscal year-end of equity awards granted during the fiscal year that remain outstanding |
|
|
|
| Pay vs Performance Disclosure |
|
|
|
| Adjustment to Compensation, Amount |
2,053,051
|
|
|
| Non-PEO NEO | Deduction for amount reported in Stock Awards |
|
|
|
| Pay vs Performance Disclosure |
|
|
|
| Adjustment to Compensation, Amount |
(915,950)
|
(2,108,881)
|
|
| Non-PEO NEO | Increase for fair value at fiscal year-end of equity awards granted during the fiscal year that remain outstanding |
|
|
|
| Pay vs Performance Disclosure |
|
|
|
| Adjustment to Compensation, Amount |
297,368
|
589,053
|
|
| Non-PEO NEO | Increase/deduction for change in fair value during the fiscal year of equity awards granted in a prior fiscal year that remain outstanding |
|
|
|
| Pay vs Performance Disclosure |
|
|
|
| Adjustment to Compensation, Amount |
(239,242)
|
(3,500)
|
1,145,052
|
| Non-PEO NEO | Increase/deduction for change in fair value during the fiscal year, as of the vesting date, of equity awards granted in a prior fiscal year that vested in the fiscal year |
|
|
|
| Pay vs Performance Disclosure |
|
|
|
| Adjustment to Compensation, Amount |
(28,615)
|
$ 1,654,365
|
$ 57,266
|
| Non-PEO NEO | Deduction for fair value at prior fiscal year-end of equity awards granted in a prior fiscal year that failed to meet vesting conditions and were forfeited during the fiscal year |
|
|
|
| Pay vs Performance Disclosure |
|
|
|
| Adjustment to Compensation, Amount |
$ (209,020)
|
|
|