Forget US REITs, China Real Estate ETF is Booming - ETF News And Commentary
December 19 2012 - 6:00AM
Zacks
Many investors have been focused in on the American property
boom during much of 2012, and for good reason. The space has been
surging higher as consumers become more optimistic, the jobs
picture slightly improves, and housing prices seemingly bounce off
of the bottom.
Top ETFs targeting the home construction industry have been
among the best performers in the unleveraged fund world this year,
easily crushing their broad benchmarks in the process. Meanwhile,
REIT ETFs have also been quite solid in the time period too (see
Small Cap Real Estate ETFs: Crushing the Competition).
These funds, which hold securities that buy or manage real
estate properties, are all up at least double digits on the year
and have been rebounding strongly these past few weeks after a
post-election slump. Yet despite how impressive these have been,
they have largely overshadowed an even better performer in the real
estate market here in 2012, the Chinese Real Estate ETF.
The Guggenheim China Real Estate ETF (TAO) has
actually been the best performer of the entire real estate group
during the trailing twelve month period, beating out the next
closest fund by a few basis points, and adding more than 56% in the
trailing twelve month period. This comes even in the face of broad
concerns over a China slowdown, demonstrating that even with these
risks demand for real estate investments in the greater China
region is quite strong (see China ETF Investing 101).
However, investors should note that the ETF is heavily focused
on Hong Kong as opposed to the Mainland, and that its expense ratio
of 0.65% is far higher than other, U.S. focused ETFs in the real
estate world. The volume isn’t too great either at about 70,000
shares a day, so total costs could be a bit higher than the stated
expense ratio due to a wide bid ask spread.
Still, the product does a great job of spreading out assets as
not a single security of the more than 45 in the basket takes up
more than 6% of assets. The product is also still trading at a
great valuation level as the PE is below 6, while the P/B is south
of 1.0, metrics that are far lower than what we see in similar
U.S.-centric REIT ETFs (see Is the Panic Over for Mortgage REIT
ETFs?).
In fact, IYR, an extremely popular REIT ETF
from iShares that zeroes in on U.S. REITs, has a PE above 40 and a
P/B above 3. While it does cost less than TAO with better volume,
one has to wonder if it is worth being more than five times more
richly valued from an earnings perspective.
Furthermore, despite the fact that the ETF targets Chinese
securities, many of the firms in the fund qualify as ordinary
income. This focus on this type of dividend ensures that no matter
what happens with the dividend tax debate in the U.S., TAO will not
be too negatively impacted, suggesting that investors can
definitely consider it a lower policy risk play, at least in terms
of U.S. policies (read No Dividend Tax Debate for these High Yield
ETFs).
Given this, TAO could continue to be an interesting, but often
overlooked real estate ETF play as we head into 2013. While it has
certainly surged this year, it is much more attractive from a
valuation perspective than its peers in the American space
suggesting that if investors want real estate ETF exposure, TAO
could be the way to go in the New Year.
Want the latest recommendations from Zacks Investment Research?
Today, you can download 7 Best Stocks for the Next 30
Days. Click to get this free report >>
Follow @Eric Dutram on Twitter
ISHARS-DJ REAL (IYR): ETF Research Reports
GUGG-CHINA RE (TAO): ETF Research Reports
VIPERS-REIT (VNQ): ETF Research Reports
To read this article on Zacks.com click here.
Zacks Investment Research
Want the latest recommendations from Zacks Investment Research?
Today, you can download 7 Best Stocks for the Next 30 Days. Click
to get this free report
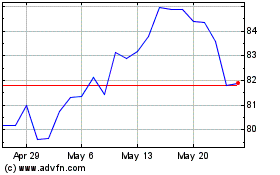
Vanguard Real Estate ETF (AMEX:VNQ)
Historical Stock Chart
From Dec 2024 to Jan 2025

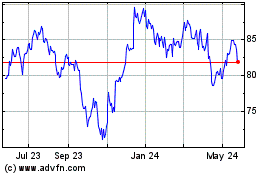
Vanguard Real Estate ETF (AMEX:VNQ)
Historical Stock Chart
From Jan 2024 to Jan 2025
