Overall, 2012 has been a good one so far for the ETF industry,
particularly the third quarter where some funds witnessed
tremendous asset accumulation. In fact, the ETF industry currently
has over $1.3 trillion in assets, a figure that is roughly 34% more
than at the end of the third quarter in 2011 (as per ETF Industry
Association).
Also, the top 10 ETFs (in terms of asset accumulation for Q3)
witnessed a combined inflow of $27.65 billion which is an
astounding 95% increase from the second quarter of
this fiscal year, where the combined inflow for the top 10 funds
was just $14.13 billion.
This is a clear indication of restored confidence of investors
in the riskier asset segments, especially as dollars have come back
into high yield securities, American stock funds, and emerging
market stocks.
Moreover if the trend continues it could go a long way in
dismissing the International Monetary Fund’s (IMF) lackluster
prediction for global economic growth in its latest forecast which
could pose serious headwinds for the markets as we enter the final
quarter.
As you can see in the chart below, investors saw a number of
ETFs pull in over a billion dollars in assets during the quarter.
Furthermore, many of the funds are targeting similar segments,
although we continue to see some of the ‘safer’ bond products in
the top inflows once again for the third quarter:
Table 1 (Top 10 asset accumulating ETFs for
Q3)
|
ETF
|
Category
|
Inflow for Q3
|
Q3 Returns
|
|
SPY
|
Broad Market
|
$9,077.99 million
|
6.31%
|
|
VWO
|
Emerging Market
|
$4,024.44 million
|
5.78%
|
|
IWM
|
Small Caps
|
$3,061.42 million
|
5.30%
|
|
GLD
|
Commodities- Gold
|
$2,408.75 million
|
11.00%
|
|
HYG
|
Junk Bonds
|
$2,141.01 million
|
4.01%
|
|
IJH
|
Mid Caps
|
$1,616.14 million
|
5.41%
|
|
JNK
|
Junk Bonds
|
$1,425.67 million
|
4.30%
|
|
XLF
|
Financials
|
$1,422.98 million
|
6.89%
|
|
VNQ
|
REIT
|
$1,356.72 million
|
0.08%
|
|
OEF
|
Large Caps
|
$1,117.81 million
|
6.98%
|
Data as of 30th September, 2012 (From
indexuniverse.com)
As is evident from the table above, most of these ETFs are broad
market ETFs (including small and mid cap funds), high yield bond
ETFs and a commodity ETF — definitely riskier investment avenues,
reversing the trend from Q2 when safety was the name of the
game.
Behind some of the biggest gainers in
assets
The ultra low interest rate policy has also led the income
starved investors to place their bets on higher yielding
‘junk’ bond ETFs rather than lower yielding
investment grade ones at the expense of credit quality.
JNK and HYG, two such high
yielding ‘junk’ bond ETFs, witnessed a combined inflow of almost
$3.57 billion for the quarter.
Surprisingly, in the previous quarter JNK was one of the biggest
losers of assets leaking around $1.2 billion. In fact, the biggest
losers of assets in the third quarter are investment grade Treasury
bond ETFs. SHY, IEI, IEF and BIL - which are all in the government
bond space, have lost close to $4.52 billion cumulative in the
period. This goes to show how fed up income seeking investors have
become of the low yield policy followed by the Fed (read Long Term
Treasury ETFs: Ultimate QE3 Play?).
As was expected, the oldest Gold ETF, the SPDR Gold
Trust (GLD) witnessed a substantial inflow in its asset
base in the third quarter, amidst the build-up to the announcement
of a QE3 which was a very tricky one for the markets.
There had been much speculation in the commodities and bond
market over the likes of the monetary easing. Finally, on September
13th the Federal Reserve announced the launch of the
much anticipated open ended bond buying program. As a result
commodities (especially gold) rallied across the board.
However, the trend for GLD’s interest is expected to continue in
the near term especially considering the fact that just one week
into the fourth quarter, GLD has already amassed $1.05 billion in
the first seven days. GLD has returned an impressive 11% for the
third quarter (see Protect Against QE with these Precious Metal
ETFs).
Meanwhile, everybody’s favorite, SPY, has been leading the asset
accumulation race with an inflow of close to $9.08 billion. It was
one of the largest asset accumulators for Q2 as well. With an
already large asset base of $119.35 billion and an average daily
volume of 144 million shares, SPY still remains the most popular
option to play the large cap equity space.
Investors also have shown their appetite for broad market funds
from the mid and small cap space as demand for risk comes back
among investors. IWM, IJH and OEF all have low
expense ratios ranging from 20-23 basis points indicating that
expense ratio does play an important role in determining investment
decisions.
Also, these products have a fairly large average daily volume
with almost a million shares being traded daily for IJH and OEF and
47 million shares daily for IWM (see The Truth about Low Volume
ETFs).
Continuing the trend from the second quarter, Vanguard
MSCI Emerging Markets ETF (VWO) was one of the largest
accumulators this quarter as well. In fact the asset growth rate
for this product has been phenomenal – at 303% from the previous
quarter.
Thanks to its low expense ratio (0.20%) and bid ask spread, VWO
has comfortably beaten its emerging market counterpart EEM (expense
ratio of 0.67%) despite tracking the same indexes. EEM has added
about $945 million for the third quarter (read Track Market Gurus
with these ETFs).
XLF is pretty much the most cost-effective and
popular option to play large cap equity space from the financial
sector (read Inside the Top Zacks Ranked Financial ETF). In fact
the sector has been pretty much leading the market rally after a
disastrous performance last fiscal year. XLF has managed to
accumulate $1.4 billion in its asset base for the quarter and has
returned close to 7% in the time frame.
Want the latest recommendations from Zacks Investment Research?
Today, you can download 7 Best Stocks for the Next 30
Days. Click to get this free report >>
SPDR-GOLD TRUST (GLD): ETF Research Reports
ISHARS-IBX HYCB (HYG): ETF Research Reports
ISHARES TR-2000 (IWM): ETF Research Reports
SPDR-SP 500 TR (SPY): ETF Research Reports
VIPERS-M EM MKT (VWO): ETF Research Reports
To read this article on Zacks.com click here.
Zacks Investment Research
Want the latest recommendations from Zacks Investment Research?
Today, you can download 7 Best Stocks for the Next 30 Days. Click
to get this free report
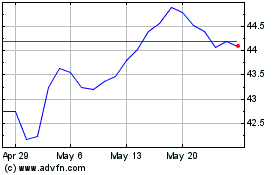
Vanguard FTSE Emerging M... (AMEX:VWO)
Historical Stock Chart
From Feb 2025 to Mar 2025

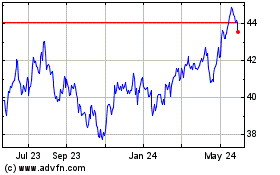
Vanguard FTSE Emerging M... (AMEX:VWO)
Historical Stock Chart
From Mar 2024 to Mar 2025
