FET Price Under Pressure: RSI Flags Extended Bearish Move Toward $0.966
October 25 2024 - 9:30PM
NEWSBTC
FET is facing strong downward pressure as bearish signals take
hold, with the Relative Strength Index (RSI) suggesting further
weakness could be on the horizon. Recent declines have pushed FET’s
price closer to key support levels, and the RSI’s current reading
hints at a continuation of the bearish trend. With a potential drop
toward the $0.966 target, investors are left wondering if FET can
find a bottom or if additional losses lie ahead. This article
analyzes the recent downward pressure on FET’s price, with a
particular focus on the pessimistic signals indicated by the RSI.
By examining the current market conditions, key support and
resistance levels, and the RSI’s implications, we’ll explore
whether the token will likely continue its decline toward the
$0.966 target or if a potential reversal could be on the way.
What The RSI Reveals For FET On the 4-hour chart, FET has
demonstrated pronounced bearish momentum, slipping below the
100-day Simple Moving Average (SMA) as it approaches the $0.966
mark. This movement below the 100-day SMA signals that negative
forces are currently outweighing bullish attempts at price
recovery, possibly opening the door to further declines. An
analysis of the 4-hour chart reveals that the Relative Strength
Index (RSI) has now declined to the 34% level following an earlier
attempt to rally that stalled at 46%. An RSI near 30% often
suggests a potential reversal could be imminent. However, in this
context, it may also signal the continuation of a bearish path
unless buying interest returns to support a rebound. Related
Reading: FET Teeters At Trendline: Will A Breakout Fuel A Run To
$1.86? Meanwhile, on the daily chart, FET is displaying notable
pessimistic movement as it tries to fall below the 100-day SMA.
This downturn highlights rising selling pressure and negative
market sentiment, which collectively heightens the probability of
the asset dropping below the SMA and heading toward the $0.966
mark. A successful breach of the 100-day SMA could signal
additional declines, pushing the price down to this critical
support level. Finally, the 1-day RSI shows that negative pressure
on FET is intensifying as the signal line has recently dropped
below 50%, now settling at 39%. As the RSI remains in this lower
range, it suggests that sellers are gaining dominance, potentially
paving the way for further drops unless buying momentum can return
to shift the sentiment. Key Support Levels: Can $0.966 Hold Against
The Bears? As FET’s price remains under downward pressure, the
$0.966 mark stands out as a crucial support level. If the price
breaks below this threshold, it may signal a strong correction,
possibly resulting in more decrease toward the $0.459 level and
beyond. Related Reading: FET On Fire With 27% Rally, Analysts See
Bigger Gains Ahead Conversely, if the token manages to hold its
position above $0.966, it could indicate a potential reversal,
enabling bulls to reclaim some control in the market and driving
the price higher toward the $1.86 resistance level and beyond.
Featured image from Medium, chart from Tradingview.com
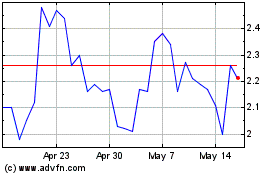
Fetch (COIN:FETUSD)
Historical Stock Chart
From Dec 2024 to Jan 2025

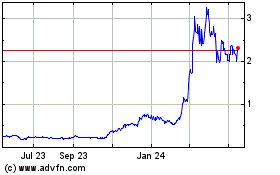
Fetch (COIN:FETUSD)
Historical Stock Chart
From Jan 2024 to Jan 2025
