Australian Dollar Rises Amid Risk Appetite
April 28 2024 - 9:48PM
RTTF2
The Australian dollar strengthened against other major
currencies in the Asian session on Monday amid risk appetite, as
traders reacted to upbeat U.S. inflation data and a drop in
treasury yields, which may have helped mitigate any negative
response to the inflation data. They are also cautious and indulge
in some bargain hunting ahead of the U.S. Fed's monetary policy
announcement in two days.
Markets also anticipate that the Reserve Bank of Australia is
likely to implement three cash rate hikes throughout 2024.
Gains in technology and financial stocks also led to the upturn
of investor sentiment.
Crude oil prices edged higher on optimism about the outlook for
oil demand and concerns about supply. West Texas Intermediate Crude
oil futures for June ended higher by $0.28 or 0.34 percent at
$83.85 a barrel. WTI crude futures gained 0.85 percent in the
week.
In the Asian trading now, the Australian dollar rose to a
11-year high of 104.94 against the yen, nearly a 1-year high of
1.1014 against the NZ dollar and nearly a 4-month high of 1.6291
against the euro, from Friday's closing quotes of 103.41, 1.0997
and 1.6361, respectively. If the aussie extends its uptrend, it is
likely to find resistance around 105.00 against the yen, 1.11
against the kiwi and 1.61 against the euro.
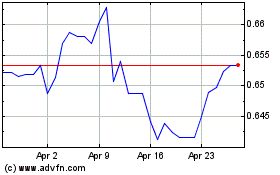
Against the U.S. and the Canadian dollars, the aussie advanced
to near 3-week highs of 0.6587 and 0.8980 from last week's closing
quotes of 0.6533 and 0.8929, respectively. On the upside, 0.67
against the greenback and 0.90 against the loonie are seen as the
next resistance levels for the aussie.
Looking ahead, Eurozone business and consumer sentiment indices
for April are due to be released at 5:00 am ET in the European
session.
In the New York session, U.S. Dallas Fed Manufacturing business
Index for April is slated for release.
AUD vs US Dollar (FX:AUDUSD)
Forex Chart
From Nov 2024 to Dec 2024

AUD vs US Dollar (FX:AUDUSD)
Forex Chart
From Dec 2023 to Dec 2024
