| Reconciliation of Non-GAAP Financial
Measures – Profitability and TCE
26 Dollars in thousands
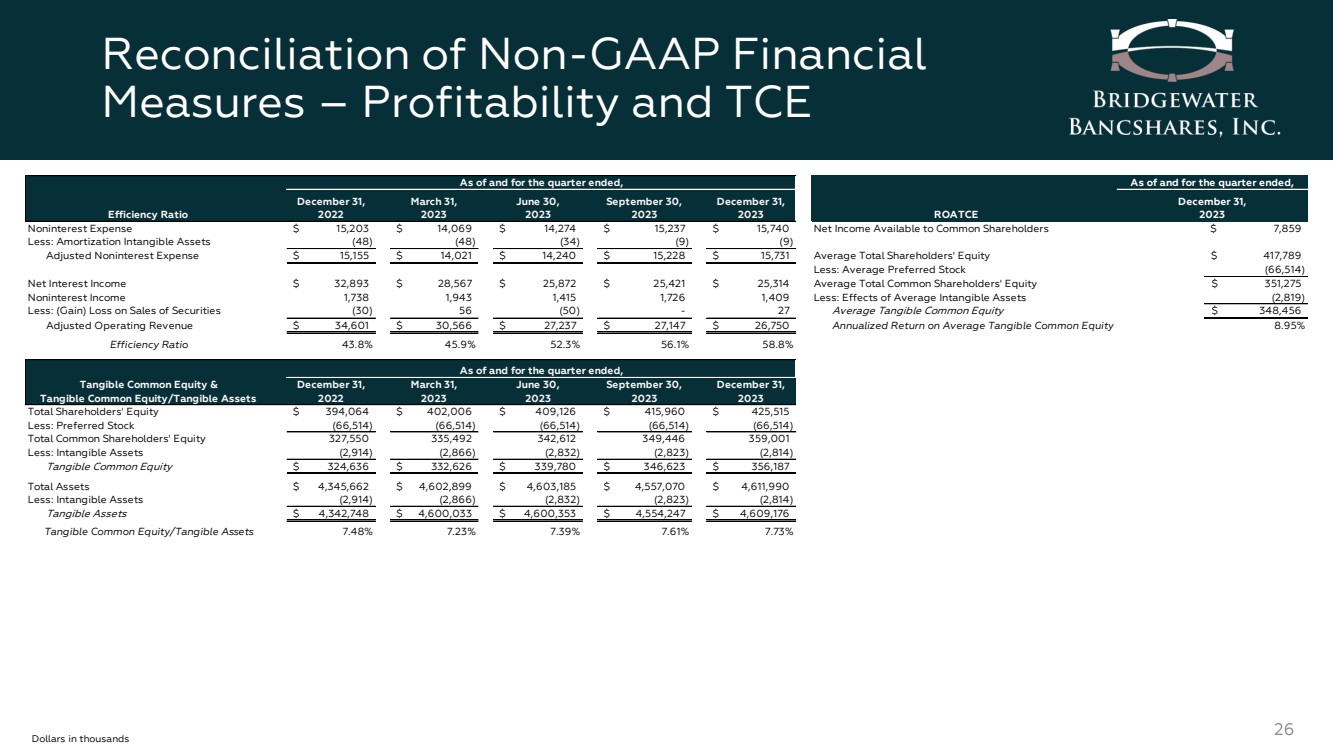
Efficiency Ratio
December 31,
2022
March 31,
2023
June 30,
2023
September 30,
2023
December 31,
2023
Noninterest Expense $ 15,203 $ 14,069 $ 14,274 $ 15,237 $ 15,740 Net Income Available to Common Shareholders
Less: Amortization Intangible Assets (48) (48) (34) (9) (9)
Adjusted Noninterest Expense $ 15,155 $ 14,021 $ 14,240 $ 15,228 $ 15,731 Average Total Shareholders' Equity
Less: Average Preferred Stock
Net Interest Income $ 32,893 $ 28,567 $ 25,872 $ 25,421 $ 25,314 Average Total Common Shareholders' Equity
Noninterest Income 1,738 1,943 1,415 1,726 1,409 Less: Effects of Average Intangible Assets
Less: (Gain) Loss on Sales of Securities (30) 56 (50) - 2 7 Average Tangible Common Equity
Adjusted Operating Revenue $ 34,601 $ 30,566 $ 27,237 $ 27,147 $ 26,750 Annualized Return on Average Tangible Common Equity
Efficiency Ratio 43.8% 45.9% 52.3% 56.1% 58.8%
Tangible Common Equity &
Tangible Common Equity/Tangible Assets
December 31,
2022
March 31,
2023
June 30,
2023
September 30,
2023
December 31,
2023
Total Shareholders' Equity $ 394,064 $ 402,006 $ 409,126 $ 415,960 $ 425,515
Less: Preferred Stock (66,514) (66,514) (66,514) (66,514) (66,514)
Total Common Shareholders' Equity 327,550 335,492 342,612 349,446 359,001
Less: Intangible Assets (2,914) (2,866) (2,832) (2,823) (2,814)
Tangible Common Equity $ 324,636 $ 332,626 $ 339,780 $ 346,623 $ 356,187
Total Assets $ 4,345,662 $ 4,602,899 $ 4,603,185 $ 4,557,070 $ 4,611,990
Less: Intangible Assets (2,914) (2,866) (2,832) (2,823) (2,814)
Tangible Assets $ 4,342,748 $ 4,600,033 $ 4,600,353 $ 4,554,247 $ 4,609,176
Tangible Common Equity/Tangible Assets 7.48% 7.23% 7.39% 7.61% 7.73%
As of and for the quarter ended,
As of and for the quarter ended,
ROATCE
As of and for the quarter ended,
December 31,
2023
$ 7,859
$ 417,789
(66,514)
$ 351,275
(2,819)
$ 348,456
8.95% |