false
0000763907
0000763907
2024-05-09
2024-05-09
iso4217:USD
xbrli:shares
iso4217:USD
xbrli:shares
UNITED STATES
SECURITIES AND
EXCHANGE COMMISSION
Washington, D.C.
20549
FORM 8-K
CURRENT REPORT
PURSUANT TO SECTION 13 OR 15(d) OF THE
SECURITIES EXCHANGE ACT OF 1934
Date of Report (Date of earliest event reported): May 9, 2024
First United Corporation
(Exact name of registrant as specified in
its charter)
| Maryland |
|
0-14237 |
|
52-1380770 |
| (State or other jurisdiction of |
|
(Commission file number) |
|
(IRS Employer |
| incorporation or organization) |
|
|
|
Identification No.) |
19 South Second Street, Oakland, Maryland 21550
(Address of principal
executive offices) (Zip Code)
(301) 334-9471
(Registrant’s telephone number, including area code)
N/A
(Former Name or Former
Address, if Changed Since Last Report)
Check the appropriate box below if the Form 8-K filing is intended
to simultaneously satisfy the filing obligations of the registrant under any of the following provisions:
| ¨ |
Written communications pursuant to Rule 425 under the Securities Act (17 CFR 230.425) |
| ¨ |
Soliciting material pursuant to Rule 14a-12 under the Exchange Act (17 CFR 240.14a-12) |
| ¨ |
Pre-commencement communications pursuant to Rule 14d-2(b) under the Exchange Act (17 CFR 240.14d-2(b)) |
| ¨ |
Pre-commencement communications pursuant to Rule 13e-4(c) under the Exchange Act (17 CFR 240.13e-4(c)) |
Securities registered pursuant
to Section 12(b) of the Act:
| Title of each class |
Trading
Symbol(s) |
Name of each exchange on which registered |
| Common stock |
FUNC |
Nasdaq Stock Market |
Indicate by check mark whether the registrant is an emerging
growth company as defined in Rule 405 of the Securities Act of 1933 (17 CFR §230.405) or Rule 12b-2 of the Securities Exchange
Act of 1934 (17 CFR §240.12b-2).
Emerging growth company
¨
If an emerging growth company, indicate by check mark if the
registrant has elected not to use the extended transition period for complying with any new or revised financial accounting standards
provided pursuant to Section 13(a) of the Exchange Act. ¨
INFORMATION TO BE INCLUDED IN THE REPORT
Item 7.01. Regulation FD Disclosure.
On May 9, 2024, First United Corporation (the “Company”)
will hold its Annual Meeting of Shareholders at which information about the Company will be presented, including certain financial data
and performance trends for the year ended December 31, 2023 and the first quarter of 2024. A copy of the presentation is furnished herewith
as Exhibit 99.1.
The information contained in this Item 7.01 and
in Exhibit 99.1 shall not be deemed “filed” for purposes of Section 18 of the Securities Exchange Act of 1934, as amended
(the “Exchange Act”), or incorporated by reference in any filing under the Securities Act of 1933, as amended, or the Exchange
Act, except as shall be expressly set forth by specific reference in such a filing.
Item 9.01. Financial Statements and Exhibits.
The exhibits filed or furnished with this report
are listed in the following Exhibit Index:
SIGNATURES
Pursuant
to the requirements of the Securities Exchange Act of 1934, the
registrant has duly caused this report to be signed on its behalf by the undersigned hereunto duly authorized.
| |
FIRST UNITED CORPORATION |
| |
|
|
| |
|
|
| Dated: May 9, 2024 |
By: |
/s/ Tonya K. Sturm |
| |
|
Tonya K. Sturm |
| |
|
Senior Vice President & CFO |
Exhibit 99.1
FIRST UNITED
CORPORATION
2024 Annual Meeting
of Shareholders’ Presentation
May 9, 2024
Slide 1: Annual Shareholders’
Meeting
BRIAN BOAL
Slide 2: Welcome
and Introduction
CARISSA RODEHEAVER
Slide 3: Management
Presentation – Carissa Rodeheaver
Thank
you, Brian. Good morning fellow shareholders, and welcome to First United’s 2024 Shareholders’ Meeting. I appreciate your
attendance and your support over the last year.
Slide 4: Forward
Looking Statements
Before
we begin our presentation, I would like to direct your attention to the Forward-Looking statements disclosure, which is displayed
on the screen for your review.
Slide 5: Banking
Industry Disruption
2023
was a year full of impactful industry, economic and regulatory events. The first half of the year was the culmination of a stream of
steady and significant interest rate hikes as the Federal Reserve worked to fight inflation, raising rates 5.25% from March 2022
to July 2023. As we discussed at our meeting last year, the rising rates, deposit concentrations in technology and cryptocurrency,
lack of liquidity and interest rate risk mismatches led to the closure of two of the nation’s largest regional banks in March 2023.
These closures caused heightened fear regarding the safety of deposits in the banking system. To calm these fears, the FDIC stepped in
and insured 100% of the deposits at the failed banks and created the Bank Term Funding Program to provide additional access to liquidity
for all qualifying banks. More bank disruption followed over the next few weeks as a couple of other banks were sold due to their impending
problems. These events and the negative media coverage of the banking industry fueled customer fears and uncertainty well into 2023.
Slide 6: Precautionary
Actions
Quickly
following these industry events in the first quarter of 2023 and the resulting liquidity concerns for the industry, your management team
took precautionary actions and increased liquidity on our balance sheet. Pricing challenges and the added liquidity resulted in net interest
margin compression. However, when compared to peers, First United performed admirably in the face of these difficulties, and we ended
2023 with a net interest margin of 3.26%. This represented a decrease of only 0.30% in 2023. Our team remained vigilant and nimble throughout
the year, focused on providing peace of mind, a safe and secure banking option, and the stability of a 123-year-old trusted community
bank.
Why
do I bring this up again? Because these events were impactful on the industry and our customers and made it necessary for us to shift
our strategy and take precautionary actions to effectively manage through the uncertainty in the markets. As a result of the rising rates,
deposit competition, utilization of FDIC insured funding products and the shift to interest bearing deposits, we experienced a higher
cost of funding. The concern and fear caused by the bank failures led to our bank carrying higher levels of cash throughout the year.
While this was prudent financial management, liquidity comes at a cost. We incurred costs on borrowings and earned lower returns on the
cash than we could have earned on higher yielding loans both fueling the net interest margin compression.
On
the loan front, the Bank continued to experience solid loan demand. However, given concerns over funding and credit quality, we became
more selective in our loan portfolio and held to our pricing discipline to offset the higher funding costs and to prevent too much pressure
on our net interest margin.
Slide 7: Operational
Costs, Technology and Strategic Actions
On
the expense side the battle for talent continued, resulting in higher wages to retain our talented and experienced associates. We also
experienced higher health insurance costs related to our employee benefit plans. Cybersecurity and protection of our customers remained
a high priority as we continued to invest in technology and additional resources to prevent fraud. Even with these enhanced measures,
fraud expense still escalated in 2023 for the industry as a whole and First United was no exception. In addition to fraud protection,
we continued our strategic efforts to provide a better digital experience to our customers through enhanced products and technology options
and to automate our operations and processes to provide a more efficient and seamless experience for our customers.
As
customers’ habits and preferences continue to shift to digital banking, utilizing mobile and online banking channels, we have seen
diminishing usage of the traditional community office. As a result, we made the decision during the fourth quarter of 2023 to consolidate
our retail branch network and announced the closure of four offices throughout our regions. This resulted in escalation of depreciation
and lease expenses during the fourth quarter of 2023 and the first quarter of 2024. We experienced minimal account closures as a result
but expect this to save approximately $1.0 million in expense annually.
We
also performed a strategic balance sheet restructuring in December 2023, selling longer, low yielding securities at a loss and utilizing
the proceeds from the sale to fund higher yielding loans. We recognized approximately $3.7 million in after-tax, non-core losses in the
fourth quarter due to execution of this strategy, but we believe we will reap the rewards in future earnings.
Slide 8: First
United Corporation Remains Strong
The
combination of a higher cost of funds, a contracting net interest margin, higher levels of liquidity, maintaining our allowance for potential
credit quality issues and the higher expenses and loss associated with the strategic branch closures and securities sale resulted in
lower earnings for 2023. But, despite these and the industry and economic challenges, our financial performance still compared favorably
to our peers and your Company remains strong. We maintain elevated levels of liquidity, capital ratios in excess of regulatory requirements,
a balanced interest rate risk position, diversified deposit and loan portfolios and we have continued to grow our diverse and expansive
customer base, all leading to stable earnings year after year. The Board and management team have established a foundation of risk oversight
and risk management that serve us well during periods of economic and market volatility like we have experienced over the past couple
of years.
Now
let’s turn our attention to the financial results of 2023. Tonya Sturm, our Senior Vice President and Chief Financial Officer,
will review the highlights of 2023 and the first quarter of 2024. We will then review our stock performance, our strong capital position,
and our risk management practices. Finally, I will share our perspective on what lies ahead and the strategic direction of First
United Corporation. I will now turn it over to Tonya.
TONYA STURM
Slide
9: Management Presentation - Tonya Sturm
Thank you, Carissa
and good morning shareholders.
Slide 10: 2023
Financial Highlights
Our
balance sheet grew to $1.91 billion at December 31, 2023. Total assets increased by $57.7 million, or 3.1%, as compared to December 31,
2022, driven by strong commercial loan growth, offset by a reduction in cash and investment securities. For the year ended December 31,
2023, we reported non-GAAP net income of $18.8 million, exclusive of non-core expenses of $3.7 million, net of tax. This resulted in
non-GAAP diluted earnings per share of $2.81. Including these non-core expenses, net income was $15.1 million or $2.25 diluted earnings
per share. The non-core, after-tax expenses included $0.4 million in branch closure expenses and $3.3 million in securities losses related
to the balance sheet restructure. Net income was driven by strong loan growth, tight margin control and steady wealth and debit card
income offset by higher expenses as compared to 2022.
Net
interest income on a non-GAAP, fully tax equivalent basis decreased by $1.0 million in 2023 as compared to 2022 driven by an increase
in interest expense related to the competitive deposit environment and the increased liquidity that Carissa mentioned earlier. We were
disciplined in our loan pricing to offset the increased interest expense and were able to achieve a 3.26% net interest margin for the
year, a decline of only 30 basis points compared to where we ended 2022.
Increased
expenses for the twelve months ended December 31, 2023 resulted from higher salaries and employee benefits related to new hires,
the competitive environment for labor and normal merit increases. We also experienced higher health insurance costs associated with unusually
high insurance claims. Occupancy and equipment expense increased due primarily to accelerated depreciation and lease termination expenses
associated with the announced branch closures that occurred on February 29, 2024. During the year, we implemented new technology
to improve the customer experience and to create process efficiencies. Fraud expenses escalated in 2023 resulting in the implementation
of new technology to protect our customers and the Bank from cybersecurity and fraud losses. Due to the decline in net interest income
and increased expenses, we experienced an increase in the efficiency ratio as compared to 2022, ending 2023 at 65.12% on a non-GAAP basis.
Provision
for credit losses increased by $2.2 million when compared to prior year due to a credit in the allowance for 2022, increased loan growth
during 2023 and qualitative factors associated with the implementation of the new accounting standard for the allowance for credit losses.
Overall, our delinquency and loan charge-offs remained low and asset quality strong throughout 2023. Net losses on available-for-sale
(“AFS”) securities increased by $4.2 million, when compared to prior year due to the sale of securities in the fourth quarter
of 2023.
Slide 11: Diversified
Fee Income
Our
wealth department continued to grow in 2023 with trust and brokerage assets under management eclipsing $1.5 billion and accounting for
50% of the non-interest income mix. Our diversified revenue stream, not tied directly to interest rates, is especially important as we
see volatility in the net interest margin. Debit card and service charge income together accounted for another 39% of our non-interest
income mix.
Slide 12: First
Quarter 2024 Financial Performance
Earnings
for the first quarter of 2024, released on April 23, 2024, continued a steady trajectory. We reported non-GAAP earnings of $4.1
million, diluted earnings per share of $0.62, a 0.85% annualized return on average assets and 10.11% annualized return on average tangible
common equity. Our net interest income remained stable, offset by the reversal of income on two loans that were moved to non-accrual
status during the quarter. We also recorded a partial charge-off on one of these loans of approximately $0.3 million. This resulted in
additional provision expense for the quarter. Both were commercial and industrial loans and, we believe they are appropriately marked
at this time and are not indicative of other asset quality issues in the loan portfolio. The allowance for credit losses to loans outstanding
was also stable as compared to the fourth quarter of 2023 landing at 1.27% on March 31, 2024. The net interest margin for the quarter
was impacted by approximately nine basis points due to the income reversal, ending the quarter at 3.12%.
Assets
increased by only $7.1 million as loan growth slowed compared to 2023, but we are seeing positive signs for future growth as our loan
pipelines have increased during the quarter. We ended the quarter with higher levels of cash on balance sheet, generated from a Bank
Term Funding Program loan of $40.0 million. This strategic move was in support of our desire to maintain higher levels of cash given
the continued volatility in our economic, regulatory and political environments.
Our
fee income continued to be a strong contributor to earnings during the first quarter, driven by our trust and brokerage services. Expenses
leveled despite approximately $0.6 million in branch closure expenses related to the four branches we consolidated in February 2024.
Our efficiency ratio was also stable as compared to year-end, closing the quarter at 65.71% on a non-GAAP basis. Management continues
to be very focused on expenses and reducing this ratio.
Slide 13: Generating
Reliable Growth
To
get a better look at core income before expense associated with the allowance for credit losses, we review our non-GAAP pre-provision
net revenue. This amount represents our net income before tax, adjusted for any one-time items. In addition, we adjust the net income
for any provision expense. After these adjustments, core income for 2023 was $25.9 million, representing a 20% decrease over 2022. As
discussed earlier, the decrease was primarily related to the shrinking net interest margin and higher expenses incurred during the year.
The first quarter of 2024 shows a stable non-GAAP pre-provision net revenue of $6.4 million even as we continue to maintain higher cash
levels and the challenging economic and financial landscape. The non-GAAP diluted earnings per share represents similar results to the
pre-provision net revenue performance.
Our
loan portfolio grew by 10% in 2023 when compared to 2022. This robust loan growth was driven by strong commercial production. Mortgage
production was impacted as the higher interest rate environment stifled refinancing activity. As we entered 2024, we felt the
seasonality of slower loan growth of $5.7 million during the first quarter. However, both our commercial and mortgage pipelines were
solid as we moved into the second quarter of this year.
As
has been mentioned repeatedly today, the fierce competition for deposits, higher inflationary spending by both consumers and businesses
and our desire to control deposit expense resulted in minimal deposit growth in 2023. We supplemented our retail deposits during the
year with brokered deposits of which $30.0 million was outstanding at December 31, 2023. While deposit outflows have slowed, at
the end of 2023, we created a team focused fully on maintaining our deposit base and identifying opportunities to grow low-cost deposits
in our market areas.
Slide 14: Solid
Profitability
As
mentioned earlier, our core non-GAAP return on average assets was 0.96% and we provided our shareholders a 12.92% non-GAAP return on
average tangible common equity in 2023. Both ratios declined as compared to 2022 due to the net interest margin compression and the higher
expenses incurred during the year. Net income was fairly stable in the first quarter of 2024 when compared to the linked quarter in 2023
as we saw a leveling of the net interest margin and stable expenses. We continued to maintain higher cash liquidity and increased our
credit loss provision to accommodate the slight increase in non-performing assets. Fee income from our wealth department was strong,
offsetting the lower than anticipated net interest income. The result was a slightly lower non-GAAP return on average assets and return
on average tangible common equity of 0.85% and 10.11%, respectively. While we believe the higher costs for deposits will continue throughout
2024, we are actively managing our loan pricing and operating expenses.
At
this time, I will turn it back over to Carissa.
Slide 15: Total
Shareholder Return
Thank
you, Tonya. Throughout 2023, your board of directors maintained the quarterly dividend at $0.20 per share. While banking stocks were
significantly impacted by the disruption in the markets in 2023, our total shareholder return as of April 30, 2024, which includes
both share price appreciation and reinvested dividends, outperformed the S&P Bank Index and our 2023 proxy peers over the one-, three-
and five-year periods as shown in this chart. Our total shareholder return, including price changes and reinvested cash dividends, was
58.11% for one-year, 44.67% for three-years and 56.65% over five-years. Based on a closing price of $22.59 per share on April 30,
2024, the current dividend annualized results in a dividend yield of 3.54%.
Slide 16: Capital
Management
During
these volatile times in our economy, we continue to maintain our belief that risk drives strategy. Underlying all our strategic priorities
is strong enterprise risk management, overseen by our qualified and capable board of directors. Our approach to capital is conservative.
As can be seen on this slide, we continue to maintain strong capital ratios, well in excess of the regulatory well-capitalized levels,
in order to protect against the risks posed by the current economic, regulatory and political environments and those that are inherent
in our industry.
Slide 17: Tangible
Capital Positions
As
a result of our prudent capital management and positive earnings, as of March 31, 2024, our tangible book value per share has grown
by 34% over the last five years and our tangible common equity ratio remains sound at 8.07%, despite the impact of rising interest rates
and the resulting unrealized losses included in tangible equity. This strong capital position and increasing profitability has allowed
us to successfully raise the dividend for our shareholders. When the markets and our operating environment settle, we will once again
explore other investments of our capital to increase shareholder value.
Slide 18: Prudent
Capital and Risk Management
Risk
management has and always will underly all our strategic priorities. Our management team has actively managed the balance sheet concentrations,
diversification and credit quality of our loan, deposit and investment portfolios, monitored our interest rate sensitivity and maintained
a strong liquidity position. We conservatively added to our allowance for credit losses to protect against the impact of the rising rate
environment on our borrowers. Monitoring fraud and cybersecurity risk are always top-of-mind as we are committed to providing a safe
and secure banking platform for our customers, particularly in light of increased usage of technology. We actively stress test each of
these areas of risk and utilize independent third parties to test and verify our systems and controls. This was more important than ever
in 2023 to ease the minds of our depositors given the liquidity events and bank failures and sales that occurred early in the year. I
hope that you take comfort in knowing that our management team and Board take enterprise risk management very seriously and it is a huge
component of our culture.
Slide 19: Strategic
Pillars & Key Objectives
As
we moved into 2024, we recognized that it was important for us to focus on what we do best. Providing core banking and wealth management
services and financial products to our consumer and business customers. For this reason, our strategic plans and action items are a continuation
of what we started in 2023 and that were somewhat disrupted given the market events early last year. Hiring and retaining knowledgeable
and customer centric associates is always at the forefront of each of our plans. We know that as a community bank, our people will always
be our differentiator and we will continue to hire and retain passionate, diverse talent who will foster collaboration and communication.
We will leverage technology to enhance efficiency and user experience, aiming to broaden the utilization of our products and services.
We also aim to strengthen our relationships with community-oriented business owners and broaden our outreach initiatives to increase
our non-interest income as a percentage of overall revenue, reducing our reliance on the net interest margin. Along with continued focus
on resource optimization, we will look to enhance market share and execute tactics to optimize our geographic presence.
Despite
the everchanging circumstances we face, First United remains steadfast in our dedication to helping individuals and businesses navigate
times of uncertainty. By continually fostering strong relationships and offering a comprehensive range of financial services for all
aspects of financial well-being, we will work to support our customers in achieving their financial goals and objectives. We will continue
to review our real estate and will work to optimize our retail network and to further penetrate our existing markets and expand into
new markets. We are continuing to engage with new and existing investors to diversify the shareholder mix with the hopes of providing
additional liquidity to our stock. And, we are always exploring all of our strategic options to grow our franchise and provide more value
to you, our shareholders.
Slide 20: Investor
Relations
Your
senior management team and Board are routinely engaging with shareholders and prospective investors, as well as continuing our involvement
in our local communities. If you have any questions, at any time, on any topic, feel free to reach out to one of our management team
or directors. These engagements are invaluable to us, and we are using the constructive feedback provided to enhance our performance
and our governance profile.
Slide 21: Our
Dedicated Management Team
On
behalf of the Board, I would like to thank the management team and all our associates for your dedication and strong commitment
to our customers, communities and shareholders. We sincerely appreciate each of you for your dedication and loyalty to our Company.
Slide 22: Board
of Directors
As
mentioned previously, our board of directors provides strong oversight and spends countless hours overseeing the strategies of the Bank,
ensuring strong enterprise risk management and supporting management in setting targets and financial goals to build long-term shareholder
value. I thank each of our Board members for their guidance and the leadership they provide to First United Corporation.
Slide 23: My
Bank Mission
Our
unwavering commitment is not just a testament to our resilience, but also a reflection of the positive influence that community banking
has on our communities. We remain dedicated to our role as a community bank and understand the importance of strong leadership to drive
growth, not just for our Company, but also for the economic prosperity of the communities we serve.
While
it might be old-fashioned, we believe that community banks are, and always will be, the lifeblood of the communities they serve and the
stability amidst the chaos of the economic, political, and regulatory environments. We also believe that our focus on delivering an uncommon
commitment to service and customized financial solutions will continue to be the foundation of delivering a competitive long-term total
return to you, our shareholders. We thank you, our investors, for your steadfast support of First United and we thank our passionate,
loyal associates who remain devoted to delivering excellent service and being trusted financial advisors. Finally, we thank our customers
who give their best for their businesses, their families, their communities, and their futures for their belief in community banking.
We are proud to be a community owned bank. We are and always will be your bank, our bank, MYBANK!
Slide 24: Thank
You
The
Board, management team and associates thank you for your attendance today and your investment and confidence in First United Corporation!


2 Brian Boal Lead Independent Director Welcome and Introduction

3 Carissa Rodeheaver President, Chief Executive Officer, and Chairman of the Board Management Presentation

4 Forward looking statements This presentation contains forward - looking statements as defined by the Private Securities Litigation Reform Act of 1995 . Forward - looking statements do not represent historical facts, but are statements about management's beliefs, plans and objectives about the future, as well as its assumptions and judgments concerning such beliefs, plans and objectives . These statements are evidenced by terms such as "anticipate," "estimate," "should," "expect," "believe," "intend," and similar expressions . Although these statements reflect management's good faith beliefs and projections, they are not guarantees of future performance and they may not prove true . The beliefs, plans and objectives on which forward - looking statements are based involve risks and uncertainties that could cause actual results to differ materially from those addressed in the forward - looking statements . For a discussion of these risks and uncertainties, see the section of the periodic reports that First United Corporation files with the Securities and Exchange Commission entitled "Risk Factors . Whether actual results will conform to expectations and predictions is subject to known and unknown risks and uncertainties . Actual results could be materially different from management’s expectations . This presentation should be read in conjunction with our Annual Report on Form 10 - K, as amended, for the year ended December 31 , 2023 , including the sections of the report entitled “Risk Factors”, as well as the reports and other documents that we subsequently file with the Securities and Exchange Commission (“SEC”), which are available on the SEC’s website at www . sec . gov or at our website at www . mybank . com . Except as required by law, we do not intend to publish updates or revisions of any forward - looking statements we make to reflect new information, future events or otherwise .
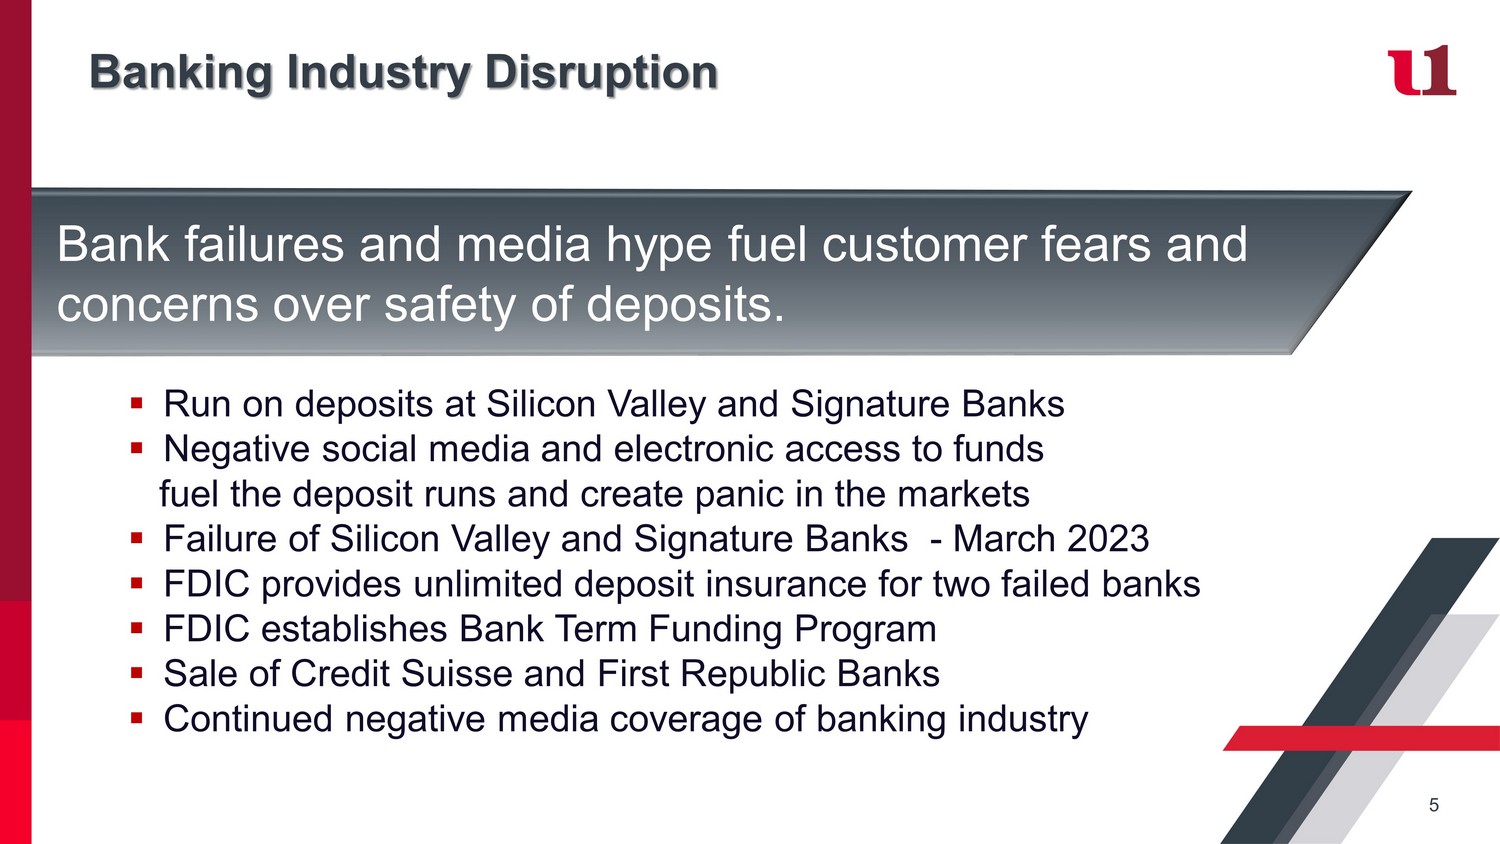
Banking Industry Disruption 5 ▪ Run on deposits at Silicon Valley and Signature Banks ▪ Negative social media and electronic access to funds fuel the deposit runs and create panic in the markets ▪ Failure of Silicon Valley and Signature Banks - March 2023 ▪ FDIC provides unlimited deposit insurance for two failed banks ▪ FDIC establishes Bank Term Funding Program ▪ Sale of Credit Suisse and First Republic Banks ▪ Continued negative media coverage of banking industry Bank failures and media hype fuel customer fears and concerns over safety of deposits.
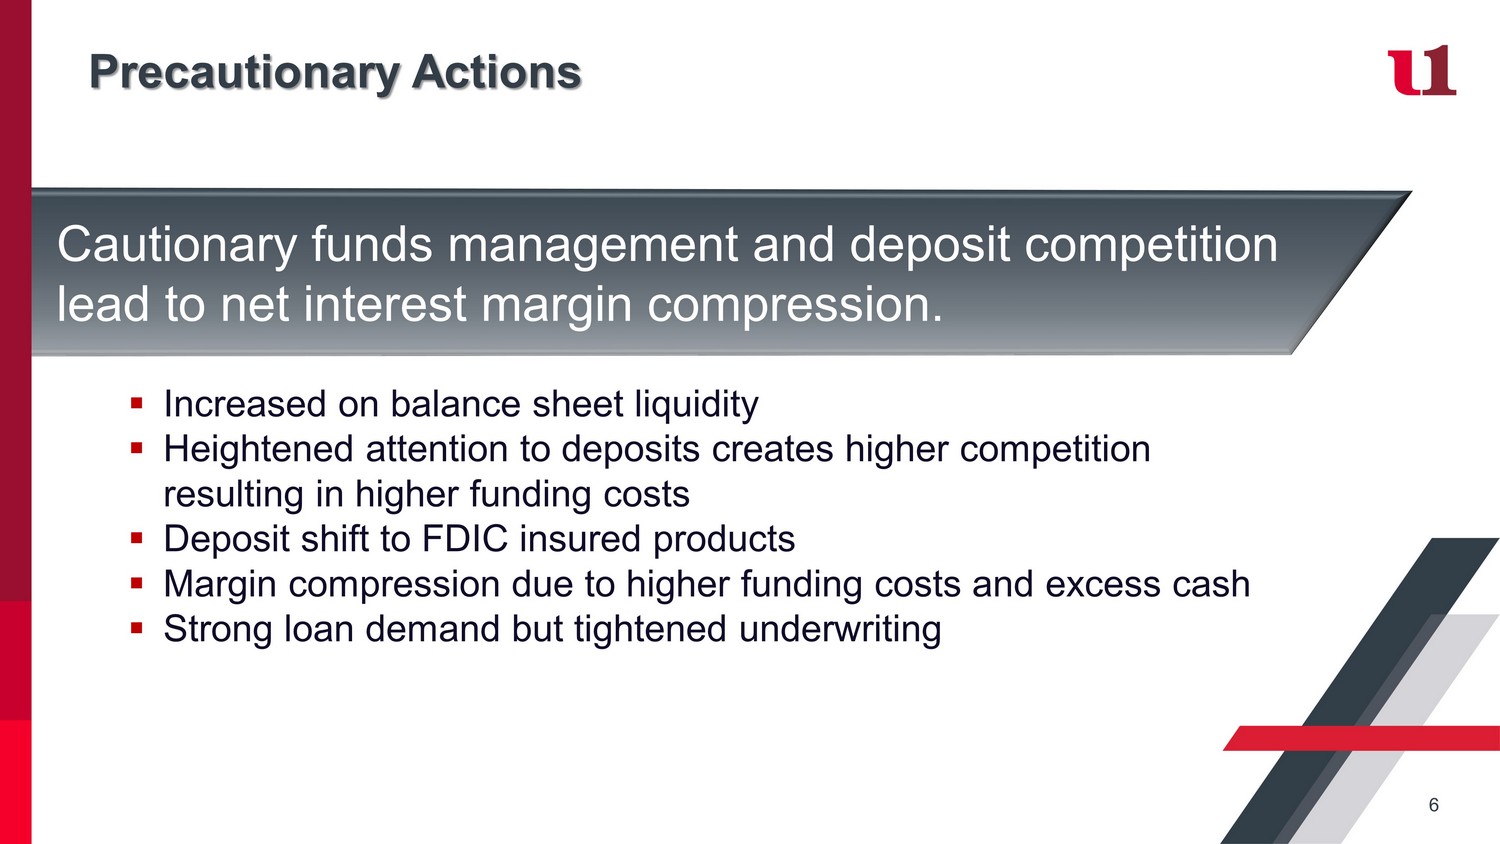
Precautionary Actions 6 ▪ Increased on balance sheet liquidity ▪ Heightened attention to deposits creates higher competition resulting in higher funding costs ▪ Deposit shift to FDIC insured products ▪ Margin compression due to higher funding costs and excess cash ▪ Strong loan demand but tightened underwriting Cautionary funds management and deposit competition lead to net interest margin compression.

Operational Costs, Technology and Strategic Actions 7 ▪ Increased costs of human talent and employee benefits ▪ Cybersecurity and fraud are high priority ▪ Enhanced technology and digital banking channels ▪ Strategic consolidation of four community offices results in acceleration of costs but will provide ongoing expense savings ▪ Balance sheet restructure to enhance future earnings Higher operating costs and strategic actions impact 2023 earnings but set stage for future efficiencies.

First United Corporation Remains Strong 8 ▪ High levels of excess capital ▪ Access to over $350 million in liquidity ▪ Low interest rate sensitivity ▪ Diversified deposit and loan portfolios ▪ Long history of stable earnings ▪ Board and management risk oversight Excess capital and liquidity, low susceptibility to interest rate changes and diverse customer base.
9 Tonya Sturm Senior Vice President and Chief Financial Officer Management Presentation

2023 Financial Highlights $18.8 Million Net Income (1) $2.81 Diluted EPS (1) 0.96% ROAA (1) 12.92 ROATCE (1) 3.26% NIM ▪ Total assets increased $57.7 million to $1.91 billion ▪ Consolidated net income (1) of $18.8 million ▪ Net interest income, on a non - GAAP, FTE basis decreased by $1.0 million in 2023, compared to 2022, driven by increased interest expense related to competitive deposit pricing and obtaining wholesale funds to provide on balance sheet liquidity ▪ Increased expenses attributable to salaries and benefits, technology enhancements, fraud and acceleration of depreciation and lease expenses related to branch closures ▪ Efficiency ratio of 65.12% (1) ▪ Strong asset quality (1) See Appendix for a reconciliation of these non - GAAP financial measure 10
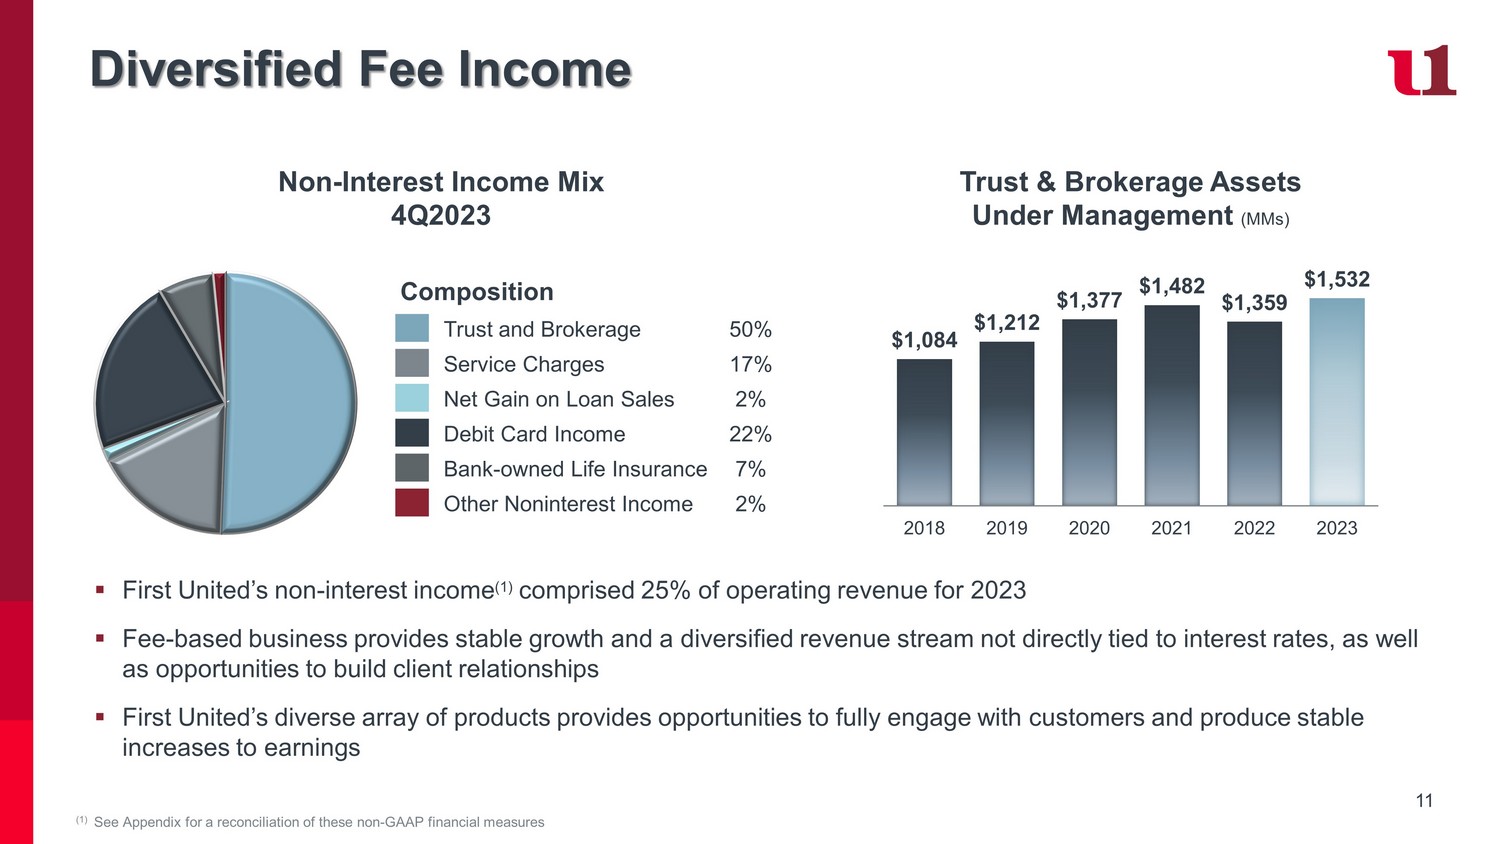
11 Diversified Fee Income (1) See Appendix for a reconciliation of these non - GAAP financial measures Composition Trust and Brokerage 50% Service Charges 17% Net Gain on Loan Sales 2% Debit Card Income 22% Bank - owned Life Insurance 7% Other Noninterest Income 2% Non - Interest Income Mix 4Q2023 $1,084 $1,212 $1,377 $1,482 $1,359 $1,532 2018 2019 2020 2021 2022 2023 Trust & Brokerage Assets Under Management (MMs) ▪ First United’s non - interest income (1) comprised 25% of operating revenue for 2023 ▪ Fee - based business provides stable growth and a diversified revenue stream not directly tied to interest rates, as well as opportunities to build client relationships ▪ First United’s diverse array of products provides opportunities to fully engage with customers and produce stable increases to earnings

First Quarter Financial Highlights $4.1 Million Net Income (1) $0.62 Diluted EPS (1) 0.85% * ROAA (1) 10.11% * ROATCE (1) 3.12% NIM ▪ Consolidated net income (1) of $4.1 million in 1Q24 compared to $4.4 million in 1Q23 and $5.5 million in fourth quarter 2023; pre - provision net revenue of $6.4 million compared to $6.3 million and $7.3, respectively ▪ Net interest income, on a non - GAAP, FTE basis* decreased by 2.69% in 1Q24 compared to 4Q23, driven by a 1.33% decrease in interest income and a 1.09% increase in interest expense, primarily resulting from the reversal of interest and fees on two non - accrual loan relationships and the continued competitive deposit landscape ▪ Asset quality remains stable with the ratio of the allowance for credit losses to loans outstanding at 1.27% in 1Q24 and 1.24% in the fourth quarter 2023 ▪ Total assets increased $7.1 million when compared to December 31, 2023 ▪ Efficiency ratio of 65.71% (1) for the first quarter of 2024 compared to 61.25% for the fourth quarter 2023; increase primarily related to reduced net interest income, increased salaries and benefits and gains on sales of OREO properties in the fourth quarter 2023 (1) See Appendix for a reconciliation of these non - GAAP financial measure * 1Q2024 Annualized 12
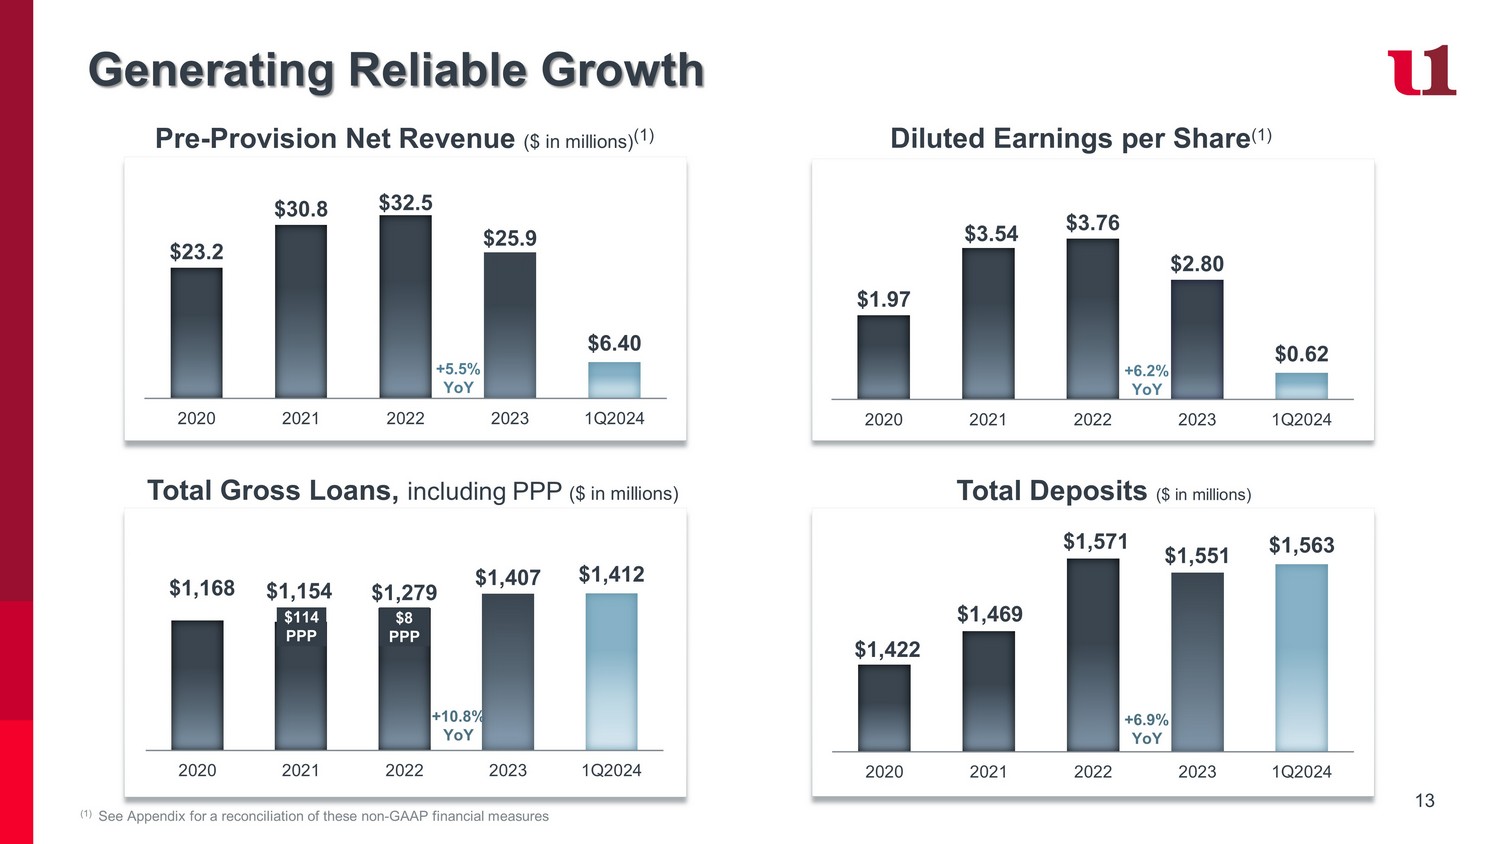
13 Generating Reliable Growth Pre - Provision Net Revenue ($ in millions) (1) $23.2 $30.8 $32.5 $25.9 $6.40 2020 2021 2022 2023 1Q2024 +5.5% YoY (1) See Appendix for a reconciliation of these non - GAAP financial measures $1.97 $3.54 $3.76 $2.80 $0.62 2020 2021 2022 2023 1Q2024 +6.2% YoY Diluted Earnings per Share (1) Total Deposits ($ in millions) $1,422 $1,469 $1,571 $1,551 $1,563 2020 2021 2022 2023 1Q2024 +6.9% YoY Total Gross Loans, including PPP ($ in millions) $1,168 $1,154 $1,279 $1,407 $1,412 2020 2021 2022 2023 1Q2024 +10.8% YoY $114 PPP $8 PPP
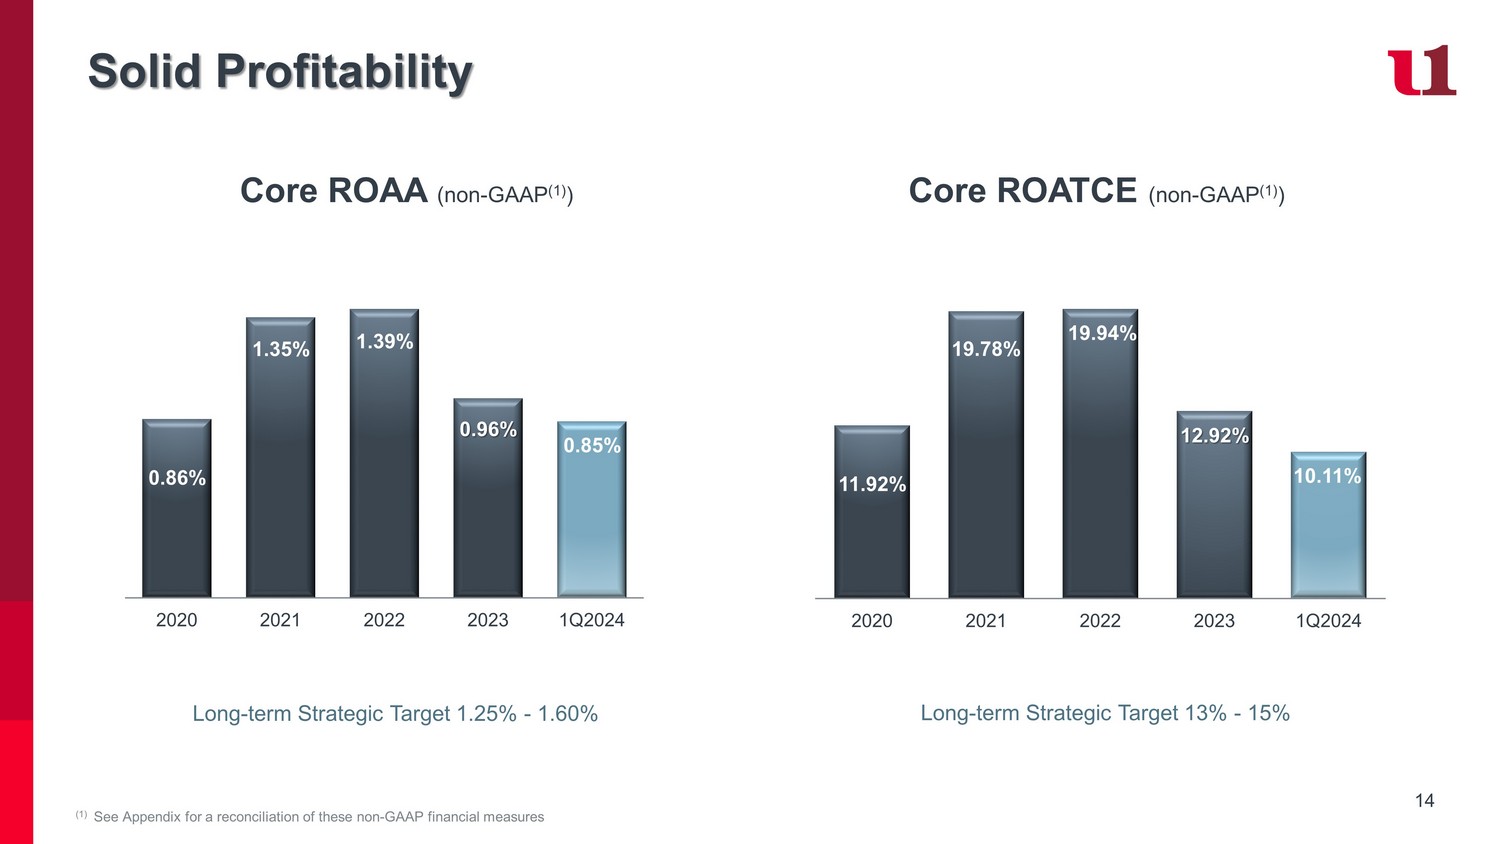
14 Solid Profitability (1) See Appendix for a reconciliation of these non - GAAP financial measures 11.92% 19.78% 19.94% 12.92% 10.11% 2020 2021 2022 2023 1Q2024 Long - term Strategic Target 13% - 15% 0.86% 1.35% 1.39% 0.96% 0.85% 2020 2021 2022 2023 1Q2024 Long - term Strategic Target 1.25% - 1.60% Core ROAA (non - GAAP (1) ) Core ROATCE (non - GAAP (1) )
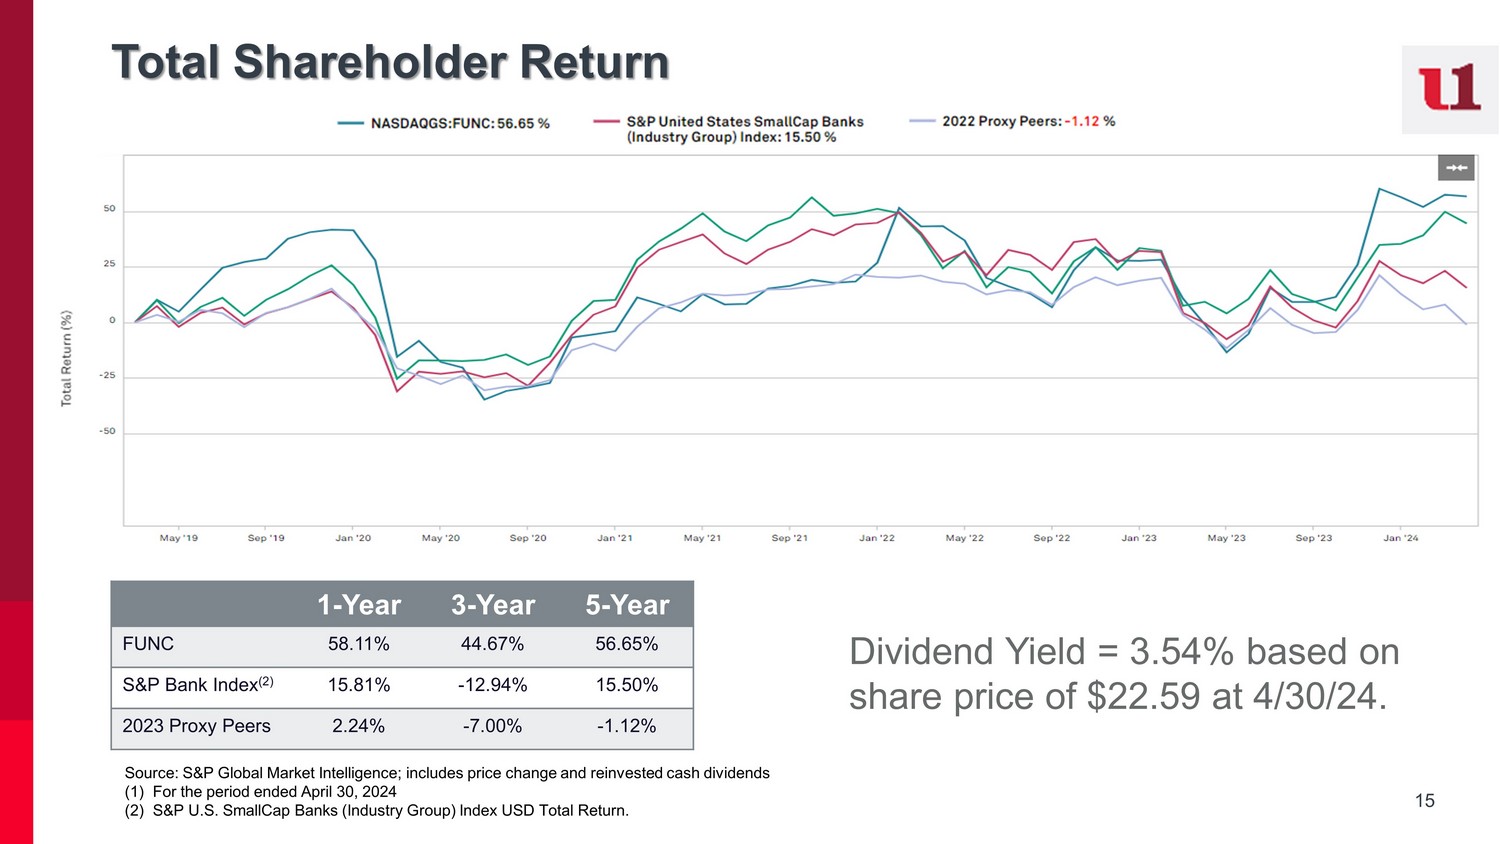
15 Total Shareholder Return Source: S&P Global Market Intelligence; includes price change and reinvested cash dividends (1) For the period ended April 30, 2024 (2) S&P U.S. SmallCap Banks (Industry Group) Index USD Total Return. 1 - Year 3 - Year 5 - Year FUNC 58.11% 44.67% 56.65% S&P Bank Index (2) 15.81% - 12.94% 15.50% 2023 Proxy Peers 2.24% - 7.00% - 1.12% Dividend Yield = 3.54% based on share price of $22.59 at 4/30/24.

16 Capital Management 16.08% 15.89% 16.12% 15.64% 15.83% 2020 2021 2022 2023 1Q2024 10.36% 10.80% 11.46% 11.30% 11.48% 2020 2021 2022 2023 1Q2024 12.61% 12.50% 12.96% 12.44% 12.60% 2020 2021 2022 2023 1Q2024 14.83% 14.64% 15.06% 14.42% 14.58% 2020 2021 2022 2023 1Q2024 CET1 Ratio Leverage Ratio Tier 1 Ratio Total Risk - Based Capital Ratio Regulatory Well - Capitalized 10% 5% 8% 6.5%

17 Tangible Common Equity $17.17 $19.61 $20.90 $22.56 $23.08 2020 2021 2022 2023 1Q2024 6.97% 7.56% 7.59% 7.91% 8.07% 2020 2021 2022 2023 1Q2024 Tangible Book Value / Share TCE Ratio
18 Risk Drives Strategy Cyber - Security & Fraud Monitoring Asset Quality Capital Liquidity Management Interest Rate Sensitivity
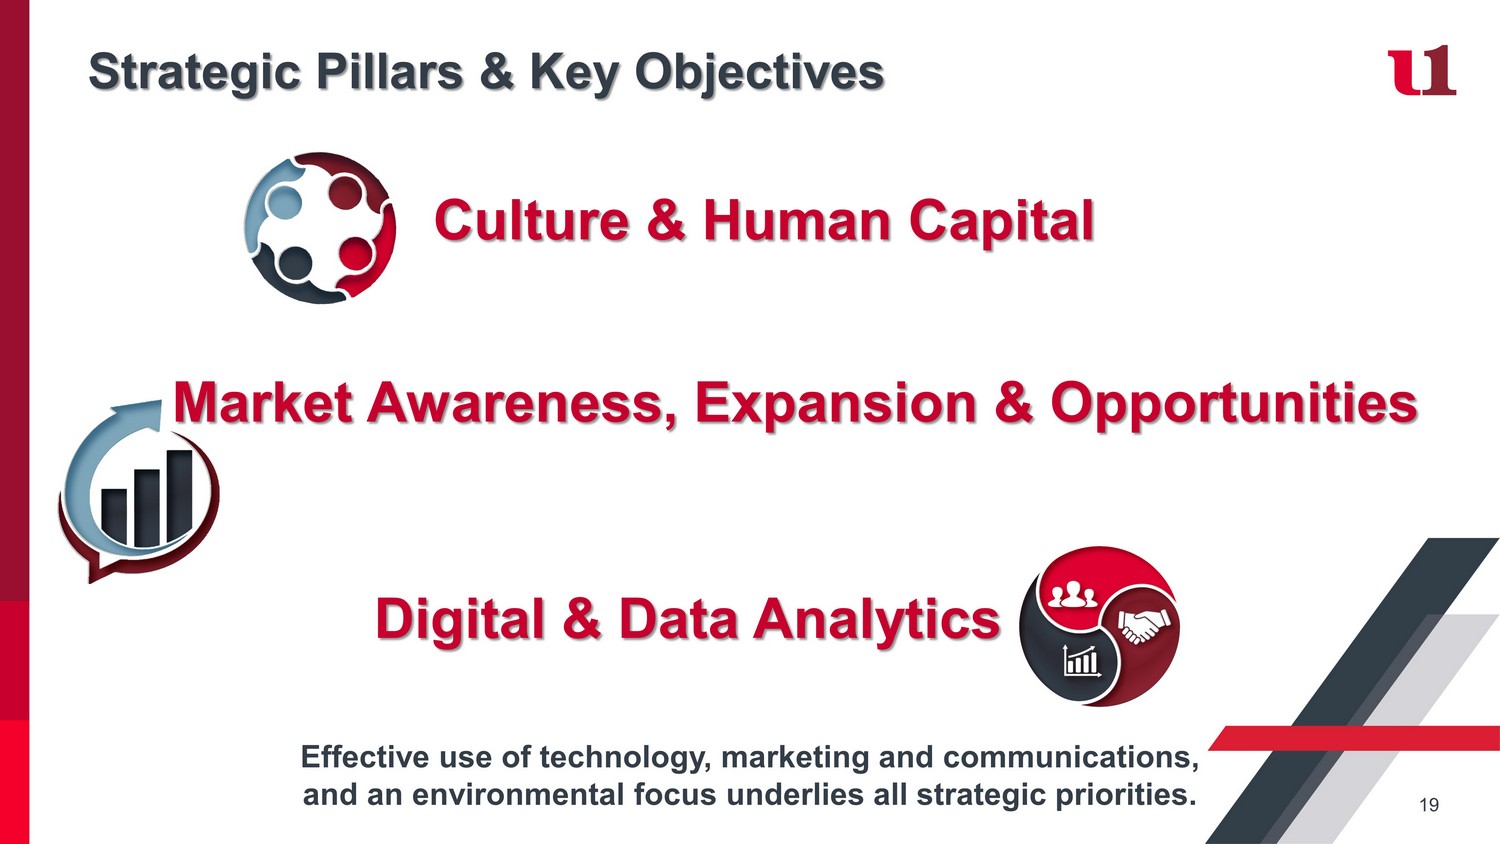
Strategic Pillars & Key Objectives Culture & Human Capital Digital & Data Analytics Market Awareness, Expansion & Opportunities Effective use of technology, marketing and communications, and an environmental focus underlies all strategic priorities. 19
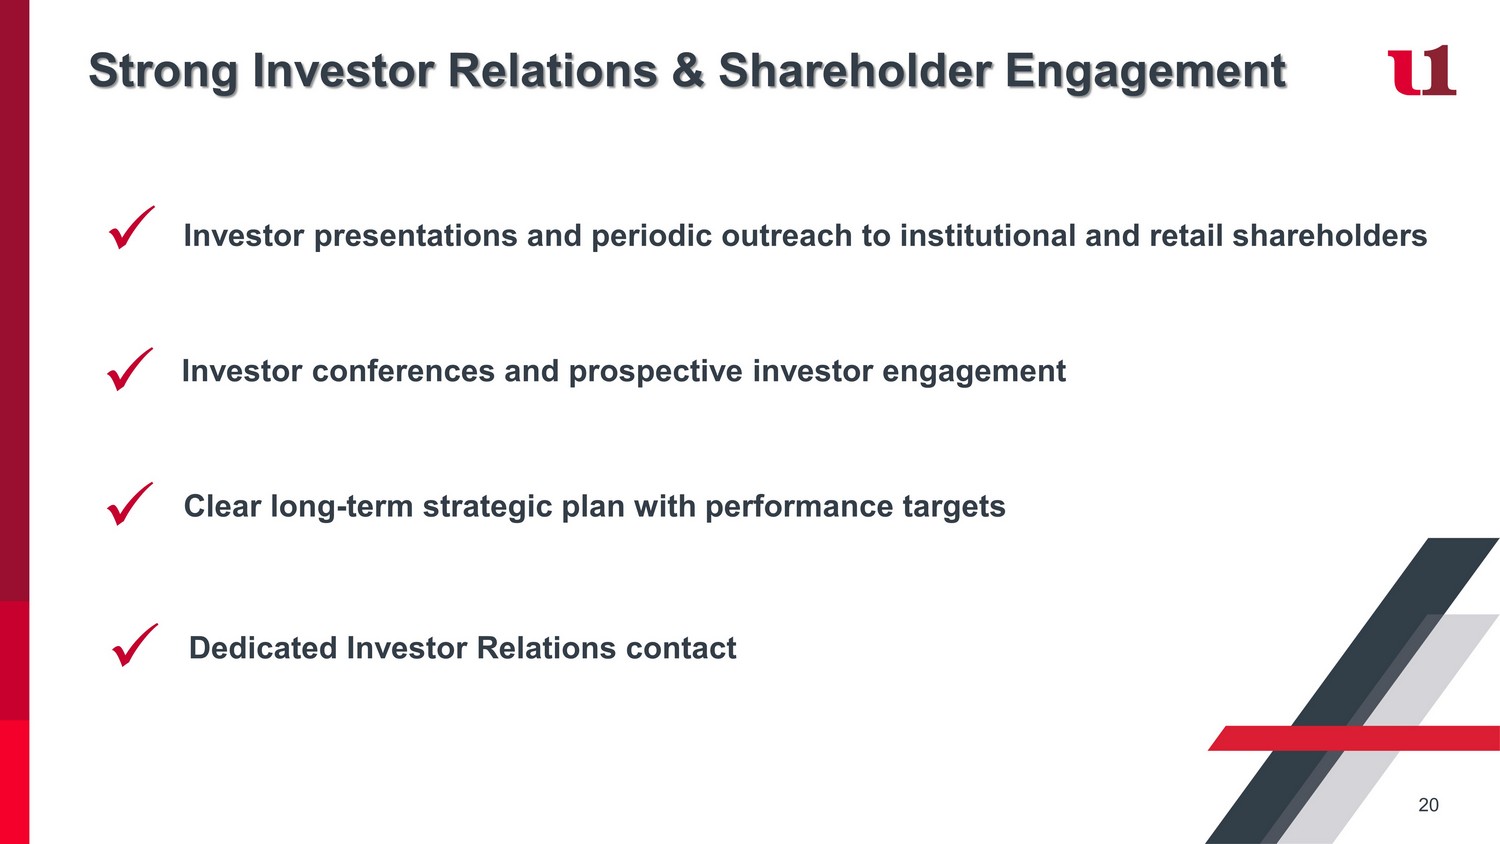
Strong Investor Relations & Shareholder Engagement Clear long - term strategic plan with performance targets x Dedicated Investor Relations contact x Investor conferences and prospective investor engagement x Investor presentations and periodic outreach to institutional and retail shareholders x 20

21 Our Dedicated Management Team Carissa L. Rodeheaver Chairman of the Board, President & CEO 32+ years career with First United with in - depth industry, wealth management, financial and operational experience Jason B. Rush SVP & Chief Operating Officer 30+ years with in - depth industry, retail, risk and compliance and operations experience Tonya K. Sturm SVP & Chief Financial Officer, Corp. Secretary & Treasurer 35+ years of banking, audit, credit, retail, risk and compliance and financial experience R.L. Fisher SVP & Chief Revenue Officer 25+years with in - depth industry, retail, commercial and mortgage banking experience Keith R. Sanders SVP & Chief Wealth Officer 30+ years specializing in wealth management, estate planning, trust administration and financial planning Our leadership team reflects the diversity of thought from the communities we serve, executes on our strategy and drives shareholder returns.

22 22 John F. Barr Independent Director Owner, Ellsworth Electric, Inc. Sanu B. Chadha Independent Director Managing Partner, M&S Consulting Christy M. DiPietro Independent Director, Audit Chair Chartered Financial Analyst, Hidden Cove Advisory Patricia A. Milon Independent Director Principal, Milford Advisory Group, LLC I. Robert Rudy Independent Director President, I.R. Rudy’s, Inc. Marisa A. Shockley Independent Director , Compensation Chair Former Owner, Shockley Inc. H. Andrew Walls, III Independent Director President, MPB Print & Sign Superstore Member, MEGBA, LLC Beth E. Moran Independent Director, The Law Offices of Beth E. Moran Brian R. Boal Lead Independent Director, Nomination & Governance Chair Boal & Associates, PC Carissa L. Rodeheaver Chairman of the Board, President & CEO First United Corporation and First United Bank & Trust Board of Directors Kevin R. Hessler Independent Director , Principal, LSWG, Inc.
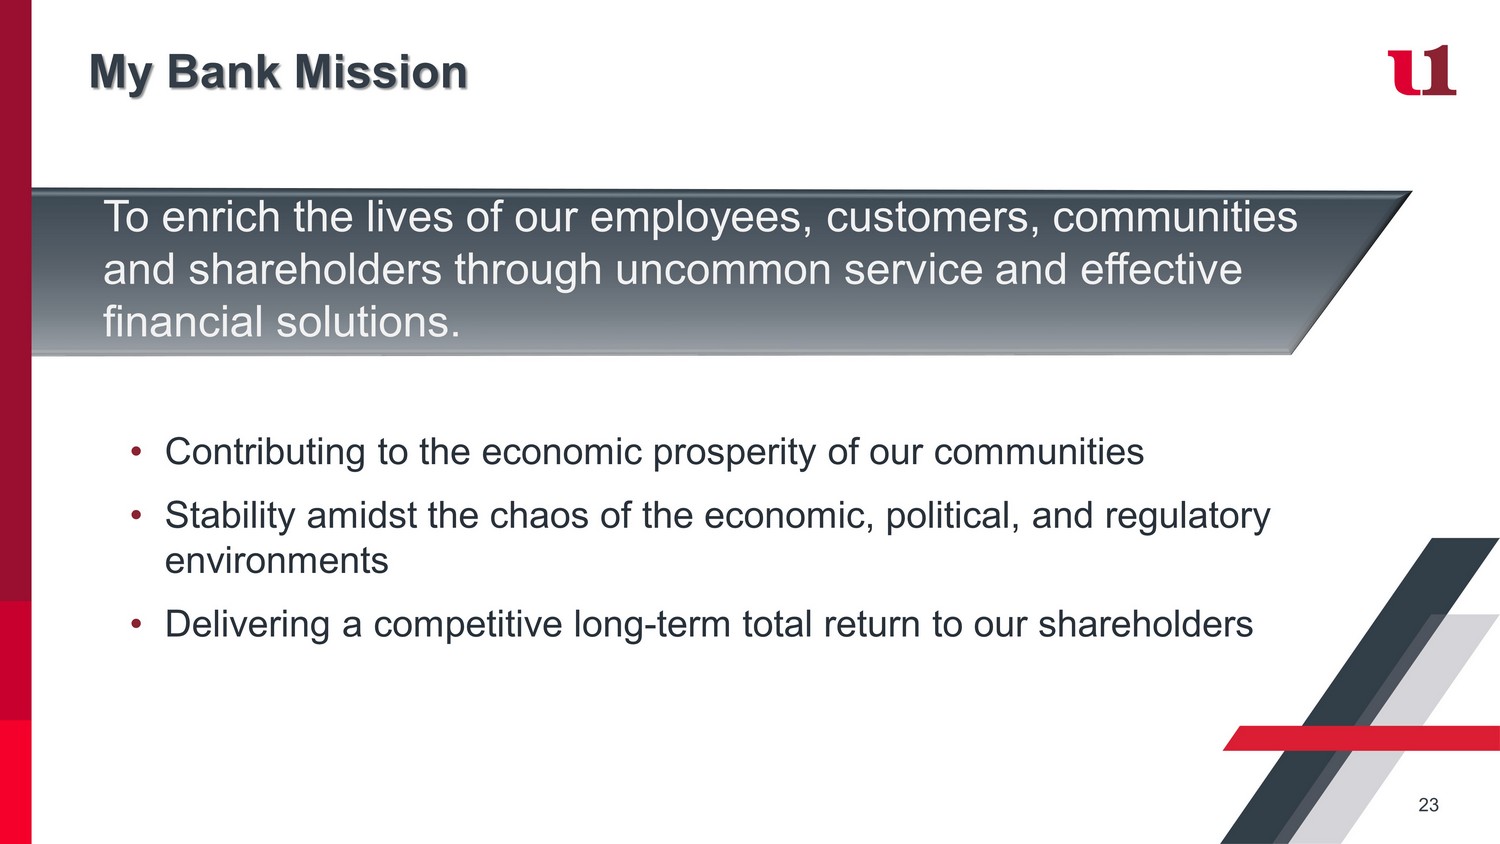
My Bank Mission 23 To enrich the lives of our employees, customers, communities and shareholders through uncommon service and effective financial solutions. • Contributing to the economic prosperity of our communities • Stability amidst the chaos of the economic, political, and regulatory environments • Delivering a competitive long - term total return to our shareholders

24 2

25 This presentation includes certain non - GAAP financial measures, including pre - provision net revenue, net income, earnings per share (basic and diluted), return on average assets, return on average tangible common equity, tangible common equity, tangible assets, the ratio of tangible common equity to tangible assets, tangible book value per share, net interest margin, and efficiency ratio . These non - GAAP financial measures and any other non - GAAP financial measures that are discussed in this presentation should not be considered in isolation, and should be considered as additions to, and not substitutes for or superior to, measures of financial performance prepared in accordance with GAAP . There are a number of limitations related to the use of these non - GAAP financial measures versus their nearest GAAP equivalents . For example, other companies may calculate non - GAAP financial measures differently or may use other measures to evaluate their performance, all of which could reduce the usefulness of the Company’s non - GAAP financial measures as tools for comparison . The following is a reconciliation of the non - GAAP financial measures used in (or conveyed orally during) this presentation to their most directly comparable GAAP financial measures . Non - GAAP Reconciliation ($000s, except where otherwise noted) YTD 2020 2021 2022 2023 Q1 2023 Q2 2023 Q3 2023 Q4 2023 Q1 2024 3/31/2024 Pre-Provision Net Revenue ("PPNR") Pre-tax income, as reported 17,788$ 26,309$ 33,181$ 19,476$ 5,730$ 5,837$ 5,834$ 2,075$ 4,860$ 4,860$ Add back: Provision expense 5,401 (817) (643) 1,619 543 394 263 419 946 946$ Add back: FHLB penalty, gross - 2,368 - - - - - - - -$ Add back: Contribution 1,000 - - - - - - - -$ Add back: Insurance reimbursement (1,375) - - - - - - - -$ Add back: Settlement expense, gross - 3,300 - - - - - - - -$ Add back: Securities loss 4,214 4,214 - -$ Add back: Branch closure expenses 623 623 562 562$ Pre-Provision Net Revenue, as adjusted 23,189$ 30,785$ 32,538$ 25,932$ 6,273$ 6,231$ 6,097$ 7,331$ 6,368$ 6,368$ Net Income Net income, as reported 13,841$ 19,770$ 25,048$ 15,060$ 4,375$ 4,414$ 4,513$ 1,758$ 3,698$ 3,698$ Less: Preferred stock dividends - - - - - - - - - -$ Net income, available to common shareholders,as reported (a) 13,841$ 19,770$ 25,048$ 15,060$ 4,375$ 4,414$ 4,513$ 1,758$ 3,698$ 3,698$ Add Back: Impact of Tax Reform Act Add back: FHLB penalty, net of tax - 1,790 - - - - - - - - Add back: Contribution, net of tax 770 - - - - - - - - Add back: Insurance reimbursement, net of tax (1,059) - - - - - - - - Add back: Settlement expense, net of tax - 2,565 - - - - - - - - Add back: Securities loss 3,259 3,259 - - Add back: Branch closure expenses 482 482 425 425 Net income, as adjusted (b) 13,841$ 23,836$ 25,048$ 18,801$ 4,375$ 4,414$ 4,513$ 5,499$ 4,123$ 4,123$
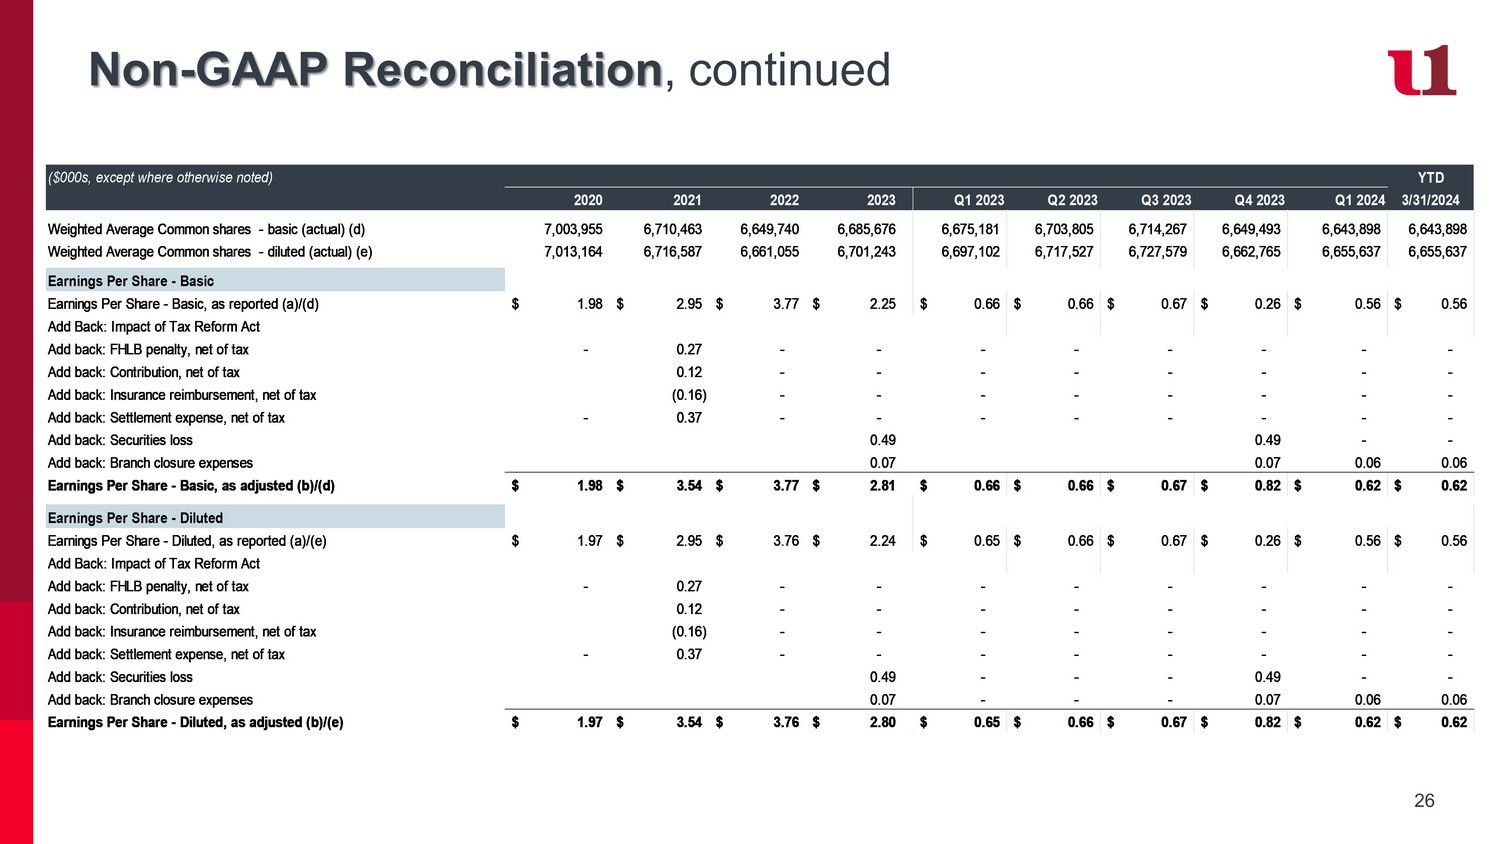
26 Non - GAAP Reconciliation , continued ($000s, except where otherwise noted) YTD 2020 2021 2022 2023 Q1 2023 Q2 2023 Q3 2023 Q4 2023 Q1 2024 3/31/2024 Weighted Average Common shares - basic (actual) (d) 7,003,955 6,710,463 6,649,740 6,685,676 6,675,181 6,703,805 6,714,267 6,649,493 6,643,898 6,643,898 Weighted Average Common shares - diluted (actual) (e) 7,013,164 6,716,587 6,661,055 6,701,243 6,697,102 6,717,527 6,727,579 6,662,765 6,655,637 6,655,637 Earnings Per Share - Basic Earnings Per Share - Basic, as reported (a)/(d) 1.98$ 2.95$ 3.77$ 2.25$ 0.66$ 0.66$ 0.67$ 0.26$ 0.56$ 0.56$ Add Back: Impact of Tax Reform Act Add back: FHLB penalty, net of tax - 0.27 - - - - - - - - Add back: Contribution, net of tax 0.12 - - - - - - - - Add back: Insurance reimbursement, net of tax (0.16) - - - - - - - - Add back: Settlement expense, net of tax - 0.37 - - - - - - - - Add back: Securities loss 0.49 0.49 - - Add back: Branch closure expenses 0.07 0.07 0.06 0.06 Earnings Per Share - Basic, as adjusted (b)/(d) 1.98$ 3.54$ 3.77$ 2.81$ 0.66$ 0.66$ 0.67$ 0.82$ 0.62$ 0.62$ Earnings Per Share - Diluted Earnings Per Share - Diluted, as reported (a)/(e) 1.97$ 2.95$ 3.76$ 2.24$ 0.65$ 0.66$ 0.67$ 0.26$ 0.56$ 0.56$ Add Back: Impact of Tax Reform Act Add back: FHLB penalty, net of tax - 0.27 - - - - - - - - Add back: Contribution, net of tax 0.12 - - - - - - - - Add back: Insurance reimbursement, net of tax (0.16) - - - - - - - - Add back: Settlement expense, net of tax - 0.37 - - - - - - - - Add back: Securities loss 0.49 - - - 0.49 - - Add back: Branch closure expenses 0.07 - - - 0.07 0.06 0.06 Earnings Per Share - Diluted, as adjusted (b)/(e) 1.97$ 3.54$ 3.76$ 2.80$ 0.65$ 0.66$ 0.67$ 0.82$ 0.62$ 0.62$
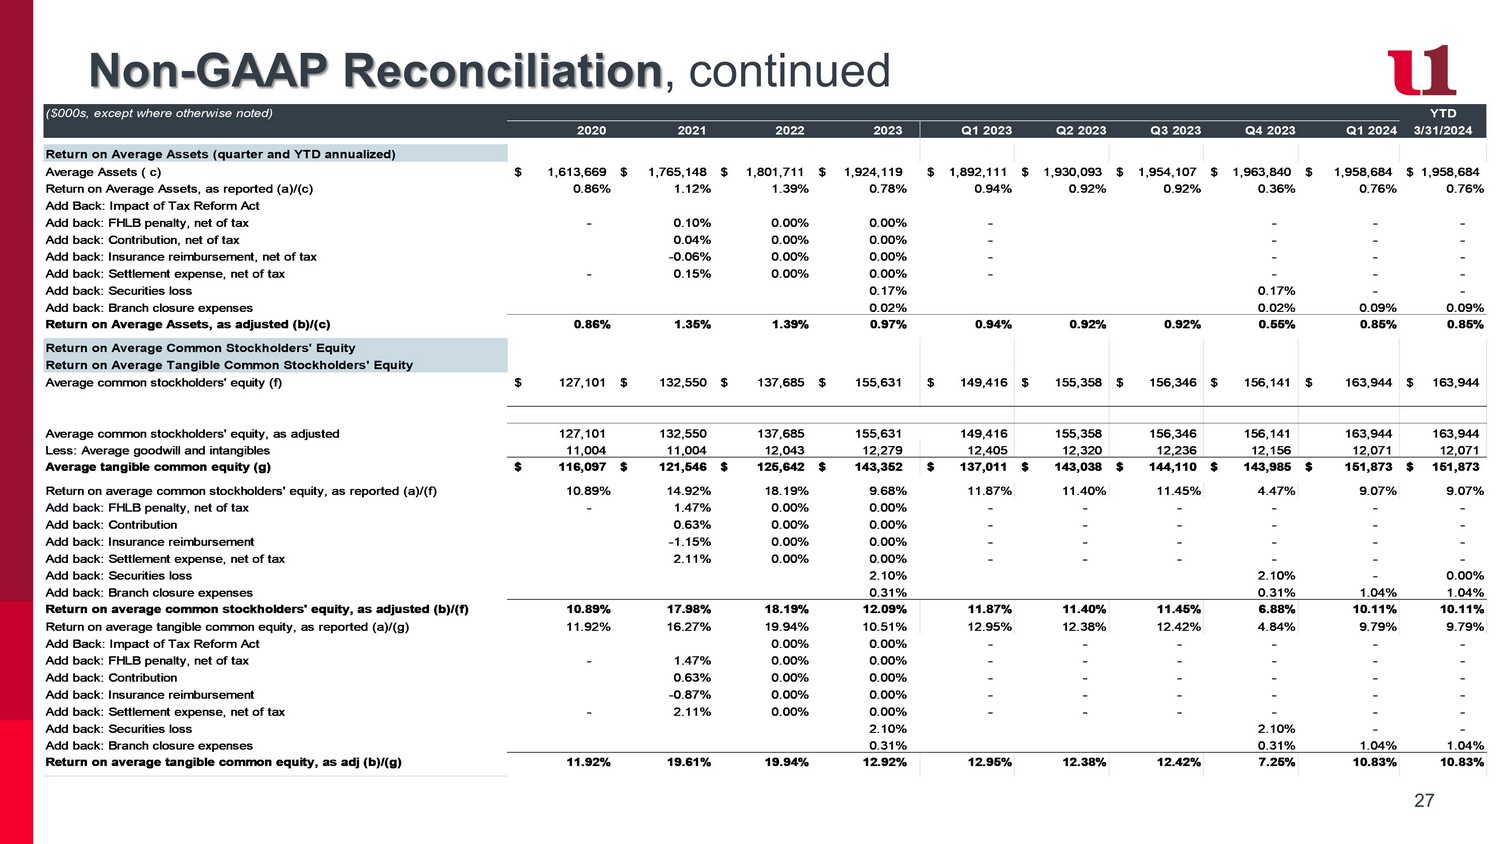
27 Non - GAAP Reconciliation , continued ($000s, except where otherwise noted) YTD 2020 2021 2022 2023 Q1 2023 Q2 2023 Q3 2023 Q4 2023 Q1 2024 3/31/2024 Return on Average Assets (quarter and YTD annualized) Average Assets ( c) 1,613,669$ 1,765,148$ 1,801,711$ 1,924,119$ 1,892,111$ 1,930,093$ 1,954,107$ 1,963,840$ 1,958,684$ 1,958,684$ Return on Average Assets, as reported (a)/(c) 0.86% 1.12% 1.39% 0.78% 0.94% 0.92% 0.92% 0.36% 0.76% 0.76% Add Back: Impact of Tax Reform Act Add back: FHLB penalty, net of tax - 0.10% 0.00% 0.00% - - - - Add back: Contribution, net of tax 0.04% 0.00% 0.00% - - - - Add back: Insurance reimbursement, net of tax -0.06% 0.00% 0.00% - - - - Add back: Settlement expense, net of tax - 0.15% 0.00% 0.00% - - - - Add back: Securities loss 0.17% 0.17% - - Add back: Branch closure expenses 0.02% 0.02% 0.09% 0.09% Return on Average Assets, as adjusted (b)/(c) 0.86% 1.35% 1.39% 0.97% 0.94% 0.92% 0.92% 0.55% 0.85% 0.85% Return on Average Common Stockholders' Equity Return on Average Tangible Common Stockholders' Equity Average common stockholders' equity (f) 127,101$ 132,550$ 137,685$ 155,631$ 149,416$ 155,358$ 156,346$ 156,141$ 163,944$ 163,944$ Average common stockholders' equity, as adjusted 127,101 132,550 137,685 155,631 149,416 155,358 156,346 156,141 163,944 163,944 Less: Average goodwill and intangibles 11,004 11,004 12,043 12,279 12,405 12,320 12,236 12,156 12,071 12,071 Average tangible common equity (g) 116,097$ 121,546$ 125,642$ 143,352$ 137,011$ 143,038$ 144,110$ 143,985$ 151,873$ 151,873$ Return on average common stockholders' equity, as reported (a)/(f) 10.89% 14.92% 18.19% 9.68% 11.87% 11.40% 11.45% 4.47% 9.07% 9.07% Add back: FHLB penalty, net of tax - 1.47% 0.00% 0.00% - - - - - - Add back: Contribution 0.63% 0.00% 0.00% - - - - - - Add back: Insurance reimbursement -1.15% 0.00% 0.00% - - - - - - Add back: Settlement expense, net of tax 2.11% 0.00% 0.00% - - - - - - Add back: Securities loss 2.10% 2.10% - 0.00% Add back: Branch closure expenses 0.31% 0.31% 1.04% 1.04% Return on average common stockholders' equity, as adjusted (b)/(f) 10.89% 17.98% 18.19% 12.09% 11.87% 11.40% 11.45% 6.88% 10.11% 10.11% Return on average tangible common equity, as reported (a)/(g) 11.92% 16.27% 19.94% 10.51% 12.95% 12.38% 12.42% 4.84% 9.79% 9.79% Add Back: Impact of Tax Reform Act 0.00% 0.00% - - - - - - Add back: FHLB penalty, net of tax - 1.47% 0.00% 0.00% - - - - - - Add back: Contribution 0.63% 0.00% 0.00% - - - - - - Add back: Insurance reimbursement -0.87% 0.00% 0.00% - - - - - - Add back: Settlement expense, net of tax - 2.11% 0.00% 0.00% - - - - - - Add back: Securities loss 2.10% 2.10% - - Add back: Branch closure expenses 0.31% 0.31% 1.04% 1.04% Return on average tangible common equity, as adj (b)/(g) 11.92% 19.61% 19.94% 12.92% 12.95% 12.38% 12.42% 7.25% 10.83% 10.83%
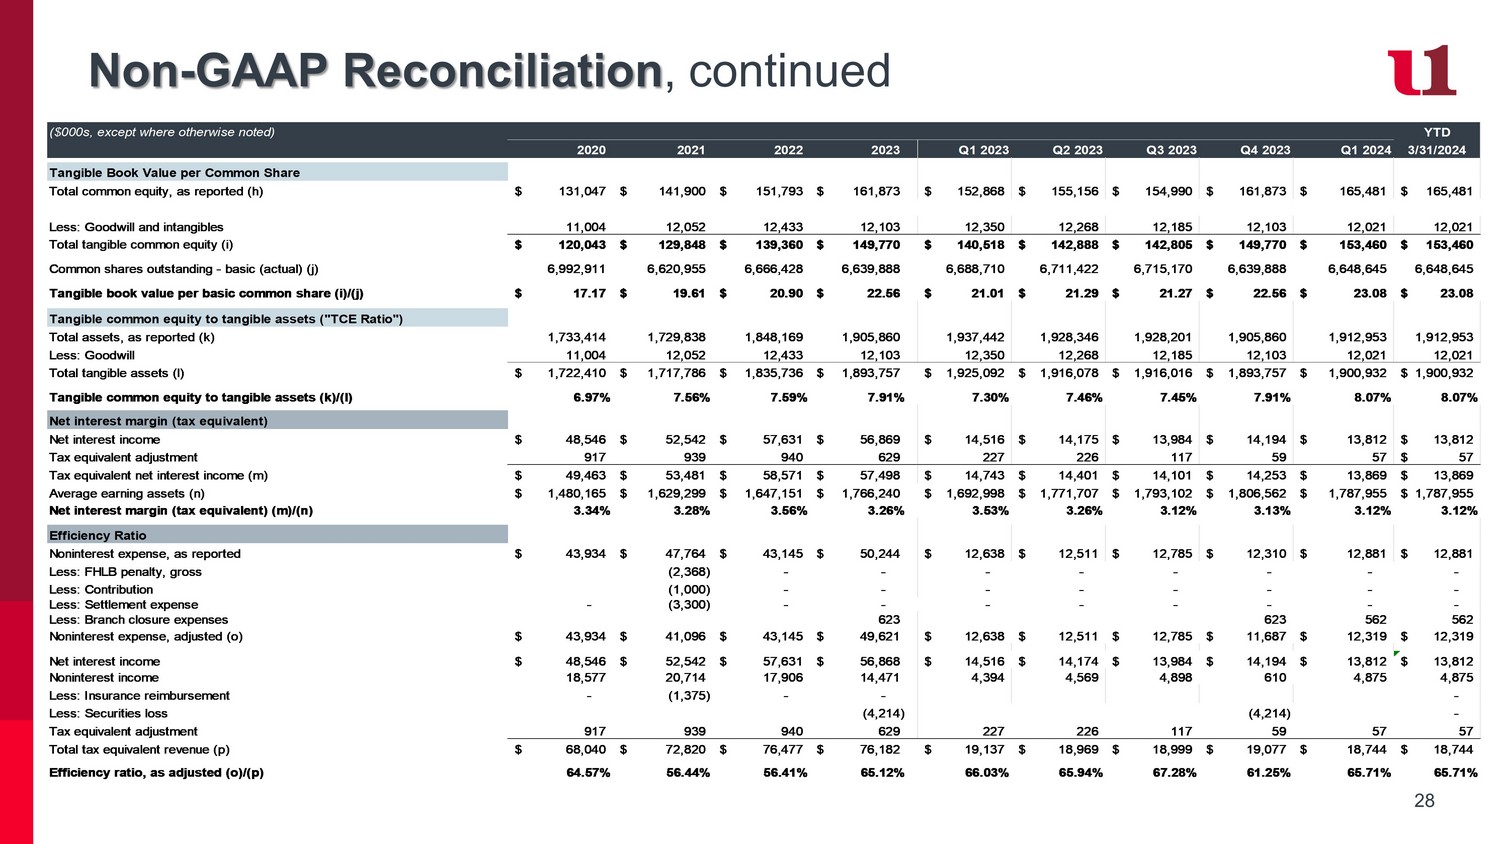
28 Non - GAAP Reconciliation , continued ($000s, except where otherwise noted) YTD 2020 2021 2022 2023 Q1 2023 Q2 2023 Q3 2023 Q4 2023 Q1 2024 3/31/2024 Tangible Book Value per Common Share Total common equity, as reported (h) 131,047$ 141,900$ 151,793$ 161,873$ 152,868$ 155,156$ 154,990$ 161,873$ 165,481$ 165,481$ Less: Goodwill and intangibles 11,004 12,052 12,433 12,103 12,350 12,268 12,185 12,103 12,021 12,021 Total tangible common equity (i) 120,043$ 129,848$ 139,360$ 149,770$ 140,518$ 142,888$ 142,805$ 149,770$ 153,460$ 153,460$ Common shares outstanding - basic (actual) (j) 6,992,911 6,620,955 6,666,428 6,639,888 6,688,710 6,711,422 6,715,170 6,639,888 6,648,645 6,648,645 Tangible book value per basic common share (i)/(j) 17.17$ 19.61$ 20.90$ 22.56$ 21.01$ 21.29$ 21.27$ 22.56$ 23.08$ 23.08$ Tangible common equity to tangible assets ("TCE Ratio") Total assets, as reported (k) 1,733,414 1,729,838 1,848,169 1,905,860 1,937,442 1,928,346 1,928,201 1,905,860 1,912,953 1,912,953 Less: Goodwill 11,004 12,052 12,433 12,103 12,350 12,268 12,185 12,103 12,021 12,021 Total tangible assets (l) 1,722,410$ 1,717,786$ 1,835,736$ 1,893,757$ 1,925,092$ 1,916,078$ 1,916,016$ 1,893,757$ 1,900,932$ 1,900,932$ Tangible common equity to tangible assets (k)/(l) 6.97% 7.56% 7.59% 7.91% 7.30% 7.46% 7.45% 7.91% 8.07% 8.07% Net interest margin (tax equivalent) Net interest income 48,546$ 52,542$ 57,631$ 56,869$ 14,516$ 14,175$ 13,984$ 14,194$ 13,812$ 13,812$ Tax equivalent adjustment 917 939 940 629 227 226 117 59 57 57$ Tax equivalent net interest income (m) 49,463$ 53,481$ 58,571$ 57,498$ 14,743$ 14,401$ 14,101$ 14,253$ 13,869$ 13,869$ Average earning assets (n) 1,480,165$ 1,629,299$ 1,647,151$ 1,766,240$ 1,692,998$ 1,771,707$ 1,793,102$ 1,806,562$ 1,787,955$ 1,787,955$ Net interest margin (tax equivalent) (m)/(n) 3.34% 3.28% 3.56% 3.26% 3.53% 3.26% 3.12% 3.13% 3.12% 3.12% Efficiency Ratio Noninterest expense, as reported 43,934$ 47,764$ 43,145$ 50,244$ 12,638$ 12,511$ 12,785$ 12,310$ 12,881$ 12,881$ Less: FHLB penalty, gross (2,368) - - - - - - - - Less: Contribution (1,000) - - - - - - - - Less: Settlement expense - (3,300) - - - - - - - - Less: Branch closure expenses 623 623 562 562 Noninterest expense, adjusted (o) 43,934$ 41,096$ 43,145$ 49,621$ 12,638$ 12,511$ 12,785$ 11,687$ 12,319$ 12,319$ Net interest income 48,546$ 52,542$ 57,631$ 56,868$ 14,516$ 14,174$ 13,984$ 14,194$ 13,812$ 13,812$ Noninterest income 18,577 20,714 17,906 14,471 4,394 4,569 4,898 610 4,875 4,875 Less: Insurance reimbursement - (1,375) - - - Less: Securities loss (4,214) (4,214) - Tax equivalent adjustment 917 939 940 629 227 226 117 59 57 57 Total tax equivalent revenue (p) 68,040$ 72,820$ 76,477$ 76,182$ 19,137$ 18,969$ 18,999$ 19,077$ 18,744$ 18,744$ Efficiency ratio, as adjusted (o)/(p) 64.57% 56.44% 56.41% 65.12% 66.03% 65.94% 67.28% 61.25% 65.71% 65.71%
v3.24.1.u1
| X |
- DefinitionBoolean flag that is true when the XBRL content amends previously-filed or accepted submission.
| Name: |
dei_AmendmentFlag |
| Namespace Prefix: |
dei_ |
| Data Type: |
xbrli:booleanItemType |
| Balance Type: |
na |
| Period Type: |
duration |
|
| X |
- DefinitionFor the EDGAR submission types of Form 8-K: the date of the report, the date of the earliest event reported; for the EDGAR submission types of Form N-1A: the filing date; for all other submission types: the end of the reporting or transition period. The format of the date is YYYY-MM-DD.
| Name: |
dei_DocumentPeriodEndDate |
| Namespace Prefix: |
dei_ |
| Data Type: |
xbrli:dateItemType |
| Balance Type: |
na |
| Period Type: |
duration |
|
| X |
- DefinitionThe type of document being provided (such as 10-K, 10-Q, 485BPOS, etc). The document type is limited to the same value as the supporting SEC submission type, or the word 'Other'.
| Name: |
dei_DocumentType |
| Namespace Prefix: |
dei_ |
| Data Type: |
dei:submissionTypeItemType |
| Balance Type: |
na |
| Period Type: |
duration |
|
| X |
- DefinitionAddress Line 1 such as Attn, Building Name, Street Name
| Name: |
dei_EntityAddressAddressLine1 |
| Namespace Prefix: |
dei_ |
| Data Type: |
xbrli:normalizedStringItemType |
| Balance Type: |
na |
| Period Type: |
duration |
|
| X |
- Definition
+ References
+ Details
| Name: |
dei_EntityAddressCityOrTown |
| Namespace Prefix: |
dei_ |
| Data Type: |
xbrli:normalizedStringItemType |
| Balance Type: |
na |
| Period Type: |
duration |
|
| X |
- DefinitionCode for the postal or zip code
| Name: |
dei_EntityAddressPostalZipCode |
| Namespace Prefix: |
dei_ |
| Data Type: |
xbrli:normalizedStringItemType |
| Balance Type: |
na |
| Period Type: |
duration |
|
| X |
- DefinitionName of the state or province.
| Name: |
dei_EntityAddressStateOrProvince |
| Namespace Prefix: |
dei_ |
| Data Type: |
dei:stateOrProvinceItemType |
| Balance Type: |
na |
| Period Type: |
duration |
|
| X |
- DefinitionA unique 10-digit SEC-issued value to identify entities that have filed disclosures with the SEC. It is commonly abbreviated as CIK. Reference 1: http://www.xbrl.org/2003/role/presentationRef
-Publisher SEC
-Name Exchange Act
-Number 240
-Section 12
-Subsection b-2
| Name: |
dei_EntityCentralIndexKey |
| Namespace Prefix: |
dei_ |
| Data Type: |
dei:centralIndexKeyItemType |
| Balance Type: |
na |
| Period Type: |
duration |
|
| X |
- DefinitionIndicate if registrant meets the emerging growth company criteria. Reference 1: http://www.xbrl.org/2003/role/presentationRef
-Publisher SEC
-Name Exchange Act
-Number 240
-Section 12
-Subsection b-2
| Name: |
dei_EntityEmergingGrowthCompany |
| Namespace Prefix: |
dei_ |
| Data Type: |
xbrli:booleanItemType |
| Balance Type: |
na |
| Period Type: |
duration |
|
| X |
- DefinitionCommission file number. The field allows up to 17 characters. The prefix may contain 1-3 digits, the sequence number may contain 1-8 digits, the optional suffix may contain 1-4 characters, and the fields are separated with a hyphen.
| Name: |
dei_EntityFileNumber |
| Namespace Prefix: |
dei_ |
| Data Type: |
dei:fileNumberItemType |
| Balance Type: |
na |
| Period Type: |
duration |
|
| X |
- DefinitionTwo-character EDGAR code representing the state or country of incorporation.
| Name: |
dei_EntityIncorporationStateCountryCode |
| Namespace Prefix: |
dei_ |
| Data Type: |
dei:edgarStateCountryItemType |
| Balance Type: |
na |
| Period Type: |
duration |
|
| X |
- DefinitionThe exact name of the entity filing the report as specified in its charter, which is required by forms filed with the SEC. Reference 1: http://www.xbrl.org/2003/role/presentationRef
-Publisher SEC
-Name Exchange Act
-Number 240
-Section 12
-Subsection b-2
| Name: |
dei_EntityRegistrantName |
| Namespace Prefix: |
dei_ |
| Data Type: |
xbrli:normalizedStringItemType |
| Balance Type: |
na |
| Period Type: |
duration |
|
| X |
- DefinitionThe Tax Identification Number (TIN), also known as an Employer Identification Number (EIN), is a unique 9-digit value assigned by the IRS. Reference 1: http://www.xbrl.org/2003/role/presentationRef
-Publisher SEC
-Name Exchange Act
-Number 240
-Section 12
-Subsection b-2
| Name: |
dei_EntityTaxIdentificationNumber |
| Namespace Prefix: |
dei_ |
| Data Type: |
dei:employerIdItemType |
| Balance Type: |
na |
| Period Type: |
duration |
|
| X |
- DefinitionLocal phone number for entity.
| Name: |
dei_LocalPhoneNumber |
| Namespace Prefix: |
dei_ |
| Data Type: |
xbrli:normalizedStringItemType |
| Balance Type: |
na |
| Period Type: |
duration |
|
| X |
- DefinitionBoolean flag that is true when the Form 8-K filing is intended to satisfy the filing obligation of the registrant as pre-commencement communications pursuant to Rule 13e-4(c) under the Exchange Act. Reference 1: http://www.xbrl.org/2003/role/presentationRef
-Publisher SEC
-Name Exchange Act
-Number 240
-Section 13e
-Subsection 4c
| Name: |
dei_PreCommencementIssuerTenderOffer |
| Namespace Prefix: |
dei_ |
| Data Type: |
xbrli:booleanItemType |
| Balance Type: |
na |
| Period Type: |
duration |
|
| X |
- DefinitionBoolean flag that is true when the Form 8-K filing is intended to satisfy the filing obligation of the registrant as pre-commencement communications pursuant to Rule 14d-2(b) under the Exchange Act. Reference 1: http://www.xbrl.org/2003/role/presentationRef
-Publisher SEC
-Name Exchange Act
-Number 240
-Section 14d
-Subsection 2b
| Name: |
dei_PreCommencementTenderOffer |
| Namespace Prefix: |
dei_ |
| Data Type: |
xbrli:booleanItemType |
| Balance Type: |
na |
| Period Type: |
duration |
|
| X |
- DefinitionTitle of a 12(b) registered security. Reference 1: http://www.xbrl.org/2003/role/presentationRef
-Publisher SEC
-Name Exchange Act
-Number 240
-Section 12
-Subsection b
| Name: |
dei_Security12bTitle |
| Namespace Prefix: |
dei_ |
| Data Type: |
dei:securityTitleItemType |
| Balance Type: |
na |
| Period Type: |
duration |
|
| X |
- DefinitionName of the Exchange on which a security is registered. Reference 1: http://www.xbrl.org/2003/role/presentationRef
-Publisher SEC
-Name Exchange Act
-Number 240
-Section 12
-Subsection d1-1
| Name: |
dei_SecurityExchangeName |
| Namespace Prefix: |
dei_ |
| Data Type: |
dei:edgarExchangeCodeItemType |
| Balance Type: |
na |
| Period Type: |
duration |
|
| X |
- DefinitionBoolean flag that is true when the Form 8-K filing is intended to satisfy the filing obligation of the registrant as soliciting material pursuant to Rule 14a-12 under the Exchange Act. Reference 1: http://www.xbrl.org/2003/role/presentationRef
-Publisher SEC
-Name Exchange Act
-Section 14a
-Number 240
-Subsection 12
| Name: |
dei_SolicitingMaterial |
| Namespace Prefix: |
dei_ |
| Data Type: |
xbrli:booleanItemType |
| Balance Type: |
na |
| Period Type: |
duration |
|
| X |
- DefinitionTrading symbol of an instrument as listed on an exchange.
| Name: |
dei_TradingSymbol |
| Namespace Prefix: |
dei_ |
| Data Type: |
dei:tradingSymbolItemType |
| Balance Type: |
na |
| Period Type: |
duration |
|
| X |
- DefinitionBoolean flag that is true when the Form 8-K filing is intended to satisfy the filing obligation of the registrant as written communications pursuant to Rule 425 under the Securities Act. Reference 1: http://www.xbrl.org/2003/role/presentationRef
-Publisher SEC
-Name Securities Act
-Number 230
-Section 425
| Name: |
dei_WrittenCommunications |
| Namespace Prefix: |
dei_ |
| Data Type: |
xbrli:booleanItemType |
| Balance Type: |
na |
| Period Type: |
duration |
|
First United (NASDAQ:FUNC)
Historical Stock Chart
From Apr 2024 to May 2024

First United (NASDAQ:FUNC)
Historical Stock Chart
From May 2023 to May 2024
