UNITED STATES
SECURITIES AND EXCHANGE
COMMISSION
Washington, D.C. 20549
FORM 6-K
Report of Foreign Private
Issuer
Pursuant to Rule 13a-16
or 15d-16
of the Securities Exchange
Act of 1934
For the Month of May 2024
Commission File Number 001-35948
Kamada Ltd.
(Translation of registrant’s
name into English)
2 Holzman Street
Science Park, P.O. Box 4081
Rehovot 7670402
Israel
(Address of principal executive offices)
Indicate by check mark whether the registrant
files or will file annual reports under cover Form 20-F or Form 40-F.
Form 20-F ☒
Form 40-F ☐
This Form 6-K is being incorporated by reference
into the Registrant’s Form S-8 Registration Statements, File Nos. 333-192720, 333-207933, 333-215983, 333-222891, 333-233267 and
333-265866.
The following exhibit is attached:
SIGNATURE
Pursuant to the requirements of the Securities
Exchange Act of 1934, the registrant has duly caused this report to be signed on its behalf by the undersigned hereunto duly authorized.
| Date: May 8, 2024 |
KAMADA LTD. |
| |
|
| |
By: |
/s/ Nir Livneh |
| |
|
Nir Livneh
Vice President General Counsel and
Corporate Secretary |
EXHIBIT INDEX
3
Exhibit
99.1
Kamada
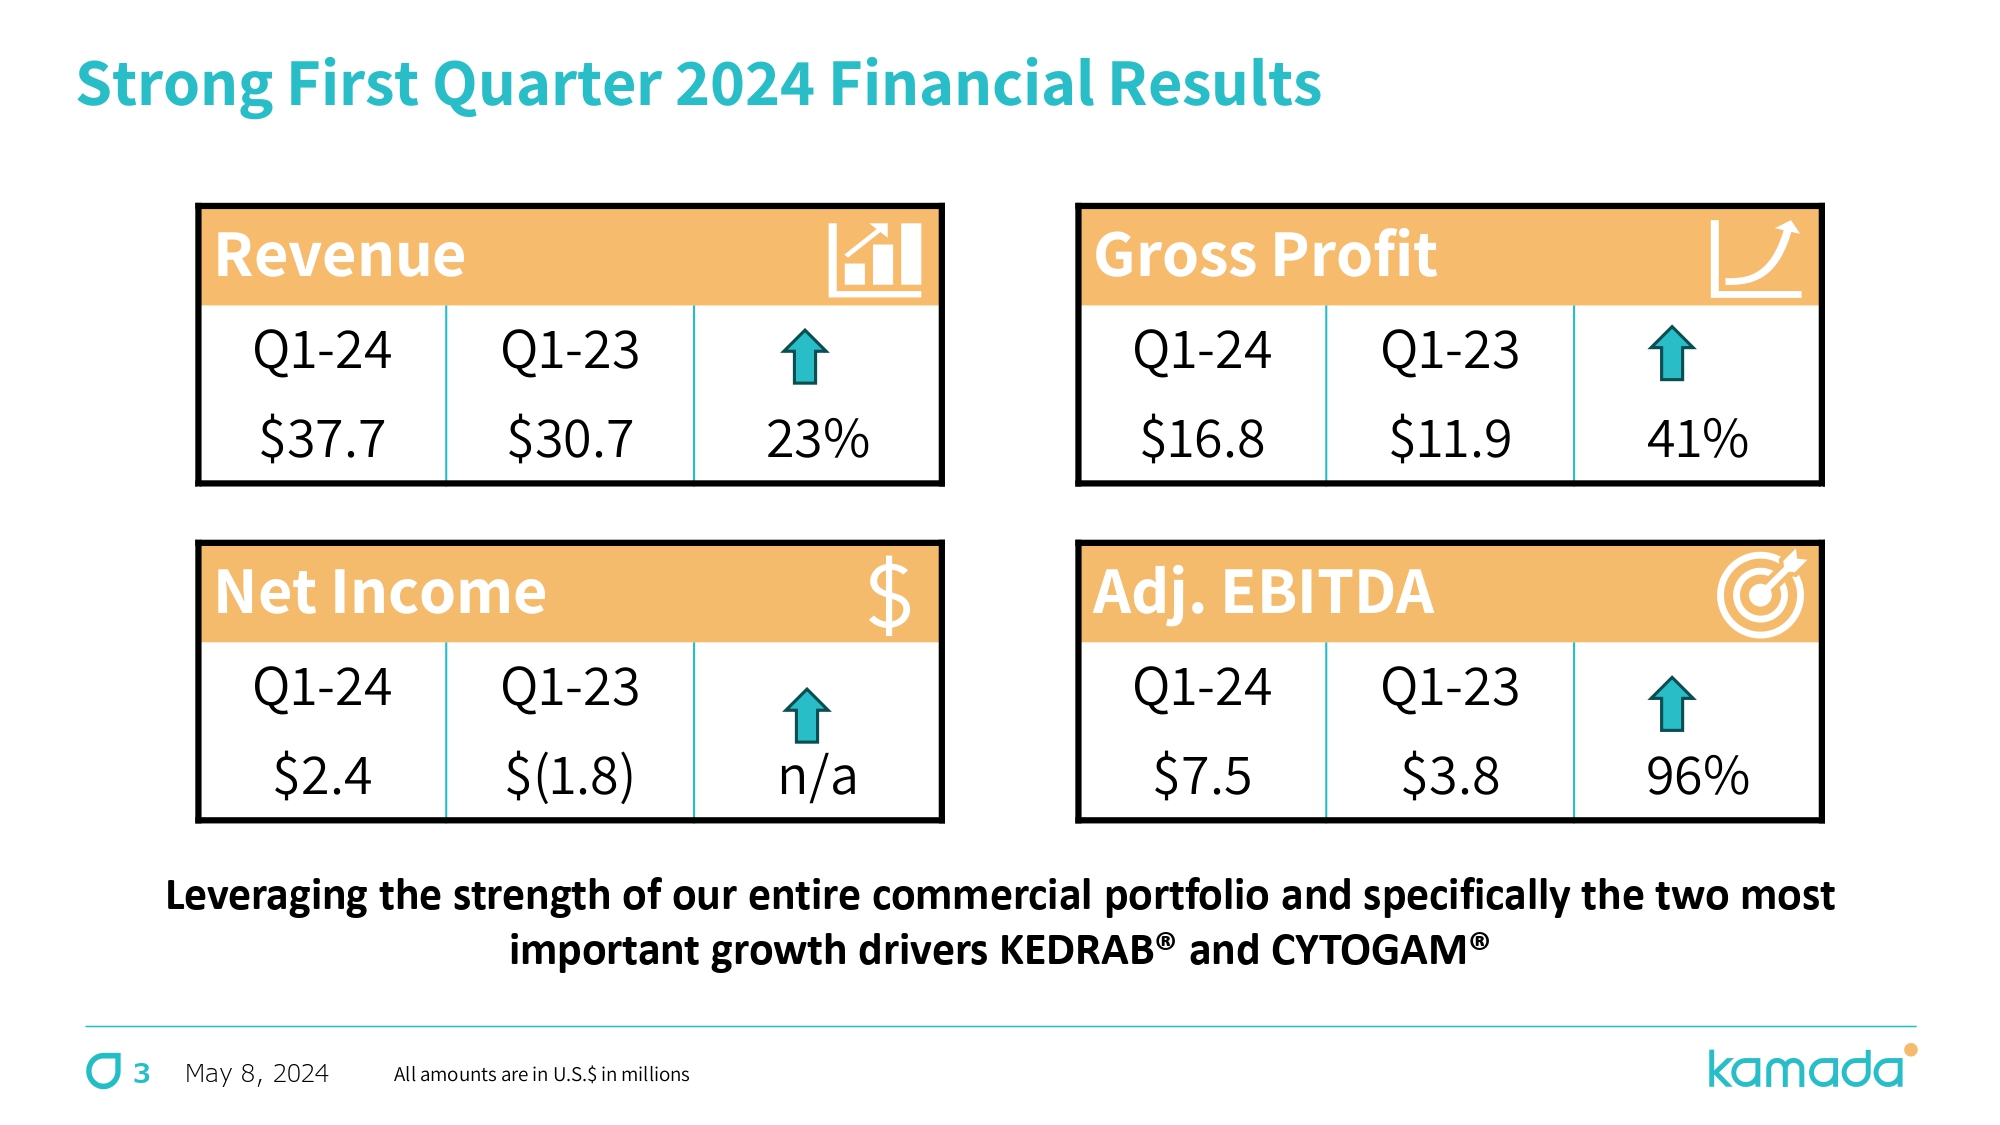
Reports Strong First Quarter 2024 Financial Results with Year-Over-Year Top-Line Growth of 23% and a 96% Increase in Profitability; Raises
Full-Year Financial Guidance
| ● | Revenues
for First Quarter of 2024 were $37.7 Million, Representing a 23% Increase Year-over-Year |
| ● | First
Quarter 2024 Adjusted EBITDA of $7.5 Million, Representing a 96% Increase Year-over-Year |
| ● | Momentum
Primarily Driven by U.S. Sales of the Company’s Two Most Significant Catalysts, KEDRAB®
and CYTOGAM® |
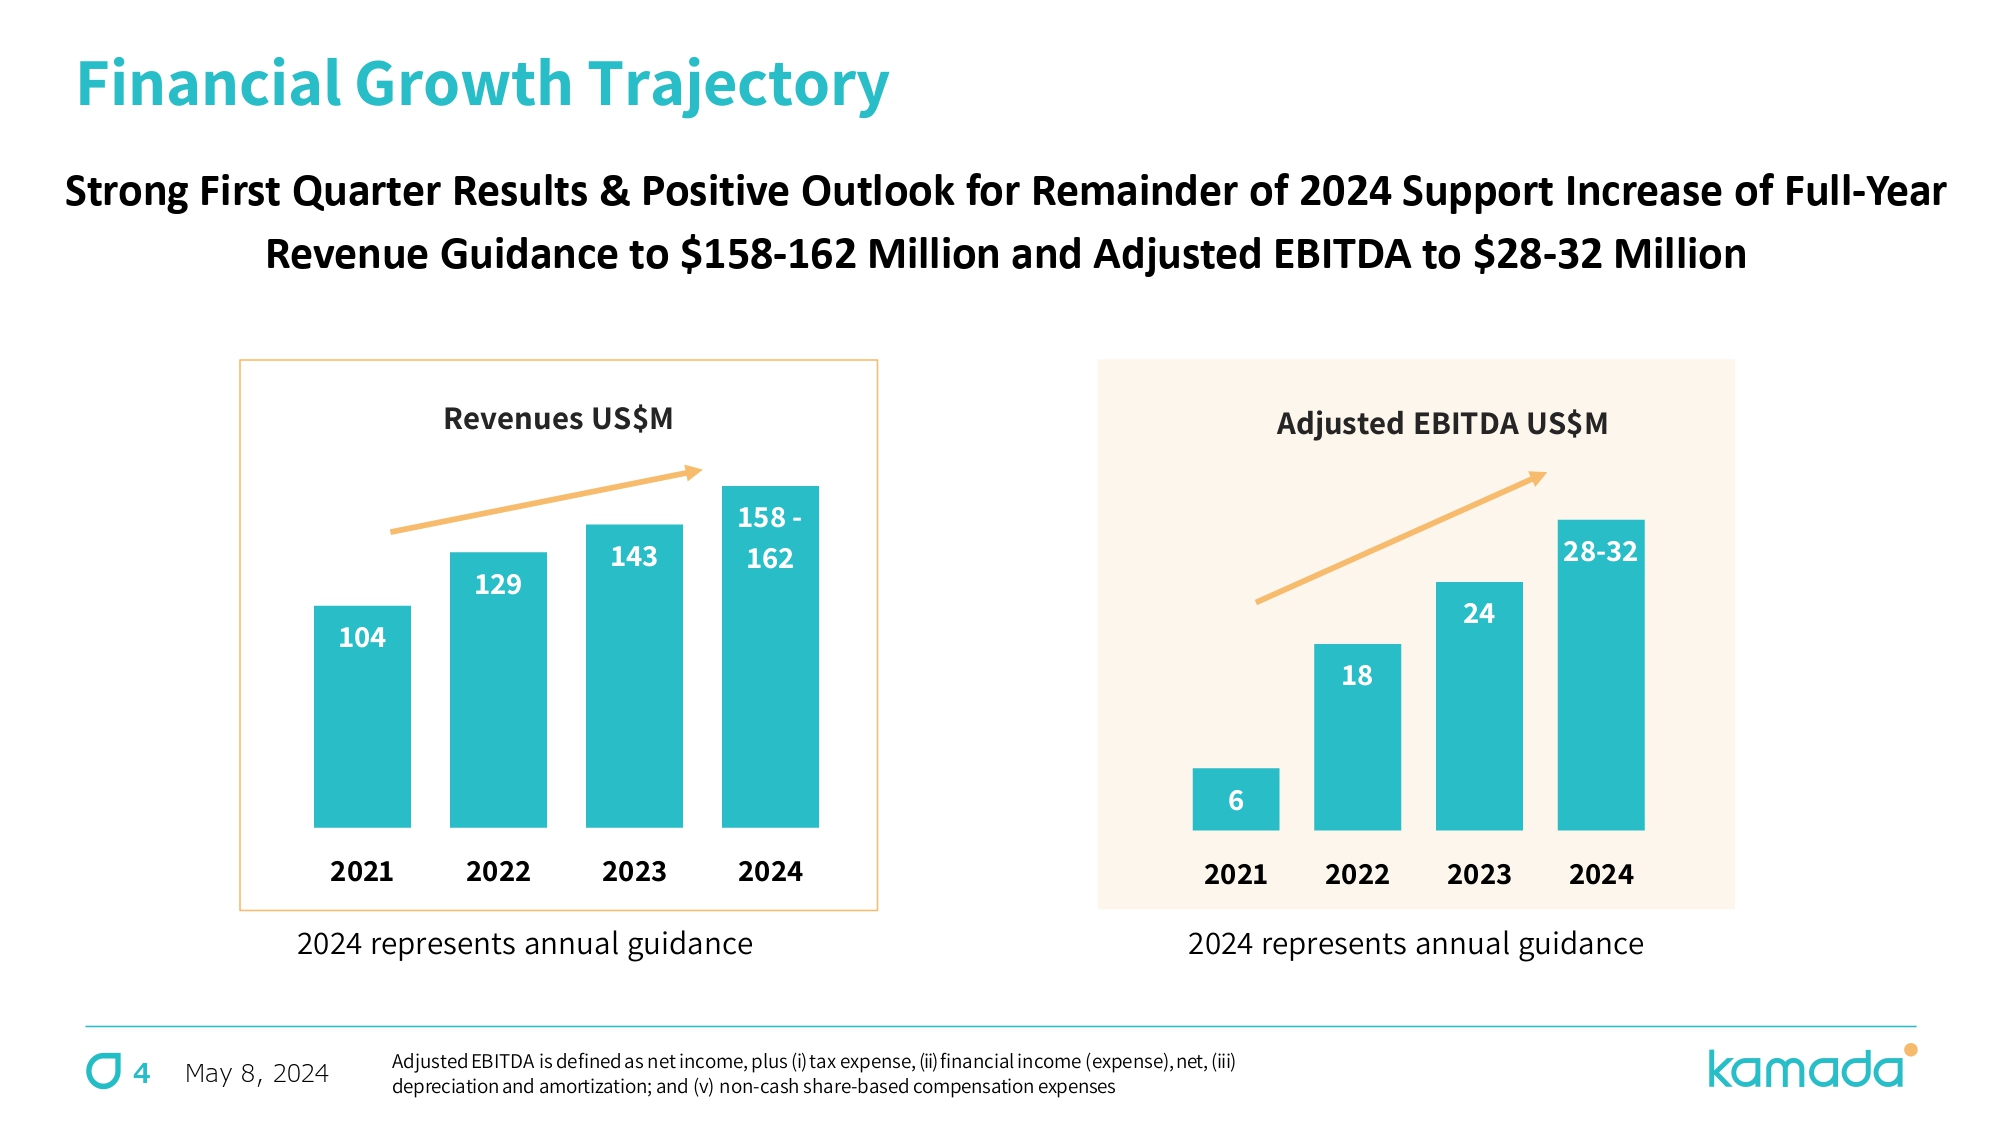
| ● | Strong
First Quarter Results and Positive Outlook for Remainder of 2024 Support Increase of Full-Year
Revenue Guidance to $158 Million-$162 Million and Adjusted EBITDA to $28 Million-$32 Million
|
| ● | Conference
Call and Live Webcast Today at 8:30 AM ET |
REHOVOT,
Israel, and Hoboken, NJ – May 8, 2024 -- Kamada Ltd. (NASDAQ: KMDA; TASE: KMDA.TA), a commercial stage global biopharmaceutical
company with a portfolio of marketed products indicated for rare and serious conditions and a leader in the specialty plasma-derived
field, today announced financial results for three months ended March 31, 2024.
“We
are excited by our strong financial and operational start to 2024, which has us well-positioned for a highly successful year,”
said Amir London, Kamada’s Chief Executive Officer. “Total revenues for the first quarter of 2024 were $37.7 million, representing
a 23% increase year-over-year, and adjusted EBITDA was $7.5 million, nearly double as compared to the first quarter of last year and
representing a 20% margin of revenues. While we benefit from the strength of our entire portfolio, we continue to effectively leverage
the two most important growth drivers in our business, KEDRAB® and CYTOGAM®. For CYTOGAM, our active promotion
of the product, supported by recently published new clinical data, is driving increased demand, and we are encouraged by the continued
growth being demonstrated by KEDRAB.”
“Based
on our strong performance in the first quarter and our expectation for the continued momentum in our business throughout 2024, we are
raising our full-year 2024 revenue guidance to be between $158 million to $162 million from the previous forecast of $156 million to
$160 million. We are also increasing our adjusted EBITDA guidance to $28 million to $32 million from the initial guidance of $27 million
to $30 million. Importantly, we continue to pursue compelling new business development opportunities, leveraging our overall financial
strength. These opportunities are expected to support continued growth at double-digit rates beyond 2024,” added Mr. London.
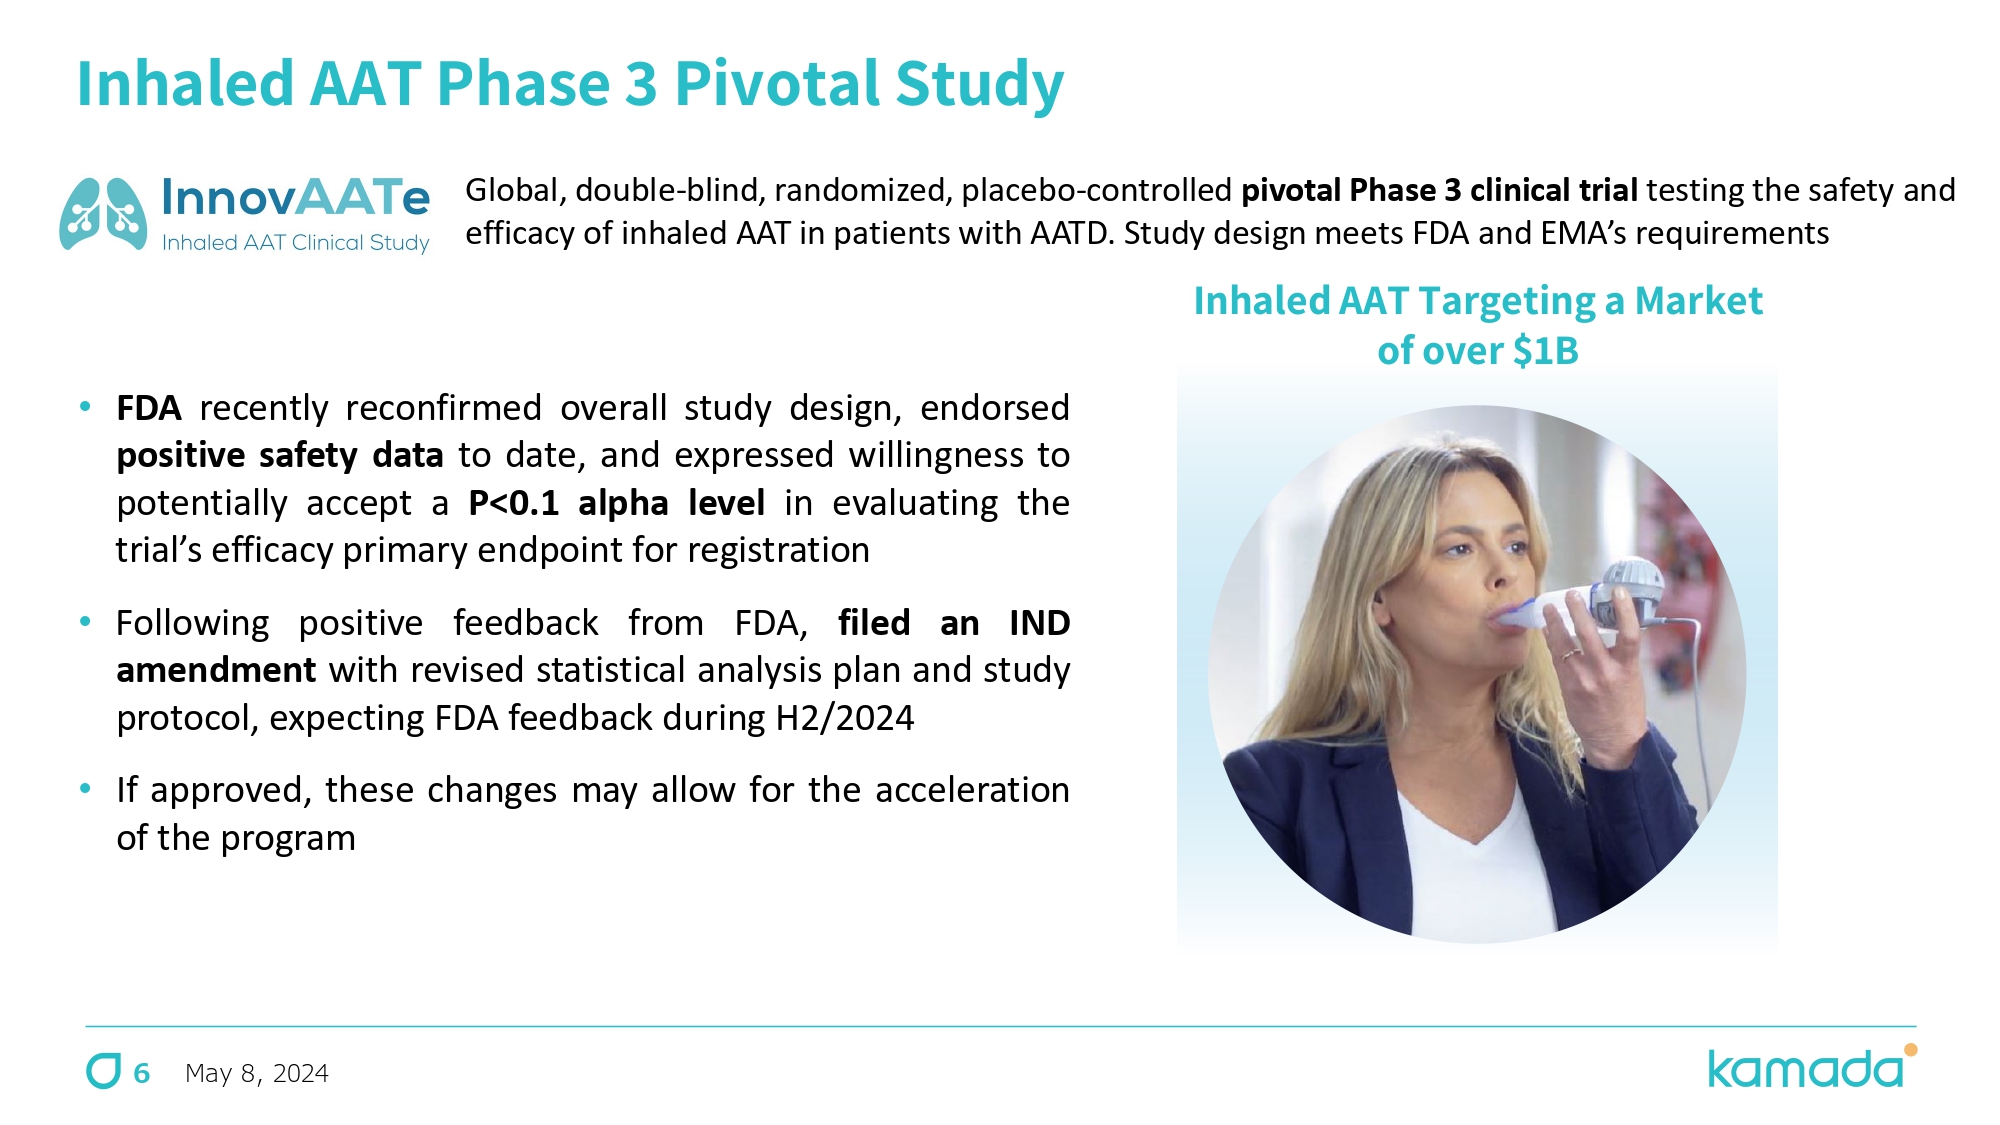
“Patient
enrollment continues in our ongoing pivotal Phase 3 InnovAATe clinical trial for the inhaled Alpha-1 Antitrypsin therapy for the treatment
of AAT Deficiency. Following recent positive feedback from the U.S. Food and Drug Administration
(FDA) through which the FDA expressed its willingness to potentially accept a P<0.1 alpha level in evaluating InnovAATe for
meeting the efficacy primary endpoint for registration, we recently filed an IND amendment with
both a revised Statistical Analysis Plan (SAP) and study protocol, and we expect further FDA feedback during the second half of
2024. If approved, these changes may allow for the acceleration of the program,” concluded
Mr. London.
Financial
Highlights for the Three Months Ended March 31, 2024
| ● | Total
revenues were $37.7 million in the first quarter of 2024, a 23% increase from the prior year
period. The increase in revenues was primarily attributable
to increased sales of CYTOGAM due to increased demand for the product in the U.S. market,
as well as increased sales of KEDRAB to Kedrion due
to increased market share in the U.S. |
| ● | Gross
profit and gross margins were $16.8 million and 44%, respectively, in the first quarter of
2024, compared to $11.9 million and 39%, respectively, reported in the prior year period.
Cost of goods sold in the Company’s Proprietary segment for each of the first quarter
of 2024 and 2023 included $1.3 million of depreciation expenses associated with intangible
assets generated through the IgG products acquisition. |
| ● | Operating
expenses, including R&D, Sales & Marketing (S&M), G&A and other expenses,
totaled $12.7 million in the first quarter of 2024, as compared to $11.6 million in the first
quarter of 2023. S&M costs for the first quarter of 2024 and 2023 included $0.4 million
of amortization expenses of intangible assets generated through the IgG products acquisition. |
| ● | Net
income was $2.4 million, or $0.04 per share, in the first quarter of 2024, as compared to
a net loss of $1.8 million, or $(0.04) per share, in the first quarter of 2023. |
| ● | Adjusted
EBITDA, as detailed in the tables below, was $7.5 million in the first quarter of 2024, a
96% increase from the $3.8 million in the first quarter of 2023. |
| ● | Cash
provided by operating activities was $1.0 million in the first quarter of 2024, as compared
to cash used in operating activities of $2.9 million in the first quarter of 2023. |
Balance
Sheet Highlights
As
of March 31, 2024, the Company had cash, cash equivalents, and short-term investments of $48.2 million, as compared to $55.6 million
on December 31, 2023. The decrease in cash balance was attributable to capital investments made with respect to the construction of our
new plasma collection center in Uvalde, Texas, and payment on account of long-term liabilities associated with the acquisition completed
in November 2021.
Recent
Corporate Highlights
| ● | During
the first quarter of 2024, Kamada completed the successful launch in Israel of BEVACIZUMAB
KAMADA, the biosimilar to Avastin®, which is indicated for the treatment of certain
types of cancer, including colon cancer and metastatic breast cancer. This represents the
first biosimilar product to be launched and distributed by Kamada in Israel. The product
is manufactured by mAbxience Research S.L., from Madrid, Spain. |
Fiscal
Year 2024 Guidance
Based
on the Company’s strong performance in the first quarter and its expectation for continued momentum in the business throughout
2024, Kamada is increasing its fiscal year 2024 total revenue guidance from a range of $156 million to $160 million to a range of $158
million to $162 million, and adjusted EBITDA from a range of $27 million to $30 million to a range of $28 million to $32 million, representing
double digit top- and bottom-line growth year-over-year.
Conference
Call
Kamada
management will host an investment community conference call today, Wednesday, May 8, 2024, at 8:30am Eastern Time to present the
Company’s results and answer questions. Shareholders and other interested parties may participate in the conference call by
dialing 1-888-886-7786 (from within the U.S.) or 1-809-468-221 (from Israel), or 1-416-764-8658 (International) and entering the
conference ID 31202863. The call will also be webcast live on the Internet at
https://viavid.webcasts.com/starthere.jsp?ei=1665369&tp_key=952bd14ce0
Non-IFRS
financial measures
We
present EBITDA and adjusted EBITDA because we use these non-IFRS financial measures to assess our operational performance, for financial
and operational decision-making, and as a means to evaluate period-to-period comparisons on a consistent basis. Management believes these
non-IFRS financial measures are useful to investors because: (1) they allow for greater transparency with respect to key metrics used
by management in its financial and operational decision-making and provide investors with a meaningful perspective on the current underlying
performance of the Company’s core ongoing operations; and (2) they exclude the impact of certain items that are not directly attributable
to our core operating performance and that may obscure trends in the core operating performance of the business. Non-IFRS financial measures
have limitations as an analytical tool and should not be considered in isolation from, or as a substitute for, our IFRS results. We expect
to continue reporting non-IFRS financial measures, adjusting for the items described below, and we expect to continue to incur expenses
similar to certain of the non-cash, non-IFRS adjustments described below. Accordingly, unless otherwise stated, the exclusion of these
and other similar items in the presentation of non-IFRS financial measures should not be construed as an inference that these items are
unusual, infrequent or non-recurring. EBITDA and adjusted EBITDA are not recognized terms under IFRS and do not purport to be an alternative
to IFRS terms as an indicator of operating performance or any other IFRS measure. Moreover, because not all companies use identical measures
and calculations, the presentation of EBITDA and adjusted EBITDA may not be comparable to other similarly titled measures of other companies.
EBITDA is defined as net income (loss), plus income tax expense, plus or minus financial income or expenses, net, plus or minus income
or expense in respect of securities measured at fair value, net, plus or minus income or expenses in respect of currency exchange differences
and derivatives instruments, net, plus depreciation and amortization expense, whereas adjusted EBITDA is the EBITDA plus non-cash share-based
compensation expenses and certain other costs.
For
the projected 2024 adjusted EBITDA information presented herein, the Company is unable to provide a reconciliation of this forward measure
to the most comparable IFRS financial measure because the information for these measures is dependent on future events, many of which
are outside of the Company’s control. Additionally, estimating such forward-looking measures and providing a meaningful reconciliation
consistent with the Company’s accounting policies for future periods is meaningfully difficult and requires a level of precision
that is unavailable for these future periods and cannot be accomplished without unreasonable effort. Forward-looking non-IFRS measures
are estimated in a manner consistent with the relevant definitions and assumptions noted in the Company’s adjusted EBITDA for historical
periods.
About
Kamada
Kamada
Ltd. (the “Company”) is a commercial stage global biopharmaceutical company with a portfolio of marketed products indicated
for rare and serious conditions and a leader in the specialty plasma-derived field, focused on diseases of limited treatment alternatives.
The Company is also advancing an innovative development pipeline targeting areas of significant unmet medical need. The Company’s
strategy is focused on driving profitable growth from its significant commercial catalysts as well as its manufacturing and development
expertise in the plasma-derived and biopharmaceutical fields. The Company’s commercial products portfolio includes six FDA approved
plasma-derived biopharmaceutical products: CYTOGAM®, KEDRAB®, WINRHO SDF®, VARIZIG®, HEPAGAM B® and GLASSIA®,
as well as KAMRAB®, KAMRHO (D)® and two types of equine-based anti-snake venom (ASV) products. The Company distributes its commercial
products portfolio directly, and through strategic partners or third-party distributors in more than 30 countries, including the U.S.,
Canada, Israel, Russia, Argentina, Brazil, India, Australia and other countries in Latin America, Europe, the Middle East, and Asia.
The Company leverages its expertise and presence in the Israeli market to distribute, for use in Israel, more than 25 pharmaceutical
products that are supplied by international manufacturers. During recent years the Company added eleven biosimilar products to its Israeli
distribution portfolio, which, subject to the European Medicines Agency (EMA) and the Israeli Ministry of Health approvals, are expected
to be launched in Israel through 2028. The Company owns an FDA licensed plasma collection center in Beaumont, Texas, which currently
specializes in the collection of hyper-immune plasma used in the manufacture of KAMRHO (D), KARAB and KEDRAB. In addition to the Company’s
commercial operation, it invests in research and development of new product candidates. The Company’s leading investigational product
is an inhaled AAT for the treatment of AAT deficiency, for which it is continuing to progress the InnovAATe clinical trial, a randomized,
double-blind, placebo-controlled, pivotal Phase 3 trial. FIMI Opportunity Funds, the leading private equity firm in Israel, is the Company’s
controlling shareholder, beneficially owning approximately 38% of the outstanding ordinary shares.
Cautionary
Note Regarding Forward-Looking Statements
This
release includes forward-looking statements within the meaning of Section 21E of the U.S. Securities Exchange Act of 1934, as amended,
and the safe harbor provisions of the U.S. Private Securities Litigation Reform Act of 1995. Forward-looking statements are statements
that are not historical facts, including statements regarding: 1) positive outlook for reminder of 2024, 2) anticipation of continued
momentum through 2024 and continued growth at double-digit rates beyond 2024, 3) Full-Year Revenue Guidance to be between $158 Million-$162
Million and Adjusted EBITDA to be between $28 Million-$32 Million, 4) being well-positioned for a highly successful year, 5) continuing
to maintain the overall financial strength supporting us in pursuing compelling new business development opportunities which would accelerate
the growth and profitability of our existing business beyond 2024, 6) continued enrollment in pivotal phase 3 InnovAATe clinical trial,
and 7) our expectations to receive FDA feedback to the IND amendment during the second half of 2024, which, if approved, may allow for
the acceleration of the InnovAATe program. Forward-looking statements are based on Kamada’s current knowledge and its present beliefs
and expectations regarding possible future events and are subject to risks, uncertainties and assumptions. Actual results and the timing
of events could differ materially from those anticipated in these forward-looking statements as a result of several factors including,
but not limited to the evolving nature of the conflicts in the Middle East and the impact of such conflicts in Israel, the Middle East
and the rest of the world, the impact of these conflicts on market conditions and the general economic, industry and political conditions
in Israel, the U.S. and globally, continuation of inbound and outbound international delivery routes, continued demand for Kamada’s
products, financial conditions of the Company’s customer, suppliers and services providers, Kamada’s ability to integrate
the new product portfolio into its current product portfolio, Kamada’s ability to grow the revenues of its new product portfolio,
and leverage and expand its international distribution network, ability to reap the benefits of the acquisition of the plasma collection
center, including the ability to open additional U.S. plasma centers, and acquisition of the FDA-approved plasma-derived hyperimmune
commercial products, the ability to continue enrollment of the pivotal Phase 3 InnovAATe clinical trial, unexpected results of clinical
studies, Kamada’s ability to manage operating expenses, additional competition in the markets that Kamada competes, regulatory
delays, prevailing market conditions and the impact of general economic, industry or political conditions in the U.S., Israel or otherwise,
and other risks detailed in Kamada’s filings with the U.S. Securities and Exchange Commission (the “SEC”) including
those discussed in its most recent Annual Report on Form 20-F and in any subsequent reports on Form 6-K, each of which is on file or
furnished with the SEC and available at the SEC’s website at www.sec.gov. The forward-looking statements made herein speak only
as of the date of this announcement and Kamada undertakes no obligation to update publicly such forward-looking statements to reflect
subsequent events or circumstances, except as otherwise required by law.
CONTACTS:
Chaime
Orlev
Chief
Financial Officer
IR@kamada.com
Brian
Ritchie
LifeSci
Advisors, LLC
212-915-2578
britchie@LifeSciAdvisors.com
CONDENCED
CONSOLIDATED INTERIM STATEMENTS OF FINANCIAL POSITTION
| | |
As of | | |
As of | |
| | |
March 31, | | |
December 31, | |
| | |
2024 | | |
2023 | | |
2023 | |
| | |
Unaudited | | |
Audited | |
| | |
| | |
| | |
| |
| Assets | |
| | |
| | |
| |
| Current Assets | |
| | |
| | |
| |
| Cash and cash equivalents | |
$ | 48,194 | | |
$ | 27,121 | | |
$ | 55,641 | |
| Trade receivables, net | |
| 18,855 | | |
| 20,925 | | |
| 19,877 | |
| Other accounts receivables | |
| 6,411 | | |
| 3,603 | | |
| 5,965 | |
| Inventories | |
| 84,348 | | |
| 79,754 | | |
| 88,479 | |
| Total Current Assets | |
| 157,808 | | |
| 131,403 | | |
| 169,962 | |
| | |
| | | |
| | | |
| | |
| Non-Current Assets | |
| | | |
| | | |
| | |
| Property, plant and equipment, net | |
| 30,727 | | |
| 26,496 | | |
| 28,224 | |
| Right-of-use assets | |
| 7,632 | | |
| 5,836 | | |
| 7,761 | |
| Intangible assets, Goodwill and other long-term assets | |
| 138,623 | | |
| 145,305 | | |
| 140,465 | |
| Contract assets | |
| 8,384 | | |
| 7,755 | | |
| 8,495 | |
| Total Non-Current Assets | |
| 185,366 | | |
| 185,392 | | |
| 184,945 | |
| Total Assets | |
$ | 343,174 | | |
$ | 316,795 | | |
$ | 354,907 | |
| Liabilities | |
| | | |
| | | |
| | |
| Current Liabilities | |
| | | |
| | | |
| | |
| Current maturities of bank loans | |
$ | - | | |
$ | 4,444 | | |
$ | - | |
| Current maturities of lease liabilities | |
| 1,467 | | |
| 1,438 | | |
| 1,384 | |
| Current maturities of other long-term liabilities | |
| 12,980 | | |
| 29,414 | | |
| 14,996 | |
| Trade payables | |
| 16,492 | | |
| 26,210 | | |
| 24,804 | |
| Other accounts payables | |
| 6,210 | | |
| 7,350 | | |
| 8,261 | |
| Deferred revenues | |
| 26 | | |
| 419 | | |
| 148 | |
| Total Current Liabilities | |
| 37,175 | | |
| 69,275 | | |
| 49,593 | |
| | |
| | | |
| | | |
| | |
| Non-Current Liabilities | |
| | | |
| | | |
| | |
| Bank loans | |
| - | | |
| 11,852 | | |
| - | |
| Lease liabilities | |
| 7,278 | | |
| 4,992 | | |
| 7,438 | |
| Contingent consideration | |
| 16,760 | | |
| 18,115 | | |
| 18,855 | |
| Other long-term liabilities | |
| 34,842 | | |
| 37,280 | | |
| 34,379 | |
| Employee benefit liabilities, net | |
| 609 | | |
| 473 | | |
| 621 | |
| Total Non-Current Liabilities | |
| 59,489 | | |
| 72,712 | | |
| 61,293 | |
| | |
| | | |
| | | |
| | |
| Shareholder’s Equity | |
| | | |
| | | |
| | |
| Ordinary shares | |
| 15,022 | | |
| 11,736 | | |
| 15,021 | |
| Additional paid in capital net | |
| 266,183 | | |
| 210,665 | | |
| 265,848 | |
| Capital reserve due to translation to presentation currency | |
| (3,490 | ) | |
| (3,490 | ) | |
| (3,490 | ) |
| Capital reserve from hedges | |
| 12 | | |
| (99 | ) | |
| 140 | |
| Capital reserve from share-based payments | |
| 6,336 | | |
| 5,750 | | |
| 6,427 | |
| Capital reserve from employee benefits | |
| 282 | | |
| 539 | | |
| 275 | |
| Accumulated deficit | |
| (37,835 | ) | |
| (50,293 | ) | |
| (40,200 | ) |
| Total Shareholder’s Equity | |
| 246,510 | | |
| 174,808 | | |
| 244,021 | |
| Total Liabilities and Shareholder’s Equity | |
$ | 343,174 | | |
$ | 316,795 | | |
$ | 354,907 | |
CONDENCED
CONSOLIDATED INTERIM OF PROFIT OR LOSS AND OTHER COMPREHENSIVE INCOME
| | |
Three months period ended | | |
Year ended | |
| | |
March 31, | | |
December 31, | |
| | |
2024 | | |
2023 | | |
2023 | |
| | |
Unaudited | | |
Audited | |
| | |
| | |
| | |
| |
| Revenues from proprietary products | |
$ | 33,758 | | |
$ | 24,061 | | |
$ | 115,458 | |
| Revenues from distribution | |
| 3,978 | | |
| 6,649 | | |
| 27,061 | |
| | |
| | | |
| | | |
| | |
| Total revenues | |
| 37,736 | | |
| 30,710 | | |
| 142,519 | |
| | |
| | | |
| | | |
| | |
| Cost of revenues from proprietary products | |
| 17,620 | | |
| 13,224 | | |
| 63,342 | |
| Cost of revenues from distribution | |
| 3,365 | | |
| 5,647 | | |
| 23,687 | |
| | |
| | | |
| | | |
| | |
| Total cost of revenues | |
| 20,985 | | |
| 18,871 | | |
| 87,029 | |
| | |
| | | |
| | | |
| | |
| Gross profit | |
| 16,751 | | |
| 11,839 | | |
| 55,490 | |
| | |
| | | |
| | | |
| | |
| Research and development expenses | |
| 4,295 | | |
| 3,231 | | |
| 13,933 | |
| Selling and marketing expenses | |
| 4,631 | | |
| 3,922 | | |
| 16,193 | |
| General and administrative expenses | |
| 3,786 | | |
| 3,418 | | |
| 14,381 | |
| Other expenses | |
| - | | |
| 979 | | |
| 919 | |
| Operating income (loss) | |
| 4,039 | | |
| 289 | | |
| 10,064 | |
| | |
| | | |
| | | |
| | |
| Financial income | |
| 280 | | |
| 25 | | |
| 588 | |
| Income (expenses) in respect of currency exchange differences and derivatives instruments, net | |
| 124 | | |
| 151 | | |
| 55 | |
| Financial Income (expense) in respect of contingent consideration and other long- term liabilities. | |
| (1,845 | ) | |
| (1,761 | ) | |
| (980 | ) |
| Financial expenses | |
| (159 | ) | |
| (500 | ) | |
| (1,298 | ) |
| Income before tax on income | |
| 2,439 | | |
| (1,796 | ) | |
| 8,429 | |
| Taxes on income | |
| 74 | | |
| 13 | | |
| 145 | |
| | |
| | | |
| | | |
| | |
| Net Income (loss) | |
$ | 2,365 | | |
$ | (1,809 | ) | |
$ | 8,284 | |
| | |
| | | |
| | | |
| | |
| Other Comprehensive Income (loss): | |
| | | |
| | | |
| | |
| Amounts that will be or that have been reclassified to profit or loss when specific conditions are met | |
| | | |
| | | |
| | |
| Gain (loss) on cash flow hedges | |
| (71 | ) | |
| (156 | ) | |
| (186 | ) |
| Net amounts transferred to the statement of profit or loss for cash flow hedges | |
| (57 | ) | |
| 145 | | |
| 414 | |
| Items that will not be reclassified to profit or loss in subsequent periods: | |
| | | |
| | | |
| | |
| Remeasurement gain (loss) from defined benefit plan | |
| 7 | | |
| 191 | | |
| (73 | ) |
| Total comprehensive income (loss) | |
$ | 2,244 | | |
$ | (1,629 | ) | |
$ | 8,439 | |
| | |
| | | |
| | | |
| | |
| Earnings per share attributable to equity holders of the Company: | |
| | | |
| | | |
| | |
| Basic net earnings per share | |
$ | 0.04 | | |
$ | (0.04 | ) | |
$ | 0.17 | |
| Diluted net earnings per share | |
$ | 0.04 | | |
$ | (0.04 | ) | |
$ | 0.15 | |
CONDENCED
CONSOLIDATED INTERIM STATEMENTS OF CASH FLOWS
| | |
Three months period Ended | | |
Year Ended | |
| | |
March 31, | | |
December 31, | |
| | |
2024 | | |
2023 | | |
2023 | |
| | |
Unaudited | | |
Audited | |
| | |
| | |
| | |
| |
| Cash Flows from Operating Activities | |
| | |
| | |
| |
| Net income (loss) | |
$ | 2,365 | | |
$ | (1,809 | ) | |
$ | 8,284 | |
| | |
| | | |
| | | |
| | |
| Adjustments to reconcile net income to net cash provided by (used in) operating activities: | |
| | | |
| | | |
| | |
| | |
| | | |
| | | |
| | |
| Adjustments to the profit or loss items: | |
| | | |
| | | |
| | |
| | |
| | | |
| | | |
| | |
| Depreciation and amortization | |
| 3,237 | | |
| 3,123 | | |
| 12,714 | |
| Financial expenses (income), net | |
| 1,600 | | |
| 2,085 | | |
| 1,635 | |
| Cost of share-based payment | |
| 241 | | |
| 415 | | |
| 1,314 | |
| Taxes on income | |
| 74 | | |
| 13 | | |
| 145 | |
| Loss (gain) from sale of property and equipment | |
| - | | |
| (22 | ) | |
| (5 | ) |
| Change in employee benefit liabilities, net | |
| (4 | ) | |
| (8 | ) | |
| (125 | ) |
| | |
| 5,148 | | |
| 5,606 | | |
| 15,678 | |
| Changes in asset and liability items: | |
| | | |
| | | |
| | |
| | |
| | | |
| | | |
| | |
| Decrease (increase) in trade receivables, net | |
| 610 | | |
| 6,306 | | |
| 7,835 | |
| Decrease (increase) in other accounts receivables | |
| (516 | ) | |
| 1,362 | | |
| (1,150 | ) |
| Decrease (increase) in inventories | |
| 4,131 | | |
| (10,970 | ) | |
| (19,694 | ) |
| Decrease (increase) in deferred expenses | |
| 112 | | |
| 3,554 | | |
| 2,814 | |
| Decrease (increase) in trade payables | |
| (8,785 | ) | |
| (6,712 | ) | |
| (8,885 | ) |
| Decrease (increase) in other accounts payables | |
| (2,051 | ) | |
| (238 | ) | |
| 765 | |
| Decrease (increase) in deferred revenues | |
| (122 | ) | |
| 384 | | |
| 113 | |
| | |
| (6,621 | ) | |
| (6,314 | ) | |
| (18,202 | ) |
| Cash received (paid) during the period for: | |
| | | |
| | | |
| | |
| | |
| | | |
| | | |
| | |
| Interest paid | |
| (129 | ) | |
| (341 | ) | |
| (1,228 | ) |
| Interest received | |
| 280 | | |
| 25 | | |
| - | |
| Taxes paid | |
| (23 | ) | |
| (18 | ) | |
| (217 | ) |
| | |
| 128 | | |
| (334 | ) | |
| (1,445 | ) |
| | |
| | | |
| | | |
| | |
| Net cash provided by (used in) operating activities | |
$ | 1,020 | | |
$ | (2,851 | ) | |
$ | 4,315 | |
CONDENCED
CONSOLIDATED INTERIM STATEMENTS OF CASH FLOWS (continued)
| | |
Three months period Ended | | |
Year Ended | |
| | |
March 31, | | |
December 31, | |
| | |
2024 | | |
2023 | | |
2023 | |
| | |
Unaudited | | |
Audited | |
| | |
| | |
| | |
| |
| Cash Flows from Investing Activities | |
| | | |
| | | |
| | |
| Purchase of property and equipment and intangible assets | |
$ | (2,682 | ) | |
$ | (1,117 | ) | |
$ | (5,850 | ) |
| Proceeds from sale of property and equipment | |
| - | | |
| 24 | | |
| 7 | |
| Net cash provided by (used in) investing activities | |
| (2,682 | ) | |
| (1,093 | ) | |
| (5,843 | ) |
| | |
| | | |
| | | |
| | |
| Cash Flows from Financing Activities | |
| | | |
| | | |
| | |
| | |
| | | |
| | | |
| | |
| Proceeds from exercise of share base payments | |
| 1 | | |
| 1 | | |
| 4 | |
| Proceeds from issuance of ordinary shares, net | |
| - | | |
| - | | |
| 58,231 | |
| Repayment of lease liabilities | |
| (244 | ) | |
| (271 | ) | |
| (850 | ) |
| Repayment of long-term loans | |
| - | | |
| (1,111 | ) | |
| (17,407 | ) |
| Repayment of other long-term liabilities | |
| (5,496 | ) | |
| (1,500 | ) | |
| (17,300 | ) |
| Net cash provided by (used in) financing activities | |
| (5,739 | ) | |
| (2,881 | ) | |
| 22,678 | |
| | |
| | | |
| | | |
| | |
| Exchange differences on balances of cash and cash equivalent | |
| (46 | ) | |
| (312 | ) | |
| 233 | |
| | |
| | | |
| | | |
| | |
| Increase (decrease) in cash and cash equivalents | |
| (7,447 | ) | |
| (7,137 | ) | |
| 21,383 | |
| | |
| | | |
| | | |
| | |
| Cash and cash equivalents at the beginning of the period | |
| 55,641 | | |
| 34,258 | | |
| 34,258 | |
| | |
| | | |
| | | |
| | |
| Cash and cash equivalents at the end of the period | |
$ | 48,194 | | |
$ | 27,121 | | |
$ | 55,641 | |
| | |
| | | |
| | | |
| | |
| Significant non-cash transactions | |
| | | |
| | | |
| | |
| Right-of-use asset recognized with corresponding lease liability | |
$ | 306 | | |
$ | 3,580 | | |
$ | 6,546 | |
| Purchase of property and equipment and Intangible assets | |
$ | 905 | | |
$ | 292 | | |
$ | 646 | |
NON-IFRS
MEASURES – ADJUSTED EBITDA
| | |
Three months period Ended | | |
Year ended | |
| | |
March 31, | | |
December 31, | |
| | |
2024 | | |
2023 | | |
2023 | |
| | |
U.S. Dollars in thousands | |
| Net (loss) income | |
$ | 2,365 | | |
$ | (1,809 | ) | |
$ | 8,284 | |
| Taxes on income | |
| 74 | | |
| 13 | | |
| 145 | |
| Financial expense (income), net | |
| 1,600 | | |
| 2,085 | | |
| 1,635 | |
| Depreciation and amortization expense | |
| 3,237 | | |
| 3,123 | | |
| 12,714 | |
| Non-cash share-based compensation expenses | |
| 241 | | |
| 415 | | |
| 1,314 | |
| Adjusted EBITDA | |
$ | 7,517 | | |
$ | 3,827 | | |
$ | 24,092 | |
Exhibit
99.2

INVESTORS MEETING NASDAQ & TASE: KMDA May 2024 May 8, 2024
May 8, 2024 Forward - Looking Statement This presentation is not intended to provide investment or medical advice. It should be noted that some products under develo pme nt described herein have not been found safe or effective by any regulatory agency and are not approved for any use outside of clinical trials. This presentation contains forward - looking statements, which express the current beliefs and expectations of Kamada’s management . Such statements include the 2024 financial guidance, success of the inhaled AAT clinical study, its benefits and potential market size, success of the U.S. plasma collection expa nsi on and revenue potential, and success in launching new products in the Israeli distribution business segment. These statements involve a number of known and unknown risks and unce rta inties that could cause Kamada's future results, performance or achievements to differ significantly from the prospected results, performances or achievements expressed or im pli ed by such forward - looking statements. Important factors that could cause or contribute to such differences include, but are not limited to, risks relating to Kamada's ability to suc ces sfully develop, manufacture and commercialize its products and product candidates, the progress and results of any clinical trials, the introduction of competing products, the continued ma rke t acceptance of Kamada’s commercial products portfolio, the impact of any changes in regulation and legislation that could affect the pharmaceutical industry, the difficulty of predicti ng, obtaining or maintaining U.S. Food and Drug Administration, European Medicines Agency and other regulatory authority approvals, the regulatory environment, restrains related to third pa rti es’ IP rights and changes in the health policies and structures of various countries, success of M&A strategies, environmental risks, changes in the worldwide pharmaceutical indu str y and other factors that are discussed under the heading “Risk Factors” of Kamada’s 2023 Annual Report on Form 20 - F (filed on March 6, 2024), as well as in Kamada’s recent Forms 6 - K fil ed with the U.S. Securities and Exchange Commission. This presentation includes certain non - IFRS financial information, which is not intended to be considered in isolation or as a s ubstitute for, or superior to, the financial information prepared and presented in accordance with IFRS. The non - IFRS financial measures may be calculated differently from, and therefore may not be comparable to, similarly titled measures used by other companies. In accordance with the requirement of the SEC regulations a reconciliation of these non - IFRS financial measures to th e comparable IFRS measures is included in an appendix to this presentation. Management uses these non - IFRS financial measures for financial and operational decision - making and as a mean s to evaluate period - to - period comparisons. Management believes that these non - IFRS financial measures provide meaningful supplemental information regarding Kamada’s perfor mance and liquidity. For additional information regarding use of non - IFRS measures, see “Item 5. Operating and Financial Review and Prospectus – Non - IFRS Financial Measures” of Kamada’s 2023 Annual Report on Form 20 - F filed with the U.S Securities and Exchange Commission on March 6, 2024. Forward - looking statements speak only as of the date they are made, and Kamada undertakes no obligation to update any forward - lo oking statement to reflect the impact of circumstances or events that arise after the date the forward - looking statement was made, except as required by applicable securities laws. Yo u should not place undue reliance on any forward - looking statement and should consider the uncertainties and risks noted above, as well as the risks and uncertainties more fully disc uss ed under the heading “Risk Factors” of Kamada’s 2023 Annual Report on Form 20 - F (filed on March 6, 2024) as well as in Kamada’s recent Forms 6 - K filed with the U.S. Securities and Exchange Commission. 2
May 8, 2024 Strong First Quarter 2024 Financial Results Gross Profit Revenue Q1 - 23 Q1 - 24 Q1 - 23 Q1 - 24 41% $11.9 $ 16.8 23% $30.7 $37.7 Adj. EBITDA Net Income Q1 - 23 Q1 - 24 Q1 - 23 Q1 - 24 96% $3.8 $7.5 n/a $(1.8) $2.4 Leveraging the strength of our entire commercial portfolio and specifically the two most important growth drivers KEDRAB® and CYTOGAM® 3 All amounts are in U.S.$ in millions
May 8, 2024 Financial Growth Trajectory 104 129 143 158 - 162 2021 2022 2023 2024 Revenues US$M 6 18 24 28 - 32 2021 2022 2023 2024 Adjusted EBITDA US$M 2024 represents annual guidance 2024 represents annual guidance Adjusted EBITDA is defined as net income, plus ( i ) tax expense, (ii) financial income (expense), net, (iii) depreciation and amortization; and (v) non - cash share - based compensation expenses Strong First Quarter Results & Positive Outlook for Remainder of 2024 Support Increase of Full - Year Revenue Guidance to $ 158 - 162 Million and Adjusted EBITDA to $ 28 - 32 Million 4

May 8, 2024 6 FDA - Approved Specialty Plasma Products Key Focus On Transplantation & Rare Conditions GLASSIA® [Alpha1 - Proteinase Inhibitor (Human)] Augmentation therapy for Alpha - 1 Antitrypsin Deficiency (AATD) WINRHO® [Rho(D) Immune Globulin (Human)] Treatment of ITP & suppression of Rh isoimmunization (HDN) VARIZIG® [Varicella Zoster Immune Globulin (Human)] Post - exposure prophylaxis of varicella in high - risk patients HEPGAM B® [Hepatitis B Immune Globulin (Human)] Prevention of HBV recurrence following liver transplantation CYTOGAM® [Cytomegalovirus Immune Globulin (Human)] Prophylaxis of CMV disease associated with transplantation KEDRAB® [Rabies Immune Globulin (Human)] Post exposure prophylaxis of rabies infection 5
May 8 , 2024 Inhaled AAT Phase 3 Pivotal Study Global, double - blind, randomized, placebo - controlled pivotal Phase 3 clinical trial testing the safety and efficacy of inhaled AAT in patients with AATD. Study design meets FDA and EMA’s requirements • FDA recently reconfirmed overall study design, endorsed positive safety data to date, and expressed willingness to potentially accept a P< 0 . 1 alpha level in evaluating the trial’s efficacy primary endpoint for registration • Following positive feedback from FDA, filed an IND amendment with revised statistical analysis plan and study protocol, expecting FDA feedback during H 2 / 2024 • If approved, these changes may allow for the acceleration of the program Inhaled AAT Targeting a Market of over $1B 6
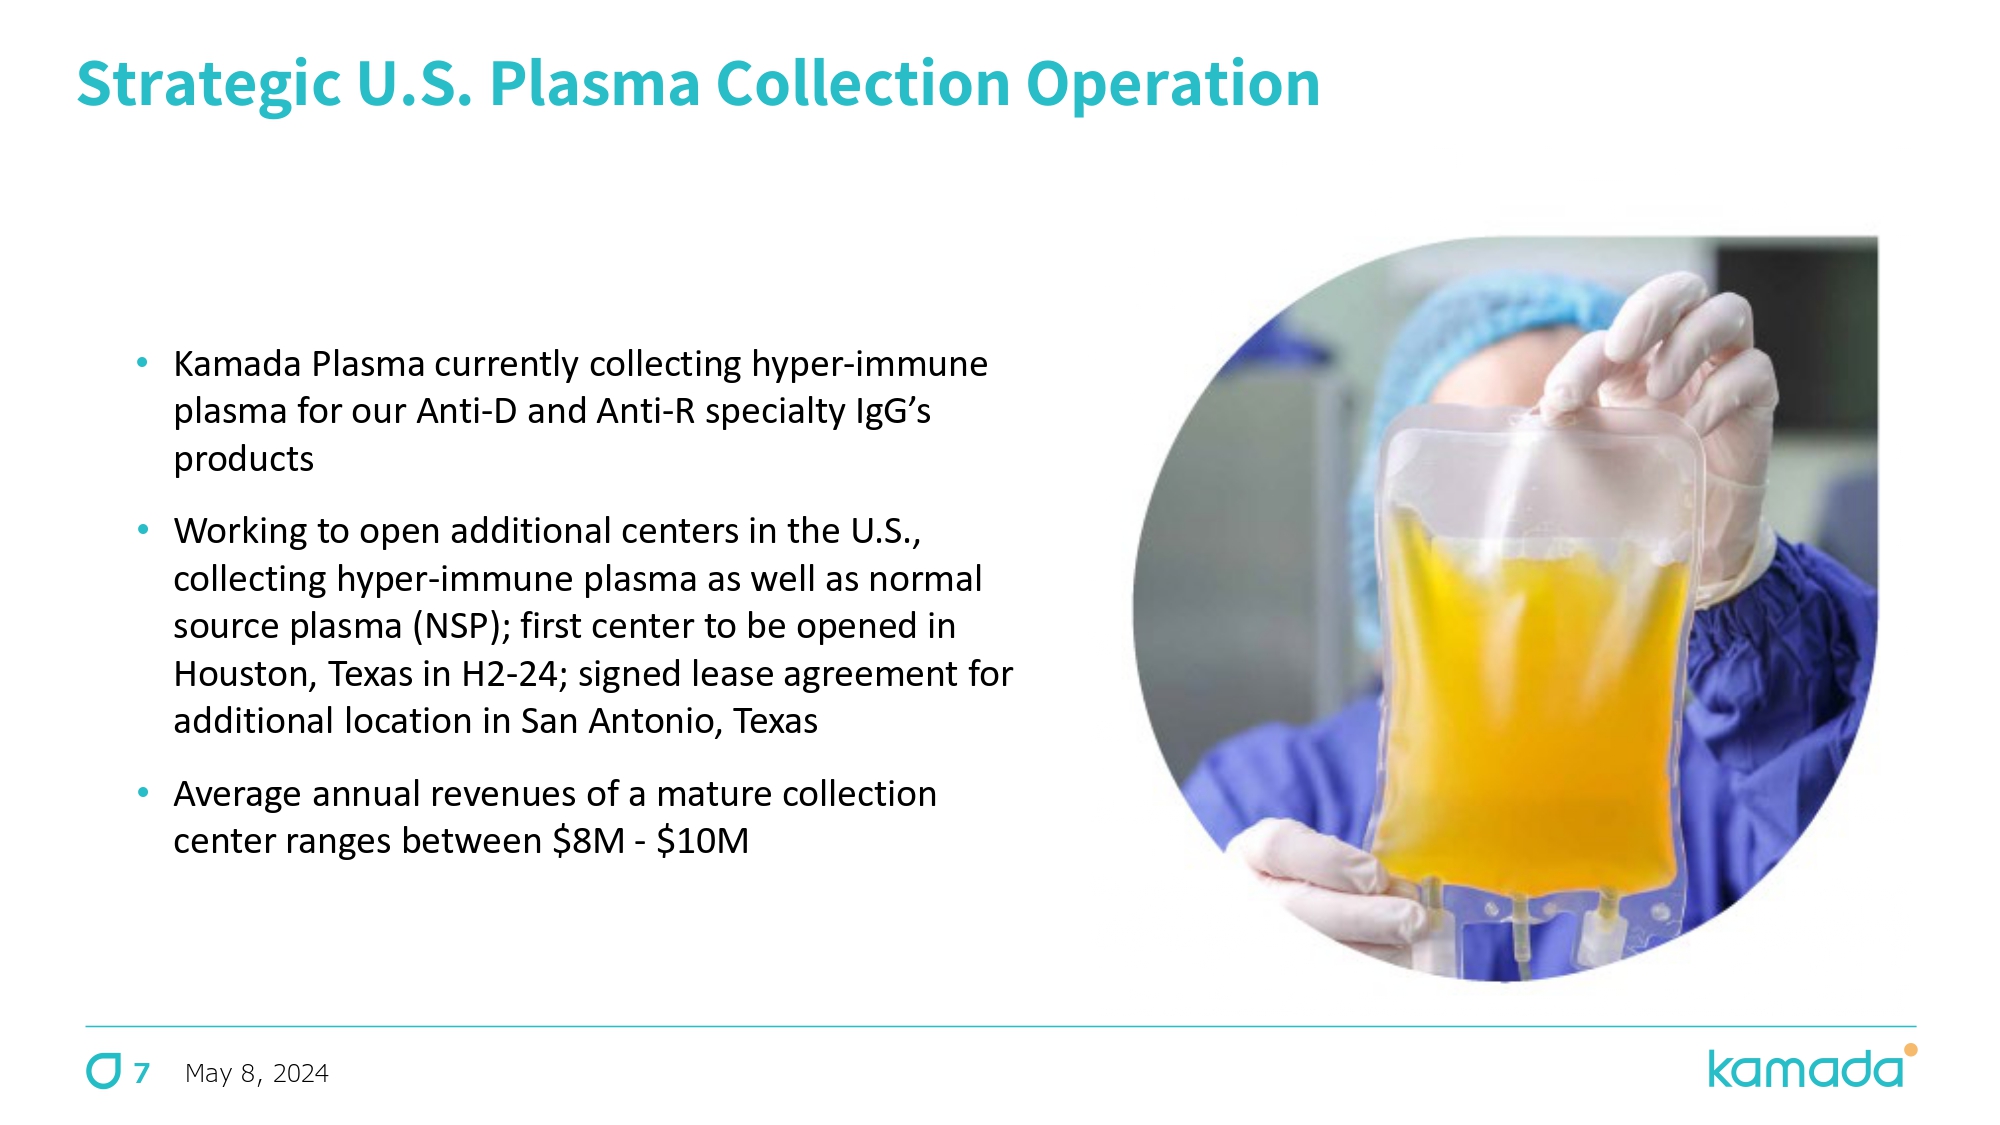
May 8, 2024 Strategic U.S. Plasma Collection Operation • Kamada Plasma currently collecting hyper - immune plasma for our Anti - D and Anti - R specialty IgG ’ s products • Working to open additional centers in the U.S., collecting hyper - immune plasma as well as normal source plasma (NSP); first center to be opened in Houston, Texas in H 2 - 24 ; signed lease agreement for additional location in San Antonio, Texas • Average annual revenues of a mature collection center ranges between $ 8 M - $ 10 M 7
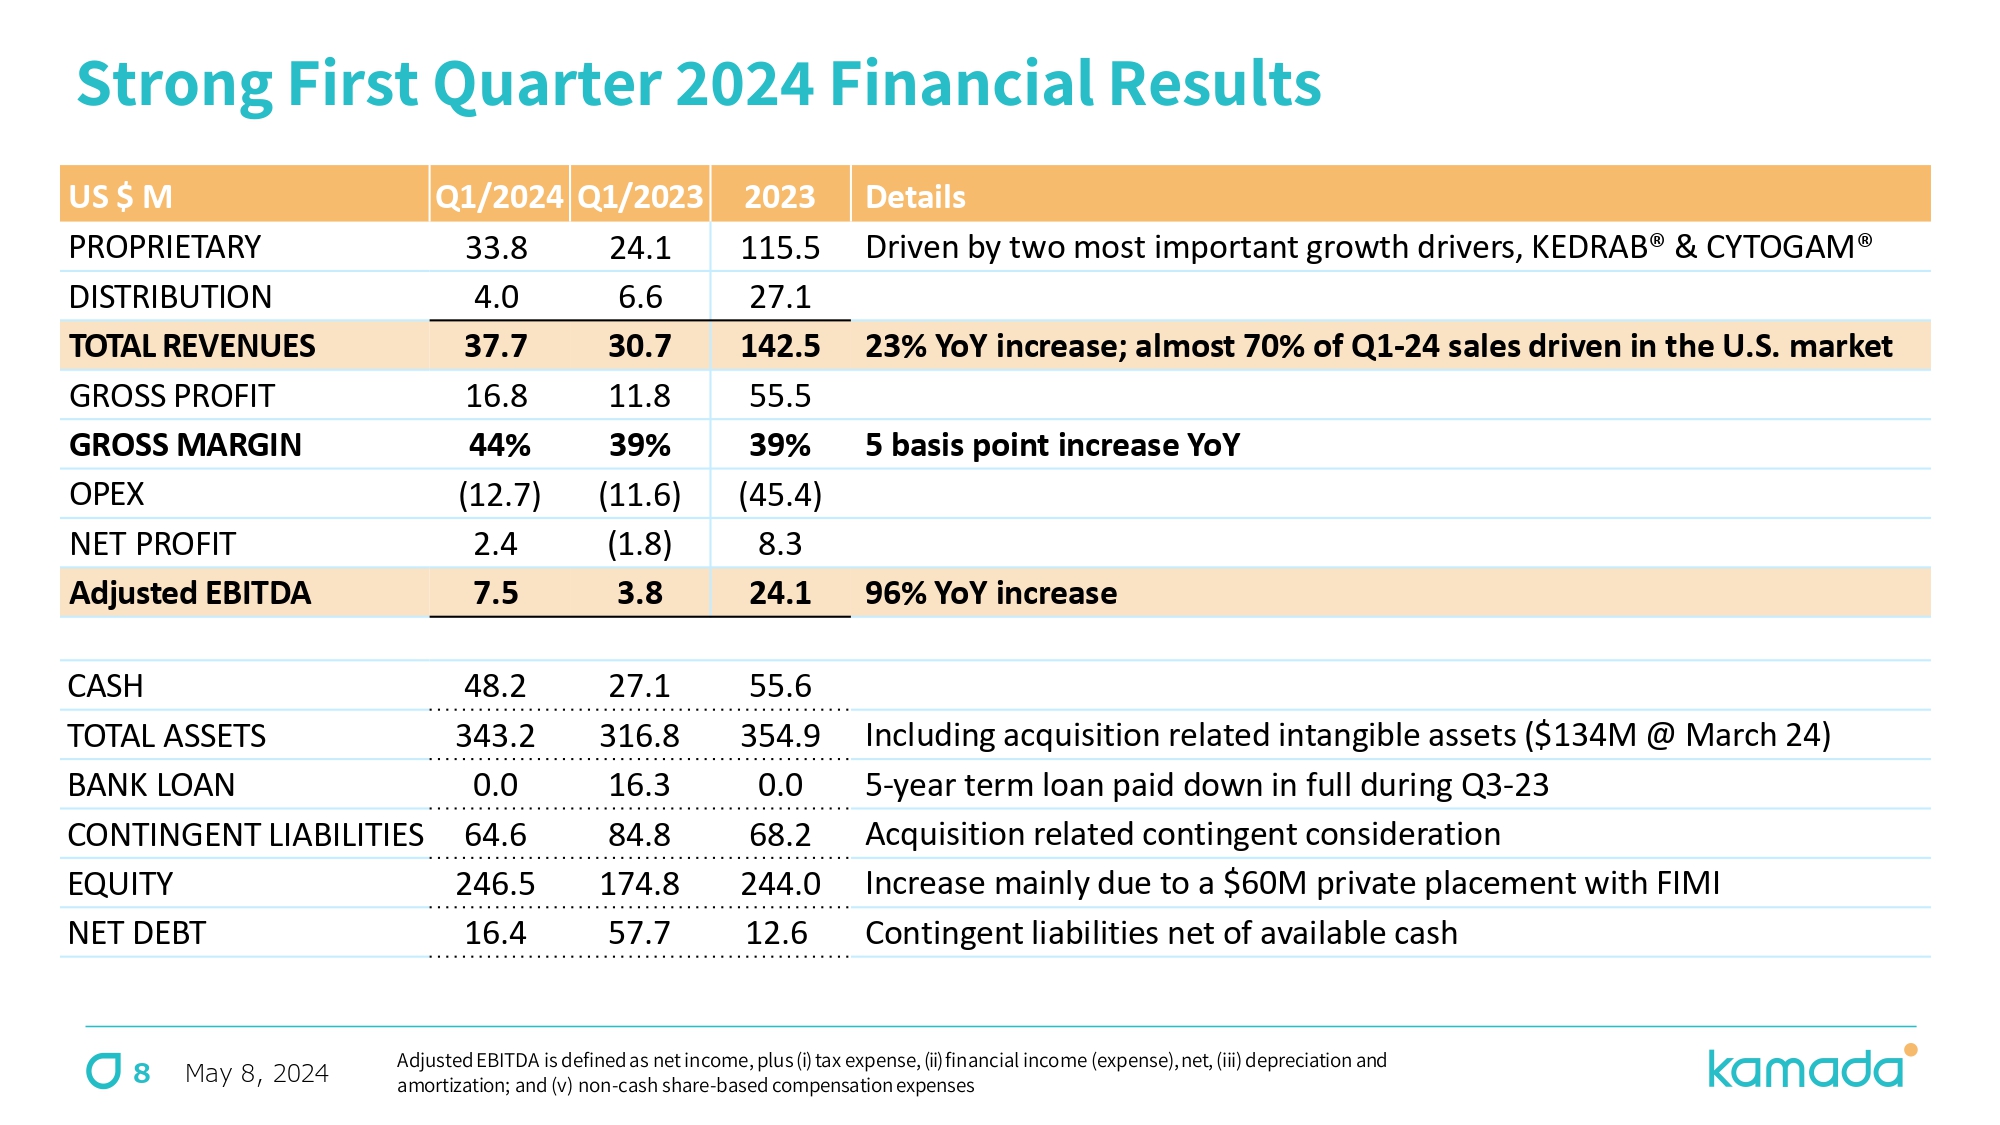
May 8, 2024 Strong First Quarter 2024 Financial Results Details 2023 Q1/2023 Q1/2024 US $ M Driven by two most important growth drivers, KEDRAB® & CYTOGAM® 115.5 24.1 33.8 PROPRIETARY 27.1 6.6 4.0 DISTRIBUTION 23% YoY increase; almost 70% of Q1 - 24 sales driven in the U.S. market 142.5 30.7 37.7 TOTAL REVENUES 55.5 11.8 16.8 GROSS PROFIT 5 basis point increase YoY 39% 39% 44 % GROSS MARGIN (45.4) (11.6) ( 12.7 ) OPEX 8.3 (1.8) 2.4 NET PROFIT 96% YoY increase 24.1 3.8 7.5 Adjusted EBITDA 55.6 27.1 48.2 CASH Including acquisition related intangible assets ($134M @ March 24) 354.9 316.8 343.2 TOTAL ASSETS 5 - year term loan paid down in full during Q3 - 23 0.0 16.3 0.0 BANK LOAN Acquisition related contingent consideration 68.2 84.8 64.6 CONTINGENT LIABILITIES Increase mainly due to a $60M private placement with FIMI 244.0 174.8 246.5 EQUITY Contingent liabilities net of available cash 12.6 57.7 16.4 NET DEBT Adjusted EBITDA is defined as net income, plus (i) tax expense, (ii) financial income (expense), net, (iii) depreciation and amortization ; and (v) non - cash share - based compensation expenses 8

Kamada Highlights • 6 FDA - approved products with global commercial network selling in over 30 countries • Multiple growth drivers, with significant upside potential and limited downside risk • Financially strong to accelerate growth and pursue new business development opportunities • Leading innovative product for AATD in late - stage development; targeting a market of over $1B A growing commercial - stage global biopharmaceutical company with a portfolio of marketed products indicated for rare and serious conditions, and a leader in the specialty plasma - derived field Projected continued double - digit growth of revenues and profitability beyond 2024 2024 Guidance of $158 - 162 Million of Revenues and $28 - 32 Million of Adjusted EBITDA May 8, 2024 9

THANK YOU www.kamada.com
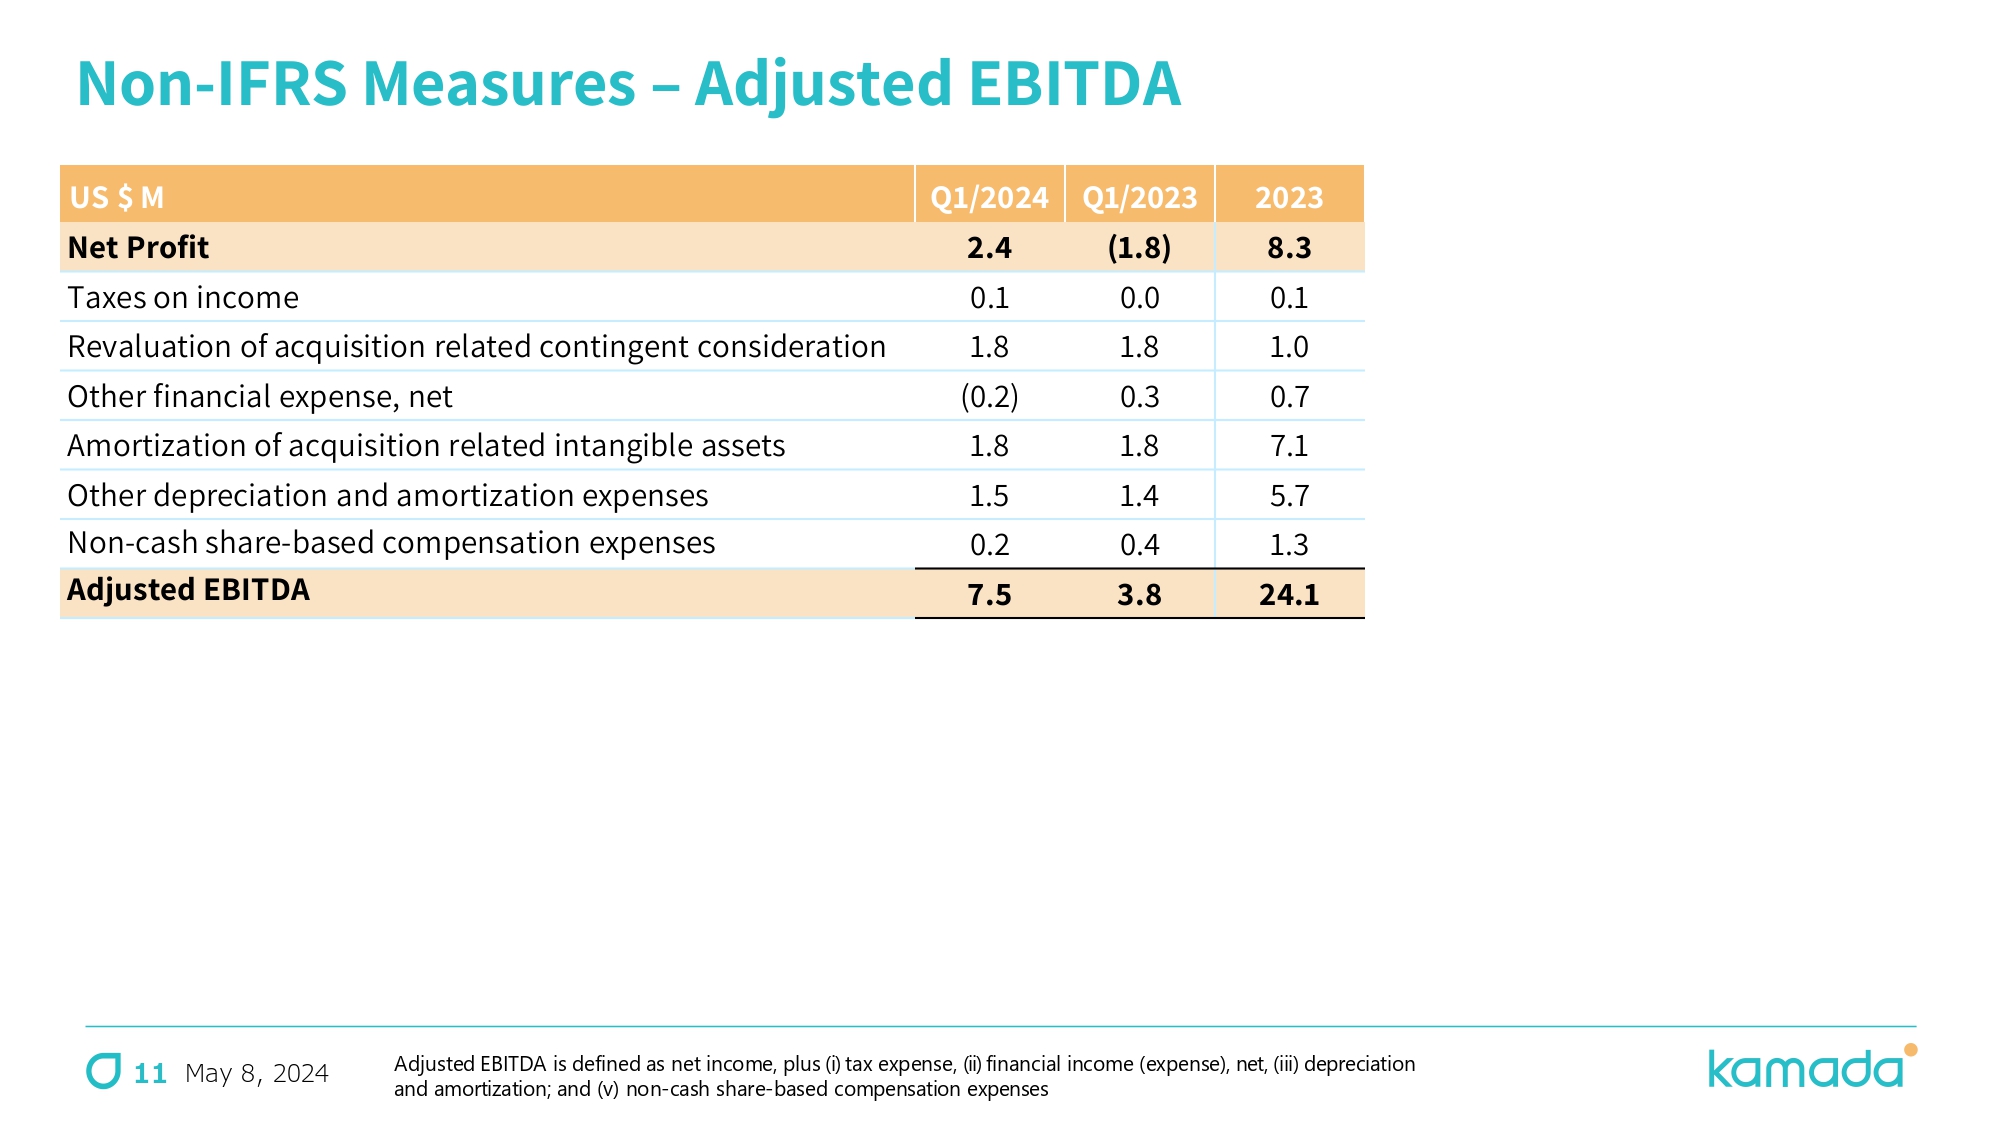
May 8, 2024 Non - IFRS Measures – Adjusted EBITDA 2023 Q1/2023 Q1/2024 US $ M 8.3 (1.8) 2.4 Net Profit 0.1 0.0 0.1 Taxes on income 1.0 1.8 1.8 Revaluation of acquisition related contingent consideration 0.7 0.3 (0.2) Other financial expense, net 7.1 1.8 1.8 Amortization of acquisition related intangible assets 5.7 1.4 1.5 Other depreciation and amortization expenses 1.3 0.4 0.2 Non - cash share - based compensation expenses 24.1 3.8 7.5 Adjusted EBITDA Adjusted EBITDA is defined as net income, plus (i) tax expense, (ii) financial income (expense), net, (iii) depreciation and amortization ; and (v) non - cash share - based compensation expenses 11
Exhibit 99.3
KAMADA LTD.
CONDENSED CONSOLIDATED INTERIM FINANCIAL
STATEMENTS
AS OF MARCH 31, 2024
TABLE OF CONTENTS
- - - - - - - - - - -
KAMADA LTD.
Condensed Consolidated
Interim Statements of Financial Position
| | |
As of | | |
As of | |
| | |
March 31, | | |
December 31, | |
| | |
2024 | | |
2023 | | |
2023 | |
| | |
Unaudited | | |
Audited | |
| | |
| | |
| | |
| |
| Assets | |
| | |
| | |
| |
| Current Assets | |
| | |
| | |
| |
| Cash and cash equivalents | |
$ | 48,194 | | |
$ | 27,121 | | |
$ | 55,641 | |
| Trade receivables, net | |
| 18,855 | | |
| 20,925 | | |
| 19,877 | |
| Other accounts receivables | |
| 6,411 | | |
| 3,603 | | |
| 5,965 | |
| Inventories | |
| 84,348 | | |
| 79,754 | | |
| 88,479 | |
| Total Current Assets | |
| 157,808 | | |
| 131,403 | | |
| 169,962 | |
| | |
| | | |
| | | |
| | |
| Non-Current Assets | |
| | | |
| | | |
| | |
| Property, plant and equipment, net | |
| 30,727 | | |
| 26,496 | | |
| 28,224 | |
| Right-of-use assets | |
| 7,632 | | |
| 5,836 | | |
| 7,761 | |
| Intangible assets, Goodwill and other long-term assets | |
| 138,623 | | |
| 145,305 | | |
| 140,465 | |
| Contract assets | |
| 8,384 | | |
| 7,755 | | |
| 8,495 | |
| Total Non-Current Assets | |
| 185,366 | | |
| 185,392 | | |
| 184,945 | |
| Total Assets | |
$ | 343,174 | | |
$ | 316,795 | | |
$ | 354,907 | |
| Liabilities | |
| | | |
| | | |
| | |
| Current Liabilities | |
| | | |
| | | |
| | |
| Current maturities of bank loans | |
$ | - | | |
$ | 4,444 | | |
$ | - | |
| Current maturities of lease liabilities | |
| 1,467 | | |
| 1,438 | | |
| 1,384 | |
| Current maturities of other long term liabilities | |
| 12,980 | | |
| 29,414 | | |
| 14,996 | |
| Trade payables | |
| 16,492 | | |
| 26,210 | | |
| 24,804 | |
| Other accounts payables | |
| 6,210 | | |
| 7,350 | | |
| 8,261 | |
| Deferred revenues | |
| 26 | | |
| 419 | | |
| 148 | |
| Total Current Liabilities | |
| 37,175 | | |
| 69,275 | | |
| 49,593 | |
| | |
| | | |
| | | |
| | |
| Non-Current Liabilities | |
| | | |
| | | |
| | |
| Bank loans | |
| - | | |
| 11,852 | | |
| - | |
| Lease liabilities | |
| 7,278 | | |
| 4,992 | | |
| 7,438 | |
| Contingent consideration | |
| 16,760 | | |
| 18,115 | | |
| 18,855 | |
| Other long-term liabilities | |
| 34,842 | | |
| 37,280 | | |
| 34,379 | |
| Employee benefit liabilities, net | |
| 609 | | |
| 473 | | |
| 621 | |
| Total Non-Current Liabilities | |
| 59,489 | | |
| 72,712 | | |
| 61,293 | |
| | |
| | | |
| | | |
| | |
| Shareholder’s Equity | |
| | | |
| | | |
| | |
| Ordinary shares | |
| 15,022 | | |
| 11,736 | | |
| 15,021 | |
| Additional paid in capital net | |
| 266,183 | | |
| 210,665 | | |
| 265,848 | |
| Capital reserve due to translation to presentation currency | |
| (3,490 | ) | |
| (3,490 | ) | |
| (3,490 | ) |
| Capital reserve from hedges | |
| 12 | | |
| (99 | ) | |
| 140 | |
| Capital reserve from share-based payments | |
| 6,336 | | |
| 5,750 | | |
| 6,427 | |
| Capital reserve from employee benefits | |
| 282 | | |
| 539 | | |
| 275 | |
| Accumulated deficit | |
| (37,835 | ) | |
| (50,293 | ) | |
| (40,200 | ) |
| Total Shareholder’s Equity | |
| 246,510 | | |
| 174,808 | | |
| 244,021 | |
| Total Liabilities and Shareholder’s Equity | |
$ | 343,174 | | |
$ | 316,795 | | |
$ | 354,907 | |
The accompanying Notes are an integral part of
the Consolidated Financial Statements.
KAMADA LTD.
Condensed Consolidated Interim Statements
of Profit or Loss and Other Comprehensive Income
| | |
Three months period ended | | |
Year ended | |
| | |
March 31, | | |
December 31, | |
| | |
2024 | | |
2023 | | |
2023 | |
| | |
Unaudited | | |
Audited | |
| | |
| | |
| | |
| |
| Revenues from proprietary products | |
$ | 33,758 | | |
$ | 24,061 | | |
$ | 115,458 | |
| Revenues from distribution | |
| 3,978 | | |
| 6,649 | | |
| 27,061 | |
| | |
| | | |
| | | |
| | |
| Total revenues | |
| 37,736 | | |
| 30,710 | | |
| 142,519 | |
| | |
| | | |
| | | |
| | |
| Cost of revenues from proprietary products | |
| 17,620 | | |
| 13,224 | | |
| 63,342 | |
| Cost of revenues from distribution | |
| 3,365 | | |
| 5,647 | | |
| 23,687 | |
| | |
| | | |
| | | |
| | |
| Total cost of revenues | |
| 20,985 | | |
| 18,871 | | |
| 87,029 | |
| | |
| | | |
| | | |
| | |
| Gross profit | |
| 16,751 | | |
| 11,839 | | |
| 55,490 | |
| | |
| | | |
| | | |
| | |
| Research and development expenses | |
| 4,295 | | |
| 3,231 | | |
| 13,933 | |
| Selling and marketing expenses | |
| 4,631 | | |
| 3,922 | | |
| 16,193 | |
| General and administrative expenses | |
| 3,786 | | |
| 3,418 | | |
| 14,381 | |
| Other expenses | |
| - | | |
| 979 | | |
| 919 | |
| Operating income (loss) | |
| 4,039 | | |
| 289 | | |
| 10,064 | |
| | |
| | | |
| | | |
| | |
| Financial income | |
| 280 | | |
| 25 | | |
| 588 | |
| Income (expenses) in respect of currency exchange differences and derivatives instruments, net | |
| 124 | | |
| 151 | | |
| 55 | |
| Financial Income (expense) in respect of contingent consideration and other long- term liabilities. | |
| (1,845 | ) | |
| (1,761 | ) | |
| (980 | ) |
| Financial expenses | |
| (159 | ) | |
| (500 | ) | |
| (1,298 | ) |
| Income before tax on income | |
| 2,439 | | |
| (1,796 | ) | |
| 8,429 | |
| Taxes on income | |
| 74 | | |
| 13 | | |
| 145 | |
| | |
| | | |
| | | |
| | |
| Net Income (loss) | |
$ | 2,365 | | |
$ | (1,809 | ) | |
$ | 8,284 | |
| | |
| | | |
| | | |
| | |
| Other Comprehensive Income (loss): | |
| | | |
| | | |
| | |
| Amounts that will be or that have been reclassified to profit or loss when specific conditions are met | |
| | | |
| | | |
| | |
| Gain (loss) on cash flow hedges | |
| (71 | ) | |
| (156 | ) | |
| (186 | ) |
| Net amounts transferred to the statement of profit or loss for cash flow hedges | |
| (57 | ) | |
| 145 | | |
| 414 | |
| Items that will not be reclassified to profit or loss in subsequent periods: | |
| | | |
| | | |
| | |
| Remeasurement gain (loss) from defined benefit plan | |
| 7 | | |
| 191 | | |
| (73 | ) |
| Total comprehensive income (loss) | |
$ | 2,244 | | |
$ | (1,629 | ) | |
$ | 8,439 | |
| | |
| | | |
| | | |
| | |
| Earnings per share attributable to equity holders of the Company: | |
| | | |
| | | |
| | |
| Basic net earnings per share | |
$ | 0.04 | | |
$ | (0.04 | ) | |
$ | 0.17 | |
| Diluted net earnings per share | |
$ | 0.04 | | |
$ | (0.04 | ) | |
$ | 0.15 | |
The accompanying Notes are an integral part of
the Consolidated Financial Statements.
KAMADA LTD.
Condensed Consolidated Interim
Statements of Changes in Equity
| | |
| | |
Additional | | |
Capital
reserve
due to
translation to | | |
Capital
reserve | | |
Capital
reserve
from | | |
Capital
reserve
from | | |
| | |
| |
| | |
Share | | |
paid in | | |
presentation | | |
from | | |
sharebased | | |
employee | | |
Accumulated | | |
Total | |
| | |
capital | | |
capital | | |
currency | | |
hedges | | |
payments | | |
benefits | | |
deficit | | |
equity | |
| | |
Unaudited | |
| | |
In thousands | |
| Balance as of January 1, 2024 (audited) | |
$ | 15,021 | | |
$ | 265,848 | | |
$ | (3,490 | ) | |
$ | 140 | | |
$ | 6,427 | | |
$ | 275 | | |
$ | (40,200 | ) | |
$ | 244,021 | |
| Net income | |
| - | | |
| - | | |
| - | | |
| - | | |
| - | | |
| - | | |
| 2,365 | | |
| 2,365 | |
| Other comprehensive income (loss) | |
| - | | |
| - | | |
| - | | |
| (128 | ) | |
| - | | |
| 7 | | |
| - | | |
| (121 | ) |
| Total comprehensive income (loss) | |
| - | | |
| - | | |
| - | | |
| (128 | ) | |
| - | | |
| 7 | | |
| 2,365 | | |
| 2,244 | |
| Exercise and forfeiture of share-based payment into shares | |
| 1 | | |
| 335 | | |
| - | | |
| - | | |
| (335 | ) | |
| - | | |
| - | | |
| 1 | |
| Cost of share-based payment | |
| - | | |
| - | | |
| - | | |
| - | | |
| 244 | | |
| - | | |
| - | | |
| 244 | |
| Balance as of March 31, 2024 | |
$ | 15,022 | | |
$ | 266,183 | | |
$ | (3,490 | ) | |
$ | 12 | | |
$ | 6,336 | | |
$ | 282 | | |
$ | (37,835 | ) | |
$ | 246,510 | |
| | |
| | |
Additional | | |
Capital reserve
due to
translation to | | |
Capital reserve | | |
Capital
reserve
from
share | | |
Capital
reserve
from | | |
| | |
| |
| | |
Share | | |
paid in | | |
presentation | | |
from | | |
based | | |
employee | | |
Accumulated | | |
Total | |
| | |
capital | | |
capital | | |
currency | | |
hedges | | |
payments | | |
benefits | | |
deficit | | |
equity | |
| | |
Unaudited | |
| | |
In thousands | |
| Balance as of January 1, 2023 (audited) | |
$ | 11,734 | | |
$ | 210,495 | | |
$ | (3,490 | ) | |
$ | (88 | ) | |
$ | 5,505 | | |
$ | 348 | | |
$ | (48,484 | ) | |
$ | 176,020 | |
| Net income | |
| - | | |
| - | | |
| - | | |
| - | | |
| - | | |
| - | | |
| (1,809 | ) | |
| (1,809 | ) |
| Other comprehensive income (loss) | |
| - | | |
| - | | |
| - | | |
| (11 | ) | |
| - | | |
| 191 | | |
| - | | |
| 180 | |
| Total comprehensive income (loss) | |
| - | | |
| - | | |
| - | | |
| (11 | ) | |
| - | | |
| 191 | | |
| (1,809 | ) | |
| (1,629 | ) |
| Exercise and forfeiture of share-based payment into shares | |
| 2 | | |
| 170 | | |
| - | | |
| - | | |
| (170 | ) | |
| - | | |
| - | | |
| 2 | |
| Cost of share-based payment | |
| | | |
| | | |
| | | |
| | | |
| 415 | | |
| | | |
| | | |
| 415 | |
| Balance as of March 31, 2023 | |
$ | 11,736 | | |
$ | 210,665 | | |
$ | (3,490 | ) | |
$ | (99 | ) | |
$ | 5,750 | | |
$ | 539 | | |
$ | (50,293 | ) | |
$ | 174,808 | |
KAMADA LTD.
| | |
Share | | |
Additional
paid in | | |
Capital reserve
due to translation to
presentation | | |
Capital reserve
from | | |
Capital
reserve
from share
based | | |
Capital
reserve
from
employee | | |
Accumulated | | |
Total | |
| | |
capital | | |
capital | | |
currency | | |
hedges | | |
payments | | |
benefits | | |
deficit | | |
equity | |
| | |
Unaudited | |
| | |
In thousands | |
| Balance as of January 1, 2023 (audited) | |
$ | 11,734 | | |
$ | 210,495 | | |
$ | (3,490 | ) | |
$ | (88 | ) | |
$ | 5,505 | | |
$ | 348 | | |
$ | (48,484 | ) | |
$ | 176,020 | |
| Net income | |
| - | | |
| - | | |
| - | | |
| - | | |
| - | | |
| - | | |
| 8,284 | | |
| 8,284 | |
| Other comprehensive income (loss) | |
| - | | |
| - | | |
| - | | |
| 228 | | |
| - | | |
| (73 | ) | |
| - | | |
| 155 | |
| Total comprehensive income (loss) | |
| - | | |
| - | | |
| - | | |
| 228 | | |
| - | | |
| (73 | ) | |
| 8,284 | | |
| 8,439 | |
| Exercise and forfeiture of share-based payment into shares | |
| 4 | | |
| 405 | | |
| - | | |
| - | | |
| (405 | ) | |
| - | | |
| - | | |
| 4 | |
| Issuance of shares | |
| 3,283 | | |
| 54,948 | | |
| - | | |
| - | | |
| - | | |
| - | | |
| - | | |
| 58,231 | |
| Cost of share-based payment | |
| - | | |
| - | | |
| - | | |
| - | | |
| - | | |
| 1,327 | | |
| - | | |
| 1,327 | |
| Balance as of December 31, 2023 | |
$ | 15,021 | | |
$ | 265,848 | | |
$ | (3,490 | ) | |
$ | 140 | | |
$ | 6,427 | | |
$ | 275 | | |
$ | (40,200 | ) | |
$ | 244,021 | |
The accompanying Notes are an integral part of
the Consolidated Financial Statements.
KAMADA LTD.
Condensed
consolidated interim statements of cash flows
| | |
Three months period Ended | | |
Year Ended | |
| | |
March 31, | | |
December 31, | |
| | |
2024 | | |
2023 | | |
2023 | |
| | |
Unaudited | | |
Audited | |
| | |
| | |
| | |
| |
| Cash Flows from Operating Activities | |
| | |
| | |
| |
| Net income (loss) | |
$ | 2,365 | | |
$ | (1,809 | ) | |
$ | 8,284 | |
| | |
| | | |
| | | |
| | |
| Adjustments to reconcile net income to net cash provided by (used in) operating activities: | |
| | | |
| | | |
| | |
| | |
| | | |
| | | |
| | |
| Adjustments to the profit or loss items: | |
| | | |
| | | |
| | |
| | |
| | | |
| | | |
| | |
| Depreciation and amortization | |
| 3,237 | | |
| 3,123 | | |
| 12,714 | |
| Financial expenses (income), net | |
| 1,600 | | |
| 2,085 | | |
| 1,635 | |
| Cost of share-based payment | |
| 241 | | |
| 415 | | |
| 1,314 | |
| Taxes on income | |
| 74 | | |
| 13 | | |
| 145 | |
| Loss (gain) from sale of property and equipment | |
| - | | |
| (22 | ) | |
| (5 | ) |
| Change in employee benefit liabilities, net | |
| (4 | ) | |
| (8 | ) | |
| (125 | ) |
| | |
| 5,148 | | |
| 5,606 | | |
| 15,678 | |
| Changes in asset and liability items: | |
| | | |
| | | |
| | |
| | |
| | | |
| | | |
| | |
| Decrease (increase) in trade receivables, net | |
| 610 | | |
| 6,306 | | |
| 7,835 | |
| Decrease (increase) in other accounts receivables | |
| (516 | ) | |
| 1,362 | | |
| (1,150 | ) |
| Decrease (increase) in inventories | |
| 4,131 | | |
| (10,970 | ) | |
| (19,694 | ) |
| Decrease (increase) in deferred expenses | |
| 112 | | |
| 3,554 | | |
| 2,814 | |
| Decrease (increase) in trade payables | |
| (8,785 | ) | |
| (6,712 | ) | |
| (8,885 | ) |
| Decrease (increase) in other accounts payables | |
| (2,051 | ) | |
| (238 | ) | |
| 765 | |
| Decrease (increase) in deferred revenues | |
| (122 | ) | |
| 384 | | |
| 113 | |
| | |
| (6,621 | ) | |
| (6,314 | ) | |
| (18,202 | ) |
| Cash received (paid) during the period for: | |
| | | |
| | | |
| | |
| | |
| | | |
| | | |
| | |
| Interest paid | |
| (129 | ) | |
| (341 | ) | |
| (1,228 | ) |
| Interest received | |
| 280 | | |
| 25 | | |
| - | |
| Taxes paid | |
| (23 | ) | |
| (18 | ) | |
| (217 | ) |
| | |
| 128 | | |
| (334 | ) | |
| (1,445 | ) |
| | |
| | | |
| | | |
| | |
| Net cash provided by (used in) operating activities | |
$ | 1,020 | | |
$ | (2,851 | ) | |
$ | 4,315 | |
KAMADA LTD.
Condensed
consolidated interim statements of cash flows
| | |
Three months period Ended | | |
Year Ended | |
| | |
March, 31 | | |
December 31, | |
| | |
2024 | | |
2023 | | |
2023 | |
| | |
Unaudited | | |
Audited | |
| | |
| | |
| | |
| |
| Cash Flows from Investing Activities | |
| | |
| | |
| |
| Purchase of property and equipment and intangible assets | |
$ | (2,682 | ) | |
$ | (1,117 | ) | |
$ | (5,850 | ) |
| Proceeds from sale of property and equipment | |
| - | | |
| 24 | | |
| 7 | |
| Net cash provided by (used in) investing activities | |
| (2,682 | ) | |
| (1,093 | ) | |
| (5,843 | ) |
| | |
| | | |
| | | |
| | |
| Cash Flows from Financing Activities | |
| | | |
| | | |
| | |
| | |
| | | |
| | | |
| | |
| Proceeds from exercise of share base payments | |
| 1 | | |
| 1 | | |
| 4 | |
| Proceeds from issuance of ordinary shares, net | |
| - | | |
| - | | |
| 58,231 | |
| Repayment of lease liabilities | |
| (244 | ) | |
| (271 | ) | |
| (850 | ) |
| Repayment of long-term loans | |
| - | | |
| (1,111 | ) | |
| (17,407 | ) |
| Repayment of other long-term liabilities | |
| (5,496 | ) | |
| (1,500 | ) | |
| (17,300 | ) |
| Net cash provided by (used in) financing activities | |
| (5,739 | ) | |
| (2,881 | ) | |
| 22,678 | |
| | |
| | | |
| | | |
| | |
| Exchange differences on balances of cash and cash equivalent | |
| (46 | ) | |
| (312 | ) | |
| 233 | |
| | |
| | | |
| | | |
| | |
| Increase (decrease) in cash and cash equivalents | |
| (7,447 | ) | |
| (7,137 | ) | |
| 21,383 | |
| | |
| | | |
| | | |
| | |
| Cash and cash equivalents at the beginning of the period | |
| 55,641 | | |
| 34,258 | | |
| 34,258 | |
| | |
| | | |
| | | |
| | |
| Cash and cash equivalents at the end of the period | |
$ | 48,194 | | |
$ | 27,121 | | |
$ | 55,641 | |
| | |
| | | |
| | | |
| | |
| Significant non-cash transactions | |
| | | |
| | | |
| | |
| Right-of-use asset recognized with corresponding lease liability | |
$ | 306 | | |
$ | 3,580 | | |
$ | 6,546 | |
| Purchase of property and equipment and Intangible assets | |
$ | 905 | | |
$ | 292 | | |
$ | 646 | |
The accompanying Notes are an integral part of
the Consolidated Financial Statements.
KAMADA LTD.
Notes to the Condensed Consolidated Interim
Financial Statements
Note 1:- General
General description of the Company
and its activity
Kamada Ltd. (the “Company”)
is a commercial stage global biopharmaceutical company with a portfolio of marketed products indicated for rare and serious conditions
and a leader in the specialty plasma-derived field focused on diseases of limited treatment alternatives. The Company is also advancing
an innovative development pipeline targeting areas of significant unmet medical need. The Company’s strategy is focused on driving
profitable growth from its significant commercial catalysts as well as its manufacturing and development expertise in the plasma-derived
and biopharmaceutical fields. The Company’s commercial products portfolio includes six FDA approved plasma-derived biopharmaceutical
products KEDRAB®, CYTOGAM®, VARIZIG®, WINRHO SDF®, HEPAGAM B® and GLASSIA®, as well as KAMRAB®, KAMRHO (D)®
and two types of equine-based anti-snake venom (ASV) products. The Company distributes its commercial products portfolio directly, and
through strategic partners or third-party distributors in more than 30 countries, including the U.S., Canada, Israel, Russia, Argentina,
Brazil, India, Australia and other countries in Latin America, Europe, the Middle East and Asia. The Company leverages its expertise
and presence in the Israeli market to distribute, for use in Israel, more than 25 pharmaceutical products that are supplied by international
manufacturers and in addition have eleven biosimilar products in its Israeli distribution portfolio, which, subject to European Medicines
Agency (EMA) and Israeli Ministry of Health (“IL MOH”) approvals, are expected to be launched in Israel through 2028. The
Company owns an FDA licensed plasma collection center in Beaumont, Texas, which currently specializes in the collection of hyper-immune
plasma used in the manufacture of KAMRHO (D), KAMRAB and KEDRAB. In addition to the Company’s commercial operation, it invests
in research and development of new product candidates. The Company’s leading investigational product is an inhaled AAT for the
treatment of AAT deficiency, for which it is continuing to progress the InnovAATe clinical trial, a randomized, double-blind, placebo-controlled,
pivotal Phase 3 trial.
In November 2021, the Company acquired
CYTOGAM, WINRHO SDF, VARIZIG and HEPGAM B from Saol Therapeutics Ltd. (“Saol”). The acquisition of this portfolio furthered
the Company’s core objective to become a fully integrated specialty plasma company with strong commercial capabilities in the U.S.
market, as well as to expand to new markets, mainly in the Middle East/North Africa region, and to broaden the Company’s portfolio
offering in existing markets. The Company’s wholly owned U.S. subsidiary, Kamada Inc., is responsible for the commercialization
of the four products in the U.S. market, including direct sales to wholesalers and local distributers. Refer to Note 5 in our annual
Financial report for further details on this acquisition.
The Company markets GLASSIA in the U.S.
through a strategic partnership with Takeda Pharmaceuticals Company Limited (“Takeda”). Historically,
the Company generated revenues on sales of GLASSIA, manufactured by the Company, to Takeda for further distribution in the United States.
In accordance with the agreement with Takeda, the Company ceased the production and sale of GLASSIA to Takeda during 2021, and during
the first quarter of 2022, Takeda began to pay the Company royalties on sales of GLASSIA manufactured by Takeda, at a rate of 12% on
net sales through August 2025 and at a rate of 6% thereafter until 2040, with a minimum of $5 million annually for each of the years
from 2022 to 2040. Refer to Note 18 in our annual Financial report for further details on the engagement with Takeda.
The Company’s ordinary shares are
listed for trading on the Tel Aviv Stock Exchange and the NASDAQ Global Select Market.
FIMI Opportunity Funds (“FIMI”),
the leading private equity firm in Israel beneficially owns approximately 38% of the Company’s outstanding ordinary shares and is
a controlling shareholder of the Company; within the meaning of the Israeli Companies Law, 1999. Refer to Note 20 for further details
and Item 7 within the Company annual reports on Form 20-F.
KAMADA LTD.
Notes to the Condensed Consolidated Interim
Financial Statements
Note 2:- Significant Accounting Policies
| | a. | Basis of preparation of the interim consolidated financial statements: |
The interim consolidated financial
statements have been prepared in accordance with generally accepted accounting principles for the preparation of financial statements
for interim periods, as prescribed in IAS 34, “Interim Financial Reporting”.
| | b. | Implementation of new accounting standards: |
| |
|
Amendment to IAS 1,
Presentation of Financial Statements: Classification of Liabilities as Current or Non-Current and subsequent amendment: Non-Current
Liabilities with Covenants |
The amendment, together with the subsequent
amendment to IAS 1 (see hereunder) replaces certain requirements for classifying liabilities as current or non-current. According to the
amendment, a liability will be classified as non-current when the entity has the right to defer settlement for at least 12 months after
the reporting period, and it “has substance” and is in existence at the end of the reporting period. According to the subsequent
amendment, as published in October 2022, covenants with which the entity must comply after the reporting date do not affect classification
of the liability as current or non-current. Additionally, the subsequent amendment adds disclosure requirements for liabilities subject
to covenants within 12 months after the reporting date, such as disclosure regarding the nature of the covenants, the date they need to
be complied with and facts and circumstances that indicate the entity may have difficulty complying with the covenants. Furthermore, the
amendment clarifies that the conversion option of a liability will affect its classification as current or non-current, other than when
the conversion option is recognized as equity.
The amendment and subsequent amendment
are effective for reporting periods beginning on or after January 1, 2024. The amendment and subsequent amendment are applicable retrospectively,
including an amendment to comparative data.
As of March 31, 2024, the Company does
not have impact on its financial statement.
Note 3:- Significant events in the reporting period
On February 29, 2024, the Company’s Board of Directors
approved the grant of options to purchase up to 27,468 options to purchase ordinary shares of the Company under the 2011 Plan and the
US Appendix.
The Company granted, out of the above mentioned, to employees
and executive officers the following:
Under the Israeli Share Option Plan:
| - | 20,800
options to purchase the ordinary shares of the Company, at an exercise price of NIS 23.91 (USD 6.67) per share. The fair value of the
options calculated on the date of grant using the binomial option valuation model was estimated at $48 thousands. |
Under the US Appendix:
| | - | 6,668 options to purchase the ordinary shares of the Company, at an exercise price of USD 6.62 per
share. The fair value of the options was estimated on the date of grant was estimated at $18 thousands. |
KAMADA LTD.
Notes to the Condensed Consolidated Interim
Financial Statements
Note 4:- Operating Segments
The company has two operating segments,
as follows:
| Proprietary
Products |
- |
Development, manufacturing, sales
and distribution of proprietary plasma-derived protein therapeutics. |
| |
|
|
| Distribution |
- |
Distribute imported drug products in Israel, which
are manufactured by third parties. |
| | b. | Reporting on operating segments: |
| | |
Proprietary
Products | | |
Distribution | | |
Total | |
| | |
U.S Dollars in thousands | |
| | |
Unaudited | |
| Three months period ended March 31, 2024 | |
| | |
| | |
| |
| Revenues | |
$ | 33,758 | | |
$ | 3,978 | | |
$ | 37,736 | |
| Gross profit | |
$ | 16,138 | | |
$ | 613 | | |
$ | 16,751 | |
| Unallocated corporate expenses | |
| | | |
| | | |
| (12,712 | ) |
| Finance expenses, net | |
| | | |
| | | |
| (1,600 | ) |
| Income before taxes on income | |
| | | |
| | | |
$ | 2,439 | |
| | |
Proprietary
Products | | |
Distribution | | |
Total | |
| | |
U.S Dollars in thousands | |
| | |
Unaudited | |
| Three months period ended March 31, 2023 | |
| | |
| | |
| |
| Revenues | |
$ | 24,061 | | |
$ | 6,649 | | |
$ | 30,710 | |
| Gross profit | |
$ | 10,837 | | |
$ | 1,002 | | |
$ | 11,839 | |
| Unallocated corporate expenses | |
| | | |
| | | |
| (11,550 | ) |
| Finance expenses, net | |
| | | |
| | | |
| (2,085 | ) |
| Income before taxes on income | |
| | | |
| | | |
$ | (1,796 | ) |
KAMADA LTD.
Notes to the Condensed Consolidated Interim
Financial Statements
Note 4:- Operating Segments (cont.)
| |
b. |
Reporting on operating
segments (cont.): |
| |
|
Proprietary
Products |
|
|
Distribution |
|
|
Total |
|
| |
|
U.S
Dollars in thousands |
|
| |
|
Audited |
|
| Year Ended December 31, 2023 |
|
|
|
|
|
|
|
|
|
| Revenues |
|
$ |
115,458 |
|
|
$ |
27,061 |
|
|
$ |
142,519 |
|
| Gross profit |
|
$ |
52,116 |
|
|
$ |
3,374 |
|
|
$ |
55,490 |
|
| Unallocated corporate
expenses |
|
|
|
|
|
|
|
|
|
|
(45,426 |
) |
| Finance expenses, net |
|
|
|
|
|
|
|
|
|
|
(1,635 |
) |
| Income before taxes
on income |
|
|
|
|
|
|
|
|
|
$ |
8,429 |
|
| | c. | Reporting on operating segments by geographic region: |
| | |
Three months period ended
March 31, 2024 | |
| | |
Proprietary
Products | | |
Distribution | | |
Total | |
| | |
U.S Dollars in thousands | |
| | |
Unaudited | |
| Geographical markets | |
| | |
| | |
| |
| U.S.A | |
$ | 25,849 | | |
$ | - | | |
$ | 25,849 | |
| Israel | |
| 1,832 | | |
| 3,978 | | |
| 5,810 | |
| Canada | |
| 3,281 | | |
| - | | |
| 3,281 | |
| Europe | |
| 246 | | |
| - | | |
| 246 | |
| Latin America | |
| 1,116 | | |
| - | | |
| 1,116 | |
| Asia | |
| 1,434 | | |
| - | | |
| 1,434 | |
| | |
$ | 33,758 | | |
$ | 3,978 | | |
$ | 37,736 | |
KAMADA LTD.
Notes to the Condensed Consolidated Interim
Financial Statements
Note 4:- Operating Segments (cont.)
| |
c. |
Reporting on operating
segments by geographic region: (cont.) |
| | |
Three months period ended
March 31, 2023 | |
| | |
Proprietary
Products | | |
Distribution | | |
Total | |
| | |
U.S Dollars in thousands | |
| | |
Unaudited | |
| Geographical markets | |
| | |
| | |
| |
| U.S.A | |
$ | 13,598 | | |
$ | - | | |
$ | 13,598 | |
| Israel | |
| 994 | | |
| 6,649 | | |
| 7,643 | |
| Canada | |
| 3,232 | | |
| - | | |
| 3,232 | |
| Europe | |
| 3,334 | | |
| - | | |
| 3,334 | |
| Latin America | |
| 1,316 | | |
| - | | |
| 1,316 | |
| Asia | |
| 1,550 | | |
| - | | |
| 1,550 | |
| Others | |
| 38 | | |
| - | | |
| 38 | |
| | |
$ | 24,061 | | |
$ | 6,649 | | |
$ | 30,710 | |
| | |
Year ended December 31, 2023 | |
| | |
Proprietary
Products | | |
Distribution | | |
Total | |
| | |
U.S Dollars in thousands | |
| | |
Audited | |
| Geographical markets | |
| | |
| | |
| |
| U.S.A | |
$ | 73,741 | | |
$ | - | | |
$ | 73,741 | |
| Israel | |
| 4,236 | | |
| 27,060 | | |
| 31,296 | |
| Canada | |
| 11,162 | | |
| - | | |
| 11,162 | |
| Europe | |
| 7,088 | | |
| - | | |
| 7,088 | |
| Latin America | |
| 12,928 | | |
| - | | |
| 12,928 | |
| Asia | |
| 6,147 | | |
| - | | |
| 6,147 | |
| Others | |
| 157 | | |
| - | | |
| 157 | |
| | |
$ | 115,459 | | |
$ | 27,060 | | |
$ | 142,519 | |
KAMADA LTD.
Notes to the Condensed Consolidated Interim
Financial Statements
Note 5:- Financial Instruments
| |
|
Classification of financial instruments by fair value hierarchy |
Financial assets (liabilities) measured at fair value
| | |
Level 1 | | |
Level 2 | | |
Level 3 | |
| | |
U.S Dollars in thousands | |
| March 31, 2024 | |
| | |
| | |
| |
| Derivatives instruments | |
$ | - | | |
$ | 11 | | |
$ | - | |
| Contingent consideration | |
$ | - | | |
$ | - | | |
$ | (19,453 | ) |
| | |
| | | |
| | | |
| | |
| March 31, 2023 | |
| | | |
| | | |
| | |
| Derivatives instruments | |
| - | | |
$ | (91 | ) | |
$ | - | |
| Contingent consideration | |
$ | - | | |
$ | - | | |
$ | (24,115 | ) |
| | |
| | | |
| | | |
| | |
| December 31, 2023 | |
| | | |
| | | |
| | |
| Derivatives instruments | |
$ | - | | |
$ | 149 | | |
$ | - | |
| Contingent consideration | |
$ | - | | |
$ | - | | |
$ | (21,855 | ) |
During the three months ended on March 31, 2024
there were no transfers due to the fair value measurement of any financial instrument from Level 1 to Level 2, and furthermore, there
were no transfers to or from Level 3 due to the fair value measurement of any financial instrument.
Note 6:- Subsequent events
On May 2, 2024, our U.S. subsidiary Kamada Plasma
LLC entered into a lease agreement for a 11,100 square feet premises in San Antonio, Texas to be used as a plasma collection center. The
lease is in effect for an initial period of ten years commencing on the rent commencement date which will be the earlier of (a) opening
for business in the facility or (b) 180 days following receipt of building permits. The lease agreement may be extended for three consecutive
periods of five years each, upon at least 120 days prior written notice.
13
false
--12-31
Q1
2024-03-31
0001567529
0001567529
2024-01-01
2024-03-31
0001567529
2024-03-31
0001567529
2023-03-31
0001567529
2023-12-31
0001567529
2023-01-01
2023-03-31
0001567529
2023-01-01
2023-12-31
0001567529
ifrs-full:IssuedCapitalMember
2023-12-31
0001567529
ifrs-full:AdditionalPaidinCapitalMember
2023-12-31
0001567529
ifrs-full:ReserveOfExchangeDifferencesOnTranslationMember
2023-12-31
0001567529
ifrs-full:ReserveOfCashFlowHedgesMember
2023-12-31
0001567529
ifrs-full:ReserveOfSharebasedPaymentsMember
2023-12-31
0001567529
ifrs-full:ReserveOfRemeasurementsOfDefinedBenefitPlansMember
2023-12-31
0001567529
ifrs-full:RetainedEarningsMember
2023-12-31
0001567529
ifrs-full:IssuedCapitalMember
2024-01-01
2024-03-31
0001567529
ifrs-full:AdditionalPaidinCapitalMember
2024-01-01
2024-03-31
0001567529
ifrs-full:ReserveOfExchangeDifferencesOnTranslationMember
2024-01-01
2024-03-31
0001567529
ifrs-full:ReserveOfCashFlowHedgesMember
2024-01-01
2024-03-31
0001567529
ifrs-full:ReserveOfSharebasedPaymentsMember
2024-01-01
2024-03-31
0001567529
ifrs-full:ReserveOfRemeasurementsOfDefinedBenefitPlansMember
2024-01-01
2024-03-31
0001567529
ifrs-full:RetainedEarningsMember
2024-01-01
2024-03-31
0001567529
ifrs-full:IssuedCapitalMember
2024-03-31
0001567529
ifrs-full:AdditionalPaidinCapitalMember
2024-03-31
0001567529
ifrs-full:ReserveOfExchangeDifferencesOnTranslationMember
2024-03-31
0001567529
ifrs-full:ReserveOfCashFlowHedgesMember
2024-03-31
0001567529
ifrs-full:ReserveOfSharebasedPaymentsMember
2024-03-31
0001567529
ifrs-full:ReserveOfRemeasurementsOfDefinedBenefitPlansMember
2024-03-31
0001567529
ifrs-full:RetainedEarningsMember
2024-03-31
0001567529
ifrs-full:IssuedCapitalMember
2022-12-31
0001567529
ifrs-full:AdditionalPaidinCapitalMember
2022-12-31
0001567529
ifrs-full:ReserveOfExchangeDifferencesOnTranslationMember
2022-12-31
0001567529
ifrs-full:ReserveOfCashFlowHedgesMember
2022-12-31
0001567529
ifrs-full:ReserveOfSharebasedPaymentsMember
2022-12-31
0001567529
ifrs-full:ReserveOfRemeasurementsOfDefinedBenefitPlansMember
2022-12-31
0001567529
ifrs-full:RetainedEarningsMember
2022-12-31
0001567529
2022-12-31
0001567529
ifrs-full:IssuedCapitalMember
2023-01-01
2023-03-31
0001567529
ifrs-full:AdditionalPaidinCapitalMember
2023-01-01
2023-03-31
0001567529
ifrs-full:ReserveOfExchangeDifferencesOnTranslationMember
2023-01-01
2023-03-31
0001567529
ifrs-full:ReserveOfCashFlowHedgesMember
2023-01-01
2023-03-31
0001567529
ifrs-full:ReserveOfSharebasedPaymentsMember
2023-01-01
2023-03-31
0001567529
ifrs-full:ReserveOfRemeasurementsOfDefinedBenefitPlansMember
2023-01-01
2023-03-31
0001567529
ifrs-full:RetainedEarningsMember
2023-01-01
2023-03-31
0001567529
ifrs-full:IssuedCapitalMember
2023-03-31
0001567529
ifrs-full:AdditionalPaidinCapitalMember
2023-03-31
0001567529
ifrs-full:ReserveOfExchangeDifferencesOnTranslationMember
2023-03-31
0001567529
ifrs-full:ReserveOfCashFlowHedgesMember
2023-03-31
0001567529
ifrs-full:ReserveOfSharebasedPaymentsMember
2023-03-31
0001567529
ifrs-full:ReserveOfRemeasurementsOfDefinedBenefitPlansMember
2023-03-31
0001567529
ifrs-full:RetainedEarningsMember
2023-03-31
0001567529
ifrs-full:IssuedCapitalMember
2023-01-01
2023-12-31
0001567529
ifrs-full:AdditionalPaidinCapitalMember
2023-01-01
2023-12-31
0001567529
ifrs-full:ReserveOfExchangeDifferencesOnTranslationMember
2023-01-01
2023-12-31
0001567529
ifrs-full:ReserveOfCashFlowHedgesMember
2023-01-01
2023-12-31
0001567529
ifrs-full:ReserveOfSharebasedPaymentsMember
2023-01-01
2023-12-31
0001567529
ifrs-full:ReserveOfRemeasurementsOfDefinedBenefitPlansMember
2023-01-01
2023-12-31
0001567529
ifrs-full:RetainedEarningsMember
2023-01-01
2023-12-31
0001567529
kmda:TakedaPharmaceuticalsCompanyLimitedMember
2024-03-31
0001567529
kmda:BoardOfDirectorsMember
2024-02-29
0001567529
kmda:IsraeliShareOptionPlanMember
2024-02-29
0001567529
kmda:IsraeliShareOptionPlanMember
2024-02-29
2024-02-29
0001567529
2024-02-29
0001567529
2024-02-29
2024-02-29
0001567529
kmda:ProprietaryProductsMember
ifrs-full:ReportableSegmentsMember
2024-01-01
2024-03-31
0001567529
kmda:DistributionMember
ifrs-full:ReportableSegmentsMember
2024-01-01
2024-03-31
0001567529
kmda:ProprietaryProductsMember
ifrs-full:ReportableSegmentsMember
2023-01-01
2023-03-31
0001567529
kmda:DistributionMember
ifrs-full:ReportableSegmentsMember
2023-01-01
2023-03-31
0001567529
kmda:ProprietaryProductsMember
ifrs-full:ReportableSegmentsMember
2023-01-01
2023-12-31
0001567529
kmda:DistributionMember
ifrs-full:ReportableSegmentsMember
2023-01-01
2023-12-31
0001567529
kmda:USAAndNorthAmericaMember
ifrs-full:ReportableSegmentsMember
2024-01-01
2024-03-31
0001567529
kmda:USAAndNorthAmericaMember
ifrs-full:AllOtherSegmentsMember
2024-01-01
2024-03-31
0001567529
kmda:USAAndNorthAmericaMember
2024-01-01
2024-03-31
0001567529
country:IL
ifrs-full:ReportableSegmentsMember
2024-01-01
2024-03-31
0001567529
country:IL
ifrs-full:AllOtherSegmentsMember
2024-01-01
2024-03-31
0001567529
country:IL
2024-01-01
2024-03-31
0001567529
country:CA
ifrs-full:ReportableSegmentsMember
2024-01-01
2024-03-31
0001567529
country:CA
ifrs-full:AllOtherSegmentsMember
2024-01-01
2024-03-31
0001567529
country:CA
2024-01-01
2024-03-31
0001567529
kmda:EuropeOneMember
ifrs-full:ReportableSegmentsMember
2024-01-01
2024-03-31
0001567529
kmda:EuropeOneMember
ifrs-full:AllOtherSegmentsMember
2024-01-01
2024-03-31
0001567529
kmda:EuropeOneMember
2024-01-01
2024-03-31
0001567529
kmda:OtherForeignCountriesTwoMember
ifrs-full:ReportableSegmentsMember
2024-01-01
2024-03-31
0001567529
kmda:OtherForeignCountriesTwoMember
ifrs-full:AllOtherSegmentsMember
2024-01-01
2024-03-31
0001567529
kmda:OtherForeignCountriesTwoMember
2024-01-01
2024-03-31
0001567529
kmda:OtherForeignCountriesOneMember
ifrs-full:ReportableSegmentsMember
2024-01-01
2024-03-31
0001567529
kmda:OtherForeignCountriesOneMember
ifrs-full:AllOtherSegmentsMember
2024-01-01
2024-03-31
0001567529
kmda:OtherForeignCountriesOneMember
2024-01-01
2024-03-31
0001567529
ifrs-full:ReportableSegmentsMember
2024-01-01
2024-03-31
0001567529
ifrs-full:AllOtherSegmentsMember
2024-01-01
2024-03-31
0001567529
kmda:USAAndNorthAmericaMember
ifrs-full:ReportableSegmentsMember
2023-01-01
2023-03-31
0001567529
kmda:USAAndNorthAmericaMember
ifrs-full:AllOtherSegmentsMember
2023-01-01
2023-03-31
0001567529
kmda:USAAndNorthAmericaMember
2023-01-01
2023-03-31
0001567529
country:IL
ifrs-full:ReportableSegmentsMember
2023-01-01
2023-03-31
0001567529
country:IL
ifrs-full:AllOtherSegmentsMember
2023-01-01
2023-03-31
0001567529
country:IL
2023-01-01
2023-03-31
0001567529
country:CA
ifrs-full:ReportableSegmentsMember
2023-01-01
2023-03-31
0001567529
country:CA
ifrs-full:AllOtherSegmentsMember
2023-01-01
2023-03-31
0001567529
country:CA
2023-01-01
2023-03-31
0001567529
kmda:EuropeOneMember
ifrs-full:ReportableSegmentsMember
2023-01-01
2023-03-31
0001567529
kmda:EuropeOneMember
ifrs-full:AllOtherSegmentsMember
2023-01-01
2023-03-31
0001567529
kmda:EuropeOneMember
2023-01-01
2023-03-31
0001567529
kmda:OtherForeignCountriesTwoMember
ifrs-full:ReportableSegmentsMember
2023-01-01
2023-03-31
0001567529
kmda:OtherForeignCountriesTwoMember
ifrs-full:AllOtherSegmentsMember
2023-01-01
2023-03-31
0001567529
kmda:OtherForeignCountriesTwoMember
2023-01-01
2023-03-31
0001567529
kmda:OtherForeignCountriesOneMember
ifrs-full:ReportableSegmentsMember
2023-01-01
2023-03-31
0001567529
kmda:OtherForeignCountriesOneMember
ifrs-full:AllOtherSegmentsMember
2023-01-01
2023-03-31
0001567529
kmda:OtherForeignCountriesOneMember
2023-01-01
2023-03-31
0001567529
kmda:OtherCountriesMember
ifrs-full:ReportableSegmentsMember
2023-01-01
2023-03-31
0001567529
kmda:OtherCountriesMember
ifrs-full:AllOtherSegmentsMember
2023-01-01
2023-03-31
0001567529
kmda:OtherCountriesMember
2023-01-01
2023-03-31
0001567529
ifrs-full:ReportableSegmentsMember
2023-01-01
2023-03-31
0001567529
ifrs-full:AllOtherSegmentsMember
2023-01-01
2023-03-31
0001567529
kmda:USAAndNorthAmericaMember
ifrs-full:ReportableSegmentsMember
2023-01-01
2023-12-31
0001567529
kmda:USAAndNorthAmericaMember
ifrs-full:AllOtherSegmentsMember
2023-01-01
2023-12-31
0001567529
kmda:USAAndNorthAmericaMember
2023-01-01
2023-12-31
0001567529
country:IL
ifrs-full:ReportableSegmentsMember
2023-01-01
2023-12-31
0001567529
country:IL
ifrs-full:AllOtherSegmentsMember
2023-01-01
2023-12-31
0001567529
country:IL
2023-01-01
2023-12-31
0001567529
country:CA
ifrs-full:ReportableSegmentsMember
2023-01-01
2023-12-31
0001567529
country:CA
ifrs-full:AllOtherSegmentsMember
2023-01-01
2023-12-31
0001567529
country:CA
2023-01-01
2023-12-31
0001567529
kmda:EuropeOneMember
ifrs-full:ReportableSegmentsMember
2023-01-01
2023-12-31
0001567529
kmda:EuropeOneMember
ifrs-full:AllOtherSegmentsMember
2023-01-01
2023-12-31
0001567529
kmda:EuropeOneMember
2023-01-01
2023-12-31
0001567529
kmda:OtherForeignCountriesTwoMember
ifrs-full:ReportableSegmentsMember
2023-01-01
2023-12-31
0001567529
kmda:OtherForeignCountriesTwoMember
ifrs-full:AllOtherSegmentsMember
2023-01-01
2023-12-31
0001567529
kmda:OtherForeignCountriesTwoMember
2023-01-01
2023-12-31
0001567529
kmda:OtherForeignCountriesOneMember
ifrs-full:ReportableSegmentsMember
2023-01-01
2023-12-31
0001567529
kmda:OtherForeignCountriesOneMember
ifrs-full:AllOtherSegmentsMember
2023-01-01
2023-12-31
0001567529
kmda:OtherForeignCountriesOneMember
2023-01-01
2023-12-31
0001567529
kmda:OtherCountriesMember
ifrs-full:ReportableSegmentsMember
2023-01-01
2023-12-31
0001567529
kmda:OtherCountriesMember
ifrs-full:AllOtherSegmentsMember
2023-01-01
2023-12-31
0001567529
kmda:OtherCountriesMember
2023-01-01
2023-12-31
0001567529
ifrs-full:ReportableSegmentsMember
2023-01-01
2023-12-31
0001567529
ifrs-full:AllOtherSegmentsMember
2023-01-01
2023-12-31
0001567529
ifrs-full:Level1OfFairValueHierarchyMember
2024-03-31
0001567529
ifrs-full:Level2OfFairValueHierarchyMember
2024-03-31
0001567529
ifrs-full:Level3OfFairValueHierarchyMember
2024-03-31
0001567529
ifrs-full:Level1OfFairValueHierarchyMember
2023-03-31
0001567529
ifrs-full:Level2OfFairValueHierarchyMember
2023-03-31
0001567529
ifrs-full:Level3OfFairValueHierarchyMember
2023-03-31
0001567529
ifrs-full:Level1OfFairValueHierarchyMember
2023-12-31
0001567529
ifrs-full:Level2OfFairValueHierarchyMember
2023-12-31
0001567529
ifrs-full:Level3OfFairValueHierarchyMember
2023-12-31
0001567529
kmda:SubsequentEventsMember
2024-05-02
iso4217:USD
iso4217:USD
xbrli:shares
xbrli:pure
xbrli:shares
iso4217:ILS
xbrli:shares
utr:sqm
| X |
- DefinitionBoolean flag that is true when the XBRL content amends previously-filed or accepted submission.
| Name: |
dei_AmendmentFlag |
| Namespace Prefix: |
dei_ |
| Data Type: |
xbrli:booleanItemType |
| Balance Type: |
na |
| Period Type: |
duration |
|
| X |
- DefinitionEnd date of current fiscal year in the format --MM-DD.
| Name: |
dei_CurrentFiscalYearEndDate |
| Namespace Prefix: |
dei_ |
| Data Type: |
xbrli:gMonthDayItemType |
| Balance Type: |
na |
| Period Type: |
duration |
|
| X |
- DefinitionFiscal period values are FY, Q1, Q2, and Q3. 1st, 2nd and 3rd quarter 10-Q or 10-QT statements have value Q1, Q2, and Q3 respectively, with 10-K, 10-KT or other fiscal year statements having FY.
| Name: |
dei_DocumentFiscalPeriodFocus |
| Namespace Prefix: |
dei_ |
| Data Type: |
dei:fiscalPeriodItemType |
| Balance Type: |
na |
| Period Type: |
duration |
|
| X |
- DefinitionThis is focus fiscal year of the document report in YYYY format. For a 2006 annual report, which may also provide financial information from prior periods, fiscal 2006 should be given as the fiscal year focus. Example: 2006.
| Name: |
dei_DocumentFiscalYearFocus |
| Namespace Prefix: |
dei_ |
| Data Type: |
xbrli:gYearItemType |
| Balance Type: |
na |
| Period Type: |
duration |
|
| X |
- DefinitionFor the EDGAR submission types of Form 8-K: the date of the report, the date of the earliest event reported; for the EDGAR submission types of Form N-1A: the filing date; for all other submission types: the end of the reporting or transition period. The format of the date is YYYY-MM-DD.
| Name: |
dei_DocumentPeriodEndDate |
| Namespace Prefix: |
dei_ |
| Data Type: |
xbrli:dateItemType |
| Balance Type: |
na |
| Period Type: |
duration |
|
| X |
- DefinitionThe type of document being provided (such as 10-K, 10-Q, 485BPOS, etc). The document type is limited to the same value as the supporting SEC submission type, or the word 'Other'.
| Name: |
dei_DocumentType |
| Namespace Prefix: |
dei_ |
| Data Type: |
dei:submissionTypeItemType |
| Balance Type: |
na |
| Period Type: |
duration |
|
| X |
- DefinitionA unique 10-digit SEC-issued value to identify entities that have filed disclosures with the SEC. It is commonly abbreviated as CIK. Reference 1: http://www.xbrl.org/2003/role/presentationRef
-Publisher SEC
-Name Exchange Act
-Number 240
-Section 12
-Subsection b-2
| Name: |
dei_EntityCentralIndexKey |
| Namespace Prefix: |
dei_ |
| Data Type: |
dei:centralIndexKeyItemType |
| Balance Type: |
na |
| Period Type: |
duration |
|
| X |
- DefinitionCommission file number. The field allows up to 17 characters. The prefix may contain 1-3 digits, the sequence number may contain 1-8 digits, the optional suffix may contain 1-4 characters, and the fields are separated with a hyphen.
| Name: |
dei_EntityFileNumber |
| Namespace Prefix: |
dei_ |
| Data Type: |
dei:fileNumberItemType |
| Balance Type: |
na |
| Period Type: |
duration |
|
| X |
- DefinitionThe exact name of the entity filing the report as specified in its charter, which is required by forms filed with the SEC. Reference 1: http://www.xbrl.org/2003/role/presentationRef
-Publisher SEC
-Name Exchange Act
-Number 240
-Section 12
-Subsection b-2
| Name: |
dei_EntityRegistrantName |
| Namespace Prefix: |
dei_ |
| Data Type: |
xbrli:normalizedStringItemType |
| Balance Type: |
na |
| Period Type: |
duration |
|
v3.24.1.u1
Condensed Consolidated Interim Statements of Financial Position - USD ($)
|
Mar. 31, 2024 |
Dec. 31, 2023 |
Mar. 31, 2023 |
| Current Assets |
|
|
|
| Cash and cash equivalents |
$ 48,194
|
$ 55,641
|
$ 27,121
|
| Trade receivables, net |
18,855
|
19,877
|
20,925
|
| Other accounts receivables |
6,411
|
5,965
|
3,603
|
| Inventories |
84,348
|
88,479
|
79,754
|
| Total Current Assets |
157,808
|
169,962
|
131,403
|
| Non-Current Assets |
|
|
|
| Property, plant and equipment, net |
30,727
|
28,224
|
26,496
|
| Right-of-use assets |
7,632
|
7,761
|
5,836
|
| Intangible assets, Goodwill and other long-term assets |
138,623
|
140,465
|
145,305
|
| Contract assets |
8,384
|
8,495
|
7,755
|
| Total Non-Current Assets |
185,366
|
184,945
|
185,392
|
| Total Assets |
343,174
|
354,907
|
316,795
|
| Current Liabilities |
|
|
|
| Current maturities of bank loans |
|
|
4,444
|
| Current maturities of lease liabilities |
1,467
|
1,384
|
1,438
|
| Current maturities of other long term liabilities |
12,980
|
14,996
|
29,414
|
| Trade payables |
16,492
|
24,804
|
26,210
|
| Other accounts payables |
6,210
|
8,261
|
7,350
|
| Deferred revenues |
26
|
148
|
419
|
| Total Current Liabilities |
37,175
|
49,593
|
69,275
|
| Non-Current Liabilities |
|
|
|
| Bank loans |
|
|
11,852
|
| Lease liabilities |
7,278
|
7,438
|
4,992
|
| Contingent consideration |
16,760
|
18,855
|
18,115
|
| Other long-term liabilities |
34,842
|
34,379
|
37,280
|
| Employee benefit liabilities, net |
609
|
621
|
473
|
| Total Non-Current Liabilities |
59,489
|
61,293
|
72,712
|
| Shareholder’s Equity |
|
|
|
| Ordinary shares |
15,022
|
15,021
|
11,736
|
| Additional paid in capital net |
266,183
|
265,848
|
210,665
|
| Capital reserve due to translation to presentation currency |
(3,490)
|
(3,490)
|
(3,490)
|
| Capital reserve from hedges |
12
|
140
|
(99)
|
| Capital reserve from share-based payments |
6,336
|
6,427
|
5,750
|
| Capital reserve from employee benefits |
282
|
275
|
539
|
| Accumulated deficit |
(37,835)
|
(40,200)
|
(50,293)
|
| Total Shareholder’s Equity |
246,510
|
244,021
|
174,808
|
| Total Liabilities and Shareholder’s Equity |
$ 343,174
|
$ 354,907
|
$ 316,795
|
| X |
- DefinitionThe amount received or receivable from the issuance of the entity's shares in excess of nominal value and amounts received from other transactions involving the entity's stock or stockholders. Reference 1: http://www.xbrl.org/2009/role/commonPracticeRef
-Name IAS
-Number 1
-IssueDate 2023-01-01
-Paragraph 55
-URI https://taxonomy.ifrs.org/xifrs-link?type=IAS&num=1&code=ifrs-tx-2023-en-r&anchor=para_55&doctype=Standard
-URIDate 2023-03-23
| Name: |
ifrs-full_AdditionalPaidinCapital |
| Namespace Prefix: |
ifrs-full_ |
| Data Type: |
xbrli:monetaryItemType |
| Balance Type: |
credit |
| Period Type: |
instant |
|
| X |
- DefinitionThe amount of a present economic resource controlled by the entity as a result of past events. Economic resource is a right that has the potential to produce economic benefits. Reference 1: http://www.xbrl.org/2003/role/disclosureRef
-Name IFRS
-Number 13
-IssueDate 2023-01-01
-Paragraph 93
-Subparagraph a
-URI https://taxonomy.ifrs.org/xifrs-link?type=IFRS&num=13&code=ifrs-tx-2023-en-r&anchor=para_93_a&doctype=Standard
-URIDate 2023-03-23
Reference 2: http://www.xbrl.org/2003/role/disclosureRef
-Name IFRS
-Number 8
-IssueDate 2023-01-01
-Paragraph 28
-Subparagraph c
-URI https://taxonomy.ifrs.org/xifrs-link?type=IFRS&num=8&code=ifrs-tx-2023-en-r&anchor=para_28_c&doctype=Standard
-URIDate 2023-03-23
Reference 3: http://www.xbrl.org/2003/role/disclosureRef
-Name IFRS
-Number 13
-IssueDate 2023-01-01
-Paragraph 93
-Subparagraph b
-URI https://taxonomy.ifrs.org/xifrs-link?type=IFRS&num=13&code=ifrs-tx-2023-en-r&anchor=para_93_b&doctype=Standard
-URIDate 2023-03-23
Reference 4: http://www.xbrl.org/2003/role/disclosureRef
-Name IFRS
-Number 13
-IssueDate 2023-01-01
-Paragraph 93
-Subparagraph e
-URI https://taxonomy.ifrs.org/xifrs-link?type=IFRS&num=13&code=ifrs-tx-2023-en-r&anchor=para_93_e&doctype=Standard
-URIDate 2023-03-23
Reference 5: http://www.xbrl.org/2003/role/disclosureRef
-Name IFRS
-Number 8
-IssueDate 2023-01-01
-Paragraph 23
-URI https://taxonomy.ifrs.org/xifrs-link?type=IFRS&num=8&code=ifrs-tx-2023-en-r&anchor=para_23&doctype=Standard
-URIDate 2023-03-23
Reference 6: http://www.xbrl.org/2003/role/disclosureRef
-Name IAS
-Number 1
-IssueDate 2023-01-01
-Paragraph 55
-URI https://taxonomy.ifrs.org/xifrs-link?type=IAS&num=1&code=ifrs-tx-2023-en-r&anchor=para_55&doctype=Standard
-URIDate 2023-03-23
| Name: |
ifrs-full_Assets |
| Namespace Prefix: |
ifrs-full_ |
| Data Type: |
xbrli:monetaryItemType |
| Balance Type: |
debit |
| Period Type: |
instant |
|
| X |
- DefinitionThe amount of cash on hand and demand deposits, along with short-term, highly liquid investments that are readily convertible to known amounts of cash and that are subject to an insignificant risk of changes in value. [Refer: Cash; Cash equivalents] Reference 1: http://www.xbrl.org/2003/role/disclosureRef
-Name IAS
-Number 7
-IssueDate 2023-01-01
-Paragraph 45
-URI https://taxonomy.ifrs.org/xifrs-link?type=IAS&num=7&code=ifrs-tx-2023-en-r&anchor=para_45&doctype=Standard
-URIDate 2023-03-23
Reference 2: http://www.xbrl.org/2003/role/disclosureRef
-Name IFRS
-Number 12
-IssueDate 2023-01-01
-Paragraph B13
-Subparagraph a
-URI https://taxonomy.ifrs.org/xifrs-link?type=IFRS&num=12&code=ifrs-tx-2023-en-r&anchor=para_B13_a&doctype=Appendix&subtype=B
-URIDate 2023-03-23
Reference 3: http://www.xbrl.org/2003/role/disclosureRef
-Name IAS
-Number 1
-IssueDate 2023-01-01
-Paragraph 54
-Subparagraph i
-URI https://taxonomy.ifrs.org/xifrs-link?type=IAS&num=1&code=ifrs-tx-2023-en-r&anchor=para_54_i&doctype=Standard
-URIDate 2023-03-23
| Name: |
ifrs-full_CashAndCashEquivalents |
| Namespace Prefix: |
ifrs-full_ |
| Data Type: |
xbrli:monetaryItemType |
| Balance Type: |
debit |
| Period Type: |
instant |
|
| X |
- DefinitionThe amount of an entity’s right to consideration in exchange for goods or services that the entity has transferred to a customer, when that right is conditioned on something other than the passage of time (for example, the entity’s future performance). Reference 1: http://www.xbrl.org/2003/role/disclosureRef
-Name IFRS
-Number 15
-IssueDate 2023-01-01
-Paragraph 105
-URI https://taxonomy.ifrs.org/xifrs-link?type=IFRS&num=15&code=ifrs-tx-2023-en-r&anchor=para_105&doctype=Standard
-URIDate 2023-03-23
Reference 2: http://www.xbrl.org/2003/role/disclosureRef
-Name IFRS
-Number 15
-IssueDate 2023-01-01
-Paragraph 116
-Subparagraph a
-URI https://taxonomy.ifrs.org/xifrs-link?type=IFRS&num=15&code=ifrs-tx-2023-en-r&anchor=para_116_a&doctype=Standard
-URIDate 2023-03-23
| Name: |
ifrs-full_ContractAssets |
| Namespace Prefix: |
ifrs-full_ |
| Data Type: |
xbrli:monetaryItemType |
| Balance Type: |
debit |
| Period Type: |
instant |
|
| X |
- DefinitionThe amount of assets that the entity (a) expects to realise or intends to sell or consume in its normal operating cycle; (b) holds primarily for the purpose of trading; (c) expects to realise within twelve months after the reporting period; or (d) classifies as cash or cash equivalents (as defined in IAS 7) unless the asset is restricted from being exchanged or used to settle a liability for at least twelve months after the reporting period. [Refer: Assets] Reference 1: http://www.xbrl.org/2003/role/exampleRef
-Name IFRS
-Number 12
-IssueDate 2023-01-01
-Paragraph B10
-Subparagraph b
-URI https://taxonomy.ifrs.org/xifrs-link?type=IFRS&num=12&code=ifrs-tx-2023-en-r&anchor=para_B10_b&doctype=Appendix&subtype=B
-URIDate 2023-03-23
Reference 2: http://www.xbrl.org/2003/role/disclosureRef
-Name IFRS
-Number 12
-IssueDate 2023-01-01
-Paragraph B12
-Subparagraph b
-Clause i
-URI https://taxonomy.ifrs.org/xifrs-link?type=IFRS&num=12&code=ifrs-tx-2023-en-r&anchor=para_B12_b_i&doctype=Appendix&subtype=B
-URIDate 2023-03-23
Reference 3: http://www.xbrl.org/2003/role/disclosureRef
-Name IAS
-Number 1
-IssueDate 2023-01-01
-Paragraph 66
-URI https://taxonomy.ifrs.org/xifrs-link?type=IAS&num=1&code=ifrs-tx-2023-en-r&anchor=para_66&doctype=Standard
-URIDate 2023-03-23
| Name: |
ifrs-full_CurrentAssets |
| Namespace Prefix: |
ifrs-full_ |
| Data Type: |
xbrli:monetaryItemType |
| Balance Type: |
debit |
| Period Type: |
instant |
|
| X |
- References
+ Details
| Name: |
ifrs-full_CurrentAssetsAbstract |
| Namespace Prefix: |
ifrs-full_ |
| Data Type: |
xbrli:stringItemType |
| Balance Type: |
na |
| Period Type: |
duration |
|
| X |
- DefinitionThe amount of current lease liabilities. [Refer: Lease liabilities] Reference 1: http://www.xbrl.org/2003/role/disclosureRef
-Name IFRS
-Number 16
-IssueDate 2023-01-01
-Paragraph 47
-Subparagraph b
-URI https://taxonomy.ifrs.org/xifrs-link?type=IFRS&num=16&code=ifrs-tx-2023-en-r&anchor=para_47_b&doctype=Standard
-URIDate 2023-03-23
| Name: |
ifrs-full_CurrentLeaseLiabilities |
| Namespace Prefix: |
ifrs-full_ |
| Data Type: |
xbrli:monetaryItemType |
| Balance Type: |
credit |
| Period Type: |
instant |
|
| X |
- DefinitionThe amount of liabilities that: (a) the entity expects to settle in its normal operating cycle; (b) the entity holds primarily for the purpose of trading; (c) are due to be settled within twelve months after the reporting period; or (d) the entity does not have the right at the end of the reporting period to defer settlement for at least twelve months after the reporting period. Reference 1: http://www.xbrl.org/2003/role/exampleRef
-Name IFRS
-Number 12
-IssueDate 2023-01-01
-Paragraph B10
-Subparagraph b
-URI https://taxonomy.ifrs.org/xifrs-link?type=IFRS&num=12&code=ifrs-tx-2023-en-r&anchor=para_B10_b&doctype=Appendix&subtype=B
-URIDate 2023-03-23
Reference 2: http://www.xbrl.org/2003/role/disclosureRef
-Name IFRS
-Number 12
-IssueDate 2023-01-01
-Paragraph B12
-Subparagraph b
-Clause iii
-URI https://taxonomy.ifrs.org/xifrs-link?type=IFRS&num=12&code=ifrs-tx-2023-en-r&anchor=para_B12_b_iii&doctype=Appendix&subtype=B
-URIDate 2023-03-23
Reference 3: http://www.xbrl.org/2003/role/disclosureRef
-Name IAS
-Number 1
-IssueDate 2023-01-01
-Paragraph 69
-URI https://taxonomy.ifrs.org/xifrs-link?type=IAS&num=1&code=ifrs-tx-2023-en-r&anchor=para_69&doctype=Standard
-URIDate 2023-03-23
| Name: |
ifrs-full_CurrentLiabilities |
| Namespace Prefix: |
ifrs-full_ |
| Data Type: |
xbrli:monetaryItemType |
| Balance Type: |
credit |
| Period Type: |
instant |
|
| X |
- References
+ Details
| Name: |
ifrs-full_CurrentLiabilitiesAbstract |
| Namespace Prefix: |
ifrs-full_ |
| Data Type: |
xbrli:stringItemType |
| Balance Type: |
na |
| Period Type: |
duration |
|
| X |
- DefinitionThe current portion of non-current borrowings. [Refer: Borrowings] Reference 1: http://www.xbrl.org/2009/role/commonPracticeRef
-Name IAS
-Number 1
-IssueDate 2023-01-01
-Paragraph 55
-URI https://taxonomy.ifrs.org/xifrs-link?type=IAS&num=1&code=ifrs-tx-2023-en-r&anchor=para_55&doctype=Standard
-URIDate 2023-03-23
| Name: |
ifrs-full_CurrentPortionOfLongtermBorrowings |
| Namespace Prefix: |
ifrs-full_ |
| Data Type: |
xbrli:monetaryItemType |
| Balance Type: |
credit |
| Period Type: |
instant |
|
| X |
- DefinitionThe amount of current trade receivables. [Refer: Trade receivables] Reference 1: http://www.xbrl.org/2003/role/exampleRef
-Name IAS
-Number 1
-IssueDate 2023-01-01
-Paragraph 78
-Subparagraph b
-URI https://taxonomy.ifrs.org/xifrs-link?type=IAS&num=1&code=ifrs-tx-2023-en-r&anchor=para_78_b&doctype=Standard
-URIDate 2023-03-23
Reference 2: http://www.xbrl.org/2003/role/exampleRef
-Name IAS
-Number 1
-IssueDate 2023-01-01
-Paragraph 68
-URI https://taxonomy.ifrs.org/xifrs-link?type=IAS&num=1&code=ifrs-tx-2023-en-r&anchor=para_68&doctype=Standard
-URIDate 2023-03-23
| Name: |
ifrs-full_CurrentTradeReceivables |
| Namespace Prefix: |
ifrs-full_ |
| Data Type: |
xbrli:monetaryItemType |
| Balance Type: |
debit |
| Period Type: |
instant |
|
| X |
- DefinitionThe amount of residual interest in the assets of the entity after deducting all its liabilities. Reference 1: http://www.xbrl.org/2003/role/disclosureRef
-Name IFRS
-Number 1
-IssueDate 2023-01-01
-Paragraph 24
-Subparagraph a
-URI https://taxonomy.ifrs.org/xifrs-link?type=IFRS&num=1&code=ifrs-tx-2023-en-r&anchor=para_24_a&doctype=Standard
-URIDate 2023-03-23
Reference 2: http://www.xbrl.org/2003/role/disclosureRef
-Name IFRS
-Number 1
-IssueDate 2023-01-01
-Paragraph 32
-Subparagraph a
-Clause i
-URI https://taxonomy.ifrs.org/xifrs-link?type=IFRS&num=1&code=ifrs-tx-2023-en-r&anchor=para_32_a_i&doctype=Standard
-URIDate 2023-03-23
Reference 3: http://www.xbrl.org/2003/role/disclosureRef
-Name IFRS
-Number 13
-IssueDate 2023-01-01
-Paragraph 93
-Subparagraph a
-URI https://taxonomy.ifrs.org/xifrs-link?type=IFRS&num=13&code=ifrs-tx-2023-en-r&anchor=para_93_a&doctype=Standard
-URIDate 2023-03-23
Reference 4: http://www.xbrl.org/2003/role/disclosureRef
-Name IFRS
-Number 13
-IssueDate 2023-01-01
-Paragraph 93
-Subparagraph b
-URI https://taxonomy.ifrs.org/xifrs-link?type=IFRS&num=13&code=ifrs-tx-2023-en-r&anchor=para_93_b&doctype=Standard
-URIDate 2023-03-23
Reference 5: http://www.xbrl.org/2003/role/disclosureRef
-Name IFRS
-Number 13
-IssueDate 2023-01-01
-Paragraph 93
-Subparagraph e
-URI https://taxonomy.ifrs.org/xifrs-link?type=IFRS&num=13&code=ifrs-tx-2023-en-r&anchor=para_93_e&doctype=Standard
-URIDate 2023-03-23
Reference 6: http://www.xbrl.org/2003/role/disclosureRef
-Name IAS
-Number 1
-IssueDate 2023-01-01
-Paragraph 55
-URI https://taxonomy.ifrs.org/xifrs-link?type=IAS&num=1&code=ifrs-tx-2023-en-r&anchor=para_55&doctype=Standard
-URIDate 2023-03-23
Reference 7: http://www.xbrl.org/2003/role/disclosureRef
-Name IAS
-Number 1
-IssueDate 2023-01-01
-Paragraph 78
-Subparagraph e
-URI https://taxonomy.ifrs.org/xifrs-link?type=IAS&num=1&code=ifrs-tx-2023-en-r&anchor=para_78_e&doctype=Standard
-URIDate 2023-03-23
| Name: |
ifrs-full_Equity |
| Namespace Prefix: |
ifrs-full_ |
| Data Type: |
xbrli:monetaryItemType |
| Balance Type: |
credit |
| Period Type: |
instant |
|
| X |
- References
+ Details
| Name: |
ifrs-full_EquityAbstract |
| Namespace Prefix: |
ifrs-full_ |
| Data Type: |
xbrli:stringItemType |
| Balance Type: |
na |
| Period Type: |
duration |
|
| X |
- DefinitionThe amount of the entity's equity and liabilities. [Refer: Equity; Liabilities] Reference 1: http://www.xbrl.org/2003/role/disclosureRef
-Name IAS
-Number 1
-IssueDate 2023-01-01
-Paragraph 55
-URI https://taxonomy.ifrs.org/xifrs-link?type=IAS&num=1&code=ifrs-tx-2023-en-r&anchor=para_55&doctype=Standard
-URIDate 2023-03-23
| Name: |
ifrs-full_EquityAndLiabilities |
| Namespace Prefix: |
ifrs-full_ |
| Data Type: |
xbrli:monetaryItemType |
| Balance Type: |
credit |
| Period Type: |
instant |
|
| X |
- DefinitionThe amount of identifiable non-monetary assets without physical substance. This amount does not include goodwill. [Refer: Goodwill] Reference 1: http://www.xbrl.org/2003/role/disclosureRef
-Name IAS
-Number 38
-IssueDate 2023-01-01
-Paragraph 118
-Subparagraph e
-URI https://taxonomy.ifrs.org/xifrs-link?type=IAS&num=38&code=ifrs-tx-2023-en-r&anchor=para_118_e&doctype=Standard
-URIDate 2023-03-23
Reference 2: http://www.xbrl.org/2003/role/disclosureRef
-Name IAS
-Number 1
-IssueDate 2023-01-01
-Paragraph 54
-Subparagraph c
-URI https://taxonomy.ifrs.org/xifrs-link?type=IAS&num=1&code=ifrs-tx-2023-en-r&anchor=para_54_c&doctype=Standard
-URIDate 2023-03-23
| Name: |
ifrs-full_IntangibleAssetsOtherThanGoodwill |
| Namespace Prefix: |
ifrs-full_ |
| Data Type: |
xbrli:monetaryItemType |
| Balance Type: |
debit |
| Period Type: |
instant |
|
| X |
- DefinitionThe amount of current inventories. [Refer: Inventories] Reference 1: http://www.xbrl.org/2003/role/disclosureRef
-Name IAS
-Number 2
-IssueDate 2023-01-01
-Paragraph 36
-Subparagraph b
-URI https://taxonomy.ifrs.org/xifrs-link?type=IAS&num=2&code=ifrs-tx-2023-en-r&anchor=para_36_b&doctype=Standard
-URIDate 2023-03-23
Reference 2: http://www.xbrl.org/2003/role/disclosureRef
-Name IAS
-Number 1
-IssueDate 2023-01-01
-Paragraph 54
-Subparagraph g
-URI https://taxonomy.ifrs.org/xifrs-link?type=IAS&num=1&code=ifrs-tx-2023-en-r&anchor=para_54_g&doctype=Standard
-URIDate 2023-03-23
Reference 3: http://www.xbrl.org/2003/role/exampleRef
-Name IAS
-Number 1
-IssueDate 2023-01-01
-Paragraph 68
-URI https://taxonomy.ifrs.org/xifrs-link?type=IAS&num=1&code=ifrs-tx-2023-en-r&anchor=para_68&doctype=Standard
-URIDate 2023-03-23
| Name: |
ifrs-full_Inventories |
| Namespace Prefix: |
ifrs-full_ |
| Data Type: |
xbrli:monetaryItemType |
| Balance Type: |
debit |
| Period Type: |
instant |
|
| X |
- DefinitionThe nominal value of capital issued. Reference 1: http://www.xbrl.org/2003/role/exampleRef
-Name IAS
-Number 1
-IssueDate 2023-01-01
-Paragraph 78
-Subparagraph e
-URI https://taxonomy.ifrs.org/xifrs-link?type=IAS&num=1&code=ifrs-tx-2023-en-r&anchor=para_78_e&doctype=Standard
-URIDate 2023-03-23
| Name: |
ifrs-full_IssuedCapital |
| Namespace Prefix: |
ifrs-full_ |
| Data Type: |
xbrli:monetaryItemType |
| Balance Type: |
credit |
| Period Type: |
instant |
|
| X |
- DefinitionThe non-current portion of non-current borrowings. [Refer: Borrowings] Reference 1: http://www.xbrl.org/2009/role/commonPracticeRef
-Name IAS
-Number 1
-IssueDate 2023-01-01
-Paragraph 55
-URI https://taxonomy.ifrs.org/xifrs-link?type=IAS&num=1&code=ifrs-tx-2023-en-r&anchor=para_55&doctype=Standard
-URIDate 2023-03-23
| Name: |
ifrs-full_LongtermBorrowings |
| Namespace Prefix: |
ifrs-full_ |
| Data Type: |
xbrli:monetaryItemType |
| Balance Type: |
credit |
| Period Type: |
instant |
|
| X |
- DefinitionThe amount of assets that do not meet the definition of current assets. [Refer: Current assets] Reference 1: http://www.xbrl.org/2003/role/disclosureRef
-Name IFRS
-Number 12
-IssueDate 2023-01-01
-Paragraph B12
-Subparagraph b
-Clause ii
-URI https://taxonomy.ifrs.org/xifrs-link?type=IFRS&num=12&code=ifrs-tx-2023-en-r&anchor=para_B12_b_ii&doctype=Appendix&subtype=B
-URIDate 2023-03-23
Reference 2: http://www.xbrl.org/2003/role/exampleRef
-Name IFRS
-Number 12
-IssueDate 2023-01-01
-Paragraph B10
-Subparagraph b
-URI https://taxonomy.ifrs.org/xifrs-link?type=IFRS&num=12&code=ifrs-tx-2023-en-r&anchor=para_B10_b&doctype=Appendix&subtype=B
-URIDate 2023-03-23
Reference 3: http://www.xbrl.org/2003/role/disclosureRef
-Name IAS
-Number 1
-IssueDate 2023-01-01
-Paragraph 66
-URI https://taxonomy.ifrs.org/xifrs-link?type=IAS&num=1&code=ifrs-tx-2023-en-r&anchor=para_66&doctype=Standard
-URIDate 2023-03-23
| Name: |
ifrs-full_NoncurrentAssets |
| Namespace Prefix: |
ifrs-full_ |
| Data Type: |
xbrli:monetaryItemType |
| Balance Type: |
debit |
| Period Type: |
instant |
|
| X |
- References
+ Details
| Name: |
ifrs-full_NoncurrentAssetsAbstract |
| Namespace Prefix: |
ifrs-full_ |
| Data Type: |
xbrli:stringItemType |
| Balance Type: |
na |
| Period Type: |
duration |
|
| X |
- DefinitionThe amount of non-current lease liabilities. [Refer: Lease liabilities] Reference 1: http://www.xbrl.org/2003/role/disclosureRef
-Name IFRS
-Number 16
-IssueDate 2023-01-01
-Paragraph 47
-Subparagraph b
-URI https://taxonomy.ifrs.org/xifrs-link?type=IFRS&num=16&code=ifrs-tx-2023-en-r&anchor=para_47_b&doctype=Standard
-URIDate 2023-03-23
| Name: |
ifrs-full_NoncurrentLeaseLiabilities |
| Namespace Prefix: |
ifrs-full_ |
| Data Type: |
xbrli:monetaryItemType |
| Balance Type: |
credit |
| Period Type: |
instant |
|
| X |
- DefinitionThe amount of liabilities that do not meet the definition of current liabilities. [Refer: Current liabilities] Reference 1: http://www.xbrl.org/2003/role/disclosureRef
-Name IFRS
-Number 12
-IssueDate 2023-01-01
-Paragraph B12
-Subparagraph b
-Clause iv
-URI https://taxonomy.ifrs.org/xifrs-link?type=IFRS&num=12&code=ifrs-tx-2023-en-r&anchor=para_B12_b_iv&doctype=Appendix&subtype=B
-URIDate 2023-03-23
Reference 2: http://www.xbrl.org/2003/role/exampleRef
-Name IFRS
-Number 12
-IssueDate 2023-01-01
-Paragraph B10
-Subparagraph b
-URI https://taxonomy.ifrs.org/xifrs-link?type=IFRS&num=12&code=ifrs-tx-2023-en-r&anchor=para_B10_b&doctype=Appendix&subtype=B
-URIDate 2023-03-23
Reference 3: http://www.xbrl.org/2003/role/disclosureRef
-Name IAS
-Number 1
-IssueDate 2023-01-01
-Paragraph 69
-URI https://taxonomy.ifrs.org/xifrs-link?type=IAS&num=1&code=ifrs-tx-2023-en-r&anchor=para_69&doctype=Standard
-URIDate 2023-03-23
| Name: |
ifrs-full_NoncurrentLiabilities |
| Namespace Prefix: |
ifrs-full_ |
| Data Type: |
xbrli:monetaryItemType |
| Balance Type: |
credit |
| Period Type: |
instant |
|
| X |
- References
+ Details
| Name: |
ifrs-full_NoncurrentLiabilitiesAbstract |
| Namespace Prefix: |
ifrs-full_ |
| Data Type: |
xbrli:stringItemType |
| Balance Type: |
na |
| Period Type: |
duration |
|
| X |
- DefinitionThe amount of non-current net defined benefit liability. [Refer: Net defined benefit liability] Reference 1: http://www.xbrl.org/2009/role/commonPracticeRef
-Name IAS
-Number 1
-IssueDate 2023-01-01
-Paragraph 55
-URI https://taxonomy.ifrs.org/xifrs-link?type=IAS&num=1&code=ifrs-tx-2023-en-r&anchor=para_55&doctype=Standard
-URIDate 2023-03-23
| Name: |
ifrs-full_NoncurrentRecognisedLiabilitiesDefinedBenefitPlan |
| Namespace Prefix: |
ifrs-full_ |
| Data Type: |
xbrli:monetaryItemType |
| Balance Type: |
credit |
| Period Type: |
instant |
|
| X |
- DefinitionThe amount of current payables that the entity does not separately disclose in the same statement or note. Reference 1: http://www.xbrl.org/2009/role/commonPracticeRef
-Name IAS
-Number 1
-IssueDate 2023-01-01
-Paragraph 55
-URI https://taxonomy.ifrs.org/xifrs-link?type=IAS&num=1&code=ifrs-tx-2023-en-r&anchor=para_55&doctype=Standard
-URIDate 2023-03-23
| Name: |
ifrs-full_OtherCurrentPayables |
| Namespace Prefix: |
ifrs-full_ |
| Data Type: |
xbrli:monetaryItemType |
| Balance Type: |
credit |
| Period Type: |
instant |
|
| X |
- DefinitionThe amount of current other receivables. [Refer: Other receivables] Reference 1: http://www.xbrl.org/2003/role/exampleRef
-Name IAS
-Number 1
-IssueDate 2023-01-01
-Paragraph 78
-Subparagraph b
-URI https://taxonomy.ifrs.org/xifrs-link?type=IAS&num=1&code=ifrs-tx-2023-en-r&anchor=para_78_b&doctype=Standard
-URIDate 2023-03-23
| Name: |
ifrs-full_OtherCurrentReceivables |
| Namespace Prefix: |
ifrs-full_ |
| Data Type: |
xbrli:monetaryItemType |
| Balance Type: |
debit |
| Period Type: |
instant |
|
| X |
- DefinitionThe amount of non-current liabilities that the entity does not separately disclose in the same statement or note. [Refer: Non-current liabilities] Reference 1: http://www.xbrl.org/2009/role/commonPracticeRef
-Name IAS
-Number 1
-IssueDate 2023-01-01
-Paragraph 55
-URI https://taxonomy.ifrs.org/xifrs-link?type=IAS&num=1&code=ifrs-tx-2023-en-r&anchor=para_55&doctype=Standard
-URIDate 2023-03-23
| Name: |
ifrs-full_OtherNoncurrentLiabilities |
| Namespace Prefix: |
ifrs-full_ |
| Data Type: |
xbrli:monetaryItemType |
| Balance Type: |
credit |
| Period Type: |
instant |
|
| X |
- DefinitionThe amount of tangible assets that: (a) are held for use in the production or supply of goods or services, for rental to others, or for administrative purposes; and (b) are expected to be used during more than one period. Note that right-of-use assets are not included. [Contrast: Property, plant and equipment including right-of-use assets] Reference 1: http://www.xbrl.org/2003/role/disclosureRef
-Name IAS
-Number 16
-IssueDate 2023-01-01
-Paragraph 73
-Subparagraph e
-URI https://taxonomy.ifrs.org/xifrs-link?type=IAS&num=16&code=ifrs-tx-2023-en-r&anchor=para_73_e&doctype=Standard
-URIDate 2023-03-23
Reference 2: http://www.xbrl.org/2003/role/disclosureRef
-Name IAS
-Number 1
-IssueDate 2023-01-01
-Paragraph 54
-Subparagraph a
-URI https://taxonomy.ifrs.org/xifrs-link?type=IAS&num=1&code=ifrs-tx-2023-en-r&anchor=para_54_a&doctype=Standard
-URIDate 2023-03-23
| Name: |
ifrs-full_PropertyPlantAndEquipment |
| Namespace Prefix: |
ifrs-full_ |
| Data Type: |
xbrli:monetaryItemType |
| Balance Type: |
debit |
| Period Type: |
instant |
|
| X |
- DefinitionThe amount of rent deferred income classified as non-current. [Refer: Rent deferred income] Reference 1: http://www.xbrl.org/2009/role/commonPracticeRef
-Name IAS
-Number 1
-IssueDate 2023-01-01
-Paragraph 78
-URI https://taxonomy.ifrs.org/xifrs-link?type=IAS&num=1&code=ifrs-tx-2023-en-r&anchor=para_78&doctype=Standard
-URIDate 2023-03-23
| Name: |
ifrs-full_RentDeferredIncomeClassifiedAsNoncurrent |
| Namespace Prefix: |
ifrs-full_ |
| Data Type: |
xbrli:monetaryItemType |
| Balance Type: |
credit |
| Period Type: |
instant |
|
| X |
- DefinitionA component of equity representing the accumulated portion of gain (loss) on a hedging instrument that is determined to be an effective hedge for cash flow hedges. [Refer: Cash flow hedges [member]] Reference 1: http://www.xbrl.org/2009/role/commonPracticeRef
-Name IAS
-Number 1
-IssueDate 2023-01-01
-Paragraph 78
-Subparagraph e
-URI https://taxonomy.ifrs.org/xifrs-link?type=IAS&num=1&code=ifrs-tx-2023-en-r&anchor=para_78_e&doctype=Standard
-URIDate 2023-03-23
Reference 2: http://www.xbrl.org/2003/role/disclosureRef
-Name IFRS
-Number 9
-IssueDate 2023-01-01
-Paragraph 6.5.11
-URI https://taxonomy.ifrs.org/xifrs-link?type=IFRS&num=9&code=ifrs-tx-2023-en-r&anchor=para_6.5.11&doctype=Standard
-URIDate 2023-03-23
| Name: |
ifrs-full_ReserveOfCashFlowHedges |
| Namespace Prefix: |
ifrs-full_ |
| Data Type: |
xbrli:monetaryItemType |
| Balance Type: |
credit |
| Period Type: |
instant |
|
| X |
- DefinitionA component of equity representing the accumulated change in the value of foreign currency basis spreads of financial instruments when excluding them from the designation of these financial instruments as hedging instruments. Reference 1: http://www.xbrl.org/2009/role/commonPracticeRef
-Name IAS
-Number 1
-IssueDate 2023-01-01
-Paragraph 78
-Subparagraph e
-URI https://taxonomy.ifrs.org/xifrs-link?type=IAS&num=1&code=ifrs-tx-2023-en-r&anchor=para_78_e&doctype=Standard
-URIDate 2023-03-23
Reference 2: http://www.xbrl.org/2003/role/disclosureRef
-Name IFRS
-Number 9
-IssueDate 2023-01-01
-Paragraph 6.5.16
-URI https://taxonomy.ifrs.org/xifrs-link?type=IFRS&num=9&code=ifrs-tx-2023-en-r&anchor=para_6.5.16&doctype=Standard
-URIDate 2023-03-23
| Name: |
ifrs-full_ReserveOfChangeInValueOfForeignCurrencyBasisSpreads |
| Namespace Prefix: |
ifrs-full_ |
| Data Type: |
xbrli:monetaryItemType |
| Balance Type: |
credit |
| Period Type: |
instant |
|
| X |
- DefinitionA component of equity representing the accumulated remeasurements of defined benefit plans. [Refer: Defined benefit plans [member]] Reference 1: http://www.xbrl.org/2009/role/commonPracticeRef
-Name IAS
-Number 1
-IssueDate 2023-01-01
-Paragraph 78
-Subparagraph e
-URI https://taxonomy.ifrs.org/xifrs-link?type=IAS&num=1&code=ifrs-tx-2023-en-r&anchor=para_78_e&doctype=Standard
-URIDate 2023-03-23
| Name: |
ifrs-full_ReserveOfRemeasurementsOfDefinedBenefitPlans |
| Namespace Prefix: |
ifrs-full_ |
| Data Type: |
xbrli:monetaryItemType |
| Balance Type: |
credit |
| Period Type: |
instant |
|
| X |
- DefinitionA component of equity resulting from share-based payments. Reference 1: http://www.xbrl.org/2009/role/commonPracticeRef
-Name IAS
-Number 1
-IssueDate 2023-01-01
-Paragraph 78
-Subparagraph e
-URI https://taxonomy.ifrs.org/xifrs-link?type=IAS&num=1&code=ifrs-tx-2023-en-r&anchor=para_78_e&doctype=Standard
-URIDate 2023-03-23
| Name: |
ifrs-full_ReserveOfSharebasedPayments |
| Namespace Prefix: |
ifrs-full_ |
| Data Type: |
xbrli:monetaryItemType |
| Balance Type: |
credit |
| Period Type: |
instant |
|
| X |
- DefinitionA component of equity representing the entity's cumulative undistributed earnings or deficit. Reference 1: http://www.xbrl.org/2003/role/exampleRef
-Name IAS
-Number 1
-IssueDate 2023-01-01
-Paragraph IG6
-URI https://taxonomy.ifrs.org/xifrs-link?type=IAS&num=1&code=ifrs-tx-2023-en-r&anchor=para_IG6&doctype=Implementation%20Guidance
-URIDate 2023-03-23
Reference 2: http://www.xbrl.org/2003/role/exampleRef
-Name IAS
-Number 1
-IssueDate 2023-01-01
-Paragraph 78
-Subparagraph e
-URI https://taxonomy.ifrs.org/xifrs-link?type=IAS&num=1&code=ifrs-tx-2023-en-r&anchor=para_78_e&doctype=Standard
-URIDate 2023-03-23
| Name: |
ifrs-full_RetainedEarnings |
| Namespace Prefix: |
ifrs-full_ |
| Data Type: |
xbrli:monetaryItemType |
| Balance Type: |
credit |
| Period Type: |
instant |
|
| X |
- DefinitionThe amount of assets that represent a lessee's right to use an underlying asset for the lease term that do not meet the definition of investment property. Underlying asset is an asset that is the subject of a lease, for which the right to use that asset has been provided by a lessor to a lessee. Reference 1: http://www.xbrl.org/2003/role/disclosureRef
-Name IFRS
-Number 16
-IssueDate 2023-01-01
-Paragraph 53
-Subparagraph j
-URI https://taxonomy.ifrs.org/xifrs-link?type=IFRS&num=16&code=ifrs-tx-2023-en-r&anchor=para_53_j&doctype=Standard
-URIDate 2023-03-23
Reference 2: http://www.xbrl.org/2003/role/disclosureRef
-Name IFRS
-Number 16
-IssueDate 2023-01-01
-Paragraph 47
-Subparagraph a
-URI https://taxonomy.ifrs.org/xifrs-link?type=IFRS&num=16&code=ifrs-tx-2023-en-r&anchor=para_47_a&doctype=Standard
-URIDate 2023-03-23
| Name: |
ifrs-full_RightofuseAssets |
| Namespace Prefix: |
ifrs-full_ |
| Data Type: |
xbrli:monetaryItemType |
| Balance Type: |
debit |
| Period Type: |
instant |
|
| X |
- DefinitionThe amount of current borrowings. [Refer: Borrowings] Reference 1: http://www.xbrl.org/2009/role/commonPracticeRef
-Name IAS
-Number 1
-IssueDate 2023-01-01
-Paragraph 55
-URI https://taxonomy.ifrs.org/xifrs-link?type=IAS&num=1&code=ifrs-tx-2023-en-r&anchor=para_55&doctype=Standard
-URIDate 2023-03-23
| Name: |
ifrs-full_ShorttermBorrowings |
| Namespace Prefix: |
ifrs-full_ |
| Data Type: |
xbrli:monetaryItemType |
| Balance Type: |
credit |
| Period Type: |
instant |
|
| X |
- DefinitionThe amount of current trade payables and current other payables. [Refer: Current trade payables; Other current payables] Reference 1: http://www.xbrl.org/2003/role/disclosureRef
-Name IAS
-Number 1
-IssueDate 2023-01-01
-Paragraph 54
-Subparagraph k
-URI https://taxonomy.ifrs.org/xifrs-link?type=IAS&num=1&code=ifrs-tx-2023-en-r&anchor=para_54_k&doctype=Standard
-URIDate 2023-03-23
| Name: |
ifrs-full_TradeAndOtherCurrentPayables |
| Namespace Prefix: |
ifrs-full_ |
| Data Type: |
xbrli:monetaryItemType |
| Balance Type: |
credit |
| Period Type: |
instant |
|
| X |
- Definition
+ References
+ Details
| Name: |
kmda_ContingentConsiderations |
| Namespace Prefix: |
kmda_ |
| Data Type: |
xbrli:monetaryItemType |
| Balance Type: |
credit |
| Period Type: |
instant |
|
v3.24.1.u1
Condensed Consolidated Interim Statements of Profit or Loss and Other Comprehensive Income - USD ($)
|
3 Months Ended |
12 Months Ended |
Mar. 31, 2024 |
Mar. 31, 2023 |
Dec. 31, 2023 |
| Income Statement [Abstract] |
|
|
|
| Revenues from proprietary products |
$ 33,758
|
$ 24,061
|
$ 115,458
|
| Revenues from distribution |
3,978
|
6,649
|
27,061
|
| Total revenues |
37,736
|
30,710
|
142,519
|
| Cost of revenues from proprietary products |
17,620
|
13,224
|
63,342
|
| Cost of revenues from distribution |
3,365
|
5,647
|
23,687
|
| Total cost of revenues |
20,985
|
18,871
|
87,029
|
| Gross profit |
16,751
|
11,839
|
55,490
|
| Research and development expenses |
4,295
|
3,231
|
13,933
|
| Selling and marketing expenses |
4,631
|
3,922
|
16,193
|
| General and administrative expenses |
3,786
|
3,418
|
14,381
|
| Other expenses |
|
979
|
919
|
| Operating income (loss) |
4,039
|
289
|
10,064
|
| Financial income |
280
|
25
|
588
|
| Income (expenses) in respect of currency exchange differences and derivatives instruments, net |
124
|
151
|
55
|
| Financial Income (expense) in respect of contingent consideration and other long- term liabilities. |
(1,845)
|
(1,761)
|
(980)
|
| Financial expenses |
(159)
|
(500)
|
(1,298)
|
| Income before tax on income |
2,439
|
(1,796)
|
8,429
|
| Taxes on income |
74
|
13
|
145
|
| Net Income (loss) |
2,365
|
(1,809)
|
8,284
|
| Other Comprehensive Income (loss): |
|
|
|
| Gain (loss) on cash flow hedges |
(71)
|
(156)
|
(186)
|
| Net amounts transferred to the statement of profit or loss for cash flow hedges |
(57)
|
145
|
414
|
| Items that will not be reclassified to profit or loss in subsequent periods: |
|
|
|
| Remeasurement gain (loss) from defined benefit plan |
7
|
191
|
(73)
|
| Total comprehensive income (loss) |
$ 2,244
|
$ (1,629)
|
$ 8,439
|
| Earnings per share attributable to equity holders of the Company: |
|
|
|
| Basic net earnings per share (in Dollars per share) |
$ 0.04
|
$ (0.04)
|
$ 0.17
|
| Diluted net earnings per share (in Dollars per share) |
$ 0.04
|
$ (0.04)
|
$ 0.15
|
| X |
- DefinitionThe amount of profit (loss) attributable to ordinary equity holders of the parent entity (the numerator) divided by the weighted average number of ordinary shares outstanding during the period (the denominator). Reference 1: http://www.xbrl.org/2003/role/disclosureRef
-Name IAS
-Number 33
-IssueDate 2023-01-01
-Paragraph 66
-URI https://taxonomy.ifrs.org/xifrs-link?type=IAS&num=33&code=ifrs-tx-2023-en-r&anchor=para_66&doctype=Standard
-URIDate 2023-03-23
Reference 2: http://www.xbrl.org/2003/role/disclosureRef
-Name IAS
-Number 33
-IssueDate 2023-01-01
-Paragraph 67
-URI https://taxonomy.ifrs.org/xifrs-link?type=IAS&num=33&code=ifrs-tx-2023-en-r&anchor=para_67&doctype=Standard
-URIDate 2023-03-23
| Name: |
ifrs-full_BasicEarningsLossPerShare |
| Namespace Prefix: |
ifrs-full_ |
| Data Type: |
dtr-types:perShareItemType |
| Balance Type: |
na |
| Period Type: |
duration |
|
| X |
- DefinitionThe comprehensive income from continuing operations. [Refer: Continuing operations [member]; Comprehensive income] Reference 1: http://www.xbrl.org/2009/role/commonPracticeRef
-Name IFRS
-Number 5
-IssueDate 2023-01-01
-Paragraph 33
-Subparagraph d
-URI https://taxonomy.ifrs.org/xifrs-link?type=IFRS&num=5&code=ifrs-tx-2023-en-r&anchor=para_33_d&doctype=Standard
-URIDate 2023-03-23
| Name: |
ifrs-full_ComprehensiveIncomeFromContinuingOperations |
| Namespace Prefix: |
ifrs-full_ |
| Data Type: |
xbrli:monetaryItemType |
| Balance Type: |
credit |
| Period Type: |
duration |
|
| X |
- DefinitionThe amount of all expenses directly or indirectly attributed to the goods or services sold. Attributed expenses include, but are not limited to, costs previously included in the measurement of inventory that has now been sold, such as depreciation and maintenance of factory buildings and equipment used in the production process, unallocated production overheads, and abnormal amounts of production costs of inventories. Reference 1: http://www.xbrl.org/2003/role/disclosureRef
-Name IAS
-Number 1
-IssueDate 2023-01-01
-Paragraph 99
-URI https://taxonomy.ifrs.org/xifrs-link?type=IAS&num=1&code=ifrs-tx-2023-en-r&anchor=para_99&doctype=Standard
-URIDate 2023-03-23
Reference 2: http://www.xbrl.org/2003/role/disclosureRef
-Name IAS
-Number 1
-IssueDate 2023-01-01
-Paragraph 103
-URI https://taxonomy.ifrs.org/xifrs-link?type=IAS&num=1&code=ifrs-tx-2023-en-r&anchor=para_103&doctype=Standard
-URIDate 2023-03-23
| Name: |
ifrs-full_CostOfSales |
| Namespace Prefix: |
ifrs-full_ |
| Data Type: |
xbrli:monetaryItemType |
| Balance Type: |
debit |
| Period Type: |
duration |
|
| X |
- DefinitionThe amount of profit (loss) attributable to ordinary equity holders of the parent entity (the numerator), divided by the weighted average number of ordinary shares outstanding during the period (the denominator), both adjusted for the effects of all dilutive potential ordinary shares. [Refer: Ordinary shares [member]; Weighted average [member]] Reference 1: http://www.xbrl.org/2003/role/disclosureRef
-Name IAS
-Number 33
-IssueDate 2023-01-01
-Paragraph 66
-URI https://taxonomy.ifrs.org/xifrs-link?type=IAS&num=33&code=ifrs-tx-2023-en-r&anchor=para_66&doctype=Standard
-URIDate 2023-03-23
Reference 2: http://www.xbrl.org/2003/role/disclosureRef
-Name IAS
-Number 33
-IssueDate 2023-01-01
-Paragraph 67
-URI https://taxonomy.ifrs.org/xifrs-link?type=IAS&num=33&code=ifrs-tx-2023-en-r&anchor=para_67&doctype=Standard
-URIDate 2023-03-23
| Name: |
ifrs-full_DilutedEarningsLossPerShare |
| Namespace Prefix: |
ifrs-full_ |
| Data Type: |
dtr-types:perShareItemType |
| Balance Type: |
na |
| Period Type: |
duration |
|
| X |
- References
+ Details
| Name: |
ifrs-full_EarningsPerShareAbstract |
| Namespace Prefix: |
ifrs-full_ |
| Data Type: |
xbrli:stringItemType |
| Balance Type: |
na |
| Period Type: |
duration |
|
| X |
- DefinitionThe amount of income associated with interest and other financing activities of the entity. Reference 1: http://www.xbrl.org/2009/role/commonPracticeRef
-Name IAS
-Number 1
-IssueDate 2023-01-01
-Paragraph 85
-URI https://taxonomy.ifrs.org/xifrs-link?type=IAS&num=1&code=ifrs-tx-2023-en-r&anchor=para_85&doctype=Standard
-URIDate 2023-03-23
| Name: |
ifrs-full_FinanceIncome |
| Namespace Prefix: |
ifrs-full_ |
| Data Type: |
xbrli:monetaryItemType |
| Balance Type: |
credit |
| Period Type: |
duration |
|
| X |
- DefinitionThe amount of finance income (expenses) from reinsurance contracts held that is recognised in profit or loss. [Refer: Insurance finance income (expenses); Reinsurance contracts held [member]] Reference 1: http://www.xbrl.org/2003/role/disclosureRef
-Name IFRS
-Number 17
-IssueDate 2023-01-01
-Paragraph 82
-URI https://taxonomy.ifrs.org/xifrs-link?type=IFRS&num=17&code=ifrs-tx-2023-en-r&anchor=para_82&doctype=Standard
-URIDate 2023-03-23
Reference 2: http://www.xbrl.org/2003/role/disclosureRef
-Name IAS
-Number 1
-IssueDate 2023-01-01
-Paragraph 82
-Subparagraph bc
-URI https://taxonomy.ifrs.org/xifrs-link?type=IAS&num=1&code=ifrs-tx-2023-en-r&anchor=para_82_bc&doctype=Standard
-URIDate 2023-03-23
| Name: |
ifrs-full_FinanceIncomeExpensesFromReinsuranceContractsHeldRecognisedInProfitOrLoss |
| Namespace Prefix: |
ifrs-full_ |
| Data Type: |
xbrli:monetaryItemType |
| Balance Type: |
credit |
| Period Type: |
duration |
|
| X |
- DefinitionThe gains (losses) recognised in other comprehensive income on cash flow hedges, net of tax, before reclassification adjustments. [Refer: Cash flow hedges [member]] Reference 1: http://www.xbrl.org/2003/role/disclosureRef
-Name IAS
-Number 1
-IssueDate 2023-01-01
-Paragraph 91
-Subparagraph a
-URI https://taxonomy.ifrs.org/xifrs-link?type=IAS&num=1&code=ifrs-tx-2023-en-r&anchor=para_91_a&doctype=Standard
-URIDate 2023-03-23
Reference 2: http://www.xbrl.org/2003/role/disclosureRef
-Name IFRS
-Number 7
-IssueDate 2023-01-01
-Paragraph 24C
-Subparagraph b
-Clause i
-URI https://taxonomy.ifrs.org/xifrs-link?type=IFRS&num=7&code=ifrs-tx-2023-en-r&anchor=para_24C_b_i&doctype=Standard
-URIDate 2023-03-23
Reference 3: http://www.xbrl.org/2003/role/disclosureRef
-Name IFRS
-Number 7
-IssueDate 2023-01-01
-Paragraph 24E
-Subparagraph a
-URI https://taxonomy.ifrs.org/xifrs-link?type=IFRS&num=7&code=ifrs-tx-2023-en-r&anchor=para_24E_a&doctype=Standard
-URIDate 2023-03-23
| Name: |
ifrs-full_GainsLossesOnCashFlowHedgesNetOfTax |
| Namespace Prefix: |
ifrs-full_ |
| Data Type: |
xbrli:monetaryItemType |
| Balance Type: |
credit |
| Period Type: |
duration |
|
| X |
- DefinitionThe amount of expense relating to general and administrative activities of the entity. Reference 1: http://www.xbrl.org/2009/role/commonPracticeRef
-Name IAS
-Number 1
-IssueDate 2023-01-01
-Paragraph 112
-Subparagraph c
-URI https://taxonomy.ifrs.org/xifrs-link?type=IAS&num=1&code=ifrs-tx-2023-en-r&anchor=para_112_c&doctype=Standard
-URIDate 2023-03-23
| Name: |
ifrs-full_GeneralAndAdministrativeExpense |
| Namespace Prefix: |
ifrs-full_ |
| Data Type: |
xbrli:monetaryItemType |
| Balance Type: |
debit |
| Period Type: |
duration |
|
| X |
- DefinitionThe amount of revenue less cost of sales. [Refer: Cost of sales; Revenue] Reference 1: http://www.xbrl.org/2003/role/exampleRef
-Name IAS
-Number 1
-IssueDate 2023-01-01
-Paragraph 103
-URI https://taxonomy.ifrs.org/xifrs-link?type=IAS&num=1&code=ifrs-tx-2023-en-r&anchor=para_103&doctype=Standard
-URIDate 2023-03-23
| Name: |
ifrs-full_GrossProfit |
| Namespace Prefix: |
ifrs-full_ |
| Data Type: |
xbrli:monetaryItemType |
| Balance Type: |
credit |
| Period Type: |
duration |
|
| X |
- References
+ Details
| Name: |
ifrs-full_IncomeStatementAbstract |
| Namespace Prefix: |
ifrs-full_ |
| Data Type: |
xbrli:stringItemType |
| Balance Type: |
na |
| Period Type: |
duration |
|
| X |
- DefinitionThe amount of other comprehensive income, net of tax, related to gains (losses) on remeasurements of defined benefit plans, which comprise actuarial gains and losses; the return on plan assets, excluding amounts included in net interest on the net defined benefit liability (asset); and any change in the effect of the asset ceiling, excluding amounts included in net interest on the net defined benefit liability (asset). [Refer: Other comprehensive income; Defined benefit plans [member]; Plan assets [member]; Net defined benefit liability (asset)] [Contrast: Decrease (increase) in net defined benefit liability (asset) resulting from gain (loss) on remeasurement in other comprehensive income] Reference 1: http://www.xbrl.org/2009/role/commonPracticeRef
-Name IAS
-Number 19
-IssueDate 2023-01-01
-Paragraph 135
-Subparagraph b
-URI https://taxonomy.ifrs.org/xifrs-link?type=IAS&num=19&code=ifrs-tx-2023-en-r&anchor=para_135_b&doctype=Standard
-URIDate 2023-03-23
Reference 2: http://www.xbrl.org/2003/role/disclosureRef
-Name IAS
-Number 1
-IssueDate 2023-01-01
-Paragraph 91
-Subparagraph a
-URI https://taxonomy.ifrs.org/xifrs-link?type=IAS&num=1&code=ifrs-tx-2023-en-r&anchor=para_91_a&doctype=Standard
-URIDate 2023-03-23
Reference 3: http://www.xbrl.org/2003/role/disclosureRef
-Name IAS
-Number 1
-IssueDate 2023-01-01
-Paragraph 7
-URI https://taxonomy.ifrs.org/xifrs-link?type=IAS&num=1&code=ifrs-tx-2023-en-r&anchor=para_7&doctype=Standard
-URIDate 2023-03-23
| Name: |
ifrs-full_OtherComprehensiveIncomeNetOfTaxGainsLossesOnRemeasurementsOfDefinedBenefitPlans |
| Namespace Prefix: |
ifrs-full_ |
| Data Type: |
xbrli:monetaryItemType |
| Balance Type: |
credit |
| Period Type: |
duration |
|
| X |
- DefinitionThe amount of expenses that the entity does not separately disclose in the same statement or note when the entity uses the 'nature of expense' form for its analysis of expenses. [Refer: Expenses, by nature] Reference 1: http://www.xbrl.org/2003/role/exampleRef
-Name IAS
-Number 1
-IssueDate 2023-01-01
-Paragraph 102
-URI https://taxonomy.ifrs.org/xifrs-link?type=IAS&num=1&code=ifrs-tx-2023-en-r&anchor=para_102&doctype=Standard
-URIDate 2023-03-23
Reference 2: http://www.xbrl.org/2003/role/disclosureRef
-Name IAS
-Number 1
-IssueDate 2023-01-01
-Paragraph 99
-URI https://taxonomy.ifrs.org/xifrs-link?type=IAS&num=1&code=ifrs-tx-2023-en-r&anchor=para_99&doctype=Standard
-URIDate 2023-03-23
| Name: |
ifrs-full_OtherExpenseByNature |
| Namespace Prefix: |
ifrs-full_ |
| Data Type: |
xbrli:monetaryItemType |
| Balance Type: |
debit |
| Period Type: |
duration |
|
| X |
- DefinitionThe total of income less expenses from continuing and discontinued operations, excluding the components of other comprehensive income. [Refer: Other comprehensive income] Reference 1: http://www.xbrl.org/2003/role/disclosureRef
-Name IAS
-Number 7
-IssueDate 2023-01-01
-Paragraph 18
-Subparagraph b
-URI https://taxonomy.ifrs.org/xifrs-link?type=IAS&num=7&code=ifrs-tx-2023-en-r&anchor=para_18_b&doctype=Standard
-URIDate 2023-03-23
Reference 2: http://www.xbrl.org/2003/role/disclosureRef
-Name IFRS
-Number 1
-IssueDate 2023-01-01
-Paragraph 32
-Subparagraph a
-Clause ii
-URI https://taxonomy.ifrs.org/xifrs-link?type=IFRS&num=1&code=ifrs-tx-2023-en-r&anchor=para_32_a_ii&doctype=Standard
-URIDate 2023-03-23
Reference 3: http://www.xbrl.org/2003/role/disclosureRef
-Name IFRS
-Number 1
-IssueDate 2023-01-01
-Paragraph 24
-Subparagraph b
-URI https://taxonomy.ifrs.org/xifrs-link?type=IFRS&num=1&code=ifrs-tx-2023-en-r&anchor=para_24_b&doctype=Standard
-URIDate 2023-03-23
Reference 4: http://www.xbrl.org/2003/role/disclosureRef
-Name IFRS
-Number 8
-IssueDate 2023-01-01
-Paragraph 28
-Subparagraph b
-URI https://taxonomy.ifrs.org/xifrs-link?type=IFRS&num=8&code=ifrs-tx-2023-en-r&anchor=para_28_b&doctype=Standard
-URIDate 2023-03-23
Reference 5: http://www.xbrl.org/2003/role/disclosureRef
-Name IFRS
-Number 8
-IssueDate 2023-01-01
-Paragraph 23
-URI https://taxonomy.ifrs.org/xifrs-link?type=IFRS&num=8&code=ifrs-tx-2023-en-r&anchor=para_23&doctype=Standard
-URIDate 2023-03-23
Reference 6: http://www.xbrl.org/2003/role/exampleRef
-Name IFRS
-Number 12
-IssueDate 2023-01-01
-Paragraph B10
-Subparagraph b
-URI https://taxonomy.ifrs.org/xifrs-link?type=IFRS&num=12&code=ifrs-tx-2023-en-r&anchor=para_B10_b&doctype=Appendix&subtype=B
-URIDate 2023-03-23
Reference 7: http://www.xbrl.org/2003/role/exampleRef
-Name IFRS
-Number 17
-IssueDate 2023-01-01
-Paragraph 113
-Subparagraph b
-URI https://taxonomy.ifrs.org/xifrs-link?type=IFRS&num=17&code=ifrs-tx-2023-en-r&anchor=para_113_b&doctype=Standard
-URIDate 2023-03-23
Reference 8: http://www.xbrl.org/2003/role/disclosureRef
-Name IAS
-Number 1
-IssueDate 2023-01-01
-Paragraph 81A
-Subparagraph a
-URI https://taxonomy.ifrs.org/xifrs-link?type=IAS&num=1&code=ifrs-tx-2023-en-r&anchor=para_81A_a&doctype=Standard
-URIDate 2023-03-23
Reference 9: http://www.xbrl.org/2003/role/disclosureRef
-Name IAS
-Number 1
-IssueDate 2023-01-01
-Paragraph 106
-Subparagraph d
-Clause i
-URI https://taxonomy.ifrs.org/xifrs-link?type=IAS&num=1&code=ifrs-tx-2023-en-r&anchor=para_106_d_i&doctype=Standard
-URIDate 2023-03-23
| Name: |
ifrs-full_ProfitLoss |
| Namespace Prefix: |
ifrs-full_ |
| Data Type: |
xbrli:monetaryItemType |
| Balance Type: |
credit |
| Period Type: |
duration |
|
| X |
- DefinitionThe profit (loss) before tax expense or income. [Refer: Profit (loss)] Reference 1: http://www.xbrl.org/2003/role/disclosureRef
-Name IFRS
-Number 5
-IssueDate 2023-01-01
-Paragraph 33
-Subparagraph b
-Clause i
-URI https://taxonomy.ifrs.org/xifrs-link?type=IFRS&num=5&code=ifrs-tx-2023-en-r&anchor=para_33_b_i&doctype=Standard
-URIDate 2023-03-23
Reference 2: http://www.xbrl.org/2003/role/exampleRef
-Name IFRS
-Number 8
-IssueDate 2023-01-01
-Paragraph 28
-Subparagraph b
-URI https://taxonomy.ifrs.org/xifrs-link?type=IFRS&num=8&code=ifrs-tx-2023-en-r&anchor=para_28_b&doctype=Standard
-URIDate 2023-03-23
Reference 3: http://www.xbrl.org/2003/role/exampleRef
-Name IFRS
-Number 8
-IssueDate 2023-01-01
-Paragraph 23
-URI https://taxonomy.ifrs.org/xifrs-link?type=IFRS&num=8&code=ifrs-tx-2023-en-r&anchor=para_23&doctype=Standard
-URIDate 2023-03-23
Reference 4: http://www.xbrl.org/2003/role/exampleRef
-Name IAS
-Number 1
-IssueDate 2023-01-01
-Paragraph 103
-URI https://taxonomy.ifrs.org/xifrs-link?type=IAS&num=1&code=ifrs-tx-2023-en-r&anchor=para_103&doctype=Standard
-URIDate 2023-03-23
Reference 5: http://www.xbrl.org/2003/role/exampleRef
-Name IAS
-Number 1
-IssueDate 2023-01-01
-Paragraph 102
-URI https://taxonomy.ifrs.org/xifrs-link?type=IAS&num=1&code=ifrs-tx-2023-en-r&anchor=para_102&doctype=Standard
-URIDate 2023-03-23
| Name: |
ifrs-full_ProfitLossBeforeTax |
| Namespace Prefix: |
ifrs-full_ |
| Data Type: |
xbrli:monetaryItemType |
| Balance Type: |
credit |
| Period Type: |
duration |
|
| X |
- DefinitionThe profit (loss) from operating activities of the entity. [Refer: Profit (loss)] Reference 1: http://www.xbrl.org/2003/role/exampleRef
-Name IAS
-Number 32
-IssueDate 2023-01-01
-Paragraph IE33
-URI https://taxonomy.ifrs.org/xifrs-link?type=IAS&num=32&code=ifrs-tx-2023-en-r&anchor=para_IE33&doctype=Illustrative%20Examples
-URIDate 2023-03-23
Reference 2: http://www.xbrl.org/2009/role/commonPracticeRef
-Name IAS
-Number 1
-IssueDate 2023-01-01
-Paragraph 85
-URI https://taxonomy.ifrs.org/xifrs-link?type=IAS&num=1&code=ifrs-tx-2023-en-r&anchor=para_85&doctype=Standard
-URIDate 2023-03-23
| Name: |
ifrs-full_ProfitLossFromOperatingActivities |
| Namespace Prefix: |
ifrs-full_ |
| Data Type: |
xbrli:monetaryItemType |
| Balance Type: |
credit |
| Period Type: |
duration |
|
| X |
- DefinitionThe amount of expenditure directly attributable to research or development activities, recognised in profit or loss. Reference 1: http://www.xbrl.org/2003/role/disclosureRef
-Name IAS
-Number 38
-IssueDate 2023-01-01
-Paragraph 126
-URI https://taxonomy.ifrs.org/xifrs-link?type=IAS&num=38&code=ifrs-tx-2023-en-r&anchor=para_126&doctype=Standard
-URIDate 2023-03-23
| Name: |
ifrs-full_ResearchAndDevelopmentExpense |
| Namespace Prefix: |
ifrs-full_ |
| Data Type: |
xbrli:monetaryItemType |
| Balance Type: |
debit |
| Period Type: |
duration |
|
| X |
- DefinitionThe income arising in the course of an entity's ordinary activities. Income is increases in assets, or decreases in liabilities, that result in increases in equity, other than those relating to contributions from holders of equity claims. Reference 1: http://www.xbrl.org/2003/role/disclosureRef
-Name IFRS
-Number 8
-IssueDate 2023-01-01
-Paragraph 28
-Subparagraph a
-URI https://taxonomy.ifrs.org/xifrs-link?type=IFRS&num=8&code=ifrs-tx-2023-en-r&anchor=para_28_a&doctype=Standard
-URIDate 2023-03-23
Reference 2: http://www.xbrl.org/2003/role/disclosureRef
-Name IFRS
-Number 8
-IssueDate 2023-01-01
-Paragraph 23
-Subparagraph a
-URI https://taxonomy.ifrs.org/xifrs-link?type=IFRS&num=8&code=ifrs-tx-2023-en-r&anchor=para_23_a&doctype=Standard
-URIDate 2023-03-23
Reference 3: http://www.xbrl.org/2003/role/disclosureRef
-Name IFRS
-Number 8
-IssueDate 2023-01-01
-Paragraph 32
-URI https://taxonomy.ifrs.org/xifrs-link?type=IFRS&num=8&code=ifrs-tx-2023-en-r&anchor=para_32&doctype=Standard
-URIDate 2023-03-23
Reference 4: http://www.xbrl.org/2003/role/disclosureRef
-Name IFRS
-Number 5
-IssueDate 2023-01-01
-Paragraph 33
-Subparagraph b
-Clause i
-URI https://taxonomy.ifrs.org/xifrs-link?type=IFRS&num=5&code=ifrs-tx-2023-en-r&anchor=para_33_b_i&doctype=Standard
-URIDate 2023-03-23
Reference 5: http://www.xbrl.org/2003/role/disclosureRef
-Name IFRS
-Number 8
-IssueDate 2023-01-01
-Paragraph 33
-Subparagraph a
-URI https://taxonomy.ifrs.org/xifrs-link?type=IFRS&num=8&code=ifrs-tx-2023-en-r&anchor=para_33_a&doctype=Standard
-URIDate 2023-03-23
Reference 6: http://www.xbrl.org/2003/role/disclosureRef
-Name IFRS
-Number 8
-IssueDate 2023-01-01
-Paragraph 34
-URI https://taxonomy.ifrs.org/xifrs-link?type=IFRS&num=8&code=ifrs-tx-2023-en-r&anchor=para_34&doctype=Standard
-URIDate 2023-03-23
Reference 7: http://www.xbrl.org/2003/role/disclosureRef
-Name IFRS
-Number 12
-IssueDate 2023-01-01
-Paragraph B12
-Subparagraph b
-Clause v
-URI https://taxonomy.ifrs.org/xifrs-link?type=IFRS&num=12&code=ifrs-tx-2023-en-r&anchor=para_B12_b_v&doctype=Appendix&subtype=B
-URIDate 2023-03-23
Reference 8: http://www.xbrl.org/2003/role/exampleRef
-Name IFRS
-Number 12
-IssueDate 2023-01-01
-Paragraph B10
-Subparagraph b
-URI https://taxonomy.ifrs.org/xifrs-link?type=IFRS&num=12&code=ifrs-tx-2023-en-r&anchor=para_B10_b&doctype=Appendix&subtype=B
-URIDate 2023-03-23
Reference 9: http://www.xbrl.org/2003/role/disclosureRef
-Name IAS
-Number 1
-IssueDate 2023-01-01
-Paragraph 82
-Subparagraph a
-URI https://taxonomy.ifrs.org/xifrs-link?type=IAS&num=1&code=ifrs-tx-2023-en-r&anchor=para_82_a&doctype=Standard
-URIDate 2023-03-23
Reference 10: http://www.xbrl.org/2003/role/exampleRef
-Name IAS
-Number 1
-IssueDate 2023-01-01
-Paragraph 103
-URI https://taxonomy.ifrs.org/xifrs-link?type=IAS&num=1&code=ifrs-tx-2023-en-r&anchor=para_103&doctype=Standard
-URIDate 2023-03-23
Reference 11: http://www.xbrl.org/2003/role/exampleRef
-Name IAS
-Number 1
-IssueDate 2023-01-01
-Paragraph 102
-URI https://taxonomy.ifrs.org/xifrs-link?type=IAS&num=1&code=ifrs-tx-2023-en-r&anchor=para_102&doctype=Standard
-URIDate 2023-03-23
| Name: |
ifrs-full_Revenue |
| Namespace Prefix: |
ifrs-full_ |
| Data Type: |
xbrli:monetaryItemType |
| Balance Type: |
credit |
| Period Type: |
duration |
|
| X |
- DefinitionThe amount of expense relating to the marketing and selling of goods or services. Reference 1: http://www.xbrl.org/2009/role/commonPracticeRef
-Name IAS
-Number 1
-IssueDate 2023-01-01
-Paragraph 85
-URI https://taxonomy.ifrs.org/xifrs-link?type=IAS&num=1&code=ifrs-tx-2023-en-r&anchor=para_85&doctype=Standard
-URIDate 2023-03-23
| Name: |
ifrs-full_SalesAndMarketingExpense |
| Namespace Prefix: |
ifrs-full_ |
| Data Type: |
xbrli:monetaryItemType |
| Balance Type: |
debit |
| Period Type: |
duration |
|
| X |
- References
+ Details
| Name: |
ifrs-full_StatementOfProfitOrLossAndOtherComprehensiveIncomeAbstract |
| Namespace Prefix: |
ifrs-full_ |
| Data Type: |
xbrli:stringItemType |
| Balance Type: |
na |
| Period Type: |
duration |
|
| X |
- DefinitionThe amount that represents the difference between the tax expense (income) and the product of the accounting profit multiplied by the applicable tax rate(s) that relates to tax losses. [Refer: Accounting profit] Reference 1: http://www.xbrl.org/2003/role/disclosureRef
-Name IAS
-Number 12
-IssueDate 2023-01-01
-Paragraph 81
-Subparagraph c
-Clause i
-URI https://taxonomy.ifrs.org/xifrs-link?type=IAS&num=12&code=ifrs-tx-2023-en-r&anchor=para_81_c_i&doctype=Standard
-URIDate 2023-03-23
| Name: |
ifrs-full_TaxEffectOfTaxLosses |
| Namespace Prefix: |
ifrs-full_ |
| Data Type: |
xbrli:monetaryItemType |
| Balance Type: |
debit |
| Period Type: |
duration |
|
| X |
- DefinitionCost of merchandise from the sale of goods imported.
| Name: |
kmda_CostOfMerchandiseFromSaleOfGoodsImported |
| Namespace Prefix: |
kmda_ |
| Data Type: |
xbrli:monetaryItemType |
| Balance Type: |
debit |
| Period Type: |
duration |
|
| X |
- DefinitionCost of goods sold from the sale of goods that are manufactured by the company.
| Name: |
kmda_CostOfMerchandiseManufacturedByCompany |
| Namespace Prefix: |
kmda_ |
| Data Type: |
xbrli:monetaryItemType |
| Balance Type: |
debit |
| Period Type: |
duration |
|
| X |
- DefinitionExpense in respect of currency exchange differences and derivatives instruments, net.
| Name: |
kmda_ExpenseInRespectOfCurrencyExchangeDifferencesAndDerivativeInstrumentsNet |
| Namespace Prefix: |
kmda_ |
| Data Type: |
xbrli:monetaryItemType |
| Balance Type: |
credit |
| Period Type: |
duration |
|
| X |
- DefinitionFinancial Income (expense) in respect of contingent consideration and other long- term liabilities.
| Name: |
kmda_FinancialIncomeexpenseInRespectOfContingentConsiderationAndOtherLongTermLiabilities |
| Namespace Prefix: |
kmda_ |
| Data Type: |
xbrli:monetaryItemType |
| Balance Type: |
debit |
| Period Type: |
duration |
|
| X |
- References
+ Details
| Name: |
kmda_ItemsThatWillNotBeReclassifiedToProfitOrLossInSubsequentPeriodsAbstract |
| Namespace Prefix: |
kmda_ |
| Data Type: |
xbrli:stringItemType |
| Balance Type: |
na |
| Period Type: |
duration |
|
| X |
- DefinitionThe amount of reclassification adjustments on cash flow hedges for which the hedged item affected profit or loss. [Refer: Reclassification adjustments on cash flow hedges, net of tax]
| Name: |
kmda_ReclassificationAdjustmentsOnCashFlowHedgesForWhichHedgedItemAffectedProfitOrLoss |
| Namespace Prefix: |
kmda_ |
| Data Type: |
xbrli:monetaryItemType |
| Balance Type: |
debit |
| Period Type: |
duration |
|
| X |
- DefinitionThe amount of revenue arising from the sale of imported goods.
| Name: |
kmda_RevenueFromSaleOfGoodsImported |
| Namespace Prefix: |
kmda_ |
| Data Type: |
xbrli:monetaryItemType |
| Balance Type: |
credit |
| Period Type: |
duration |
|
| X |
- DefinitionThe amount of revenue arising from the sale of goods that are manufactured by the company.
| Name: |
kmda_RevenueFromSaleOfGoodsManufacturedByCompany |
| Namespace Prefix: |
kmda_ |
| Data Type: |
xbrli:monetaryItemType |
| Balance Type: |
credit |
| Period Type: |
duration |
|
v3.24.1.u1
Condensed Consolidated Interim Statements of Changes in Equity - USD ($)
|
Share capital |
Additional paid in capital |
Capital reserve due to translation to presentation currency |
Capital reserve from hedges |
Capital reserve from sharebased payments |
Capital reserve from employee benefits |
Accumulated deficit |
Total |
| Balance at Dec. 31, 2022 |
$ 11,734
|
$ 210,495
|
$ (3,490)
|
$ (88)
|
$ 5,505
|
$ 348
|
$ (48,484)
|
$ 176,020
|
| Net income |
|
|
|
|
|
|
(1,809)
|
(1,809)
|
| Other comprehensive income (loss) |
|
|
|
(11)
|
|
191
|
|
180
|
| Total comprehensive income (loss) |
|
|
|
(11)
|
|
191
|
(1,809)
|
(1,629)
|
| Exercise and forfeiture of share-based payment into shares |
2
|
170
|
|
|
(170)
|
|
|
2
|
| Cost of share-based payment |
|
|
|
|
415
|
|
|
415
|
| Balance at Mar. 31, 2023 |
11,736
|
210,665
|
(3,490)
|
(99)
|
5,750
|
539
|
(50,293)
|
174,808
|
| Balance at Dec. 31, 2022 |
11,734
|
210,495
|
(3,490)
|
(88)
|
5,505
|
348
|
(48,484)
|
176,020
|
| Net income |
|
|
|
|
|
|
8,284
|
8,284
|
| Other comprehensive income (loss) |
|
|
|
228
|
|
(73)
|
|
155
|
| Total comprehensive income (loss) |
|
|
|
228
|
|
(73)
|
8,284
|
8,439
|
| Exercise and forfeiture of share-based payment into shares |
4
|
405
|
|
|
(405)
|
|
|
4
|
| Issuance of shares |
3,283
|
54,948
|
|
|
|
|
|
58,231
|
| Cost of share-based payment |
|
|
|
|
|
1,327
|
|
1,327
|
| Balance at Dec. 31, 2023 |
15,021
|
265,848
|
(3,490)
|
140
|
6,427
|
275
|
(40,200)
|
244,021
|
| Net income |
|
|
|
|
|
|
2,365
|
2,365
|
| Other comprehensive income (loss) |
|
|
|
(128)
|
|
7
|
|
(121)
|
| Total comprehensive income (loss) |
|
|
|
(128)
|
|
7
|
2,365
|
2,244
|
| Exercise and forfeiture of share-based payment into shares |
1
|
335
|
|
|
(335)
|
|
|
1
|
| Cost of share-based payment |
|
|
|
|
244
|
|
|
244
|
| Balance at Mar. 31, 2024 |
$ 15,022
|
$ 266,183
|
$ (3,490)
|
$ 12
|
$ 6,336
|
$ 282
|
$ (37,835)
|
$ 246,510
|
| X |
- DefinitionThe amount of change in equity resulting from transactions and other events, other than those changes resulting from transactions with owners in their capacity as owners. Reference 1: http://www.xbrl.org/2003/role/disclosureRef
-Name IFRS
-Number 1
-IssueDate 2023-01-01
-Paragraph 32
-Subparagraph a
-Clause ii
-URI https://taxonomy.ifrs.org/xifrs-link?type=IFRS&num=1&code=ifrs-tx-2023-en-r&anchor=para_32_a_ii&doctype=Standard
-URIDate 2023-03-23
Reference 2: http://www.xbrl.org/2003/role/disclosureRef
-Name IFRS
-Number 1
-IssueDate 2023-01-01
-Paragraph 24
-Subparagraph b
-URI https://taxonomy.ifrs.org/xifrs-link?type=IFRS&num=1&code=ifrs-tx-2023-en-r&anchor=para_24_b&doctype=Standard
-URIDate 2023-03-23
Reference 3: http://www.xbrl.org/2003/role/exampleRef
-Name IFRS
-Number 12
-IssueDate 2023-01-01
-Paragraph B10
-Subparagraph b
-URI https://taxonomy.ifrs.org/xifrs-link?type=IFRS&num=12&code=ifrs-tx-2023-en-r&anchor=para_B10_b&doctype=Appendix&subtype=B
-URIDate 2023-03-23
Reference 4: http://www.xbrl.org/2003/role/disclosureRef
-Name IAS
-Number 1
-IssueDate 2023-01-01
-Paragraph 81A
-Subparagraph c
-URI https://taxonomy.ifrs.org/xifrs-link?type=IAS&num=1&code=ifrs-tx-2023-en-r&anchor=para_81A_c&doctype=Standard
-URIDate 2023-03-23
Reference 5: http://www.xbrl.org/2003/role/disclosureRef
-Name IFRS
-Number 12
-IssueDate 2023-01-01
-Paragraph B12
-Subparagraph b
-Clause ix
-URI https://taxonomy.ifrs.org/xifrs-link?type=IFRS&num=12&code=ifrs-tx-2023-en-r&anchor=para_B12_b_ix&doctype=Appendix&subtype=B
-URIDate 2023-03-23
Reference 6: http://www.xbrl.org/2003/role/disclosureRef
-Name IAS
-Number 1
-IssueDate 2023-01-01
-Paragraph 106
-Subparagraph a
-URI https://taxonomy.ifrs.org/xifrs-link?type=IAS&num=1&code=ifrs-tx-2023-en-r&anchor=para_106_a&doctype=Standard
-URIDate 2023-03-23
| Name: |
ifrs-full_ComprehensiveIncome |
| Namespace Prefix: |
ifrs-full_ |
| Data Type: |
xbrli:monetaryItemType |
| Balance Type: |
credit |
| Period Type: |
duration |
|
| X |
- DefinitionThe amount of residual interest in the assets of the entity after deducting all its liabilities. Reference 1: http://www.xbrl.org/2003/role/disclosureRef
-Name IFRS
-Number 1
-IssueDate 2023-01-01
-Paragraph 24
-Subparagraph a
-URI https://taxonomy.ifrs.org/xifrs-link?type=IFRS&num=1&code=ifrs-tx-2023-en-r&anchor=para_24_a&doctype=Standard
-URIDate 2023-03-23
Reference 2: http://www.xbrl.org/2003/role/disclosureRef
-Name IFRS
-Number 1
-IssueDate 2023-01-01
-Paragraph 32
-Subparagraph a
-Clause i
-URI https://taxonomy.ifrs.org/xifrs-link?type=IFRS&num=1&code=ifrs-tx-2023-en-r&anchor=para_32_a_i&doctype=Standard
-URIDate 2023-03-23
Reference 3: http://www.xbrl.org/2003/role/disclosureRef
-Name IFRS
-Number 13
-IssueDate 2023-01-01
-Paragraph 93
-Subparagraph a
-URI https://taxonomy.ifrs.org/xifrs-link?type=IFRS&num=13&code=ifrs-tx-2023-en-r&anchor=para_93_a&doctype=Standard
-URIDate 2023-03-23
Reference 4: http://www.xbrl.org/2003/role/disclosureRef
-Name IFRS
-Number 13
-IssueDate 2023-01-01
-Paragraph 93
-Subparagraph b
-URI https://taxonomy.ifrs.org/xifrs-link?type=IFRS&num=13&code=ifrs-tx-2023-en-r&anchor=para_93_b&doctype=Standard
-URIDate 2023-03-23
Reference 5: http://www.xbrl.org/2003/role/disclosureRef
-Name IFRS
-Number 13
-IssueDate 2023-01-01
-Paragraph 93
-Subparagraph e
-URI https://taxonomy.ifrs.org/xifrs-link?type=IFRS&num=13&code=ifrs-tx-2023-en-r&anchor=para_93_e&doctype=Standard
-URIDate 2023-03-23
Reference 6: http://www.xbrl.org/2003/role/disclosureRef
-Name IAS
-Number 1
-IssueDate 2023-01-01
-Paragraph 55
-URI https://taxonomy.ifrs.org/xifrs-link?type=IAS&num=1&code=ifrs-tx-2023-en-r&anchor=para_55&doctype=Standard
-URIDate 2023-03-23
Reference 7: http://www.xbrl.org/2003/role/disclosureRef
-Name IAS
-Number 1
-IssueDate 2023-01-01
-Paragraph 78
-Subparagraph e
-URI https://taxonomy.ifrs.org/xifrs-link?type=IAS&num=1&code=ifrs-tx-2023-en-r&anchor=para_78_e&doctype=Standard
-URIDate 2023-03-23
| Name: |
ifrs-full_Equity |
| Namespace Prefix: |
ifrs-full_ |
| Data Type: |
xbrli:monetaryItemType |
| Balance Type: |
credit |
| Period Type: |
instant |
|
| X |
- DefinitionThe increase (decrease) in equity resulting from share-based payment transactions. [Refer: Equity] Reference 1: http://www.xbrl.org/2003/role/disclosureRef
-Name IAS
-Number 1
-IssueDate 2023-01-01
-Paragraph 106
-Subparagraph d
-Clause iii
-URI https://taxonomy.ifrs.org/xifrs-link?type=IAS&num=1&code=ifrs-tx-2023-en-r&anchor=para_106_d_iii&doctype=Standard
-URIDate 2023-03-23
| Name: |
ifrs-full_IncreaseDecreaseThroughSharebasedPaymentTransactions |
| Namespace Prefix: |
ifrs-full_ |
| Data Type: |
xbrli:monetaryItemType |
| Balance Type: |
credit |
| Period Type: |
duration |
|
| X |
- DefinitionThe increase in equity through the issue of equity instruments. Reference 1: http://www.xbrl.org/2003/role/disclosureRef
-Name IAS
-Number 1
-IssueDate 2023-01-01
-Paragraph 106
-Subparagraph d
-Clause iii
-URI https://taxonomy.ifrs.org/xifrs-link?type=IAS&num=1&code=ifrs-tx-2023-en-r&anchor=para_106_d_iii&doctype=Standard
-URIDate 2023-03-23
| Name: |
ifrs-full_IssueOfEquity |
| Namespace Prefix: |
ifrs-full_ |
| Data Type: |
xbrli:monetaryItemType |
| Balance Type: |
credit |
| Period Type: |
duration |
|
| X |
- DefinitionThe amount of income and expense (including reclassification adjustments) that is not recognised in profit or loss as required or permitted by IFRSs. [Refer: IFRSs [member]] Reference 1: http://www.xbrl.org/2003/role/disclosureRef
-Name IFRS
-Number 12
-IssueDate 2023-01-01
-Paragraph B12
-Subparagraph b
-Clause viii
-URI https://taxonomy.ifrs.org/xifrs-link?type=IFRS&num=12&code=ifrs-tx-2023-en-r&anchor=para_B12_b_viii&doctype=Appendix&subtype=B
-URIDate 2023-03-23
Reference 2: http://www.xbrl.org/2003/role/disclosureRef
-Name IAS
-Number 1
-IssueDate 2023-01-01
-Paragraph 81A
-Subparagraph b
-URI https://taxonomy.ifrs.org/xifrs-link?type=IAS&num=1&code=ifrs-tx-2023-en-r&anchor=para_81A_b&doctype=Standard
-URIDate 2023-03-23
Reference 3: http://www.xbrl.org/2003/role/disclosureRef
-Name IAS
-Number 1
-IssueDate 2023-01-01
-Paragraph 91
-Subparagraph a
-URI https://taxonomy.ifrs.org/xifrs-link?type=IAS&num=1&code=ifrs-tx-2023-en-r&anchor=para_91_a&doctype=Standard
-URIDate 2023-03-23
Reference 4: http://www.xbrl.org/2003/role/disclosureRef
-Name IAS
-Number 1
-IssueDate 2023-01-01
-Paragraph 106
-Subparagraph d
-Clause ii
-URI https://taxonomy.ifrs.org/xifrs-link?type=IAS&num=1&code=ifrs-tx-2023-en-r&anchor=para_106_d_ii&doctype=Standard
-URIDate 2023-03-23
| Name: |
ifrs-full_OtherComprehensiveIncome |
| Namespace Prefix: |
ifrs-full_ |
| Data Type: |
xbrli:monetaryItemType |
| Balance Type: |
credit |
| Period Type: |
duration |
|
| X |
- DefinitionThe total of income less expenses from continuing and discontinued operations, excluding the components of other comprehensive income. [Refer: Other comprehensive income] Reference 1: http://www.xbrl.org/2003/role/disclosureRef
-Name IAS
-Number 7
-IssueDate 2023-01-01
-Paragraph 18
-Subparagraph b
-URI https://taxonomy.ifrs.org/xifrs-link?type=IAS&num=7&code=ifrs-tx-2023-en-r&anchor=para_18_b&doctype=Standard
-URIDate 2023-03-23
Reference 2: http://www.xbrl.org/2003/role/disclosureRef
-Name IFRS
-Number 1
-IssueDate 2023-01-01
-Paragraph 32
-Subparagraph a
-Clause ii
-URI https://taxonomy.ifrs.org/xifrs-link?type=IFRS&num=1&code=ifrs-tx-2023-en-r&anchor=para_32_a_ii&doctype=Standard
-URIDate 2023-03-23
Reference 3: http://www.xbrl.org/2003/role/disclosureRef
-Name IFRS
-Number 1
-IssueDate 2023-01-01
-Paragraph 24
-Subparagraph b
-URI https://taxonomy.ifrs.org/xifrs-link?type=IFRS&num=1&code=ifrs-tx-2023-en-r&anchor=para_24_b&doctype=Standard
-URIDate 2023-03-23
Reference 4: http://www.xbrl.org/2003/role/disclosureRef
-Name IFRS
-Number 8
-IssueDate 2023-01-01
-Paragraph 28
-Subparagraph b
-URI https://taxonomy.ifrs.org/xifrs-link?type=IFRS&num=8&code=ifrs-tx-2023-en-r&anchor=para_28_b&doctype=Standard
-URIDate 2023-03-23
Reference 5: http://www.xbrl.org/2003/role/disclosureRef
-Name IFRS
-Number 8
-IssueDate 2023-01-01
-Paragraph 23
-URI https://taxonomy.ifrs.org/xifrs-link?type=IFRS&num=8&code=ifrs-tx-2023-en-r&anchor=para_23&doctype=Standard
-URIDate 2023-03-23
Reference 6: http://www.xbrl.org/2003/role/exampleRef
-Name IFRS
-Number 12
-IssueDate 2023-01-01
-Paragraph B10
-Subparagraph b
-URI https://taxonomy.ifrs.org/xifrs-link?type=IFRS&num=12&code=ifrs-tx-2023-en-r&anchor=para_B10_b&doctype=Appendix&subtype=B
-URIDate 2023-03-23
Reference 7: http://www.xbrl.org/2003/role/exampleRef
-Name IFRS
-Number 17
-IssueDate 2023-01-01
-Paragraph 113
-Subparagraph b
-URI https://taxonomy.ifrs.org/xifrs-link?type=IFRS&num=17&code=ifrs-tx-2023-en-r&anchor=para_113_b&doctype=Standard
-URIDate 2023-03-23
Reference 8: http://www.xbrl.org/2003/role/disclosureRef
-Name IAS
-Number 1
-IssueDate 2023-01-01
-Paragraph 81A
-Subparagraph a
-URI https://taxonomy.ifrs.org/xifrs-link?type=IAS&num=1&code=ifrs-tx-2023-en-r&anchor=para_81A_a&doctype=Standard
-URIDate 2023-03-23
Reference 9: http://www.xbrl.org/2003/role/disclosureRef
-Name IAS
-Number 1
-IssueDate 2023-01-01
-Paragraph 106
-Subparagraph d
-Clause i
-URI https://taxonomy.ifrs.org/xifrs-link?type=IAS&num=1&code=ifrs-tx-2023-en-r&anchor=para_106_d_i&doctype=Standard
-URIDate 2023-03-23
| Name: |
ifrs-full_ProfitLoss |
| Namespace Prefix: |
ifrs-full_ |
| Data Type: |
xbrli:monetaryItemType |
| Balance Type: |
credit |
| Period Type: |
duration |
|
| X |
- DefinitionExercise and forfeiture of share-based payment into shares.
| Name: |
kmda_ExerciseAndForfeitureOfSharebasedPaymentIntoShares |
| Namespace Prefix: |
kmda_ |
| Data Type: |
xbrli:monetaryItemType |
| Balance Type: |
credit |
| Period Type: |
duration |
|
v3.24.1.u1
Condensed Consolidated Interim Statements of Cash Flows - USD ($)
|
3 Months Ended |
12 Months Ended |
Mar. 31, 2024 |
Mar. 31, 2023 |
Dec. 31, 2023 |
| Cash Flows from Operating Activities |
|
|
|
| Net income (loss) |
$ 2,365
|
$ (1,809)
|
$ 8,284
|
| Adjustments to the profit or loss items: |
|
|
|
| Depreciation and amortization |
3,237
|
3,123
|
12,714
|
| Financial expenses (income), net |
1,600
|
2,085
|
1,635
|
| Cost of share-based payment |
241
|
415
|
1,314
|
| Taxes on income |
74
|
13
|
145
|
| Loss (gain) from sale of property and equipment |
|
(22)
|
(5)
|
| Change in employee benefit liabilities, net |
(4)
|
(8)
|
(125)
|
| Adjustments to the profit or loss items |
5,148
|
5,606
|
15,678
|
| Changes in asset and liability items: |
|
|
|
| Decrease (increase) in trade receivables, net |
610
|
6,306
|
7,835
|
| Decrease (increase) in other accounts receivables |
(516)
|
1,362
|
(1,150)
|
| Decrease (increase) in inventories |
4,131
|
(10,970)
|
(19,694)
|
| Decrease (increase) in deferred expenses |
112
|
3,554
|
2,814
|
| Decrease (increase) in trade payables |
(8,785)
|
(6,712)
|
(8,885)
|
| Decrease (increase) in other accounts payables |
(2,051)
|
(238)
|
765
|
| Decrease (increase) in deferred revenues |
(122)
|
384
|
113
|
| Total Changes in asset and liability |
(6,621)
|
(6,314)
|
(18,202)
|
| Cash received (paid) during the period for: |
|
|
|
| Interest paid |
(129)
|
(341)
|
(1,228)
|
| Interest received |
280
|
25
|
|
| Taxes paid |
(23)
|
(18)
|
(217)
|
| Cash received (paid) during the year |
128
|
(334)
|
(1,445)
|
| Net cash provided by (used in) operating activities |
1,020
|
(2,851)
|
4,315
|
| Cash Flows from Investing Activities |
|
|
|
| Purchase of property and equipment and intangible assets |
(2,682)
|
(1,117)
|
(5,850)
|
| Proceeds from sale of property and equipment |
|
24
|
7
|
| Net cash provided by (used in) investing activities |
(2,682)
|
(1,093)
|
(5,843)
|
| Cash Flows from Financing Activities |
|
|
|
| Proceeds from exercise of share base payments |
1
|
1
|
4
|
| Proceeds from issuance of ordinary shares, net |
|
|
58,231
|
| Repayment of lease liabilities |
(244)
|
(271)
|
(850)
|
| Repayment of long-term loans |
|
(1,111)
|
(17,407)
|
| Repayment of other long-term liabilities |
(5,496)
|
(1,500)
|
(17,300)
|
| Net cash provided by (used in) financing activities |
(5,739)
|
(2,881)
|
22,678
|
| Exchange differences on balances of cash and cash equivalent |
(46)
|
(312)
|
233
|
| Increase (decrease) in cash and cash equivalents |
(7,447)
|
(7,137)
|
21,383
|
| Cash and cash equivalents at the beginning of the period |
55,641
|
34,258
|
34,258
|
| Cash and cash equivalents at the end of the period |
48,194
|
27,121
|
55,641
|
| Significant non-cash transactions |
|
|
|
| Right-of-use asset recognized with corresponding lease liability |
306
|
3,580
|
6,546
|
| Purchase of property and equipment and Intangible assets |
$ 905
|
$ 292
|
$ 646
|
| X |
- DefinitionAdjustments for decrease (increase) in inventories to reconcile profit (loss) to net cash flow from (used in) operating activities. [Refer: Inventories; Profit (loss)] Reference 1: http://www.xbrl.org/2009/role/commonPracticeRef
-Name IAS
-Number 7
-IssueDate 2023-01-01
-Paragraph 20
-Subparagraph a
-URI https://taxonomy.ifrs.org/xifrs-link?type=IAS&num=7&code=ifrs-tx-2023-en-r&anchor=para_20_a&doctype=Standard
-URIDate 2023-03-23
| Name: |
ifrs-full_AdjustmentsForDecreaseIncreaseInInventories |
| Namespace Prefix: |
ifrs-full_ |
| Data Type: |
xbrli:monetaryItemType |
| Balance Type: |
debit |
| Period Type: |
duration |
|
| X |
- DefinitionAdjustments for decrease (increase) in other operating receivables to reconcile profit (loss) to net cash flow from (used in) operating activities. [Refer: Profit (loss)] Reference 1: http://www.xbrl.org/2009/role/commonPracticeRef
-Name IAS
-Number 7
-IssueDate 2023-01-01
-Paragraph 20
-Subparagraph a
-URI https://taxonomy.ifrs.org/xifrs-link?type=IAS&num=7&code=ifrs-tx-2023-en-r&anchor=para_20_a&doctype=Standard
-URIDate 2023-03-23
| Name: |
ifrs-full_AdjustmentsForDecreaseIncreaseInOtherOperatingReceivables |
| Namespace Prefix: |
ifrs-full_ |
| Data Type: |
xbrli:monetaryItemType |
| Balance Type: |
debit |
| Period Type: |
duration |
|
| X |
- DefinitionAdjustments for decrease (increase) in trade accounts receivable to reconcile profit (loss) to net cash flow from (used in) operating activities. [Refer: Profit (loss)] Reference 1: http://www.xbrl.org/2009/role/commonPracticeRef
-Name IAS
-Number 7
-IssueDate 2023-01-01
-Paragraph 20
-Subparagraph a
-URI https://taxonomy.ifrs.org/xifrs-link?type=IAS&num=7&code=ifrs-tx-2023-en-r&anchor=para_20_a&doctype=Standard
-URIDate 2023-03-23
| Name: |
ifrs-full_AdjustmentsForDecreaseIncreaseInTradeAccountReceivable |
| Namespace Prefix: |
ifrs-full_ |
| Data Type: |
xbrli:monetaryItemType |
| Balance Type: |
debit |
| Period Type: |
duration |
|
| X |
- DefinitionAdjustments for depreciation and amortisation expense to reconcile profit (loss) to net cash flow from (used in) operating activities. [Refer: Depreciation and amortisation expense; Profit (loss)] Reference 1: http://www.xbrl.org/2009/role/commonPracticeRef
-Name IAS
-Number 7
-IssueDate 2023-01-01
-Paragraph 20
-Subparagraph b
-URI https://taxonomy.ifrs.org/xifrs-link?type=IAS&num=7&code=ifrs-tx-2023-en-r&anchor=para_20_b&doctype=Standard
-URIDate 2023-03-23
| Name: |
ifrs-full_AdjustmentsForDepreciationAndAmortisationExpense |
| Namespace Prefix: |
ifrs-full_ |
| Data Type: |
xbrli:monetaryItemType |
| Balance Type: |
debit |
| Period Type: |
duration |
|
| X |
- DefinitionAdjustments for net finance income or cost to reconcile profit (loss) to net cash flow from (used in) operating activities. [Refer: Finance income (cost); Profit (loss)] Reference 1: http://www.xbrl.org/2009/role/commonPracticeRef
-Name IAS
-Number 7
-IssueDate 2023-01-01
-Paragraph 20
-URI https://taxonomy.ifrs.org/xifrs-link?type=IAS&num=7&code=ifrs-tx-2023-en-r&anchor=para_20&doctype=Standard
-URIDate 2023-03-23
| Name: |
ifrs-full_AdjustmentsForFinanceIncomeCost |
| Namespace Prefix: |
ifrs-full_ |
| Data Type: |
xbrli:monetaryItemType |
| Balance Type: |
credit |
| Period Type: |
duration |
|
| X |
- DefinitionAdjustments for gain (loss) on disposals of property, plant and equipment to reconcile profit (loss) to net cash flow from (used in) operating activities. [Refer: Profit (loss); Property, plant and equipment; Disposals, property, plant and equipment] Reference 1: http://www.xbrl.org/2009/role/commonPracticeRef
-Name IAS
-Number 7
-IssueDate 2023-01-01
-Paragraph 20
-URI https://taxonomy.ifrs.org/xifrs-link?type=IAS&num=7&code=ifrs-tx-2023-en-r&anchor=para_20&doctype=Standard
-URIDate 2023-03-23
| Name: |
ifrs-full_AdjustmentsForGainLossOnDisposalsPropertyPlantAndEquipment |
| Namespace Prefix: |
ifrs-full_ |
| Data Type: |
xbrli:monetaryItemType |
| Balance Type: |
credit |
| Period Type: |
duration |
|
| X |
- DefinitionAdjustments for the increase (decrease) in deferred income including contract liabilities to reconcile profit (loss) to net cash flow from (used in) operating activities. [Refer: Deferred income including contract liabilities; Profit (loss)] Reference 1: http://www.xbrl.org/2009/role/commonPracticeRef
-Name IAS
-Number 7
-IssueDate 2023-01-01
-Paragraph 20
-Subparagraph a
-URI https://taxonomy.ifrs.org/xifrs-link?type=IAS&num=7&code=ifrs-tx-2023-en-r&anchor=para_20_a&doctype=Standard
-URIDate 2023-03-23
| Name: |
ifrs-full_AdjustmentsForIncreaseDecreaseInDeferredIncomeIncludingContractLiabilities |
| Namespace Prefix: |
ifrs-full_ |
| Data Type: |
xbrli:monetaryItemType |
| Balance Type: |
debit |
| Period Type: |
duration |
|
| X |
- DefinitionAdjustments for increase (decrease) in employee benefit liabilities to reconcile profit (loss) to net cash flow from (used in) operating activities. [Refer: Profit (loss)] Reference 1: http://www.xbrl.org/2009/role/commonPracticeRef
-Name IAS
-Number 7
-IssueDate 2023-01-01
-Paragraph 20
-URI https://taxonomy.ifrs.org/xifrs-link?type=IAS&num=7&code=ifrs-tx-2023-en-r&anchor=para_20&doctype=Standard
-URIDate 2023-03-23
| Name: |
ifrs-full_AdjustmentsForIncreaseDecreaseInEmployeeBenefitLiabilities |
| Namespace Prefix: |
ifrs-full_ |
| Data Type: |
xbrli:monetaryItemType |
| Balance Type: |
debit |
| Period Type: |
duration |
|
| X |
- DefinitionAdjustments for increase (decrease) in other operating payables to reconcile profit (loss) to net cash flow from (used in) operating activities. [Refer: Profit (loss)] Reference 1: http://www.xbrl.org/2009/role/commonPracticeRef
-Name IAS
-Number 7
-IssueDate 2023-01-01
-Paragraph 20
-Subparagraph a
-URI https://taxonomy.ifrs.org/xifrs-link?type=IAS&num=7&code=ifrs-tx-2023-en-r&anchor=para_20_a&doctype=Standard
-URIDate 2023-03-23
| Name: |
ifrs-full_AdjustmentsForIncreaseDecreaseInOtherOperatingPayables |
| Namespace Prefix: |
ifrs-full_ |
| Data Type: |
xbrli:monetaryItemType |
| Balance Type: |
debit |
| Period Type: |
duration |
|
| X |
- DefinitionAdjustments for increase (decrease) in trade accounts payable to reconcile profit (loss) to net cash flow from (used in) operating activities. [Refer: Profit (loss)] Reference 1: http://www.xbrl.org/2009/role/commonPracticeRef
-Name IAS
-Number 7
-IssueDate 2023-01-01
-Paragraph 20
-Subparagraph a
-URI https://taxonomy.ifrs.org/xifrs-link?type=IAS&num=7&code=ifrs-tx-2023-en-r&anchor=para_20_a&doctype=Standard
-URIDate 2023-03-23
| Name: |
ifrs-full_AdjustmentsForIncreaseDecreaseInTradeAccountPayable |
| Namespace Prefix: |
ifrs-full_ |
| Data Type: |
xbrli:monetaryItemType |
| Balance Type: |
debit |
| Period Type: |
duration |
|
| X |
- DefinitionAdjustments to reconcile profit (loss) to net cash flow from (used in) operating activities. [Refer: Profit (loss)] Reference 1: http://www.xbrl.org/2003/role/disclosureRef
-Name IAS
-Number 7
-IssueDate 2023-01-01
-Paragraph 20
-URI https://taxonomy.ifrs.org/xifrs-link?type=IAS&num=7&code=ifrs-tx-2023-en-r&anchor=para_20&doctype=Standard
-URIDate 2023-03-23
| Name: |
ifrs-full_AdjustmentsForReconcileProfitLoss |
| Namespace Prefix: |
ifrs-full_ |
| Data Type: |
xbrli:monetaryItemType |
| Balance Type: |
debit |
| Period Type: |
duration |
|
| X |
- References
+ Details
| Name: |
ifrs-full_AdjustmentsForReconcileProfitLossAbstract |
| Namespace Prefix: |
ifrs-full_ |
| Data Type: |
xbrli:stringItemType |
| Balance Type: |
na |
| Period Type: |
duration |
|
| X |
- DefinitionAdjustments for share-based payments to reconcile profit (loss) to net cash flow from (used in) operating activities. [Refer: Profit (loss)] Reference 1: http://www.xbrl.org/2009/role/commonPracticeRef
-Name IAS
-Number 7
-IssueDate 2023-01-01
-Paragraph 20
-Subparagraph b
-URI https://taxonomy.ifrs.org/xifrs-link?type=IAS&num=7&code=ifrs-tx-2023-en-r&anchor=para_20_b&doctype=Standard
-URIDate 2023-03-23
| Name: |
ifrs-full_AdjustmentsForSharebasedPayments |
| Namespace Prefix: |
ifrs-full_ |
| Data Type: |
xbrli:monetaryItemType |
| Balance Type: |
debit |
| Period Type: |
duration |
|
| X |
- DefinitionAdjustments, other than changes in working capital, to reconcile profit (loss) to net cash flow from (used in) operating activities. [Refer: Profit (loss)] Reference 1: http://www.xbrl.org/2009/role/commonPracticeRef
-Name IAS
-Number 7
-IssueDate 2023-01-01
-Paragraph 20
-URI https://taxonomy.ifrs.org/xifrs-link?type=IAS&num=7&code=ifrs-tx-2023-en-r&anchor=para_20&doctype=Standard
-URIDate 2023-03-23
| Name: |
ifrs-full_AdjustmentsToReconcileProfitLossOtherThanChangesInWorkingCapital |
| Namespace Prefix: |
ifrs-full_ |
| Data Type: |
xbrli:monetaryItemType |
| Balance Type: |
debit |
| Period Type: |
duration |
|
| X |
- DefinitionThe amount of cash on hand and demand deposits. [Refer: Cash on hand] Reference 1: http://www.xbrl.org/2009/role/commonPracticeRef
-Name IAS
-Number 7
-IssueDate 2023-01-01
-Paragraph 45
-URI https://taxonomy.ifrs.org/xifrs-link?type=IAS&num=7&code=ifrs-tx-2023-en-r&anchor=para_45&doctype=Standard
-URIDate 2023-03-23
| Name: |
ifrs-full_Cash |
| Namespace Prefix: |
ifrs-full_ |
| Data Type: |
xbrli:monetaryItemType |
| Balance Type: |
debit |
| Period Type: |
instant |
|
| X |
- DefinitionThe cash flows from (used in) financing activities, which are activities that result in changes in the size and composition of the contributed equity and borrowings of the entity. Reference 1: http://www.xbrl.org/2003/role/disclosureRef
-Name IAS
-Number 7
-IssueDate 2023-01-01
-Paragraph 10
-URI https://taxonomy.ifrs.org/xifrs-link?type=IAS&num=7&code=ifrs-tx-2023-en-r&anchor=para_10&doctype=Standard
-URIDate 2023-03-23
Reference 2: http://www.xbrl.org/2003/role/disclosureRef
-Name IAS
-Number 7
-IssueDate 2023-01-01
-Paragraph 50
-Subparagraph d
-URI https://taxonomy.ifrs.org/xifrs-link?type=IAS&num=7&code=ifrs-tx-2023-en-r&anchor=para_50_d&doctype=Standard
-URIDate 2023-03-23
| Name: |
ifrs-full_CashFlowsFromUsedInFinancingActivities |
| Namespace Prefix: |
ifrs-full_ |
| Data Type: |
xbrli:monetaryItemType |
| Balance Type: |
debit |
| Period Type: |
duration |
|
| X |
- References
+ Details
| Name: |
ifrs-full_CashFlowsFromUsedInFinancingActivitiesAbstract |
| Namespace Prefix: |
ifrs-full_ |
| Data Type: |
xbrli:stringItemType |
| Balance Type: |
na |
| Period Type: |
duration |
|
| X |
- DefinitionThe cash flows from (used in) investing activities, which are the acquisition and disposal of long-term assets and other investments not included in cash equivalents. Reference 1: http://www.xbrl.org/2003/role/disclosureRef
-Name IAS
-Number 7
-IssueDate 2023-01-01
-Paragraph 10
-URI https://taxonomy.ifrs.org/xifrs-link?type=IAS&num=7&code=ifrs-tx-2023-en-r&anchor=para_10&doctype=Standard
-URIDate 2023-03-23
Reference 2: http://www.xbrl.org/2003/role/disclosureRef
-Name IAS
-Number 7
-IssueDate 2023-01-01
-Paragraph 50
-Subparagraph d
-URI https://taxonomy.ifrs.org/xifrs-link?type=IAS&num=7&code=ifrs-tx-2023-en-r&anchor=para_50_d&doctype=Standard
-URIDate 2023-03-23
| Name: |
ifrs-full_CashFlowsFromUsedInInvestingActivities |
| Namespace Prefix: |
ifrs-full_ |
| Data Type: |
xbrli:monetaryItemType |
| Balance Type: |
debit |
| Period Type: |
duration |
|
| X |
- References
+ Details
| Name: |
ifrs-full_CashFlowsFromUsedInInvestingActivitiesAbstract |
| Namespace Prefix: |
ifrs-full_ |
| Data Type: |
xbrli:stringItemType |
| Balance Type: |
na |
| Period Type: |
duration |
|
| X |
- DefinitionThe cash flows from (used in) operating activities, which are the principal revenue-producing activities of the entity and other activities that are not investing or financing activities. [Refer: Revenue] Reference 1: http://www.xbrl.org/2003/role/disclosureRef
-Name IAS
-Number 7
-IssueDate 2023-01-01
-Paragraph 10
-URI https://taxonomy.ifrs.org/xifrs-link?type=IAS&num=7&code=ifrs-tx-2023-en-r&anchor=para_10&doctype=Standard
-URIDate 2023-03-23
Reference 2: http://www.xbrl.org/2003/role/disclosureRef
-Name IAS
-Number 7
-IssueDate 2023-01-01
-Paragraph 50
-Subparagraph d
-URI https://taxonomy.ifrs.org/xifrs-link?type=IAS&num=7&code=ifrs-tx-2023-en-r&anchor=para_50_d&doctype=Standard
-URIDate 2023-03-23
| Name: |
ifrs-full_CashFlowsFromUsedInOperatingActivities |
| Namespace Prefix: |
ifrs-full_ |
| Data Type: |
xbrli:monetaryItemType |
| Balance Type: |
na |
| Period Type: |
duration |
|
| X |
- References
+ Details
| Name: |
ifrs-full_CashFlowsFromUsedInOperatingActivitiesAbstract |
| Namespace Prefix: |
ifrs-full_ |
| Data Type: |
xbrli:stringItemType |
| Balance Type: |
na |
| Period Type: |
duration |
|
| X |
- DefinitionThe cash from (used in) the entity's operations. Reference 1: http://www.xbrl.org/2003/role/exampleRef
-Name IAS
-Number 7
-IssueDate 2023-01-01
-Section A Statement of cash flows for an entity other than a financial institution
-URI https://taxonomy.ifrs.org/xifrs-link?type=IAS&num=7&code=ifrs-tx-2023-en-r&doctype=Illustrative%20Examples&dita_xref=IAS07_IE_A_TI
-URIDate 2023-03-23
Reference 2: http://www.xbrl.org/2003/role/exampleRef
-Name IAS
-Number 7
-IssueDate 2023-01-01
-Paragraph 20
-URI https://taxonomy.ifrs.org/xifrs-link?type=IAS&num=7&code=ifrs-tx-2023-en-r&anchor=para_20&doctype=Standard
-URIDate 2023-03-23
| Name: |
ifrs-full_CashFlowsFromUsedInOperations |
| Namespace Prefix: |
ifrs-full_ |
| Data Type: |
xbrli:monetaryItemType |
| Balance Type: |
na |
| Period Type: |
duration |
|
| X |
- DefinitionThe effect of exchange rate changes on cash and cash equivalents held or due in a foreign currency. [Refer: Cash and cash equivalents] Reference 1: http://www.xbrl.org/2003/role/disclosureRef
-Name IAS
-Number 7
-IssueDate 2023-01-01
-Paragraph 25
-URI https://taxonomy.ifrs.org/xifrs-link?type=IAS&num=7&code=ifrs-tx-2023-en-r&anchor=para_25&doctype=Standard
-URIDate 2023-03-23
Reference 2: http://www.xbrl.org/2003/role/disclosureRef
-Name IAS
-Number 7
-IssueDate 2023-01-01
-Paragraph 28
-URI https://taxonomy.ifrs.org/xifrs-link?type=IAS&num=7&code=ifrs-tx-2023-en-r&anchor=para_28&doctype=Standard
-URIDate 2023-03-23
| Name: |
ifrs-full_EffectOfExchangeRateChangesOnCashAndCashEquivalents |
| Namespace Prefix: |
ifrs-full_ |
| Data Type: |
xbrli:monetaryItemType |
| Balance Type: |
debit |
| Period Type: |
duration |
|
| X |
- DefinitionThe increase (decrease) in cash and cash equivalents after the effect of exchange rate changes on cash and cash equivalents held in foreign currencies. [Refer: Cash and cash equivalents; Effect of exchange rate changes on cash and cash equivalents] Reference 1: http://www.xbrl.org/2003/role/disclosureRef
-Name IAS
-Number 7
-IssueDate 2023-01-01
-Paragraph 45
-URI https://taxonomy.ifrs.org/xifrs-link?type=IAS&num=7&code=ifrs-tx-2023-en-r&anchor=para_45&doctype=Standard
-URIDate 2023-03-23
| Name: |
ifrs-full_IncreaseDecreaseInCashAndCashEquivalents |
| Namespace Prefix: |
ifrs-full_ |
| Data Type: |
xbrli:monetaryItemType |
| Balance Type: |
debit |
| Period Type: |
duration |
|
| X |
- DefinitionThe cash outflow for interest paid, classified as operating activities. Reference 1: http://www.xbrl.org/2003/role/disclosureRef
-Name IAS
-Number 7
-IssueDate 2023-01-01
-Paragraph 31
-URI https://taxonomy.ifrs.org/xifrs-link?type=IAS&num=7&code=ifrs-tx-2023-en-r&anchor=para_31&doctype=Standard
-URIDate 2023-03-23
| Name: |
ifrs-full_InterestPaidClassifiedAsOperatingActivities |
| Namespace Prefix: |
ifrs-full_ |
| Data Type: |
xbrli:monetaryItemType |
| Balance Type: |
credit |
| Period Type: |
duration |
|
| X |
- DefinitionThe cash inflow from interest received, classified as operating activities. Reference 1: http://www.xbrl.org/2003/role/disclosureRef
-Name IAS
-Number 7
-IssueDate 2023-01-01
-Paragraph 31
-URI https://taxonomy.ifrs.org/xifrs-link?type=IAS&num=7&code=ifrs-tx-2023-en-r&anchor=para_31&doctype=Standard
-URIDate 2023-03-23
| Name: |
ifrs-full_InterestReceivedClassifiedAsOperatingActivities |
| Namespace Prefix: |
ifrs-full_ |
| Data Type: |
xbrli:monetaryItemType |
| Balance Type: |
debit |
| Period Type: |
duration |
|
| X |
- DefinitionThe cash outflow for payment of lease liabilities, classified as financing activities. [Refer: Lease liabilities] Reference 1: http://www.xbrl.org/2003/role/exampleRef
-Name IAS
-Number 7
-IssueDate 2023-01-01
-Paragraph 17
-Subparagraph e
-URI https://taxonomy.ifrs.org/xifrs-link?type=IAS&num=7&code=ifrs-tx-2023-en-r&anchor=para_17_e&doctype=Standard
-URIDate 2023-03-23
| Name: |
ifrs-full_PaymentsOfLeaseLiabilitiesClassifiedAsFinancingActivities |
| Namespace Prefix: |
ifrs-full_ |
| Data Type: |
xbrli:monetaryItemType |
| Balance Type: |
credit |
| Period Type: |
duration |
|
| X |
- DefinitionThe cash inflow from the exercise of options. Reference 1: http://www.xbrl.org/2009/role/commonPracticeRef
-Name IAS
-Number 7
-IssueDate 2023-01-01
-Paragraph 17
-URI https://taxonomy.ifrs.org/xifrs-link?type=IAS&num=7&code=ifrs-tx-2023-en-r&anchor=para_17&doctype=Standard
-URIDate 2023-03-23
| Name: |
ifrs-full_ProceedsFromExerciseOfOptions |
| Namespace Prefix: |
ifrs-full_ |
| Data Type: |
xbrli:monetaryItemType |
| Balance Type: |
debit |
| Period Type: |
duration |
|
| X |
- DefinitionThe cash inflow from issuing shares. Reference 1: http://www.xbrl.org/2003/role/exampleRef
-Name IAS
-Number 7
-IssueDate 2023-01-01
-Paragraph 17
-Subparagraph a
-URI https://taxonomy.ifrs.org/xifrs-link?type=IAS&num=7&code=ifrs-tx-2023-en-r&anchor=para_17_a&doctype=Standard
-URIDate 2023-03-23
| Name: |
ifrs-full_ProceedsFromIssuingShares |
| Namespace Prefix: |
ifrs-full_ |
| Data Type: |
xbrli:monetaryItemType |
| Balance Type: |
debit |
| Period Type: |
duration |
|
| X |
- DefinitionThe cash inflow from sales of property, plant and equipment, classified as investing activities. [Refer: Property, plant and equipment] Reference 1: http://www.xbrl.org/2003/role/exampleRef
-Name IAS
-Number 7
-IssueDate 2023-01-01
-Paragraph 16
-Subparagraph b
-URI https://taxonomy.ifrs.org/xifrs-link?type=IAS&num=7&code=ifrs-tx-2023-en-r&anchor=para_16_b&doctype=Standard
-URIDate 2023-03-23
| Name: |
ifrs-full_ProceedsFromSalesOfPropertyPlantAndEquipmentClassifiedAsInvestingActivities |
| Namespace Prefix: |
ifrs-full_ |
| Data Type: |
xbrli:monetaryItemType |
| Balance Type: |
debit |
| Period Type: |
duration |
|
| X |
- DefinitionThe profit (loss) from continuing and discontinued operations attributable to owners of the parent. [Refer: Profit (loss)] Reference 1: http://www.xbrl.org/2003/role/disclosureRef
-Name IAS
-Number 1
-IssueDate 2023-01-01
-Paragraph 81B
-Subparagraph a
-Clause ii
-URI https://taxonomy.ifrs.org/xifrs-link?type=IAS&num=1&code=ifrs-tx-2023-en-r&anchor=para_81B_a_ii&doctype=Standard
-URIDate 2023-03-23
| Name: |
ifrs-full_ProfitLossAttributableToOwnersOfParent |
| Namespace Prefix: |
ifrs-full_ |
| Data Type: |
xbrli:monetaryItemType |
| Balance Type: |
credit |
| Period Type: |
duration |
|
| X |
- DefinitionThe cash outflow for the purchase of property, plant and equipment, intangible assets other than goodwill, investment property and other non-current assets. [Refer: Intangible assets other than goodwill; Investment property; Other non-current assets; Property, plant and equipment] Reference 1: http://www.xbrl.org/2009/role/commonPracticeRef
-Name IAS
-Number 7
-IssueDate 2023-01-01
-Paragraph 16
-URI https://taxonomy.ifrs.org/xifrs-link?type=IAS&num=7&code=ifrs-tx-2023-en-r&anchor=para_16&doctype=Standard
-URIDate 2023-03-23
| Name: |
ifrs-full_PurchaseOfPropertyPlantAndEquipmentIntangibleAssetsOtherThanGoodwillInvestmentPropertyAndOtherNoncurrentAssets |
| Namespace Prefix: |
ifrs-full_ |
| Data Type: |
xbrli:monetaryItemType |
| Balance Type: |
credit |
| Period Type: |
duration |
|
| X |
- DefinitionThe cash outflow for repayments of bonds, notes and debentures. Reference 1: http://www.xbrl.org/2009/role/commonPracticeRef
-Name IAS
-Number 7
-IssueDate 2023-01-01
-Paragraph 17
-URI https://taxonomy.ifrs.org/xifrs-link?type=IAS&num=7&code=ifrs-tx-2023-en-r&anchor=para_17&doctype=Standard
-URIDate 2023-03-23
| Name: |
ifrs-full_RepaymentsOfBondsNotesAndDebentures |
| Namespace Prefix: |
ifrs-full_ |
| Data Type: |
xbrli:monetaryItemType |
| Balance Type: |
credit |
| Period Type: |
duration |
|
| X |
- DefinitionThe cash outflow for repayments of non-current borrowings. [Refer: Borrowings] Reference 1: http://www.xbrl.org/2009/role/commonPracticeRef
-Name IAS
-Number 7
-IssueDate 2023-01-01
-Paragraph 17
-URI https://taxonomy.ifrs.org/xifrs-link?type=IAS&num=7&code=ifrs-tx-2023-en-r&anchor=para_17&doctype=Standard
-URIDate 2023-03-23
| Name: |
ifrs-full_RepaymentsOfNoncurrentBorrowings |
| Namespace Prefix: |
ifrs-full_ |
| Data Type: |
xbrli:monetaryItemType |
| Balance Type: |
credit |
| Period Type: |
duration |
|
| X |
- DefinitionAdjustments for deferred expense to reconcile profit (loss) to net cash flow from (used in) operating activities.
| Name: |
kmda_AdjustmentsForDeferredExpenses |
| Namespace Prefix: |
kmda_ |
| Data Type: |
xbrli:monetaryItemType |
| Balance Type: |
debit |
| Period Type: |
duration |
|
| X |
- References
+ Details
| Name: |
kmda_CashReceivedPaidDuringThePeriodForAbstract |
| Namespace Prefix: |
kmda_ |
| Data Type: |
xbrli:stringItemType |
| Balance Type: |
na |
| Period Type: |
duration |
|
| X |
- References
+ Details
| Name: |
kmda_ChangesInAssetAndLiabilityItemsAbstract |
| Namespace Prefix: |
kmda_ |
| Data Type: |
xbrli:stringItemType |
| Balance Type: |
na |
| Period Type: |
duration |
|
| X |
- DefinitionPurchase of property and equipment.
| Name: |
kmda_PurchaseOfPropertyAndEquipment |
| Namespace Prefix: |
kmda_ |
| Data Type: |
xbrli:monetaryItemType |
| Balance Type: |
debit |
| Period Type: |
duration |
|
| X |
- DefinitionRight-of-use asset recognized with corresponding lease liability.
| Name: |
kmda_RightofuseAssetRecognizedWithCorrespondingLeaseLiability |
| Namespace Prefix: |
kmda_ |
| Data Type: |
xbrli:monetaryItemType |
| Balance Type: |
credit |
| Period Type: |
duration |
|
| X |
- References
+ Details
| Name: |
kmda_SignificantNonCashTransactionsAbstract |
| Namespace Prefix: |
kmda_ |
| Data Type: |
xbrli:stringItemType |
| Balance Type: |
na |
| Period Type: |
duration |
|
v3.24.1.u1
General
|
3 Months Ended |
Mar. 31, 2024 |
|---|
| General [Abstract] |
|
| General |
Note 1:- General
General description of the Company
and its activity
Kamada Ltd. (the “Company”)
is a commercial stage global biopharmaceutical company with a portfolio of marketed products indicated for rare and serious conditions
and a leader in the specialty plasma-derived field focused on diseases of limited treatment alternatives. The Company is also advancing
an innovative development pipeline targeting areas of significant unmet medical need. The Company’s strategy is focused on driving
profitable growth from its significant commercial catalysts as well as its manufacturing and development expertise in the plasma-derived
and biopharmaceutical fields. The Company’s commercial products portfolio includes six FDA approved plasma-derived biopharmaceutical
products KEDRAB®, CYTOGAM®, VARIZIG®, WINRHO SDF®, HEPAGAM B® and GLASSIA®, as well as KAMRAB®, KAMRHO (D)®
and two types of equine-based anti-snake venom (ASV) products. The Company distributes its commercial products portfolio directly, and
through strategic partners or third-party distributors in more than 30 countries, including the U.S., Canada, Israel, Russia, Argentina,
Brazil, India, Australia and other countries in Latin America, Europe, the Middle East and Asia. The Company leverages its expertise
and presence in the Israeli market to distribute, for use in Israel, more than 25 pharmaceutical products that are supplied by international
manufacturers and in addition have eleven biosimilar products in its Israeli distribution portfolio, which, subject to European Medicines
Agency (EMA) and Israeli Ministry of Health (“IL MOH”) approvals, are expected to be launched in Israel through 2028. The
Company owns an FDA licensed plasma collection center in Beaumont, Texas, which currently specializes in the collection of hyper-immune
plasma used in the manufacture of KAMRHO (D), KAMRAB and KEDRAB. In addition to the Company’s commercial operation, it invests
in research and development of new product candidates. The Company’s leading investigational product is an inhaled AAT for the
treatment of AAT deficiency, for which it is continuing to progress the InnovAATe clinical trial, a randomized, double-blind, placebo-controlled,
pivotal Phase 3 trial.
In November 2021, the Company acquired
CYTOGAM, WINRHO SDF, VARIZIG and HEPGAM B from Saol Therapeutics Ltd. (“Saol”). The acquisition of this portfolio furthered
the Company’s core objective to become a fully integrated specialty plasma company with strong commercial capabilities in the U.S.
market, as well as to expand to new markets, mainly in the Middle East/North Africa region, and to broaden the Company’s portfolio
offering in existing markets. The Company’s wholly owned U.S. subsidiary, Kamada Inc., is responsible for the commercialization
of the four products in the U.S. market, including direct sales to wholesalers and local distributers. Refer to Note 5 in our annual
Financial report for further details on this acquisition.
The Company markets GLASSIA in the U.S.
through a strategic partnership with Takeda Pharmaceuticals Company Limited (“Takeda”). Historically,
the Company generated revenues on sales of GLASSIA, manufactured by the Company, to Takeda for further distribution in the United States.
In accordance with the agreement with Takeda, the Company ceased the production and sale of GLASSIA to Takeda during 2021, and during
the first quarter of 2022, Takeda began to pay the Company royalties on sales of GLASSIA manufactured by Takeda, at a rate of 12% on
net sales through August 2025 and at a rate of 6% thereafter until 2040, with a minimum of $5 million annually for each of the years
from 2022 to 2040. Refer to Note 18 in our annual Financial report for further details on the engagement with Takeda.
The Company’s ordinary shares are
listed for trading on the Tel Aviv Stock Exchange and the NASDAQ Global Select Market.
FIMI Opportunity Funds (“FIMI”),
the leading private equity firm in Israel beneficially owns approximately 38% of the Company’s outstanding ordinary shares and is
a controlling shareholder of the Company; within the meaning of the Israeli Companies Law, 1999. Refer to Note 20 for further details
and Item 7 within the Company annual reports on Form 20-F.
|
| X |
- References
+ Details
| Name: |
kmda_GeneralAbstract |
| Namespace Prefix: |
kmda_ |
| Data Type: |
xbrli:stringItemType |
| Balance Type: |
na |
| Period Type: |
duration |
|
v3.24.1.u1
Significant Accounting Policies
|
3 Months Ended |
Mar. 31, 2024 |
|---|
| Significant Accounting Policies [Abstract] |
|
| Significant Accounting Policies |
Note 2:- Significant Accounting Policies
| | a. | Basis of preparation of the interim consolidated financial statements: |
The interim consolidated financial
statements have been prepared in accordance with generally accepted accounting principles for the preparation of financial statements
for interim periods, as prescribed in IAS 34, “Interim Financial Reporting”.
| | b. | Implementation of new accounting standards: |
| |
|
Amendment to IAS 1,
Presentation of Financial Statements: Classification of Liabilities as Current or Non-Current and subsequent amendment: Non-Current
Liabilities with Covenants |
The amendment, together with the subsequent
amendment to IAS 1 (see hereunder) replaces certain requirements for classifying liabilities as current or non-current. According to the
amendment, a liability will be classified as non-current when the entity has the right to defer settlement for at least 12 months after
the reporting period, and it “has substance” and is in existence at the end of the reporting period. According to the subsequent
amendment, as published in October 2022, covenants with which the entity must comply after the reporting date do not affect classification
of the liability as current or non-current. Additionally, the subsequent amendment adds disclosure requirements for liabilities subject
to covenants within 12 months after the reporting date, such as disclosure regarding the nature of the covenants, the date they need to
be complied with and facts and circumstances that indicate the entity may have difficulty complying with the covenants. Furthermore, the
amendment clarifies that the conversion option of a liability will affect its classification as current or non-current, other than when
the conversion option is recognized as equity.
The amendment and subsequent amendment
are effective for reporting periods beginning on or after January 1, 2024. The amendment and subsequent amendment are applicable retrospectively,
including an amendment to comparative data.
As of March 31, 2024, the Company does
not have impact on its financial statement.
|
| X |
- DefinitionThe disclosure of changes made to accounting policies by the entity. Reference 1: http://www.xbrl.org/2009/role/commonPracticeRef
-Name IAS
-Number 1
-IssueDate 2023-01-01
-Paragraph 10
-Subparagraph e
-URI https://taxonomy.ifrs.org/xifrs-link?type=IAS&num=1&code=ifrs-tx-2023-en-r&anchor=para_10_e&doctype=Standard
-URIDate 2023-03-23
| Name: |
ifrs-full_DisclosureOfChangesInAccountingPoliciesExplanatory |
| Namespace Prefix: |
ifrs-full_ |
| Data Type: |
dtr-types:textBlockItemType |
| Balance Type: |
na |
| Period Type: |
duration |
|
v3.24.1.u1
Significant Events in the Reporting Period
|
3 Months Ended |
Mar. 31, 2024 |
|---|
| Significant Events in the Reporting Period [Abstract] |
|
| Significant Events in the Reporting Period |
Note 3:- Significant events in the reporting period
On February 29, 2024, the Company’s Board of Directors
approved the grant of options to purchase up to 27,468 options to purchase ordinary shares of the Company under the 2011 Plan and the
US Appendix.
The Company granted, out of the above mentioned, to employees
and executive officers the following:
Under the Israeli Share Option Plan:
| - | 20,800
options to purchase the ordinary shares of the Company, at an exercise price of NIS 23.91 (USD 6.67) per share. The fair value of the
options calculated on the date of grant using the binomial option valuation model was estimated at $48 thousands. |
Under the US Appendix:
| | - | 6,668 options to purchase the ordinary shares of the Company, at an exercise price of USD 6.62 per
share. The fair value of the options was estimated on the date of grant was estimated at $18 thousands. |
|
| X |
- References
+ Details
| Name: |
ifrs-full_DisclosureOfNonadjustingEventsAfterReportingPeriodAbstract |
| Namespace Prefix: |
ifrs-full_ |
| Data Type: |
xbrli:stringItemType |
| Balance Type: |
na |
| Period Type: |
duration |
|
| X |
- DefinitionThe disclosure of non-adjusting events after the reporting period. [Refer: Non-adjusting events after reporting period [member]] Reference 1: http://www.xbrl.org/2003/role/disclosureRef
-Name IAS
-Number 10
-IssueDate 2023-01-01
-Paragraph 21
-URI https://taxonomy.ifrs.org/xifrs-link?type=IAS&num=10&code=ifrs-tx-2023-en-r&anchor=para_21&doctype=Standard
-URIDate 2023-03-23
| Name: |
ifrs-full_DisclosureOfNonadjustingEventsAfterReportingPeriodExplanatory |
| Namespace Prefix: |
ifrs-full_ |
| Data Type: |
dtr-types:textBlockItemType |
| Balance Type: |
na |
| Period Type: |
duration |
|
v3.24.1.u1
Operating Segments
|
3 Months Ended |
Mar. 31, 2024 |
|---|
| Operating Segments [Abstract] |
|
| Operating Segments |
Note 4:- Operating Segments
The company has two operating segments,
as follows:
| Proprietary
Products |
- |
Development, manufacturing, sales
and distribution of proprietary plasma-derived protein therapeutics. |
| |
|
|
| Distribution |
- |
Distribute imported drug products in Israel, which
are manufactured by third parties. |
| | b. | Reporting on operating segments: |
| | |
Proprietary
Products | | |
Distribution | | |
Total | |
| | |
U.S Dollars in thousands | |
| | |
Unaudited | |
| Three months period ended March 31, 2024 | |
| | |
| | |
| |
| Revenues | |
$ | 33,758 | | |
$ | 3,978 | | |
$ | 37,736 | |
| Gross profit | |
$ | 16,138 | | |
$ | 613 | | |
$ | 16,751 | |
| Unallocated corporate expenses | |
| | | |
| | | |
| (12,712 | ) |
| Finance expenses, net | |
| | | |
| | | |
| (1,600 | ) |
| Income before taxes on income | |
| | | |
| | | |
$ | 2,439 | |
| | |
Proprietary
Products | | |
Distribution | | |
Total | |
| | |
U.S Dollars in thousands | |
| | |
Unaudited | |
| Three months period ended March 31, 2023 | |
| | |
| | |
| |
| Revenues | |
$ | 24,061 | | |
$ | 6,649 | | |
$ | 30,710 | |
| Gross profit | |
$ | 10,837 | | |
$ | 1,002 | | |
$ | 11,839 | |
| Unallocated corporate expenses | |
| | | |
| | | |
| (11,550 | ) |
| Finance expenses, net | |
| | | |
| | | |
| (2,085 | ) |
| Income before taxes on income | |
| | | |
| | | |
$ | (1,796 | ) |
| |
|
Proprietary
Products |
|
|
Distribution |
|
|
Total |
|
| |
|
U.S
Dollars in thousands |
|
| |
|
Audited |
|
| Year Ended December 31, 2023 |
|
|
|
|
|
|
|
|
|
| Revenues |
|
$ |
115,458 |
|
|
$ |
27,061 |
|
|
$ |
142,519 |
|
| Gross profit |
|
$ |
52,116 |
|
|
$ |
3,374 |
|
|
$ |
55,490 |
|
| Unallocated corporate
expenses |
|
|
|
|
|
|
|
|
|
|
(45,426 |
) |
| Finance expenses, net |
|
|
|
|
|
|
|
|
|
|
(1,635 |
) |
| Income before taxes
on income |
|
|
|
|
|
|
|
|
|
$ |
8,429 |
|
| | c. | Reporting on operating segments by geographic region: |
| | |
Three months period ended
March 31, 2024 | |
| | |
Proprietary
Products | | |
Distribution | | |
Total | |
| | |
U.S Dollars in thousands | |
| | |
Unaudited | |
| Geographical markets | |
| | |
| | |
| |
| U.S.A | |
$ | 25,849 | | |
$ | - | | |
$ | 25,849 | |
| Israel | |
| 1,832 | | |
| 3,978 | | |
| 5,810 | |
| Canada | |
| 3,281 | | |
| - | | |
| 3,281 | |
| Europe | |
| 246 | | |
| - | | |
| 246 | |
| Latin America | |
| 1,116 | | |
| - | | |
| 1,116 | |
| Asia | |
| 1,434 | | |
| - | | |
| 1,434 | |
| | |
$ | 33,758 | | |
$ | 3,978 | | |
$ | 37,736 | |
| | |
Three months period ended
March 31, 2023 | |
| | |
Proprietary
Products | | |
Distribution | | |
Total | |
| | |
U.S Dollars in thousands | |
| | |
Unaudited | |
| Geographical markets | |
| | |
| | |
| |
| U.S.A | |
$ | 13,598 | | |
$ | - | | |
$ | 13,598 | |
| Israel | |
| 994 | | |
| 6,649 | | |
| 7,643 | |
| Canada | |
| 3,232 | | |
| - | | |
| 3,232 | |
| Europe | |
| 3,334 | | |
| - | | |
| 3,334 | |
| Latin America | |
| 1,316 | | |
| - | | |
| 1,316 | |
| Asia | |
| 1,550 | | |
| - | | |
| 1,550 | |
| Others | |
| 38 | | |
| - | | |
| 38 | |
| | |
$ | 24,061 | | |
$ | 6,649 | | |
$ | 30,710 | |
| | |
Year ended December 31, 2023 | |
| | |
Proprietary
Products | | |
Distribution | | |
Total | |
| | |
U.S Dollars in thousands | |
| | |
Audited | |
| Geographical markets | |
| | |
| | |
| |
| U.S.A | |
$ | 73,741 | | |
$ | - | | |
$ | 73,741 | |
| Israel | |
| 4,236 | | |
| 27,060 | | |
| 31,296 | |
| Canada | |
| 11,162 | | |
| - | | |
| 11,162 | |
| Europe | |
| 7,088 | | |
| - | | |
| 7,088 | |
| Latin America | |
| 12,928 | | |
| - | | |
| 12,928 | |
| Asia | |
| 6,147 | | |
| - | | |
| 6,147 | |
| Others | |
| 157 | | |
| - | | |
| 157 | |
| | |
$ | 115,459 | | |
$ | 27,060 | | |
$ | 142,519 | |
|
| X |
- DefinitionThe entire disclosure for operating segments. Reference 1: http://www.xbrl.org/2003/role/disclosureRef
-Name IFRS
-Number 8
-IssueDate 2023-01-01
-Section Disclosure
-URI https://taxonomy.ifrs.org/xifrs-link?type=IFRS&num=8&code=ifrs-tx-2023-en-r&doctype=Standard&dita_xref=IFRS08_g20-24_TI
-URIDate 2023-03-23
| Name: |
ifrs-full_DisclosureOfEntitysReportableSegmentsExplanatory |
| Namespace Prefix: |
ifrs-full_ |
| Data Type: |
dtr-types:textBlockItemType |
| Balance Type: |
na |
| Period Type: |
duration |
|
| X |
- References
+ Details
| Name: |
ifrs-full_DisclosureOfOperatingSegmentsAbstract |
| Namespace Prefix: |
ifrs-full_ |
| Data Type: |
xbrli:stringItemType |
| Balance Type: |
na |
| Period Type: |
duration |
|
v3.24.1.u1
Financial Instruments
|
3 Months Ended |
Mar. 31, 2024 |
|---|
| Financial Instruments [Abstract] |
|
| Financial Instruments |
Note 5:- Financial Instruments
| |
|
Classification of financial instruments by fair value hierarchy |
Financial assets (liabilities) measured at fair value
| | |
Level 1 | | |
Level 2 | | |
Level 3 | |
| | |
U.S Dollars in thousands | |
| March 31, 2024 | |
| | |
| | |
| |
| Derivatives instruments | |
$ | - | | |
$ | 11 | | |
$ | - | |
| Contingent consideration | |
$ | - | | |
$ | - | | |
$ | (19,453 | ) |
| | |
| | | |
| | | |
| | |
| March 31, 2023 | |
| | | |
| | | |
| | |
| Derivatives instruments | |
| - | | |
$ | (91 | ) | |
$ | - | |
| Contingent consideration | |
$ | - | | |
$ | - | | |
$ | (24,115 | ) |
| | |
| | | |
| | | |
| | |
| December 31, 2023 | |
| | | |
| | | |
| | |
| Derivatives instruments | |
$ | - | | |
$ | 149 | | |
$ | - | |
| Contingent consideration | |
$ | - | | |
$ | - | | |
$ | (21,855 | ) |
During the three months ended on March 31, 2024
there were no transfers due to the fair value measurement of any financial instrument from Level 1 to Level 2, and furthermore, there
were no transfers to or from Level 3 due to the fair value measurement of any financial instrument.
|
| X |
- References
+ Details
| Name: |
ifrs-full_DisclosureOfFairValueMeasurementOfAssetsAbstract |
| Namespace Prefix: |
ifrs-full_ |
| Data Type: |
xbrli:stringItemType |
| Balance Type: |
na |
| Period Type: |
duration |
|
| X |
- DefinitionThe entire disclosure for financial instruments. Reference 1: http://www.xbrl.org/2003/role/disclosureRef
-Name IFRS
-Number 7
-IssueDate 2023-01-01
-Section Scope
-URI https://taxonomy.ifrs.org/xifrs-link?type=IFRS&num=7&code=ifrs-tx-2023-en-r&doctype=Standard&dita_xref=IFRS07_g3-5A_TI
-URIDate 2023-03-23
| Name: |
ifrs-full_DisclosureOfFinancialInstrumentsExplanatory |
| Namespace Prefix: |
ifrs-full_ |
| Data Type: |
dtr-types:textBlockItemType |
| Balance Type: |
na |
| Period Type: |
duration |
|
v3.24.1.u1
Subsequent Events
|
3 Months Ended |
Mar. 31, 2024 |
|---|
| Subsequent events [Abstract] |
|
| Subsequent events |
Note 6:- Subsequent events
On May 2, 2024, our U.S. subsidiary Kamada Plasma
LLC entered into a lease agreement for a 11,100 square feet premises in San Antonio, Texas to be used as a plasma collection center. The
lease is in effect for an initial period of ten years commencing on the rent commencement date which will be the earlier of (a) opening
for business in the facility or (b) 180 days following receipt of building permits. The lease agreement may be extended for three consecutive
periods of five years each, upon at least 120 days prior written notice.
|
| X |
- DefinitionThe entire disclosure for events after the reporting period. Reference 1: http://www.xbrl.org/2003/role/disclosureRef
-Name IAS
-Number 10
-IssueDate 2023-01-01
-Section Disclosure
-URI https://taxonomy.ifrs.org/xifrs-link?type=IAS&num=10&code=ifrs-tx-2023-en-r&doctype=Standard&dita_xref=IAS10_g17-22_TI
-URIDate 2023-03-23
| Name: |
ifrs-full_DisclosureOfEventsAfterReportingPeriodExplanatory |
| Namespace Prefix: |
ifrs-full_ |
| Data Type: |
dtr-types:textBlockItemType |
| Balance Type: |
na |
| Period Type: |
duration |
|
v3.24.1.u1
Accounting Policies, by Policy (Policies)
|
3 Months Ended |
Mar. 31, 2024 |
|---|
| Accounting Policies [Abstract] |
|
| Basis of preparation of the interim consolidated financial statements |
| | a. | Basis of preparation of the interim consolidated financial statements: | The interim consolidated financial
statements have been prepared in accordance with generally accepted accounting principles for the preparation of financial statements
for interim periods, as prescribed in IAS 34, “Interim Financial Reporting”.
|
| Implementation of new accounting standards |
| | b. | Implementation of new accounting standards: |
| |
|
Amendment to IAS 1,
Presentation of Financial Statements: Classification of Liabilities as Current or Non-Current and subsequent amendment: Non-Current
Liabilities with Covenants |
The amendment, together with the subsequent
amendment to IAS 1 (see hereunder) replaces certain requirements for classifying liabilities as current or non-current. According to the
amendment, a liability will be classified as non-current when the entity has the right to defer settlement for at least 12 months after
the reporting period, and it “has substance” and is in existence at the end of the reporting period. According to the subsequent
amendment, as published in October 2022, covenants with which the entity must comply after the reporting date do not affect classification
of the liability as current or non-current. Additionally, the subsequent amendment adds disclosure requirements for liabilities subject
to covenants within 12 months after the reporting date, such as disclosure regarding the nature of the covenants, the date they need to
be complied with and facts and circumstances that indicate the entity may have difficulty complying with the covenants. Furthermore, the
amendment clarifies that the conversion option of a liability will affect its classification as current or non-current, other than when
the conversion option is recognized as equity. The amendment and subsequent amendment
are effective for reporting periods beginning on or after January 1, 2024. The amendment and subsequent amendment are applicable retrospectively,
including an amendment to comparative data. As of March 31, 2024, the Company does
not have impact on its financial statement.
|
| X |
- DefinitionThe disclosure of the basis used for the preparation of the financial statements. Reference 1: http://www.xbrl.org/2009/role/commonPracticeRef
-Name IAS
-Number 1
-IssueDate 2023-01-01
-Paragraph 10
-Subparagraph e
-URI https://taxonomy.ifrs.org/xifrs-link?type=IAS&num=1&code=ifrs-tx-2023-en-r&anchor=para_10_e&doctype=Standard
-URIDate 2023-03-23
| Name: |
ifrs-full_DisclosureOfBasisOfPreparationOfFinancialStatementsExplanatory |
| Namespace Prefix: |
ifrs-full_ |
| Data Type: |
dtr-types:textBlockItemType |
| Balance Type: |
na |
| Period Type: |
duration |
|
| X |
- DefinitionDisclosure of accounting policy pertaining to new accounting pronouncements that may impact the entity's financial reporting. Includes, but is not limited to, quantification of the expected or actual impact.
| Name: |
kmda_ImplementationOfNewAccountingStandardsPolicyTextBlock |
| Namespace Prefix: |
kmda_ |
| Data Type: |
dtr:textBlockItemType |
| Balance Type: |
na |
| Period Type: |
duration |
|
| X |
- References
+ Details
| Name: |
us-gaap_AccountingPoliciesAbstract |
| Namespace Prefix: |
us-gaap_ |
| Data Type: |
xbrli:stringItemType |
| Balance Type: |
na |
| Period Type: |
duration |
|
v3.24.1.u1
Operating Segments (Tables)
|
3 Months Ended |
Mar. 31, 2024 |
|---|
| Operating Segments [Abstract] |
|
| Schedule of Reporting on Operating Segments |
Reporting on operating segments:
| | |
Proprietary
Products | | |
Distribution | | |
Total | |
| | |
U.S Dollars in thousands | |
| | |
Unaudited | |
| Three months period ended March 31, 2024 | |
| | |
| | |
| |
| Revenues | |
$ | 33,758 | | |
$ | 3,978 | | |
$ | 37,736 | |
| Gross profit | |
$ | 16,138 | | |
$ | 613 | | |
$ | 16,751 | |
| Unallocated corporate expenses | |
| | | |
| | | |
| (12,712 | ) |
| Finance expenses, net | |
| | | |
| | | |
| (1,600 | ) |
| Income before taxes on income | |
| | | |
| | | |
$ | 2,439 | |
| | |
Proprietary
Products | | |
Distribution | | |
Total | |
| | |
U.S Dollars in thousands | |
| | |
Unaudited | |
| Three months period ended March 31, 2023 | |
| | |
| | |
| |
| Revenues | |
$ | 24,061 | | |
$ | 6,649 | | |
$ | 30,710 | |
| Gross profit | |
$ | 10,837 | | |
$ | 1,002 | | |
$ | 11,839 | |
| Unallocated corporate expenses | |
| | | |
| | | |
| (11,550 | ) |
| Finance expenses, net | |
| | | |
| | | |
| (2,085 | ) |
| Income before taxes on income | |
| | | |
| | | |
$ | (1,796 | ) |
| |
|
Proprietary
Products |
|
|
Distribution |
|
|
Total |
|
| |
|
U.S
Dollars in thousands |
|
| |
|
Audited |
|
| Year Ended December 31, 2023 |
|
|
|
|
|
|
|
|
|
| Revenues |
|
$ |
115,458 |
|
|
$ |
27,061 |
|
|
$ |
142,519 |
|
| Gross profit |
|
$ |
52,116 |
|
|
$ |
3,374 |
|
|
$ |
55,490 |
|
| Unallocated corporate
expenses |
|
|
|
|
|
|
|
|
|
|
(45,426 |
) |
| Finance expenses, net |
|
|
|
|
|
|
|
|
|
|
(1,635 |
) |
| Income before taxes
on income |
|
|
|
|
|
|
|
|
|
$ |
8,429 |
|
|
| Schedule of Reporting on Operating Segments Geographic Region |
Reporting on operating segments by geographic region:
| | |
Three months period ended
March 31, 2024 | |
| | |
Proprietary
Products | | |
Distribution | | |
Total | |
| | |
U.S Dollars in thousands | |
| | |
Unaudited | |
| Geographical markets | |
| | |
| | |
| |
| U.S.A | |
$ | 25,849 | | |
$ | - | | |
$ | 25,849 | |
| Israel | |
| 1,832 | | |
| 3,978 | | |
| 5,810 | |
| Canada | |
| 3,281 | | |
| - | | |
| 3,281 | |
| Europe | |
| 246 | | |
| - | | |
| 246 | |
| Latin America | |
| 1,116 | | |
| - | | |
| 1,116 | |
| Asia | |
| 1,434 | | |
| - | | |
| 1,434 | |
| | |
$ | 33,758 | | |
$ | 3,978 | | |
$ | 37,736 | |
| | |
Three months period ended
March 31, 2023 | |
| | |
Proprietary
Products | | |
Distribution | | |
Total | |
| | |
U.S Dollars in thousands | |
| | |
Unaudited | |
| Geographical markets | |
| | |
| | |
| |
| U.S.A | |
$ | 13,598 | | |
$ | - | | |
$ | 13,598 | |
| Israel | |
| 994 | | |
| 6,649 | | |
| 7,643 | |
| Canada | |
| 3,232 | | |
| - | | |
| 3,232 | |
| Europe | |
| 3,334 | | |
| - | | |
| 3,334 | |
| Latin America | |
| 1,316 | | |
| - | | |
| 1,316 | |
| Asia | |
| 1,550 | | |
| - | | |
| 1,550 | |
| Others | |
| 38 | | |
| - | | |
| 38 | |
| | |
$ | 24,061 | | |
$ | 6,649 | | |
$ | 30,710 | |
| | |
Year ended December 31, 2023 | |
| | |
Proprietary
Products | | |
Distribution | | |
Total | |
| | |
U.S Dollars in thousands | |
| | |
Audited | |
| Geographical markets | |
| | |
| | |
| |
| U.S.A | |
$ | 73,741 | | |
$ | - | | |
$ | 73,741 | |
| Israel | |
| 4,236 | | |
| 27,060 | | |
| 31,296 | |
| Canada | |
| 11,162 | | |
| - | | |
| 11,162 | |
| Europe | |
| 7,088 | | |
| - | | |
| 7,088 | |
| Latin America | |
| 12,928 | | |
| - | | |
| 12,928 | |
| Asia | |
| 6,147 | | |
| - | | |
| 6,147 | |
| Others | |
| 157 | | |
| - | | |
| 157 | |
| | |
$ | 115,459 | | |
$ | 27,060 | | |
$ | 142,519 | |
|
| X |
- References
+ Details
| Name: |
ifrs-full_DisclosureOfOperatingSegmentsAbstract |
| Namespace Prefix: |
ifrs-full_ |
| Data Type: |
xbrli:stringItemType |
| Balance Type: |
na |
| Period Type: |
duration |
|
| X |
- DefinitionThe disclosure of operating segments. [Refer: Operating segments [member]] Reference 1: http://www.xbrl.org/2003/role/disclosureRef
-Name IFRS
-Number 8
-IssueDate 2023-01-01
-Paragraph 23
-URI https://taxonomy.ifrs.org/xifrs-link?type=IFRS&num=8&code=ifrs-tx-2023-en-r&anchor=para_23&doctype=Standard
-URIDate 2023-03-23
| Name: |
ifrs-full_DisclosureOfOperatingSegmentsExplanatory |
| Namespace Prefix: |
ifrs-full_ |
| Data Type: |
dtr-types:textBlockItemType |
| Balance Type: |
na |
| Period Type: |
duration |
|
| X |
- DefinitionSchedule of reporting on operating segments geographic region [Table Text Block].
| Name: |
kmda_ScheduleOfReportingOnOperatingSegmentsGeographicRegionTableTextBlock |
| Namespace Prefix: |
kmda_ |
| Data Type: |
dtr:textBlockItemType |
| Balance Type: |
na |
| Period Type: |
duration |
|
v3.24.1.u1
Financial Instruments (Tables)
|
3 Months Ended |
Mar. 31, 2024 |
|---|
| Financial Instruments [Abstract] |
|
| Schedule of Financial Assets (Liabilities) Measured at Fair Value |
Financial assets (liabilities) measured at fair value
| | |
Level 1 | | |
Level 2 | | |
Level 3 | |
| | |
U.S Dollars in thousands | |
| March 31, 2024 | |
| | |
| | |
| |
| Derivatives instruments | |
$ | - | | |
$ | 11 | | |
$ | - | |
| Contingent consideration | |
$ | - | | |
$ | - | | |
$ | (19,453 | ) |
| | |
| | | |
| | | |
| | |
| March 31, 2023 | |
| | | |
| | | |
| | |
| Derivatives instruments | |
| - | | |
$ | (91 | ) | |
$ | - | |
| Contingent consideration | |
$ | - | | |
$ | - | | |
$ | (24,115 | ) |
| | |
| | | |
| | | |
| | |
| December 31, 2023 | |
| | | |
| | | |
| | |
| Derivatives instruments | |
$ | - | | |
$ | 149 | | |
$ | - | |
| Contingent consideration | |
$ | - | | |
$ | - | | |
$ | (21,855 | ) |
|
| X |
- References
+ Details
| Name: |
ifrs-full_DisclosureOfFairValueMeasurementOfAssetsAbstract |
| Namespace Prefix: |
ifrs-full_ |
| Data Type: |
xbrli:stringItemType |
| Balance Type: |
na |
| Period Type: |
duration |
|
| X |
- DefinitionThe disclosure of the fair value measurement of assets. Reference 1: http://www.xbrl.org/2003/role/disclosureRef
-Name IFRS
-Number 13
-IssueDate 2023-01-01
-Paragraph 93
-URI https://taxonomy.ifrs.org/xifrs-link?type=IFRS&num=13&code=ifrs-tx-2023-en-r&anchor=para_93&doctype=Standard
-URIDate 2023-03-23
| Name: |
ifrs-full_DisclosureOfFairValueMeasurementOfAssetsExplanatory |
| Namespace Prefix: |
ifrs-full_ |
| Data Type: |
dtr-types:textBlockItemType |
| Balance Type: |
na |
| Period Type: |
duration |
|
v3.24.1.u1
| X |
- DefinitionThe interest rate on borrowings. [Refer: Borrowings] Reference 1: http://www.xbrl.org/2009/role/commonPracticeRef
-Name IFRS
-Number 7
-IssueDate 2023-01-01
-Paragraph 7
-URI https://taxonomy.ifrs.org/xifrs-link?type=IFRS&num=7&code=ifrs-tx-2023-en-r&anchor=para_7&doctype=Standard
-URIDate 2023-03-23
| Name: |
ifrs-full_BorrowingsInterestRate |
| Namespace Prefix: |
ifrs-full_ |
| Data Type: |
dtr-types:percentItemType |
| Balance Type: |
na |
| Period Type: |
instant |
|
| X |
- References
+ Details
| Name: |
kmda_GeneralLineItems |
| Namespace Prefix: |
kmda_ |
| Data Type: |
xbrli:stringItemType |
| Balance Type: |
na |
| Period Type: |
duration |
|
| X |
- DefinitionPercentage of outstanding ordinary shares.
| Name: |
kmda_PercentageOfOutstandingOrdinaryShares |
| Namespace Prefix: |
kmda_ |
| Data Type: |
dtr:percentItemType |
| Balance Type: |
na |
| Period Type: |
duration |
|
v3.24.1.u1
| X |
- DefinitionThe weighted average exercise price of share options exercised in a share-based payment arrangement. [Refer: Weighted average [member]] Reference 1: http://www.xbrl.org/2003/role/disclosureRef
-Name IFRS
-Number 2
-IssueDate 2023-01-01
-Paragraph 45
-Subparagraph b
-Clause iv
-URI https://taxonomy.ifrs.org/xifrs-link?type=IFRS&num=2&code=ifrs-tx-2023-en-r&anchor=para_45_b_iv&doctype=Standard
-URIDate 2023-03-23
| Name: |
ifrs-full_WeightedAverageExercisePriceOfShareOptionsExercisedInSharebasedPaymentArrangement2019 |
| Namespace Prefix: |
ifrs-full_ |
| Data Type: |
dtr-types:perShareItemType |
| Balance Type: |
na |
| Period Type: |
duration |
|
| X |
- DefinitionThe weighted average fair value of share options granted during the period at the measurement date. [Refer: Weighted average [member]] Reference 1: http://www.xbrl.org/2003/role/disclosureRef
-Name IFRS
-Number 2
-IssueDate 2023-01-01
-Paragraph 47
-Subparagraph a
-URI https://taxonomy.ifrs.org/xifrs-link?type=IFRS&num=2&code=ifrs-tx-2023-en-r&anchor=para_47_a&doctype=Standard
-URIDate 2023-03-23
| Name: |
ifrs-full_WeightedAverageFairValueAtMeasurementDateShareOptionsGranted |
| Namespace Prefix: |
ifrs-full_ |
| Data Type: |
xbrli:monetaryItemType |
| Balance Type: |
credit |
| Period Type: |
instant |
|
| X |
- References
+ Details
| Name: |
kmda_EventsInReportingPeriodLineItems |
| Namespace Prefix: |
kmda_ |
| Data Type: |
xbrli:stringItemType |
| Balance Type: |
na |
| Period Type: |
duration |
|
| X |
- Definition
+ References
+ Details
| Name: |
kmda_NumberOfShareOptionsGrantedInSharebasedPaymentArrangements |
| Namespace Prefix: |
kmda_ |
| Data Type: |
xbrli:sharesItemType |
| Balance Type: |
na |
| Period Type: |
instant |
|
| X |
- Details
| Name: |
ifrs-full_TypesOfSharebasedPaymentArrangementsAxis=kmda_IsraeliShareOptionPlanMember |
| Namespace Prefix: |
|
| Data Type: |
na |
| Balance Type: |
|
| Period Type: |
|
|
v3.24.1.u1
| X |
- References
+ Details
| Name: |
ifrs-full_DisclosureOfOperatingSegmentsAbstract |
| Namespace Prefix: |
ifrs-full_ |
| Data Type: |
xbrli:stringItemType |
| Balance Type: |
na |
| Period Type: |
duration |
|
| X |
- DefinitionNumber of operating segments. An operating segment is a component of an enterprise: (a) that engages in business activities from which it may earn revenues and incur expenses (including revenues and expenses relating to transactions with other components of the same enterprise), (b) whose operating results are regularly reviewed by the enterprise's chief operating decision maker to make decisions about resources to be allocated to the segment and assess its performance, and (c) for which discrete financial information is available. An operating segment may engage in business activities for which it has yet to earn revenues, for example, start-up operations may be operating segments before earning revenues.
| Name: |
kmda_NumberOfOperatingSegment |
| Namespace Prefix: |
kmda_ |
| Data Type: |
xbrli:integerItemType |
| Balance Type: |
na |
| Period Type: |
duration |
|
v3.24.1.u1
Operating Segments (Details) - Schedule of Reporting on Operating Segments - USD ($)
|
3 Months Ended |
12 Months Ended |
Mar. 31, 2024 |
Mar. 31, 2023 |
Dec. 31, 2023 |
| Schedule of Reporting on Operating Segments [Line Items] |
|
|
|
| Revenues |
$ 37,736
|
$ 30,710
|
$ 142,519
|
| Gross profit |
16,751
|
11,839
|
55,490
|
| Unallocated corporate expenses |
(12,712)
|
(11,550)
|
(45,426)
|
| Finance expenses, net |
(1,600)
|
(2,085)
|
(1,635)
|
| Income before taxes on income |
2,439
|
(1,796)
|
8,429
|
| Distribution [Member] | Proprietary Products [Member] |
|
|
|
| Schedule of Reporting on Operating Segments [Line Items] |
|
|
|
| Revenues |
33,758
|
24,061
|
115,458
|
| Gross profit |
16,138
|
10,837
|
52,116
|
| Distribution [Member] | Distribution [Member] |
|
|
|
| Schedule of Reporting on Operating Segments [Line Items] |
|
|
|
| Revenues |
3,978
|
6,649
|
27,061
|
| Gross profit |
$ 613
|
$ 1,002
|
$ 3,374
|
| X |
- DefinitionThe amount of remuneration paid or payable to the entity's directors. Reference 1: http://www.xbrl.org/2009/role/commonPracticeRef
-Name IAS
-Number 1
-IssueDate 2023-01-01
-Paragraph 112
-Subparagraph c
-URI https://taxonomy.ifrs.org/xifrs-link?type=IAS&num=1&code=ifrs-tx-2023-en-r&anchor=para_112_c&doctype=Standard
-URIDate 2023-03-23
| Name: |
ifrs-full_DirectorsRemunerationExpense |
| Namespace Prefix: |
ifrs-full_ |
| Data Type: |
xbrli:monetaryItemType |
| Balance Type: |
debit |
| Period Type: |
duration |
|
| X |
- DefinitionLine items represent concepts included in a table. These concepts are used to disclose reportable information associated with members defined in one or many axes of the table.
| Name: |
ifrs-full_DisclosureOfOperatingSegmentsLineItems |
| Namespace Prefix: |
ifrs-full_ |
| Data Type: |
xbrli:stringItemType |
| Balance Type: |
na |
| Period Type: |
duration |
|
| X |
- DefinitionThe amount of revenue less cost of sales. [Refer: Cost of sales; Revenue] Reference 1: http://www.xbrl.org/2003/role/exampleRef
-Name IAS
-Number 1
-IssueDate 2023-01-01
-Paragraph 103
-URI https://taxonomy.ifrs.org/xifrs-link?type=IAS&num=1&code=ifrs-tx-2023-en-r&anchor=para_103&doctype=Standard
-URIDate 2023-03-23
| Name: |
ifrs-full_GrossProfit |
| Namespace Prefix: |
ifrs-full_ |
| Data Type: |
xbrli:monetaryItemType |
| Balance Type: |
credit |
| Period Type: |
duration |
|
| X |
- DefinitionThe amount of income from continuing operations attributable to owners of the parent. [Refer: Continuing operations [member]] Reference 1: http://www.xbrl.org/2003/role/disclosureRef
-Name IFRS
-Number 5
-IssueDate 2023-01-01
-Paragraph 33
-Subparagraph d
-URI https://taxonomy.ifrs.org/xifrs-link?type=IFRS&num=5&code=ifrs-tx-2023-en-r&anchor=para_33_d&doctype=Standard
-URIDate 2023-03-23
| Name: |
ifrs-full_IncomeFromContinuingOperationsAttributableToOwnersOfParent |
| Namespace Prefix: |
ifrs-full_ |
| Data Type: |
xbrli:monetaryItemType |
| Balance Type: |
credit |
| Period Type: |
duration |
|
| X |
- DefinitionThe amount of finance income or cost that the entity does not separately disclose in the same statement or note. [Refer: Finance income (cost)] Reference 1: http://www.xbrl.org/2009/role/commonPracticeRef
-Name IAS
-Number 1
-IssueDate 2023-01-01
-Paragraph 85
-URI https://taxonomy.ifrs.org/xifrs-link?type=IAS&num=1&code=ifrs-tx-2023-en-r&anchor=para_85&doctype=Standard
-URIDate 2023-03-23
| Name: |
ifrs-full_OtherFinanceIncomeCost |
| Namespace Prefix: |
ifrs-full_ |
| Data Type: |
xbrli:monetaryItemType |
| Balance Type: |
credit |
| Period Type: |
duration |
|
| X |
- DefinitionThe income arising in the course of an entity's ordinary activities. Income is increases in assets, or decreases in liabilities, that result in increases in equity, other than those relating to contributions from holders of equity claims. Reference 1: http://www.xbrl.org/2003/role/disclosureRef
-Name IFRS
-Number 8
-IssueDate 2023-01-01
-Paragraph 28
-Subparagraph a
-URI https://taxonomy.ifrs.org/xifrs-link?type=IFRS&num=8&code=ifrs-tx-2023-en-r&anchor=para_28_a&doctype=Standard
-URIDate 2023-03-23
Reference 2: http://www.xbrl.org/2003/role/disclosureRef
-Name IFRS
-Number 8
-IssueDate 2023-01-01
-Paragraph 23
-Subparagraph a
-URI https://taxonomy.ifrs.org/xifrs-link?type=IFRS&num=8&code=ifrs-tx-2023-en-r&anchor=para_23_a&doctype=Standard
-URIDate 2023-03-23
Reference 3: http://www.xbrl.org/2003/role/disclosureRef
-Name IFRS
-Number 8
-IssueDate 2023-01-01
-Paragraph 32
-URI https://taxonomy.ifrs.org/xifrs-link?type=IFRS&num=8&code=ifrs-tx-2023-en-r&anchor=para_32&doctype=Standard
-URIDate 2023-03-23
Reference 4: http://www.xbrl.org/2003/role/disclosureRef
-Name IFRS
-Number 5
-IssueDate 2023-01-01
-Paragraph 33
-Subparagraph b
-Clause i
-URI https://taxonomy.ifrs.org/xifrs-link?type=IFRS&num=5&code=ifrs-tx-2023-en-r&anchor=para_33_b_i&doctype=Standard
-URIDate 2023-03-23
Reference 5: http://www.xbrl.org/2003/role/disclosureRef
-Name IFRS
-Number 8
-IssueDate 2023-01-01
-Paragraph 33
-Subparagraph a
-URI https://taxonomy.ifrs.org/xifrs-link?type=IFRS&num=8&code=ifrs-tx-2023-en-r&anchor=para_33_a&doctype=Standard
-URIDate 2023-03-23
Reference 6: http://www.xbrl.org/2003/role/disclosureRef
-Name IFRS
-Number 8
-IssueDate 2023-01-01
-Paragraph 34
-URI https://taxonomy.ifrs.org/xifrs-link?type=IFRS&num=8&code=ifrs-tx-2023-en-r&anchor=para_34&doctype=Standard
-URIDate 2023-03-23
Reference 7: http://www.xbrl.org/2003/role/disclosureRef
-Name IFRS
-Number 12
-IssueDate 2023-01-01
-Paragraph B12
-Subparagraph b
-Clause v
-URI https://taxonomy.ifrs.org/xifrs-link?type=IFRS&num=12&code=ifrs-tx-2023-en-r&anchor=para_B12_b_v&doctype=Appendix&subtype=B
-URIDate 2023-03-23
Reference 8: http://www.xbrl.org/2003/role/exampleRef
-Name IFRS
-Number 12
-IssueDate 2023-01-01
-Paragraph B10
-Subparagraph b
-URI https://taxonomy.ifrs.org/xifrs-link?type=IFRS&num=12&code=ifrs-tx-2023-en-r&anchor=para_B10_b&doctype=Appendix&subtype=B
-URIDate 2023-03-23
Reference 9: http://www.xbrl.org/2003/role/disclosureRef
-Name IAS
-Number 1
-IssueDate 2023-01-01
-Paragraph 82
-Subparagraph a
-URI https://taxonomy.ifrs.org/xifrs-link?type=IAS&num=1&code=ifrs-tx-2023-en-r&anchor=para_82_a&doctype=Standard
-URIDate 2023-03-23
Reference 10: http://www.xbrl.org/2003/role/exampleRef
-Name IAS
-Number 1
-IssueDate 2023-01-01
-Paragraph 103
-URI https://taxonomy.ifrs.org/xifrs-link?type=IAS&num=1&code=ifrs-tx-2023-en-r&anchor=para_103&doctype=Standard
-URIDate 2023-03-23
Reference 11: http://www.xbrl.org/2003/role/exampleRef
-Name IAS
-Number 1
-IssueDate 2023-01-01
-Paragraph 102
-URI https://taxonomy.ifrs.org/xifrs-link?type=IAS&num=1&code=ifrs-tx-2023-en-r&anchor=para_102&doctype=Standard
-URIDate 2023-03-23
| Name: |
ifrs-full_Revenue |
| Namespace Prefix: |
ifrs-full_ |
| Data Type: |
xbrli:monetaryItemType |
| Balance Type: |
credit |
| Period Type: |
duration |
|
| X |
- Details
| Name: |
ifrs-full_SegmentsAxis=ifrs-full_ReportableSegmentsMember |
| Namespace Prefix: |
|
| Data Type: |
na |
| Balance Type: |
|
| Period Type: |
|
|
| X |
- Details
| Name: |
ifrs-full_ProductsAndServicesAxis=kmda_ProprietaryProductsMember |
| Namespace Prefix: |
|
| Data Type: |
na |
| Balance Type: |
|
| Period Type: |
|
|
| X |
- Details
| Name: |
ifrs-full_ProductsAndServicesAxis=kmda_DistributionMember |
| Namespace Prefix: |
|
| Data Type: |
na |
| Balance Type: |
|
| Period Type: |
|
|
v3.24.1.u1
Operating Segments (Details) - Schedule of Reporting on Operating Segments Geographic Region - USD ($)
|
3 Months Ended |
12 Months Ended |
Mar. 31, 2024 |
Mar. 31, 2023 |
Dec. 31, 2023 |
| Schedule of Reporting on Operating Segments Geographic Region [Line Items] |
|
|
|
| Total |
$ 37,736
|
$ 30,710
|
$ 142,519
|
| U.S.A and North America [Member] |
|
|
|
| Schedule of Reporting on Operating Segments Geographic Region [Line Items] |
|
|
|
| Total |
25,849
|
13,598
|
73,741
|
| Israel [Member] |
|
|
|
| Schedule of Reporting on Operating Segments Geographic Region [Line Items] |
|
|
|
| Total |
5,810
|
7,643
|
31,296
|
| Canada [Member] |
|
|
|
| Schedule of Reporting on Operating Segments Geographic Region [Line Items] |
|
|
|
| Total |
3,281
|
3,232
|
11,162
|
| Europe [Member] |
|
|
|
| Schedule of Reporting on Operating Segments Geographic Region [Line Items] |
|
|
|
| Total |
246
|
3,334
|
7,088
|
| Latin America [Member] |
|
|
|
| Schedule of Reporting on Operating Segments Geographic Region [Line Items] |
|
|
|
| Total |
1,116
|
1,316
|
12,928
|
| Asia [Member] |
|
|
|
| Schedule of Reporting on Operating Segments Geographic Region [Line Items] |
|
|
|
| Total |
1,434
|
1,550
|
6,147
|
| Others [Member] |
|
|
|
| Schedule of Reporting on Operating Segments Geographic Region [Line Items] |
|
|
|
| Total |
|
38
|
157
|
| Proprietary Products [Member] |
|
|
|
| Schedule of Reporting on Operating Segments Geographic Region [Line Items] |
|
|
|
| Proprietary Products |
33,758
|
24,061
|
115,459
|
| Proprietary Products [Member] | U.S.A and North America [Member] |
|
|
|
| Schedule of Reporting on Operating Segments Geographic Region [Line Items] |
|
|
|
| Proprietary Products |
25,849
|
13,598
|
73,741
|
| Proprietary Products [Member] | Israel [Member] |
|
|
|
| Schedule of Reporting on Operating Segments Geographic Region [Line Items] |
|
|
|
| Proprietary Products |
1,832
|
994
|
4,236
|
| Proprietary Products [Member] | Canada [Member] |
|
|
|
| Schedule of Reporting on Operating Segments Geographic Region [Line Items] |
|
|
|
| Proprietary Products |
3,281
|
3,232
|
11,162
|
| Proprietary Products [Member] | Europe [Member] |
|
|
|
| Schedule of Reporting on Operating Segments Geographic Region [Line Items] |
|
|
|
| Proprietary Products |
246
|
3,334
|
7,088
|
| Proprietary Products [Member] | Latin America [Member] |
|
|
|
| Schedule of Reporting on Operating Segments Geographic Region [Line Items] |
|
|
|
| Proprietary Products |
1,116
|
1,316
|
12,928
|
| Proprietary Products [Member] | Asia [Member] |
|
|
|
| Schedule of Reporting on Operating Segments Geographic Region [Line Items] |
|
|
|
| Proprietary Products |
1,434
|
1,550
|
6,147
|
| Proprietary Products [Member] | Others [Member] |
|
|
|
| Schedule of Reporting on Operating Segments Geographic Region [Line Items] |
|
|
|
| Proprietary Products |
|
38
|
157
|
| Distribution [Member] |
|
|
|
| Schedule of Reporting on Operating Segments Geographic Region [Line Items] |
|
|
|
| Distribution |
3,978
|
6,649
|
27,060
|
| Distribution [Member] | U.S.A and North America [Member] |
|
|
|
| Schedule of Reporting on Operating Segments Geographic Region [Line Items] |
|
|
|
| Distribution |
|
|
|
| Distribution [Member] | Israel [Member] |
|
|
|
| Schedule of Reporting on Operating Segments Geographic Region [Line Items] |
|
|
|
| Distribution |
3,978
|
6,649
|
27,060
|
| Distribution [Member] | Canada [Member] |
|
|
|
| Schedule of Reporting on Operating Segments Geographic Region [Line Items] |
|
|
|
| Distribution |
|
|
|
| Distribution [Member] | Europe [Member] |
|
|
|
| Schedule of Reporting on Operating Segments Geographic Region [Line Items] |
|
|
|
| Distribution |
|
|
|
| Distribution [Member] | Latin America [Member] |
|
|
|
| Schedule of Reporting on Operating Segments Geographic Region [Line Items] |
|
|
|
| Distribution |
|
|
|
| Distribution [Member] | Asia [Member] |
|
|
|
| Schedule of Reporting on Operating Segments Geographic Region [Line Items] |
|
|
|
| Distribution |
|
|
|
| Distribution [Member] | Others [Member] |
|
|
|
| Schedule of Reporting on Operating Segments Geographic Region [Line Items] |
|
|
|
| Distribution |
|
|
|
| X |
- DefinitionLine items represent concepts included in a table. These concepts are used to disclose reportable information associated with members defined in one or many axes of the table.
| Name: |
ifrs-full_DisclosureOfOperatingSegmentsLineItems |
| Namespace Prefix: |
ifrs-full_ |
| Data Type: |
xbrli:stringItemType |
| Balance Type: |
na |
| Period Type: |
duration |
|
| X |
- DefinitionThe amount of costs relating to the distribution of goods and services. Reference 1: http://www.xbrl.org/2003/role/exampleRef
-Name IAS
-Number 1
-IssueDate 2023-01-01
-Paragraph 103
-URI https://taxonomy.ifrs.org/xifrs-link?type=IAS&num=1&code=ifrs-tx-2023-en-r&anchor=para_103&doctype=Standard
-URIDate 2023-03-23
Reference 2: http://www.xbrl.org/2003/role/disclosureRef
-Name IAS
-Number 1
-IssueDate 2023-01-01
-Paragraph 99
-URI https://taxonomy.ifrs.org/xifrs-link?type=IAS&num=1&code=ifrs-tx-2023-en-r&anchor=para_99&doctype=Standard
-URIDate 2023-03-23
| Name: |
ifrs-full_DistributionCosts |
| Namespace Prefix: |
ifrs-full_ |
| Data Type: |
xbrli:monetaryItemType |
| Balance Type: |
debit |
| Period Type: |
duration |
|
| X |
- DefinitionThe amount of revenue arising from the sale of oil and gas products. [Refer: Revenue] Reference 1: http://www.xbrl.org/2009/role/commonPracticeRef
-Name IAS
-Number 1
-IssueDate 2023-01-01
-Paragraph 112
-Subparagraph c
-URI https://taxonomy.ifrs.org/xifrs-link?type=IAS&num=1&code=ifrs-tx-2023-en-r&anchor=para_112_c&doctype=Standard
-URIDate 2023-03-23
| Name: |
ifrs-full_RevenueFromSaleOfOilAndGasProducts |
| Namespace Prefix: |
ifrs-full_ |
| Data Type: |
xbrli:monetaryItemType |
| Balance Type: |
credit |
| Period Type: |
duration |
|
| X |
- DefinitionThe amount of operating segments total.
| Name: |
kmda_OperatingSegmentsTotal |
| Namespace Prefix: |
kmda_ |
| Data Type: |
xbrli:monetaryItemType |
| Balance Type: |
debit |
| Period Type: |
duration |
|
| X |
- Details
| Name: |
ifrs-full_GeographicalAreasAxis=kmda_USAAndNorthAmericaMember |
| Namespace Prefix: |
|
| Data Type: |
na |
| Balance Type: |
|
| Period Type: |
|
|
| X |
- Details
| Name: |
ifrs-full_GeographicalAreasAxis=country_IL |
| Namespace Prefix: |
|
| Data Type: |
na |
| Balance Type: |
|
| Period Type: |
|
|
| X |
- Details
| Name: |
ifrs-full_GeographicalAreasAxis=country_CA |
| Namespace Prefix: |
|
| Data Type: |
na |
| Balance Type: |
|
| Period Type: |
|
|
| X |
- Details
| Name: |
ifrs-full_GeographicalAreasAxis=kmda_EuropeOneMember |
| Namespace Prefix: |
|
| Data Type: |
na |
| Balance Type: |
|
| Period Type: |
|
|
| X |
- Details
| Name: |
ifrs-full_GeographicalAreasAxis=kmda_OtherForeignCountriesTwoMember |
| Namespace Prefix: |
|
| Data Type: |
na |
| Balance Type: |
|
| Period Type: |
|
|
| X |
- Details
| Name: |
ifrs-full_GeographicalAreasAxis=kmda_OtherForeignCountriesOneMember |
| Namespace Prefix: |
|
| Data Type: |
na |
| Balance Type: |
|
| Period Type: |
|
|
| X |
- Details
| Name: |
ifrs-full_GeographicalAreasAxis=kmda_OtherCountriesMember |
| Namespace Prefix: |
|
| Data Type: |
na |
| Balance Type: |
|
| Period Type: |
|
|
| X |
- Details
| Name: |
ifrs-full_SegmentsAxis=ifrs-full_ReportableSegmentsMember |
| Namespace Prefix: |
|
| Data Type: |
na |
| Balance Type: |
|
| Period Type: |
|
|
| X |
- Details
| Name: |
ifrs-full_SegmentsAxis=ifrs-full_AllOtherSegmentsMember |
| Namespace Prefix: |
|
| Data Type: |
na |
| Balance Type: |
|
| Period Type: |
|
|
v3.24.1.u1
| X |
- DefinitionThe amount, at acquisition date, of contingent consideration arrangements recognised as consideration transferred in a business combination. [Refer: Business combinations [member]] Reference 1: http://www.xbrl.org/2003/role/disclosureRef
-Name IFRS
-Number 3
-IssueDate 2023-01-01
-Paragraph B64
-Subparagraph g
-Clause i
-URI https://taxonomy.ifrs.org/xifrs-link?type=IFRS&num=3&code=ifrs-tx-2023-en-r&anchor=para_B64_g_i&doctype=Appendix&subtype=B
-URIDate 2023-03-23
| Name: |
ifrs-full_ContingentConsiderationRecognisedAsOfAcquisitionDate |
| Namespace Prefix: |
ifrs-full_ |
| Data Type: |
xbrli:monetaryItemType |
| Balance Type: |
credit |
| Period Type: |
instant |
|
| X |
- DefinitionLine items represent concepts included in a table. These concepts are used to disclose reportable information associated with members defined in one or many axes of the table.
| Name: |
ifrs-full_DisclosureOfFairValueMeasurementOfAssetsLineItems |
| Namespace Prefix: |
ifrs-full_ |
| Data Type: |
xbrli:stringItemType |
| Balance Type: |
na |
| Period Type: |
duration |
|
| X |
- DefinitionThe fair value of financial liabilities. [Refer: At fair value [member]; Financial liabilities] Reference 1: http://www.xbrl.org/2003/role/disclosureRef
-Name IFRS
-Number 7
-IssueDate 2023-01-01
-Paragraph 25
-URI https://taxonomy.ifrs.org/xifrs-link?type=IFRS&num=7&code=ifrs-tx-2023-en-r&anchor=para_25&doctype=Standard
-URIDate 2023-03-23
| Name: |
ifrs-full_FinancialLiabilitiesAtFairValue |
| Namespace Prefix: |
ifrs-full_ |
| Data Type: |
xbrli:monetaryItemType |
| Balance Type: |
credit |
| Period Type: |
instant |
|
| X |
- Details
| Name: |
ifrs-full_LevelsOfFairValueHierarchyAxis=ifrs-full_Level1OfFairValueHierarchyMember |
| Namespace Prefix: |
|
| Data Type: |
na |
| Balance Type: |
|
| Period Type: |
|
|
| X |
- Details
| Name: |
ifrs-full_LevelsOfFairValueHierarchyAxis=ifrs-full_Level2OfFairValueHierarchyMember |
| Namespace Prefix: |
|
| Data Type: |
na |
| Balance Type: |
|
| Period Type: |
|
|
| X |
- Details
| Name: |
ifrs-full_LevelsOfFairValueHierarchyAxis=ifrs-full_Level3OfFairValueHierarchyMember |
| Namespace Prefix: |
|
| Data Type: |
na |
| Balance Type: |
|
| Period Type: |
|
|
v3.24.1.u1
| X |
- References
+ Details
| Name: |
kmda_LeaseAgreementSquareFeet |
| Namespace Prefix: |
kmda_ |
| Data Type: |
dtr:areaItemType |
| Balance Type: |
na |
| Period Type: |
instant |
|
| X |
- References
+ Details
| Name: |
kmda_SubsequentEventsDetailsLineItems |
| Namespace Prefix: |
kmda_ |
| Data Type: |
xbrli:stringItemType |
| Balance Type: |
na |
| Period Type: |
duration |
|
| X |
- Details
| Name: |
ifrs-full_NonadjustingEventsAfterReportingPeriodAxis=kmda_SubsequentEventsMember |
| Namespace Prefix: |
|
| Data Type: |
na |
| Balance Type: |
|
| Period Type: |
|
|
Kamada (NASDAQ:KMDA)
Historical Stock Chart
From Apr 2024 to May 2024

Kamada (NASDAQ:KMDA)
Historical Stock Chart
From May 2023 to May 2024
