0001104038
false
0001104038
2023-08-10
2023-08-10
0001104038
VRME:CommonStockParValue0.001PerShareMember
2023-08-10
2023-08-10
0001104038
VRME:WarrantsToPurchaseCommonStockMember
2023-08-10
2023-08-10
iso4217:USD
xbrli:shares
iso4217:USD
xbrli:shares
UNITED STATES
SECURITIES AND EXCHANGE COMMISSION
WASHINGTON, D.C.
20549
FORM 8-K
CURRENT REPORT
PURSUANT TO SECTION 13 OR 15(d) OF THE SECURITIES EXCHANGE ACT OF 1934
| Date of Report (Date of earliest event reported): |
August 10, 2023 |
VerifyMe, Inc.
(Exact name of registrant as specified in its charter)
| Nevada |
001-39332 |
23-3023677 |
| (State or other jurisdiction of incorporation) |
(Commission File Number) |
(IRS Employer Identification No.) |
| |
|
|
| 801 International Parkway, Fifth Floor, Lake Mary, Florida |
32746 |
| (Address of principal executive offices) |
(Zip Code) |
| |
|
| Registrant’s telephone number, including area code: (585) 736-9400 |
|
_____________________
(Former name or former address, if changed since
last report)
Check the appropriate box below if the Form 8-K
filing is intended to simultaneously satisfy the filing obligation of the registrant under any of the following provisions:
| ¨ | Written communications pursuant to Rule 425 under the Securities Act (17 CFR 230.425) |
| ¨ | Soliciting material pursuant to Rule 14a-12 under the Exchange Act (17 CFR 240.14a-12) |
| ¨ | Pre-commencement communications pursuant to Rule 14d-2(b) under the Exchange Act (17 CFR 240.14d-2(b)) |
| ¨ | Pre-commencement communications pursuant to Rule 13e-4(c) under the Exchange Act (17 CFR 240.13e-4(c)) |
Securities registered pursuant to Section 12(b) of the Act:
| Title of each class |
|
Trading
Symbol(s) |
|
Name of each exchange on which registered |
| Common Stock, par value $0.001 per share |
|
VRME |
|
The Nasdaq Capital Market |
| Warrants to Purchase Common Stock |
|
VRMEW |
|
The Nasdaq Capital Market |
Indicate by check mark whether the registrant
is an emerging growth company as defined in Rule 405 of the Securities Act of 1933 (§230.405 of this chapter) or Rule 12b-2 of
the Securities Exchange Act of 1934 (§240.12b-2 of this chapter).
| |
Emerging growth company ¨ |
If an emerging growth company, indicate by check
mark if the registrant has elected not to use the extended transition period for complying with any new or revised financial accounting
standards provided pursuant to Section 13(a) of the Exchange Act. ¨
| Item 2.02 | Results of Operations and Financial Condition. |
On August 10, 2023, VerifyMe, Inc. (the “Company”)
issued a press release announcing its financial results for its three and six months ended June 30, 2023. The press release is attached
to this Form 8-K as Exhibit 99.1
The information furnished pursuant to this Item
2.02, including Exhibit 99.1, shall not be deemed “filed” for purposes of Section 18 of the Securities Exchange Act of 1934,
as amended (the “Exchange Act”), or otherwise subject to the liabilities under such section and shall not be deemed to be
incorporated by reference into any filing of the Company under the Securities Act of 1933, as amended, or the Exchange Act.
| Item 7.01 | Regulation FD Disclosure. |
On
August 10, 2023, the Company posted slides to the Investor section of its website that will accompany
the Company’s earnings conference call and webcast at 11:00 a.m. Eastern Time on August 10, 2023. The slides are attached to this
Form 8-K as Exhibit 99.2.
The
information furnished pursuant to this Item 7.01, including Exhibit 99.2, shall not be deemed “filed” for purposes of Section
18 of the Exchange Act, or otherwise subject to the liabilities under such section and shall not be deemed to be incorporated by reference
into any filing of the Company under the Securities Act of 1933, as amended, or the Exchange Act.
| Item 9.01 | Financial Statements and Exhibits. |
(d) Exhibits.
SIGNATURE
Pursuant to the requirements of the Securities Exchange Act of 1934,
the registrant has duly caused this report to be signed on its behalf by the undersigned hereunto duly authorized.
| |
VerifyMe, Inc. |
| |
|
|
| |
|
|
| Date: August 10, 2023 |
By: |
/s/ Adam Stedham |
| |
|
Adam Stedham |
| |
|
Chief Executive Officer and |
| |
|
President |
Exhibit 99.1
VerifyMe
Reports Second Quarter 2023 Financial Results
| · | Quarterly
revenue of $5.3 million in Q2 2023, compared to $4.5 million in Q2 2022 |
| | | |
| · | Net
loss of $0.9 million in Q2 2023, compared to a net loss of $12.6 million in Q2 2022 (inclusive
of write off of $11.2 million related to the SPAC) |
| | | |
| · | Adjusted
EBITDA(1) of ($0.4) million in Q2 2023, primarily due to acquisition, integration
and operating costs of ($0.2) million, compared to ($0.3) million in Q2 2022 |
| | | |
| · | Cash
of $2.7 million as of June 30, 2023 |
| | | |
Lake Mary, FL – August 10, 2023 –
PRNewswire — VerifyMe, Inc. (NASDAQ: VRME) together with its subsidiaries, Trust Codes
Global Limited (“Trust Codes Global”) and PeriShip Global LLC (“PeriShip Global”), (together “VerifyMe,”
“we,” “our,” or the “Company”) provides brand owners time and temperature sensitive logistics, supply
chain traceability and monitoring, authentication, and data-rich brand enhancement services, announced today the Company’s financial
results for its second quarter ended June 30, 2023 (“Q2 2023”).

Key Financial Highlights for Q2 2023:
| · | Quarterly
consolidated revenue of $5.3 million for the three months ended June 30, 2023, an increase
of 19% compared to $4.5 million for the three months ended June 30, 2022, primarily attributable
to the acquisition of the PeriShip Global business in April 2022 |
| · | Gross
profit of $1.8 million or 34% for the three months ended June 30, 2023, compared to $1.7
million or 37% for the three months ended June 30, 2022 |
| · | Net
loss of $0.9 million or ($0.09) per diluted share for the three months ended June 30, 2023,
compared to a net loss of $12.6 million or ($1.50) per diluted share for the three months
ended June 30, 2022, which included approximately $11.2 million non-cash impairment related
to the SPAC liquidation |
| · | Adjusted
net loss per diluted share(1) of ($0.11), for the three months ended June 30,
2023, and ($0.10) for the three months ended June 30, 2022, after adjusting for severance
expense, unrealized and realized loss on equity investment, change in fair value of contingent
consideration and acquisition-related costs |
| · | Adjusted
EBITDA(1) of ($0.4) million in Q2 2023, primarily due to acquisition, integration
and operating costs of ($0.2) million, compared to ($0.3) million in Q2, 2022 |
| · | Cash
of $2.7 million as of June 30, 2023 |
__________
(1) Adjusted EBITDA and Adjusted net loss per
diluted share are non-GAAP financial measures. See "Use of Non-GAAP Financial Measures" below for information about these non-GAAP
measures. A reconciliation to the most directly comparable GAAP measure, net income (loss), and net loss per diluted share, respectively,
are included as a schedule to this release.
Adam Stedham,
VerifyMe’s CEO and President stated, “Since joining the Company in June of this year, we have
defined two operating segment strategies aligned to our traceability services, and overhauled the
executive
team. Q2 2023 revenue is 19% above the same quarter 2022 revenue. The acquisition and
integration
of Trust Codes impacted Q2 profitability, but the vertical integration of their technology is key to execution of our traceability strategy.
I expect the combination of the traceability strategy, strategic leadership reorganization, and cost rationalization will enable growth
of the company beginning in the second half of 2023 and accelerating in 2024.”
Recent Business Highlights
| · | Adam Stedham was appointed CEO effective June 19, 2023 |
| · | Outlined our two business segments (Authentication & Precision
Logistics) |
| · | Strategic reorganization aimed at accelerating growth through leveraging
our technology strengths, expanding marketing capabilities and optimizing overhead expenses |
| · | Reorganized VerifyMe sales and marketing team |
Financial Results for the Three Months Ended
June 30, 2023:
Revenue for the three months ended June 30, 2023,
was $5.3 million, a 19% increase as compared to $4.5 million for the three months ended June 30, 2022. The
increase in revenue was primarily attributable to the acquisition of the PeriShip Global business in April 2022, which accounted for 98%
of the revenue for the quarter.
Gross profit for
the three months ended June 30, 2023, was $1.8 million, compared to $1.7 million for the three months ended June 30, 2022. The resulting
gross margin percentage was 34% for the three months ended June 30, 2023, compared to 37% for the three months ended June 31, 2022, principally
due to the acquisition of the PeriShip Global business in April 2022. The mix between our proactive services and premium services is attributed
to our lower gross profit margin for the quarter.
Operating loss for the three months ended June
30, 2023, was $1.0 million, a decreased loss of $0.3 million compared to $1.3 million for the three months ended June 30, 2022. The decreased
loss is primarily related to the increased gross profit attributable to the acquisition of PeriShip Global, acquisition costs for PeriShip
Global in 2022 that did not recur in 2023, a reduction in employees in the Authentication segment partially offset by the integration
and operating costs of Trust Codes Global and additional operating expenses in the Precision Logistics segment in 2023 for the
full quarter.
Our net loss for the three months ended June 30,
2023, was $0.9 million, compared to $12.6 million for the three months ended June 30, 2022, which included $11.2 million non-cash
impairment related to the SPAC liquidation. The resulting loss for the three months ended June 30, 2023, was ($0.09) per diluted
share, compared to a loss per diluted share of ($1.50) for the three months ended June 30, 2022. After accounting for special items, which
are set forth in the Non-GAAP Reconciliation – Adjusted EPS below, Adjusted EPS was ($0.11) for the three months ended June 30,
2023, and ($0.10) for the three months ended June 30. 2022.
Adjusted EBITDA loss for the three months ended
June 30, 2023, was ($0.4) million, a decrease of $0.1 million, compared to ($0.3) million for the three months ended June 30, 2022. Adjusted
EBITDA is a non-GAAP financial measure. Please see “Use of Non-GAAP Financial Measures” for a discussion of this non-GAAP
measure. A reconciliation to the most directly comparable GAAP measure, net loss, is included as a schedule to this release.
At June 30, 2023, VerifyMe had a $2.7 million
cash balance and $1.4 million in working capital.
At June 30, 2023, VerifyMe had 10,190,433 shares
issued and 9,842,765 shares outstanding.
Earnings Call
The
Company has scheduled an earnings conference call and webcast for 11:00 a.m. ET on Thursday August 10, 2023. Prepared remarks regarding
the company's financial and operational results will be followed by a question and answer period with VerifyMe's executive team. The
conference call may be accessed via webcast at: https://event.choruscall.com/mediaframe/webcast.html?webcastid=s45ujf2v or
by calling +1 (844) 282-4569 within the US, or +1 (412) 317-5614 internationally, and requesting the “VerifyMe Call.” The
presentation slides broadcast via the webcast will also be available on the Investors section of the VerifyMe website the morning of the
call. Participants must be logged in via telephone to submit a question to management during the call. Participants may optionally pre-register
for the conference call and webcast at: https://dpregister.com/sreg/10181116/f9f8ae8850.
The
webcast and presentation will be archived on the Investors section of VerifyMe’s website and will remain available for 90 days.
About VerifyMe, Inc.
VerifyMe, Inc. (NASDAQ: VRME),
together with its subsidiaries, PeriShip Global and Trust Codes Global, is a software driven logistics provider of high-touch, end-to-end
logistics management. We provide logistics management from a sophisticated IT platform with proprietary databases, package and flight-tracking
software, weather, and flight status monitoring systems, as well as dynamic dashboards with real-time visibility into shipment transit
and last-mile events. In addition, VerifyMe and Trust Codes Global provide brand protection and brand enhancement solutions allowing brand
owners to gather business intelligence. To learn more, visit https://www.verifyme.com.
Cautionary
Note Regarding Forward-Looking Statements
This release contains forward-looking statements
regarding revenue opportunities, recurring revenue, commercialization efforts, our sales pipeline and opportunities, and the acquisition
of the business and assets of PeriShip, LLC and Trust Codes Global Limited. The words "believe," "may," "will,"
“beginning,” "expect" and similar expressions, as they relate to us, are intended to identify forward-looking statements.
We have based these forward-looking statements largely on our current expectations and projections about future events and financial trends
that we believe may affect our financial condition, results of operations, business strategy and financial needs. Important factors that
could cause actual results to differ from those in the forward-looking statements include our engagement in future acquisitions or strategic
partnerships that increase our capital requirements or cause us to incur debt or assume contingent liabilities, the successful integration
of our acquisitions (including the assets of PeriShip Global and Trust Codes Global), our reliance on one key strategic partner for shipping
services in our Precision Logistics segment, competition including by our key strategic partner, seasonal trends in our business, severe
climate conditions, the highly competitive nature of the industry in which we operate, our brand image and corporate reputation, impairments
related to our goodwill and other intangible assets, economic and other factors such as recessions, downturns in the economy, inflation,
global uncertainty and instability, the effects of pandemics, changes in United States social, political, and regulatory conditions and/or
a disruption of financial markets, reduced freight volumes due to economic conditions, reduced discretionary spending in a recessionary
environment, global supply-chain delays or shortages, fluctuations in labor costs, raw materials, and changes in the availability of key
suppliers, our history of losses, our ability to use our net operating losses to offset future taxable income, the confusion of our name
brand with other brands, the ability of our technology to work as anticipated and to successfully provide analytics logistics management,
our ability to manage our growth effectively, our ability to successfully develop and expand our sales and marketing capabilities, risks
related to doing business outside of the U.S., intellectual property litigation, our ability to successfully develop, implement, maintain,
upgrade, enhance, and protect our information technology systems, our reliance on third-party information technology service providers,
our ability to respond to evolving laws related to information technology such as privacy laws, risks related to deriving revenue from
some clients in the cannabis industry, our ability to retain key management personnel, our ability to work with partners in selling our
technologies to businesses, production difficulties, our inability to enter into contracts and arrangements with future partners, our
ability to acquire new customers, issues which may affect the reluctance of large companies to change their purchasing of products, acceptance
of our technologies and the efficiency of our authenticators in the field, our ability to comply with the continued listing standards
of the Nasdaq Capital Market, and our ability to timely pay amounts due and comply with the covenants under our debt facilities. These
risk factors and uncertainties include those more fully described in VerifyMe’s Annual Report and Quarterly Reports filed with the
Securities and Exchange Commission, including under the heading entitled “Risk Factors.” Should one or more of these risks
or uncertainties materialize, or should any of our underlying assumptions prove incorrect, actual results may vary materially from those
currently anticipated. Any forward-looking statement made by us herein speaks only as of the date on which it is made. Factors or events
that could cause our actual results to differ may emerge from time to time, and it is not possible for us to predict all of them. We undertake
no obligation to publicly update any forward-looking statement, whether as a result of new information, future developments or otherwise,
except as may be required by law.
Use of Non-GAAP Financial Measures
This press release includes both financial measures
in accordance with U.S. generally accepted accounting principles (“GAAP”), as well as non-GAAP financial measures. Generally,
a non-GAAP financial measure is a numerical measure of a company’s performance, financial position or cash flows that either excludes
or includes amounts that are not normally included or excluded in the most directly comparable measure calculated and presented in accordance
with GAAP. Non-GAAP financial measures should be viewed as supplemental to and should not be considered as alternatives to any other GAAP
financial measures. They may not be indicative of the historical operating results of VerifyMe nor are they intended to be predictive
of potential future results. Investors should not consider non-GAAP financial measures in isolation or as substitutes for performance
measures calculated in accordance with GAAP.
VerifyMe’s management uses and relies on
EBITDA and Adjusted EBITDA, which are non-GAAP financial measures. The Company believes that both management and shareholders benefit
from referring to EBITDA and Adjusted EBITDA in planning, forecasting and analyzing future periods. Additionally, the Company believes
Adjusted EBIDTA is useful to investors to evaluate its results because it excludes certain items that are not directly related to the
Company’s core operating performance. In particular, with regard to our comparison of Adjusted EBITDA for the three and six months
ended June 30, 2023, to the three and six months ended June 30, 2022, we believe that certain charges make a three and six month to three
and six month comparison of net loss less useful to investors than a comparison of Adjusted EBITDA in understanding the results of operations.
The Company’s management uses these non-GAAP financial measures in evaluating its financial and operational decision making and
as a means to evaluate period-to-period comparison. The Company’s management recognizes that EBITDA and Adjusted EBITDA, as non-GAAP
financial measures, have inherent limitations because of the described excluded items.
The Company defines EBITDA as net income (loss)
before interest expense, income tax expense (benefit), and depreciation and amortization. Adjusted EBITDA represents EBITDA plus non-cash
stock compensation expense, severance expense, unrealized (loss) gain on equity investment, realized loss on equity investment, impairment
of intangibles, change in fair value of contingent consideration and one-time professional expenses for acquisitions. VerifyMe believes
EBITDA and Adjusted EBITDA are important measures of VerifyMe’s operating performance because they allow management, investors and
analysts to evaluate and assess VerifyMe’s core operating results from period-to-period after removing the impact of items of a
non-operational nature that affect comparability.
Adjusted Net Loss per Diluted Share (“Adjusted
EPS”), which is a non-GAAP financial measure, is defined as loss per diluted share excluding severance expense, unrealized gain
(loss) on equity investment, realized loss on equity investment, change in fair value of contingent consideration and one-time professional
expenses for acquisitions. Management uses Adjusted EPS to assess total Company operating performance on a consistent basis. We believe
that this non-GAAP financial measure, when considered together with our GAAP financial results, provides management and investors with
an additional understanding of our business operating results, including underlying trends.
A reconciliation of EBITDA, Adjusted EBITDA and
Adjusted EPS to the most comparable financial measure, net loss, calculated in accordance with GAAP is included in a schedule to this
press release. The Company believes that providing the non-GAAP financial measures, together with the reconciliation to GAAP, helps investors
make comparisons between VerifyMe and other companies. In making any comparisons to other companies, investors need to be aware that companies
use different non-GAAP measures to evaluate their financial performance. Investors should pay close attention to the specific definition
being used and to the reconciliation between such measure and the corresponding GAAP measure provided by each company under applicable
SEC rules as the presentation here may not be comparable to other similarly titled measures of other companies.
For Other Information Contact:
Company: VerifyMe, Inc.
Email: IR@verifyme.com
VerifyMe, Inc.
Consolidated Balance Sheets
(In thousands, except share data)
| | |
As of | |
| | |
| |
| | |
| June
30, 2023 | | |
| December
31, 2022 | |
| | |
| (Unaudited) | | |
| | |
| ASSETS | |
| | | |
| | |
| CURRENT ASSETS | |
| | | |
| | |
| Cash and cash equivalents including restricted
cash | |
$ | 2,697 | | |
$ | 3,411 | |
| Accounts receivable, net of allowance for credit loss
reserve, $33 and $37 as of June 30, 2023 and December 31, 2022, respectively | |
| 1,286 | | |
| 4,448 | |
| Unbilled revenue | |
| 734 | | |
| 1,185 | |
| Prepaid expenses and other current assets | |
| 308 | | |
| 333 | |
| Inventory | |
| 47 | | |
| 81 | |
| TOTAL CURRENT ASSETS | |
| 5,072 | | |
| 9,458 | |
| | |
| | | |
| | |
| PROPERTY AND EQUIPMENT, NET | |
$ | 288 | | |
| 292 | |
| | |
| | | |
| | |
| RIGHT OF USE ASSET | |
| 554 | | |
| 469 | |
| | |
| | | |
| | |
| INTANGIBLE ASSETS, NET | |
| 6,990 | | |
| 6,412 | |
| | |
| | | |
| | |
| GOODWILL | |
| 5,338 | | |
| 3,988 | |
| | |
| | | |
| | |
| DEFERRED IMPLEMENTATION COSTS | |
| 182 | | |
| 133 | |
| | |
| | | |
| | |
| TOTAL ASSETS | |
$ | 18,424 | | |
$ | 20,752 | |
| | |
| | | |
| | |
| LIABILITIES AND STOCKHOLDERS' EQUITY | |
| | | |
| | |
| | |
| | | |
| | |
| CURRENT LIABILITIES | |
| | | |
| | |
| Current portion of debt | |
$ | 1,300 | | |
$ | 500 | |
| Accounts payable | |
| 1,400 | | |
| 3,912 | |
| Other accrued expense | |
| 723 | | |
| 902 | |
| Lease liability- current | |
| 174 | | |
| 115 | |
| Contingent liability-short term | |
| 122 | | |
| - | |
| TOTAL CURRENT LIABILITIES | |
| 3,719 | | |
| 5,429 | |
| | |
| | | |
| | |
| LONG-TERM LIABILITIES | |
| | | |
| | |
| Contingent liability-long term | |
$ | 831 | | |
$ | - | |
| Long-term lease liability | |
| 389 | | |
| 359 | |
| Long-term derivative liability | |
| 2 | | |
| 3 | |
| Term note | |
| 1,125 | | |
| 1,375 | |
| | |
| | | |
| | |
| TOTAL LIABILITIES | |
$ | 6,066 | | |
$ | 7,166 | |
| | |
| | | |
| | |
| STOCKHOLDERS' EQUITY | |
| | | |
| | |
| | |
| | | |
| | |
| Series A Convertible Preferred Stock, $.001 par value,
37,564,767 shares authorized; 0 shares issued and outstanding as of June 30, 2023 and December 31, 2022, respectively | |
| - | | |
| - | |
| | |
| | | |
| | |
| Series B Convertible Preferred Stock, $.001 par value;
85 shares authorized; 0.85 shares issued and outstanding as of June 30, 2023 and December 31, 2022, respectively | |
| - | | |
| - | |
| | |
| | | |
| | |
| Common stock, $0.001 par value; 675,000,000 authorized; 10,190,433 and
9,341,002 issued, 9,842,765 and 8,951,035 shares outstanding as of June 30, 2023 and December 31, 2022, respectively | |
| 10 | | |
| 10 | |
| | |
| | | |
| | |
| Additional paid in capital | |
| 94,111 | | |
| 92,987 | |
| | |
| | | |
| | |
| Treasury stock as cost; 347,668 and 389,967 shares at
June 30, 2023 and December 31, 2022, respectively | |
| (792 | ) | |
| (949 | ) |
| | |
| | | |
| | |
| Accumulated deficit | |
| (80,921 | ) | |
| (78,459 | ) |
| | |
| | | |
| | |
| Accumulated other comprehensive loss | |
| (50 | ) | |
| (3 | ) |
| | |
| | | |
| | |
| STOCKHOLDERS' EQUITY | |
| 12,358 | | |
| 13,586 | |
| | |
| | | |
| | |
| TOTAL LIABILITIES AND STOCKHOLDERS' EQUITY | |
$ | 18,424 | | |
$ | 20,752 | |
Consolidated Statements of Operations
(Unaudited)
(In thousands, except share data)
| | |
Three Months Ended | | |
Six Months Ended | |
| | |
June 30, 2023 | | |
June 30, 2022 | | |
June 30, 2023 | | |
June 30, 2022 | |
| | |
| | |
| | |
| | |
| |
| NET REVENUE | |
$ | 5,335 | | |
$ | 4,497 | | |
$ | 10,996 | | |
$ | 4,658 | |
| | |
| | | |
| | | |
| | | |
| | |
| COST OF REVENUE | |
| 3,515 | | |
| 2,812 | | |
| 7,422 | | |
| 2,850 | |
| | |
| | | |
| | | |
| | | |
| | |
| GROSS PROFIT | |
| 1,820 | | |
| 1,685 | | |
| 3,574 | | |
| 1,808 | |
| | |
| | | |
| | | |
| | | |
| | |
| OPERATING EXPENSES | |
| | | |
| | | |
| | | |
| | |
| General and administrative (a) | |
| 2,342 | | |
| 2,535 | | |
| 5,098 | | |
| 4,000 | |
| Research and development | |
| 10 | | |
| 25 | | |
| 18 | | |
| 34 | |
| Sales and marketing (a) | |
| 506 | | |
| 447 | | |
| 1,000 | | |
| 746 | |
| Total Operating expenses | |
| 2,858 | | |
| 3,007 | | |
| 6,116 | | |
| 4,780 | |
| | |
| | | |
| | | |
| | | |
| | |
| LOSS BEFORE OTHER (EXPENSE) | |
| (1,038 | ) | |
| (1,322 | ) | |
| (2,542 | ) | |
| (2,972 | ) |
| | |
| | | |
| | | |
| | | |
| | |
| OTHER (EXPENSE) INCOME | |
| | | |
| | | |
| | | |
| | |
| Interest expenses, net | |
| (46 | ) | |
| (23 | ) | |
| (88 | ) | |
| (22 | ) |
| Unrealized gain (loss) on equity investment | |
| 30 | | |
| (246 | ) | |
| (2 | ) | |
| 6 | |
| Realized loss on equity investment | |
| - | | |
| (10,964 | ) | |
| - | | |
| (10,964 | ) |
| Change in fair value of contingent consideration | |
| 172 | | |
| - | | |
| 172 | | |
| | |
| Other (expense) income, net | |
| - | | |
| - | | |
| (2 | ) | |
| 3 | |
| TOTAL OTHER INCOME (EXPENSE), NET | |
| 156 | | |
| (11,233 | ) | |
| 80 | | |
| (10,977 | ) |
| | |
| | | |
| | | |
| | | |
| | |
| NET LOSS | |
| | | |
| | | |
| | | |
| | |
| | |
$ | (882 | ) | |
$ | (12,555 | ) | |
$ | (2,462 | ) | |
$ | (13,949 | ) |
| | |
| | | |
| | | |
| | | |
| | |
| LOSS PER SHARE | |
| | | |
| | | |
| | | |
| | |
| BASIC | |
| (0.09 | ) | |
| (1.50 | ) | |
| (0.26 | ) | |
| (1.78 | ) |
| DILUTED | |
| (0.09 | ) | |
| (1.50 | ) | |
| (0.26 | ) | |
| (1.78 | ) |
| | |
| | | |
| | | |
| | | |
| | |
| WEIGHTED AVERAGE COMMON SHARE OUTSTANDING | |
| | | |
| | | |
| | | |
| | |
| BASIC | |
| 9,765,452 | | |
| 8,387,662 | | |
| 9,614,183 | | |
| 7,851,463 | |
| DILUTED | |
| 9,765,452 | | |
| 8,387,662 | | |
| 9,614,183 | | |
| 7,851,463 | |
| (a) | Includes share-based compensation of $315 thousand and $601 thousand for the three and six months ended June 30, 2023, respectively,
and $312 thousand and $742 thousand for the three and six months ended June 30, 2022, respectively. |
VerifyMe, Inc.
Consolidated EBITDA and Adjusted EBITDA Reconciliation
Table (Unaudited)
(In thousands)
| | |
Three Months Ended
June 30, | | |
Six Months Ended
June 30, | |
| | |
| | |
| | |
| | |
| |
| | |
| 2023 | | |
| 2022 | | |
| 2023 | | |
| 2022 | |
| | |
| | | |
| | | |
| | | |
| | |
| Net Loss (GAAP) | |
$ | (882 | ) | |
$ | (12,555 | ) | |
$ | (2,462 | ) | |
$ | (13,949 | ) |
| Interest expense (income), net | |
| 46 | | |
| 23 | | |
| 88 | | |
| 22 | |
| Income tax expense (benefit) | |
| - | | |
| - | | |
| - | | |
| - | |
| Amortization and depreciation | |
| 258 | | |
| 208 | | |
| 540 | | |
| 243 | |
| | |
| | | |
| | | |
| | | |
| | |
| Total EBITDA (Non-GAAP) | |
| (578 | ) | |
| (12,324 | ) | |
| (1,834 | ) | |
| (13,684 | ) |
| | |
| | | |
| | | |
| | | |
| | |
| Adjustments: | |
| | | |
| | | |
| | | |
| | |
| | |
| | | |
| | | |
| | | |
| | |
| Stock based compensation | |
| 19 | | |
| 5 | | |
| 41 | | |
| 92 | |
| Fair value of restricted stock and restricted stock units issued in exchange for services | |
| 296 | | |
| 308 | | |
| 448 | | |
| 650 | |
| Severance | |
| 29 | | |
| - | | |
| 332 | | |
| - | |
| Unrealized (gain) loss on equity investment | |
| (30 | ) | |
| 246 | | |
| 2 | | |
| (6 | ) |
| Realized loss on equity investment | |
| - | | |
| 10,964 | | |
| - | | |
| 10,964 | |
| Change in fair value of contingent consideration | |
| (172 | ) | |
| - | | |
| (172 | ) | |
| - | |
| Impairment of intangibles | |
| 34 | | |
| - | | |
| 34 | | |
| - | |
| One-time professional expenses for acquisitions | |
| - | | |
| 498 | | |
| 278 | | |
| 623 | |
| | |
| | | |
| | | |
| | | |
| | |
| Total Adjusted EBITDA (Non-GAAP) | |
$ | (402 | ) | |
$ | (303 | ) | |
$ | (871 | ) | |
$ | (1,361 | ) |
Consolidated EPS and Adjusted EPS Reconciliation
Table
(Unaudited)
| | |
Three Months Ended
June 30, | | |
Six Months Ended
June 30, | |
| | |
| | |
| | |
| | |
| |
| | |
| 2023 | | |
| 2022 | | |
| 2023 | | |
| 2022 | |
| | |
| | | |
| | | |
| | | |
| | |
| Loss per share (GAAP) | |
$ | (0.09 | ) | |
$ | (1.50 | ) | |
$ | (0.26 | ) | |
$ | (1.78 | ) |
| Severance expense, per share | |
| - | | |
| - | | |
| 0.03 | | |
| - | |
| Unrealized (gain) loss on equity investment, per share | |
| - | | |
| 0.03 | | |
| - | | |
| - | |
| Realized loss on equity investment, per share | |
| - | | |
| 1.31 | | |
| - | | |
| 1.40 | |
| Change in fair value of contingent consideration, per share | |
| (0.02 | ) | |
| - | | |
| (0.02 | ) | |
| - | |
| One-time professional expenses for acquisitions, per share | |
| - | | |
| 0.06 | | |
| 0.03 | | |
| 0.08 | |
| | |
| | | |
| | | |
| | | |
| | |
| | |
| | | |
| | | |
| | | |
| | |
| Total Adjusted EPS (Non-GAAP) | |
$ | (0.11 | ) | |
$ | (0.10 | ) | |
$ | (0.22 | ) | |
$ | (0.30 | ) |
8
Exhibit 99.2

Protect your brand. Grow your business. Second Quarter 2023 Investor Conference Call August 10, 2023 www.VerifyMe.com NASDAQ:VRME 1
Agenda NASDAQ:VRME 01 Welcome & Introductions Operations and Strategic Update Financial Review Q&A Closing Remarks 02 03 www.VerifyMe.com 04 05 2
Forward Looking Statements In addition to historical information, this presentation contains statements relating to the acquisitions of PeriShip , LLC and Trust Codes Limited, by VerifyMe, Inc . and integration of the companies, anticipated synergies of the acquisitions, revenue opportunities, anticipated revenue, profitability of the combined company, future business, financial performance, future catalysts and future events or developments, strategy, projected costs, prospects, plans, objectives of management and future operations, future revenue, and expected market growth of VerifyMe, Inc . together with its wholly owned subsidiaries PeriShip Global LLC and Trust Codes Global Limited, (“VerifyMe,” the “ Company,” “we,” or “us”) that may constitute “forward - looking statements” within the meaning of the “safe harbor” provisions of the Private Securities Litigation Reform Act of 1995 . The words "believe," "may," "will," “beginning,” "expect" and similar expressions, as they relate to us, are intended to identify forward - looking statements . We have based these forward - looking statements largely on our current expectations and projections about future events and financial trends that we believe may affect our financial condition, results of operations, business strategy and financial needs . Important factors that could cause actual results to differ from those in the forward - looking statements include our engagement in future acquisitions or strategic partnerships that increase our capital requirements or cause us to incur debt or assume contingent liabilities, the successful integration of our acquisitions (including the assets of PeriShip Global and Trust Codes Global), our reliance on one key strategic partner for shipping services in our Precision Logistics segment, competition including by our key strategic partner, seasonal trends in our business, severe climate conditions, the highly competitive nature of the industry in which we operate, our brand image and corporate reputation, impairments related to our goodwill and other intangible assets, economic and other factors such as recessions, downturns in the economy, inflation, global uncertainty and instability, the effects of pandemics, changes in United States social, political, and regulatory conditions and/or a disruption of financial markets, reduced freight volumes due to economic conditions, reduced discretionary spending in a recessionary environment, global supply - chain delays or shortages, fluctuations in labor costs, raw materials, and changes in the availability of key suppliers, our history of losses, our ability to use our net operating losses to offset future taxable income, the confusion of our name brand with other brands, the ability of our technology to work as anticipated and to successfully provide analytics logistics management, our ability to manage our growth effectively, our ability to successfully develop and expand our sales and marketing capabilities, risks related to doing business outside of the U . S . , intellectual property litigation, our ability to successfully develop, implement, maintain, upgrade, enhance, and protect our information technology systems, our reliance on third - party information technology service providers, our ability to respond to evolving laws related to information technology such as privacy laws, risks related to deriving revenue from some clients in the cannabis industry, our ability to retain key management personnel, our ability to work with partners in selling our technologies to businesses, production difficulties, our inability to enter into contracts and arrangements with future partners, our ability to acquire new customers, issues which may affect the reluctance of large companies to change their purchasing of products, acceptance of our technologies and the efficiency of our authenticators in the field, our ability to comply with the continued listing standards of the Nasdaq Capital Market, and our ability to timely pay amounts due and comply with the covenants under our debt facilities . More detailed information about these factors may be found in the Company’s filings with the Securities and Exchange Commission, including its Annual Report on Form 10 - K for the year ended December 31 , 2022 , and subsequent Quarterly Reports on Form 10 - Q . The statements made herein speak only as of the date of this presentation . The Company’s actual results, performance or achievements could differ materially from the results expressed in, or implied by, these forward - looking statements . The Company undertakes no obligation to update or revise its forward - looking statements to reflect events or circumstances after the date of this presentation, except as required by law . Market data and industry information used herein are based on our management's knowledge of the industry and the good faith estimates of management . We also relied, to the extent available, upon managements review of independent industry surveys, forecasts and publications and other publicly available information prepared by a number of third - party sources . All of the market data and industry information used herein involves a number of assumptions and limitations which we believe to be reasonable, and you are cautioned not to give undue weight to such estimates . Although we believe that these sources are reliable, we cannot guarantee the accuracy or completeness of this information, and we have not independently verified this information . Projections, assumptions and estimates of our future performance and the future performance of the industry in which we operate are subject to a high degree of uncertainty and risk due to a variety of factors, including those described, above . These and other factors could cause results to differ materially from those expressed in our estimates and beliefs and in the estimates prepared by independent parties . Non - GAAP Financial Measures This presentation includes non - GAAP financial information . This non - GAAP information is in addition to, not a substitute for or superior to, measures of financial performance or liquidity determined in accordance with GAAP . The Securities and Exchange Commission‘s Regulation G applies to any public disclosure or release of material information that includes a non - GAAP financial measure and requires : ( i ) the presentation of the most directly comparable financial measure calculated and presented in accordance with GAAP and (ii) a reconciliation of the differences between the non - GAAP financial measure presented and the most directly comparable financial measure calculated and presented in accordance with GAAP . The required presentations and reconciliations are contained in this presentation and can also be found at our website at www . verifyme . com 3 www.VerifyMe.com NASDAQ:VRME

Welcome Adam Stedham Chief Executive Officer and President www.VerifyMe.com NASDAQ:VRME – Remarks – Future Outlook 4
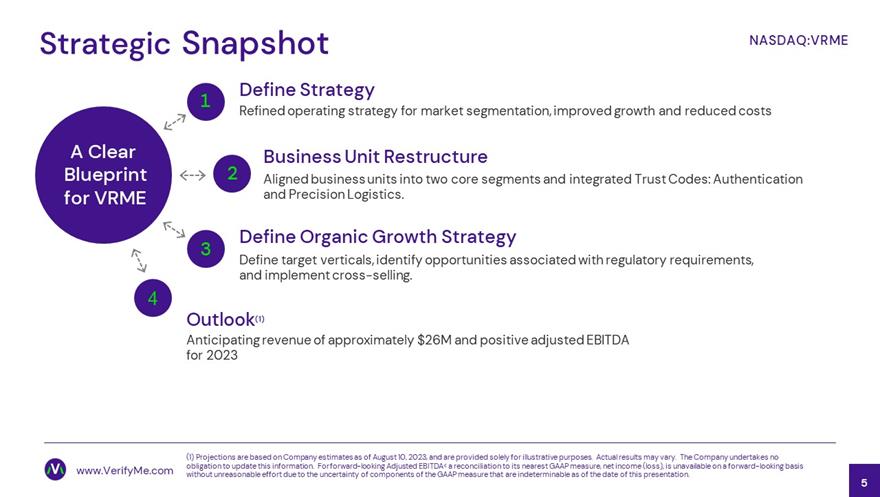
A Clear Blueprint for VRME Define Strategy 1 Refined operating strategy for market segmentation, improved growth and reduced costs Business Unit Restructure Aligned business units into two core segments and integrated Trust Codes: Authentication and Precision Logistics. Define Organic Growth Strategy Define target verticals, identify opportunities associated with regulatory requirements, and implement cross - selling. 3 2 Strategic Snapshot 5 www.VerifyMe.com NASDAQ:VRME 4 Outlook (1) Anticipating revenue of approximately $26M and positive adjusted EBITDA for 2023 (1) Projections are based on Company estimates as of August 10, 2023, and are provided solely for illustrative purposes. Act ual results may vary. The Company undertakes no obligation to update this information. For forward - looking Adjusted EBITDA< a reconciliation to its nearest GAAP measure, net i ncome (loss), is unavailable on a forward - looking basis without unreasonable effort due to the uncertainty of components of the GAAP measure that are indeterminable as of the date o f t his presentation.
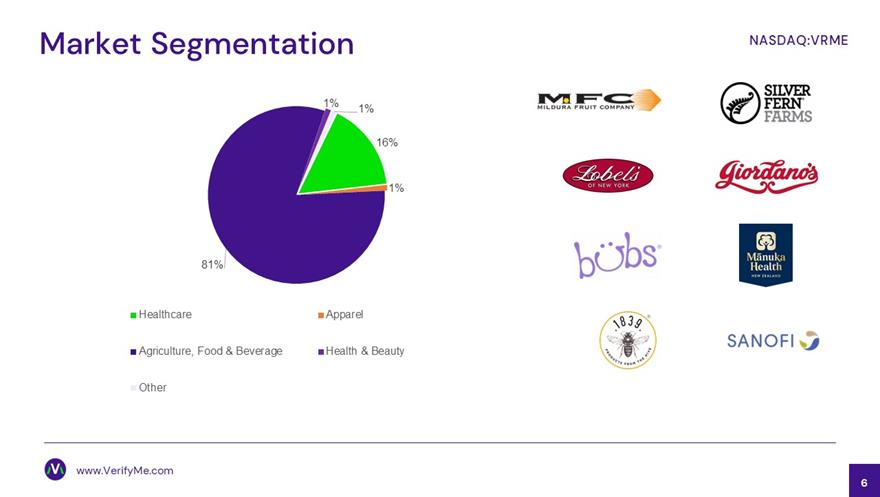
A Clear Blueprint for VRME Market Segmentation 16% 1% 81% 1% 1% Healthcare Apparel Agriculture, Food & Beverage Health & Beauty Other 6 www.VerifyMe.com NASDAQ:VRME
Financials www.VerifyMe.com NASDAQ:VRME – Q2 2023 Financial Highlights – SG&A Expenses – Balance Sheet 7
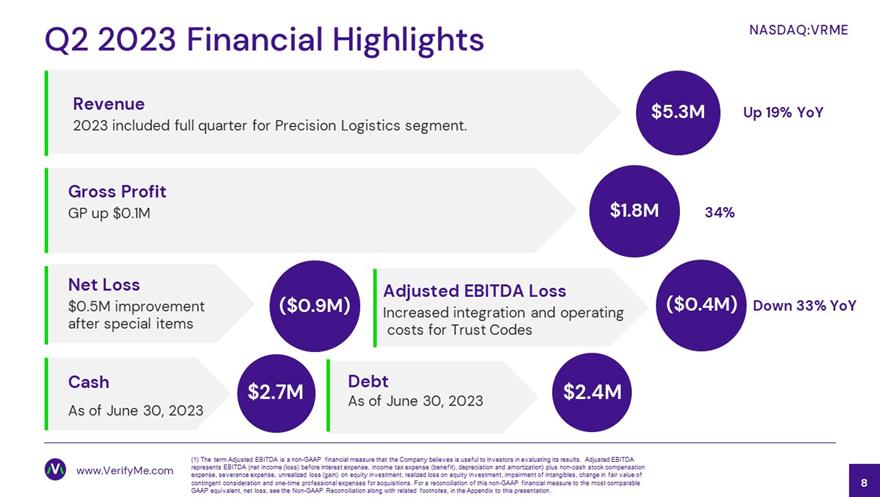
Q2 2023 Financial Highlights Revenue 2023 included full quarter for Precision Logistics segment. $5.3M Net Loss $0.5M improvement after special items Cash As of June 30, 2023 Debt As of June 30, 2023 ($0.4M) $2.7M $2.4M Gross Profit GP up $0.1M $1.8M Up 19% YoY Down 33% YoY 34% (1) The term Adjusted EBITDA is a non - GAAP financial measure that the Company believes is useful to investors in evaluating its results. Adjusted EBITDA represents EBITDA (net income (loss) before interest expense, income tax expense (benefit), depreciation and amortization) pl us non - cash stock compensation expense, severance expense, unrealized loss (gain) on equity investment, realized loss on equity realized loss on equity inve stm ent, impairment of intangibles, change in fair value of contingent consideration and one - time professional expenses for acquisitions. For a reconciliation of th is non - GAAP financial measure to the most comparable GAAP equivalent, net loss, see the Non - GAAP Reconciliation along with related footnotes, in the Appendix to this presentation. NASDAQ:VRME 8 www.VerifyMe.com ($0.9M) ($0.4M) Adjusted EBITDA Loss Increased integration and operating costs for Trust Codes
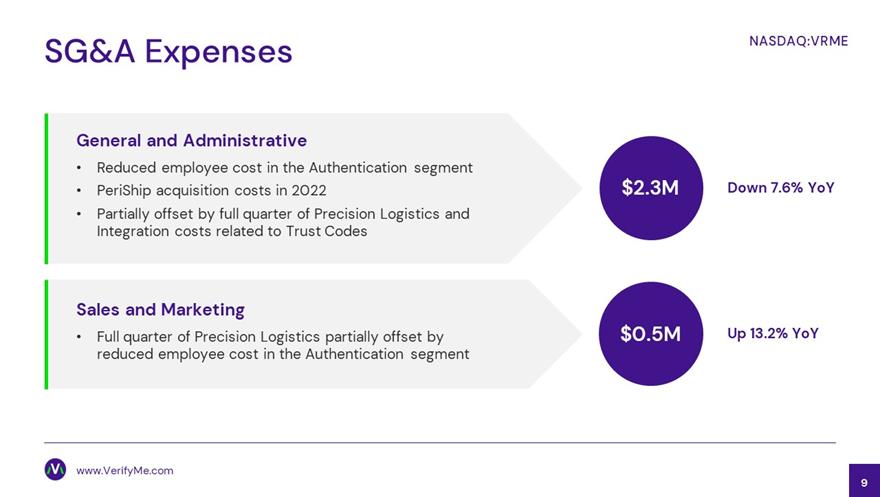
SG&A Expenses NASDAQ:VRME 9 www.VerifyMe.com General and Administrative • Reduced employee cost in the Authentication segment • PeriShip acquisition costs in 2022 • Partially offset by full quarter of Precision Logistics and Integration costs related to Trust Codes $2.3M $0.5M Down 7.6% YoY Up 13.2% YoY Sales and Marketing • Full quarter of Precision Logistics partially offset by reduced employee cost in the Authentication segment
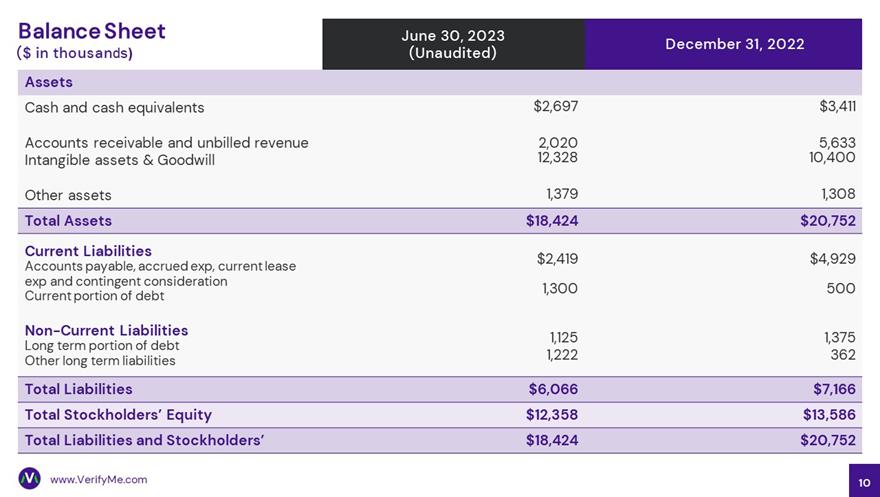
June 30, 2023 (Unaudited) December 31, 2022 Assets Cash and cash equivalents $2,697 $3,411 Accounts receivable and unbilled revenue Intangible assets & Goodwill 2,020 12,328 5,633 10,400 Other assets 1,379 1,308 Total Assets $18,424 $20,752 Current Liabilities Accounts payable, accrued exp, current lease exp and contingent consideration Current portion of debt $2,419 1,300 $4,929 500 Non - Current Liabilities Long term portion of debt Other long term liabilities 1,125 1,222 1,375 362 Total Liabilities $6,066 $7,166 Total Stockholders’ Equity $12,358 $13,586 Total Liabilities and Stockholders’ $18,424 $20,752 Balance Sheet ($ in thousan ds ) www.VerifyMe.com 10

11 Q & A 11 NASDAQ:VRME www.VerifyMe.com Confidential Property of VerifyMe
12 www.VerifyMe.com Confidential Property of VerifyMe NASDAQ:VRME Appendix
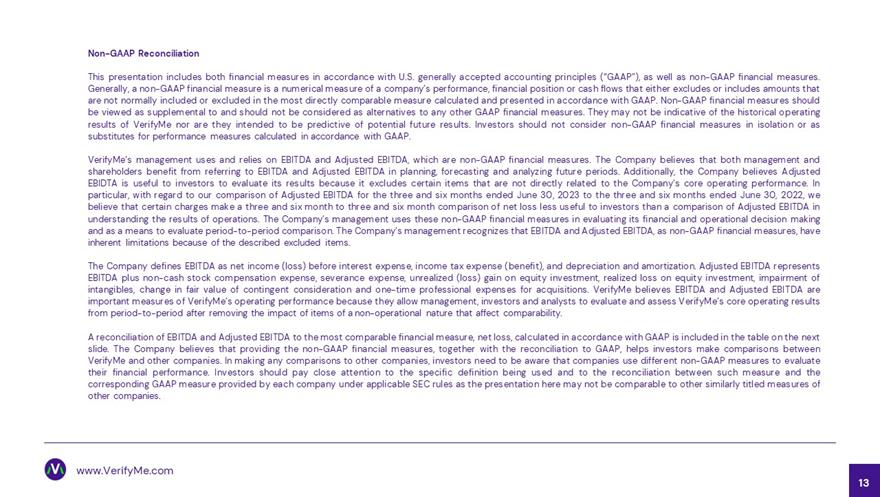
13 www.VerifyMe.com Non - GAAP Reconciliation This presentation includes both financial measures in accordance with U . S . generally accepted accounting principles (“GAAP”), as well as non - GAAP financial measures . Generally, a non - GAAP financial measure is a numerical measure of a company’s performance, financial position or cash flows that either excludes or includes amounts that are not normally included or excluded in the most directly comparable measure calculated and presented in accordance with GAAP . Non - GAAP financial measures should be viewed as supplemental to and should not be considered as alternatives to any other GAAP financial measures . They may not be indicative of the historical operating results of VerifyMe nor are they intended to be predictive of potential future results . Investors should not consider non - GAAP financial measures in isolation or as substitutes for performance measures calculated in accordance with GAAP . VerifyMe’s management uses and relies on EBITDA and Adjusted EBITDA, which are non - GAAP financial measures . The Company believes that both management and shareholders benefit from referring to EBITDA and Adjusted EBITDA in planning, forecasting and analyzing future periods . Additionally, the Company believes Adjusted EBIDTA is useful to investors to evaluate its results because it excludes certain items that are not directly related to the Company’s core operating performance . In particular, with regard to our comparison of Adjusted EBITDA for the three and six months ended June 30 , 2023 to the three and six months ended June 30 , 2022 , we believe that certain charges make a three and six month to three and six month comparison of net loss less useful to investors than a comparison of Adjusted EBITDA in understanding the results of operations . The Company’s management uses these non - GAAP financial measures in evaluating its financial and operational decision making and as a means to evaluate period - to - period comparison . The Company’s management recognizes that EBITDA and Adjusted EBITDA, as non - GAAP financial measures, have inherent limitations because of the described excluded items . The Company defines EBITDA as net income (loss) before interest expense, income tax expense (benefit), and depreciation and amortization . Adjusted EBITDA represents EBITDA plus non - cash stock compensation expense, severance expense, unrealized (loss) gain on equity investment, realized loss on equity investment, impairment of intangibles, change in fair value of contingent consideration and one - time professional expenses for acquisitions . VerifyMe believes EBITDA and Adjusted EBITDA are important measures of VerifyMe’s operating performance because they allow management, investors and analysts to evaluate and assess VerifyMe’s core operating results from period - to - period after removing the impact of items of a non - operational nature that affect comparability . A reconciliation of EBITDA and Adjusted EBITDA to the most comparable financial measure, net loss, calculated in accordance with GAAP is included in the table on the next slide . The Company believes that providing the non - GAAP financial measures, together with the reconciliation to GAAP, helps investors make comparisons between VerifyMe and other companies . In making any comparisons to other companies, investors need to be aware that companies use different non - GAAP measures to evaluate their financial performance . Investors should pay close attention to the specific definition being used and to the reconciliation between such measure and the corresponding GAAP measure provided by each company under applicable SEC rules as the presentation here may not be comparable to other similarly titled measures of other companies .
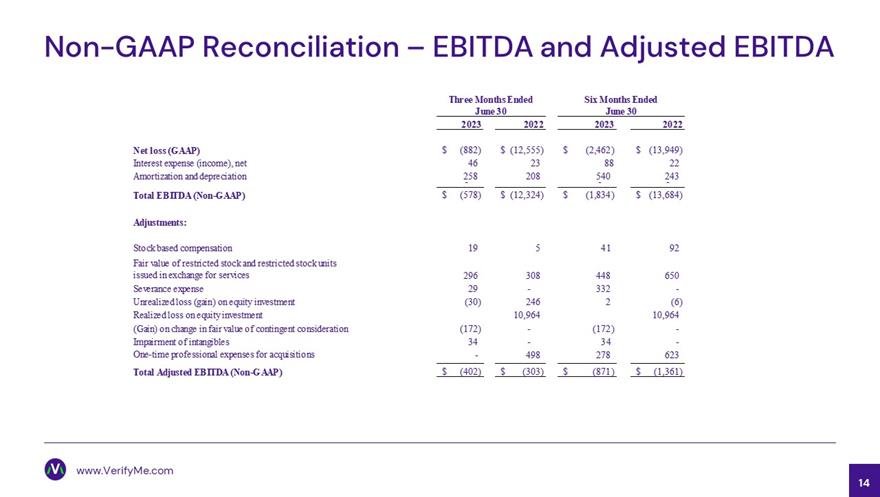
14 www.VerifyMe.com Non - GAAP Reconciliation – EBITDA and Adjusted EBITDA 2023 2022 2023 2022 Net loss (GAAP) (882)$ (12,555)$ (2,462)$ (13,949)$ Interest expense (income), net 46 23 88 22 Amortization and depreciation 258 208 540 243 - - - Total EBITDA (Non-GAAP) (578)$ (12,324)$ (1,834)$ (13,684)$ Adjustments: Stock based compensation 19 5 41 92 Fair value of restricted stock and restricted stock units issued in exchange for services 296 308 448 650 Severance expense 29 - 332 - Unrealized loss (gain) on equity investment (30) 246 2 (6) Realized loss on equity investment 10,964 10,964 (Gain) on change in fair value of contingent consideration (172) - (172) - Impairment of intangibles 34 - 34 - One-time professional expenses for acquisitions - 498 278 623 Total Adjusted EBITDA (Non-GAAP) (402)$ (303)$ (871)$ (1,361)$ Three Months Ended June 30 Six Months Ended June 30

Protect your brand. Grow your business. US Headquarters 801 International Parkway Fifth Floor Lake Mary, FL 32746 +1 585 736 9400 info@ verifyme.com 15
v3.23.2
Cover
|
Aug. 10, 2023 |
| Document Type |
8-K
|
| Amendment Flag |
false
|
| Document Period End Date |
Aug. 10, 2023
|
| Entity File Number |
001-39332
|
| Entity Registrant Name |
VerifyMe, Inc.
|
| Entity Central Index Key |
0001104038
|
| Entity Tax Identification Number |
23-3023677
|
| Entity Incorporation, State or Country Code |
NV
|
| Entity Address, Address Line One |
801 International Parkway
|
| Entity Address, Address Line Two |
Fifth Floor
|
| Entity Address, City or Town |
Lake Mary
|
| Entity Address, State or Province |
FL
|
| Entity Address, Postal Zip Code |
32746
|
| City Area Code |
(585)
|
| Local Phone Number |
736-9400
|
| Written Communications |
false
|
| Soliciting Material |
false
|
| Pre-commencement Tender Offer |
false
|
| Pre-commencement Issuer Tender Offer |
false
|
| Entity Emerging Growth Company |
false
|
| Common Stock, par value $0.001 per share |
|
| Title of 12(b) Security |
Common Stock, par value $0.001 per share
|
| Trading Symbol |
VRME
|
| Security Exchange Name |
NASDAQ
|
| Warrants to Purchase Common Stock |
|
| Title of 12(b) Security |
Warrants to Purchase Common Stock
|
| Trading Symbol |
VRMEW
|
| Security Exchange Name |
NASDAQ
|
| X |
- DefinitionBoolean flag that is true when the XBRL content amends previously-filed or accepted submission.
| Name: |
dei_AmendmentFlag |
| Namespace Prefix: |
dei_ |
| Data Type: |
xbrli:booleanItemType |
| Balance Type: |
na |
| Period Type: |
duration |
|
| X |
- DefinitionFor the EDGAR submission types of Form 8-K: the date of the report, the date of the earliest event reported; for the EDGAR submission types of Form N-1A: the filing date; for all other submission types: the end of the reporting or transition period. The format of the date is YYYY-MM-DD.
| Name: |
dei_DocumentPeriodEndDate |
| Namespace Prefix: |
dei_ |
| Data Type: |
xbrli:dateItemType |
| Balance Type: |
na |
| Period Type: |
duration |
|
| X |
- DefinitionThe type of document being provided (such as 10-K, 10-Q, 485BPOS, etc). The document type is limited to the same value as the supporting SEC submission type, or the word 'Other'.
| Name: |
dei_DocumentType |
| Namespace Prefix: |
dei_ |
| Data Type: |
dei:submissionTypeItemType |
| Balance Type: |
na |
| Period Type: |
duration |
|
| X |
- DefinitionAddress Line 1 such as Attn, Building Name, Street Name
| Name: |
dei_EntityAddressAddressLine1 |
| Namespace Prefix: |
dei_ |
| Data Type: |
xbrli:normalizedStringItemType |
| Balance Type: |
na |
| Period Type: |
duration |
|
| X |
- DefinitionAddress Line 2 such as Street or Suite number
| Name: |
dei_EntityAddressAddressLine2 |
| Namespace Prefix: |
dei_ |
| Data Type: |
xbrli:normalizedStringItemType |
| Balance Type: |
na |
| Period Type: |
duration |
|
| X |
- Definition
+ References
+ Details
| Name: |
dei_EntityAddressCityOrTown |
| Namespace Prefix: |
dei_ |
| Data Type: |
xbrli:normalizedStringItemType |
| Balance Type: |
na |
| Period Type: |
duration |
|
| X |
- DefinitionCode for the postal or zip code
| Name: |
dei_EntityAddressPostalZipCode |
| Namespace Prefix: |
dei_ |
| Data Type: |
xbrli:normalizedStringItemType |
| Balance Type: |
na |
| Period Type: |
duration |
|
| X |
- DefinitionName of the state or province.
| Name: |
dei_EntityAddressStateOrProvince |
| Namespace Prefix: |
dei_ |
| Data Type: |
dei:stateOrProvinceItemType |
| Balance Type: |
na |
| Period Type: |
duration |
|
| X |
- DefinitionA unique 10-digit SEC-issued value to identify entities that have filed disclosures with the SEC. It is commonly abbreviated as CIK. Reference 1: http://www.xbrl.org/2003/role/presentationRef
-Publisher SEC
-Name Exchange Act
-Number 240
-Section 12
-Subsection b-2
| Name: |
dei_EntityCentralIndexKey |
| Namespace Prefix: |
dei_ |
| Data Type: |
dei:centralIndexKeyItemType |
| Balance Type: |
na |
| Period Type: |
duration |
|
| X |
- DefinitionIndicate if registrant meets the emerging growth company criteria. Reference 1: http://www.xbrl.org/2003/role/presentationRef
-Publisher SEC
-Name Exchange Act
-Number 240
-Section 12
-Subsection b-2
| Name: |
dei_EntityEmergingGrowthCompany |
| Namespace Prefix: |
dei_ |
| Data Type: |
xbrli:booleanItemType |
| Balance Type: |
na |
| Period Type: |
duration |
|
| X |
- DefinitionCommission file number. The field allows up to 17 characters. The prefix may contain 1-3 digits, the sequence number may contain 1-8 digits, the optional suffix may contain 1-4 characters, and the fields are separated with a hyphen.
| Name: |
dei_EntityFileNumber |
| Namespace Prefix: |
dei_ |
| Data Type: |
dei:fileNumberItemType |
| Balance Type: |
na |
| Period Type: |
duration |
|
| X |
- DefinitionTwo-character EDGAR code representing the state or country of incorporation.
| Name: |
dei_EntityIncorporationStateCountryCode |
| Namespace Prefix: |
dei_ |
| Data Type: |
dei:edgarStateCountryItemType |
| Balance Type: |
na |
| Period Type: |
duration |
|
| X |
- DefinitionThe exact name of the entity filing the report as specified in its charter, which is required by forms filed with the SEC. Reference 1: http://www.xbrl.org/2003/role/presentationRef
-Publisher SEC
-Name Exchange Act
-Number 240
-Section 12
-Subsection b-2
| Name: |
dei_EntityRegistrantName |
| Namespace Prefix: |
dei_ |
| Data Type: |
xbrli:normalizedStringItemType |
| Balance Type: |
na |
| Period Type: |
duration |
|
| X |
- DefinitionThe Tax Identification Number (TIN), also known as an Employer Identification Number (EIN), is a unique 9-digit value assigned by the IRS. Reference 1: http://www.xbrl.org/2003/role/presentationRef
-Publisher SEC
-Name Exchange Act
-Number 240
-Section 12
-Subsection b-2
| Name: |
dei_EntityTaxIdentificationNumber |
| Namespace Prefix: |
dei_ |
| Data Type: |
dei:employerIdItemType |
| Balance Type: |
na |
| Period Type: |
duration |
|
| X |
- DefinitionLocal phone number for entity.
| Name: |
dei_LocalPhoneNumber |
| Namespace Prefix: |
dei_ |
| Data Type: |
xbrli:normalizedStringItemType |
| Balance Type: |
na |
| Period Type: |
duration |
|
| X |
- DefinitionBoolean flag that is true when the Form 8-K filing is intended to satisfy the filing obligation of the registrant as pre-commencement communications pursuant to Rule 13e-4(c) under the Exchange Act. Reference 1: http://www.xbrl.org/2003/role/presentationRef
-Publisher SEC
-Name Exchange Act
-Number 240
-Section 13e
-Subsection 4c
| Name: |
dei_PreCommencementIssuerTenderOffer |
| Namespace Prefix: |
dei_ |
| Data Type: |
xbrli:booleanItemType |
| Balance Type: |
na |
| Period Type: |
duration |
|
| X |
- DefinitionBoolean flag that is true when the Form 8-K filing is intended to satisfy the filing obligation of the registrant as pre-commencement communications pursuant to Rule 14d-2(b) under the Exchange Act. Reference 1: http://www.xbrl.org/2003/role/presentationRef
-Publisher SEC
-Name Exchange Act
-Number 240
-Section 14d
-Subsection 2b
| Name: |
dei_PreCommencementTenderOffer |
| Namespace Prefix: |
dei_ |
| Data Type: |
xbrli:booleanItemType |
| Balance Type: |
na |
| Period Type: |
duration |
|
| X |
- DefinitionTitle of a 12(b) registered security. Reference 1: http://www.xbrl.org/2003/role/presentationRef
-Publisher SEC
-Name Exchange Act
-Number 240
-Section 12
-Subsection b
| Name: |
dei_Security12bTitle |
| Namespace Prefix: |
dei_ |
| Data Type: |
dei:securityTitleItemType |
| Balance Type: |
na |
| Period Type: |
duration |
|
| X |
- DefinitionName of the Exchange on which a security is registered. Reference 1: http://www.xbrl.org/2003/role/presentationRef
-Publisher SEC
-Name Exchange Act
-Number 240
-Section 12
-Subsection d1-1
| Name: |
dei_SecurityExchangeName |
| Namespace Prefix: |
dei_ |
| Data Type: |
dei:edgarExchangeCodeItemType |
| Balance Type: |
na |
| Period Type: |
duration |
|
| X |
- DefinitionBoolean flag that is true when the Form 8-K filing is intended to satisfy the filing obligation of the registrant as soliciting material pursuant to Rule 14a-12 under the Exchange Act. Reference 1: http://www.xbrl.org/2003/role/presentationRef
-Publisher SEC
-Name Exchange Act
-Section 14a
-Number 240
-Subsection 12
| Name: |
dei_SolicitingMaterial |
| Namespace Prefix: |
dei_ |
| Data Type: |
xbrli:booleanItemType |
| Balance Type: |
na |
| Period Type: |
duration |
|
| X |
- DefinitionTrading symbol of an instrument as listed on an exchange.
| Name: |
dei_TradingSymbol |
| Namespace Prefix: |
dei_ |
| Data Type: |
dei:tradingSymbolItemType |
| Balance Type: |
na |
| Period Type: |
duration |
|
| X |
- DefinitionBoolean flag that is true when the Form 8-K filing is intended to satisfy the filing obligation of the registrant as written communications pursuant to Rule 425 under the Securities Act. Reference 1: http://www.xbrl.org/2003/role/presentationRef
-Publisher SEC
-Name Securities Act
-Number 230
-Section 425
| Name: |
dei_WrittenCommunications |
| Namespace Prefix: |
dei_ |
| Data Type: |
xbrli:booleanItemType |
| Balance Type: |
na |
| Period Type: |
duration |
|
| X |
- Details
| Name: |
us-gaap_StatementClassOfStockAxis=VRME_CommonStockParValue0.001PerShareMember |
| Namespace Prefix: |
|
| Data Type: |
na |
| Balance Type: |
|
| Period Type: |
|
|
| X |
- Details
| Name: |
us-gaap_StatementClassOfStockAxis=VRME_WarrantsToPurchaseCommonStockMember |
| Namespace Prefix: |
|
| Data Type: |
na |
| Balance Type: |
|
| Period Type: |
|
|
VerifyMe (NASDAQ:VRME)
Historical Stock Chart
From Apr 2024 to May 2024

VerifyMe (NASDAQ:VRME)
Historical Stock Chart
From May 2023 to May 2024
